Article

Improving Commercial Motor Bike Rim Disc Hardness Using a Continuous-Wave Infrared Fibre Laser

by
Juan Ignacio Ahuir-Torres
1,*,
Andre D. L. Batako
1,
Nugzar Khidasheli
2,
Nana Bakradze
2 and
Guanyu Zhu
3
1
General Engineering Research Institute, Faculty of Engineering and Technology, Liverpool John Moores University, Byrom Street, Liverpool L3 3AF, UK
2
Department of Production Technologies of Mechanical Engineering, Georgian Technical University, 77 Kostava srt., Tbilisi 0175, Georgia
3
School of Electronic Information and Electrical Engineering, Chongqing University of Arts and Sciences, Chongqing 402159, China
*
Author to whom correspondence should be addressed.
J. Manuf. Mater. Process. 2024, 8(1), 18; https://doi.org/10.3390/jmmp8010018
Submission received: 20 December 2023 / Revised: 14 January 2024 / Accepted: 22 January 2024 / Published: 24 January 2024
(This article belongs to the Topic Laser Processing of Metallic Materials)

Abstract

:
This study is focused on examining the feasibility of applying laser hardening to a commercial metallic bike rim, employing a CW IR fibre laser. The research comprises two main phases. The first phase involves an assessment of the impact of laser parameters on the metallic microstructure, while the second phase involves the actual laser hardening of the bike rim. A comprehensive evaluation encompassing hardness measurements, optical microscopy, and scanning electron microscopy was conducted on the samples. The microstructure type can be manipulated by skilfully adjusting the laser parameters, allowing for the creation of various microstructure variants within the laser-hardened zone for specific laser conditions. In this regard, multiple microstructure types were observed. The hardness of the laser-processed zones exhibited variations corresponding to the specific microstructure. Notably, the molten zone (MZ) and the second heat-affected zone (HAZ II) exhibited the highest levels of hardness. Furthermore, it was observed that a scan overlap of ≥ 75% led to an augmentation in hardness. This study sheds light on the intricate interplay between laser parameters, microstructure, and resultant hardness in the context of laser hardening of metallic materials.

1. Introduction

The process of hardening is a potent technique employed to enhance the mechanical properties of metallic materials. The hardness of these materials significantly influences other vital attributes such as wear resistance and impact resilience [1,2,3,4,5,6,7,8,9,10,11]. Diverse methods are available for performing hardening, including peening [9], laser treatment [3,4], and strain application [12]. Among these techniques, laser hardening has gained prominence due to its commendable characteristics like environmental friendliness, automation, precision, and speed [3,13].
The elevation of material hardness through laser treatment is accomplished by inducing microstructural changes using thermal processes (such as heating and rapid cooling) [3,6]. These thermal transformations are initiated by converting laser energy into temperature. Initially, the laser radiation stimulates the valence electrons of the metal, causing them to transition to higher-energy orbitals. Subsequently, as these electrons return to lower energy states, they collide with the atomic sublayers, leading to an elevation in material temperature [14,15].
Following this, the region where lasers interact experiences rapid cooling, facilitated by the efficient heat diffusion into the bulk material. This swift cooling enables the preservation of the microstructure formed during laser treatment [2]. These thermal processes define the resultant microstructure generated through laser treatment. Factors such as material recrystallization, elemental segregation, and thermal stress contribute to shaping the microstructure of metallic alloys. The heat and cooling rate further govern these features. Skilfully selecting the appropriate combination of laser parameters, tailored to the properties of the metallic material, allows for the deliberate design of the microstructure [16].
Different types of lasers have been utilized for the hardening of various metallic alloys, spanning from aluminium alloys to cast iron, titanium alloys, and stainless steel. Initially, carbon dioxide (CO2) lasers in continuous-wave (CW) mode were preferred due to their high-power output exceeding 2 kW [1]. However, CO2 lasers are limited by their lower absorptivity by certain metallic materials like aluminium alloys, stainless steel, and cast iron, stemming from the wavelengths they emit (around 10,600 nm and 9600 nm). Parker [17] compared the CO2 laser to high-power diode laser (900 nm wavelength) on several metallic alloys, such as cast iron and aluminium alloys. The high-power diode laser showed better characteristics on all types of alloys due to its higher absorptivity at red and infrared light. This study, however, ignored other laser parameters. In contrast, infrared (IR) lasers with wavelengths ranging from 800 nm to 1070 nm have gained popularity as they offer improved absorptivity for materials like titanium, cast iron, and stainless steel [18,19]. Lui and Previtali [18] evaluated the application of the diode laser (900 nm) to harden the cast iron, getting excellent results. Albeit, this work was focused only on certain cast iron that has limited applications. The hardening of the metallic material was due to the microstructural change. Although green lasers (532 nm) have been employed, they encounter similar absorptivity challenges as CO2 lasers. Ganeev compared these lasers (CO2 and green lasers) to cast iron. They saw that the CO2 laser produced a better microstructure [20]. Muthukmaran and Dinesh Babu [11] reviewed the use of several laser types (e.g., CO2, Nd:Yag, fibre, and high-power diode) on the hardening of various steel types (e.g., 15CrNi6 steel, 50CrV5, AISI 5135 steel, and 24 CrMo4 steel). The laser parameters (laser beam diameter, power, and scan speed) were essential factors in the laser hardening and microstructural transformation. The fibre lasers were found to be the lasers that can provide a wider range of laser parameter possibilities. Although this paper is a great review, the material of the studies was known and was not obtained from commercial applications.
The utilization of different laser modes, both pulsed and CW, has yielded varying results in the process of laser hardening of metallic materials. Ultra-short-pulsed lasers (picosecond and femtosecond) are unsuitable for this purpose as they tend to cause material evaporation without significant microstructural changes [21]. Nanosecond pulsed lasers are viable but only result in shallow hardening depths, typically in the range of tens of micrometres [13,20,21]. Millisecond pulsed lasers show promise as an alternative to CW lasers, offering comparable hardening with lower energy input. However, their hardening depth remains constrained by the pulse duration. Maharjan et al. [21] analysed and compared various pulsed lasers (e.g., fs, ps, ns, and ms) with continuous-wave lasers for the hardening of 50CrMo4 steel. Although ms pulsed laser showed good results, the hardened zone depth was limited by the pulse length. This study was focused on non-commercial steel. In contrast, the hardening depth achievable with CW lasers can be set by adjusting parameters such as velocity, laser beam diameter, and power [7,19]. Consequently, CW lasers continue to be the primary tool for laser hardening.
Although a variety of lasers (CO2, fibre, Nd:YAG, and diode) have been employed in laser hardening, the usage of fibre lasers is on the rise due to their advantageous characteristics, including cost-effectiveness, flexibility, and moderate power output [11,22].
As previously discussed, the laser-generated microstructure is tightly controlled by laser parameters, enabling the tailored design of material hardness. In the context of the IR (1064 nm) fibre laser, the laser beam diameter, scan rate, and power play pivotal roles in determining microstructure types [3]. These parameters directly influence the dimensions of the hardened zone, with laser beam diameter governing zone width and scan rate primarily impacting zone depth [2,23]. Given thermal diffusion and element segregation, distinct microstructures can coexist within a single laser-hardened zone. The temperature variation across the processed zone, driven by zone depth, triggers changes in alloy element diffusion coefficients, leading to the formation of diverse microstructures [5]. Thus, comprehending the impact of laser parameters on material microstructure is indispensable for successful laser hardening. Another critical parameter is laser scan overlapping, which can yield benefits such as enhanced microstructure hardness [18] or drawbacks like crack formation [4,24].
Despite the extensive literature on laser hardening across various alloys using different laser devices, studies focusing on the laser hardening of unknown commercial metallic components are rare. On the other hand, the application of this technique in commercial materials such as bike rims is a scientific gap. Consequently, this study investigates the laser hardening of commercial metallic bike rims. Leveraging the capabilities of the IR (1064 nm) CW fibre laser, we undertook this investigation due to its favourable attributes. The study comprises two distinct stages: first, evaluating the influence of laser parameters on the microstructure of bike rims, and second, analysing the hardened material itself. Additionally, this second stage delves into the influence of scan overlapping on microstructure and material hardness.

2. Experimental Setup

2.1. Materials and Pre-Treatment

The specimens used in this study were segments of the metallic component from a commercially available bike rim of unknown alloy composition. The size of the samples was 50 mm × 50 mm with a 10 mm thickness. Before subjecting them to the hardening process, a metallographic analysis was conducted to assess their microstructure. This initial evaluation serves as the basis for subsequent analysis. The chemical composition of the specimens was determined through energy-dispersive spectroscopy (EDS), which will be further elaborated upon later. To ensure optimal conditions for laser processing, all specimens were polished to a P1200 finish, achieving an average surface roughness of approximately 120 nm. This refined surface texture is conducive to effective laser treatment. Although a certain roughness can encourage the absorption of laser radiation, excessive relief can cause the scattering of the laser outside the treated area. This increase in the effective laser-treated area decreases the energy density. The laser-treated zone shape can be impoverished with roughness. On the other hand, smooth surfaces commonly increase the reflectivity of the surface to laser radiation, reducing the effective energy density. Thus, the highest laser radiation absorption is achieved at a determined roughness [25].

2.2. Laser Equipment and Processing

The employed laser system consisted of an infrared (IR) fibre laser (JK400FL, GSI Group, Cosford Lane, UK) with a focal lens of 125 mm (Thorlabs Inc., Newton, NJ, USA) and a three-axis automatic table (Aerotech Ltd., Pittsburgh, PA, USA). This laser unit operated at a wavelength (λ) of 1065 ± 5 nm and exhibited a near-TEM00 mode with a beam quality factor of M2 = 1.1. It offers the flexibility of both continuous- wave (CW) and pulsed modes, with pulse lengths ranging from microseconds to milliseconds. The laser polarization was random, and its maximum power output was approximately 300 W. The initial diameter of the raw laser beam (DR) measured 6.0 mm, while the diameter of the focused laser beam at a focal length of 125 mm (denoted as do) was calculated to be 32.0 μm using Equation (1) [26,27].
d o = 4 F L λ M 2 π D R
The laser processing of the samples was conducted in two steps, where the laser worked in CW mode in both steps. First, straight-line laser scans were produced on the polished bike rim at several scan speeds (SS), various defocused laser beam diameters (DZ), and 200 W power (P). SS was from 1 mm/s to 40 mm/s, and DZ was from 0.5 mm to 3.0 mm. The laser beam was static while the sample was displaced with the three-axis automatic table, which was used to set SS. The laser scan distance was the same for all specimens: 30 mm. DZ was set by the mean of the distance from the focal point (Z) and was estimated using Equation (2) [28,29].
D Z = d o × 1 + R L Z
where RL is the Rayleigh length that was calculated using Equation (3) [29,30].
R L = π × d o 2 4 × M 2 × λ
The second step involved the laser hardening of specific areas of the bike rim using overlapping laser-scanned tracks (O), ranging from 0% to 75%. The parameters for the laser scan tracks (SS and DZ) were determined in the initial step through the selection of a straight-line laser scanning technique, which generated tracks exhibiting optimal characteristics (molten zone, maximum depth, absence of cracks, and ideally, width). The attributes of individual laser tracks were evaluated through subsequent metallographic analysis, which will be detailed later. The spacing between individual laser tracks (L) required for implementing the overlapping (O) was calculated using the track width (W) determined in the preliminary step, along with Equation (4) [31].
L = W O × W 100
The width and length of the laser-treated zones were the same for all samples, being 5 mm and 30 mm, respectively. The schematic drawing of the first (Figure 1a) and second (Figure 1b) step processes can be seen in Figure 1.
The laser processing was conducted in an ambient atmosphere. The chosen laser parameters for both steps of this study are summarized in Table 1.

2.3. Characterization and Analysis Techniques

The surface topography of the samples was examined using an Olympus BH2-UMA (Olympus corporation, Tokyo, Japan) optical light microscope, which was equipped with DinoCapture 2.0 software. To analyse the microstructure of the samples, a metallographic process involving the cross-section of the samples was performed. This process began with several polishing steps. Initially, the cross-sections underwent surface grinding using silicon carbide abrasive papers (P250, P400, and P1200). Subsequently, the cross-sections were polished using polycrystalline diamond pastes, initially with a particle size of 3 μm followed by 1 μm. The final step involved mirror-like polishing of the cross-sections using colloidal silica gel with a particle size of 40 nm at a 50% volume concentration in distilled water. Prior to the etching process, the samples were meticulously cleaned using a commercial detergent, water, distilled water, and finally isopropanol, and then dried with a dryer. All grinding and polishing materials were provided by Struers Ltd. (Champigny sur Marne, France).
To reveal the full extent of the laser processing depth, the cross-section samples were first etched with nital (5% nitric acid and 95% ethanol in volume) for 1 h. Following this, an etching solution consisting of 50% distilled water, 33% hydrochloric acid, and 17% nitric acid in volume was applied for 30 s to visualize the microstructure of the samples [32]. All chemical reagents were supplied by Merck and Sigma-Aldrich. It is noted that other etching dissolutions were discarded owing to the bike rim was magnetic and exhibited red colouration. This indicated that this metallic alloy was constructed of stainless steel, iron, or steel kindred.
The microstructures of the samples were examined using the same optical light microscope used for surface analysis, as well as a scanning electron microscope (SEM) (SEM variable vacuum Inspect S model, Thermofisher). The SEM analysis was conducted at a potential acceleration of 20 kV, a current tension of 120 pA, a spot size of 4 μm, and using both secondary and backscattered electrons.

2.4. Hardness Testing

The hardness of both base material and laser-hardened samples, with laser track overlap, was assessed using a Duramin indentator (Struer). Vickers hardness measurements were performed, with a 10-s contact time, a 1 kg load, and a 10-s load time. The indentations were executed from the sample surface up to a distance of 0.1 mm from the laser processing zone, maintaining a testing distance of 0.1 mm between indentations.

3. Results and Discussion

3.1. Single Tracks

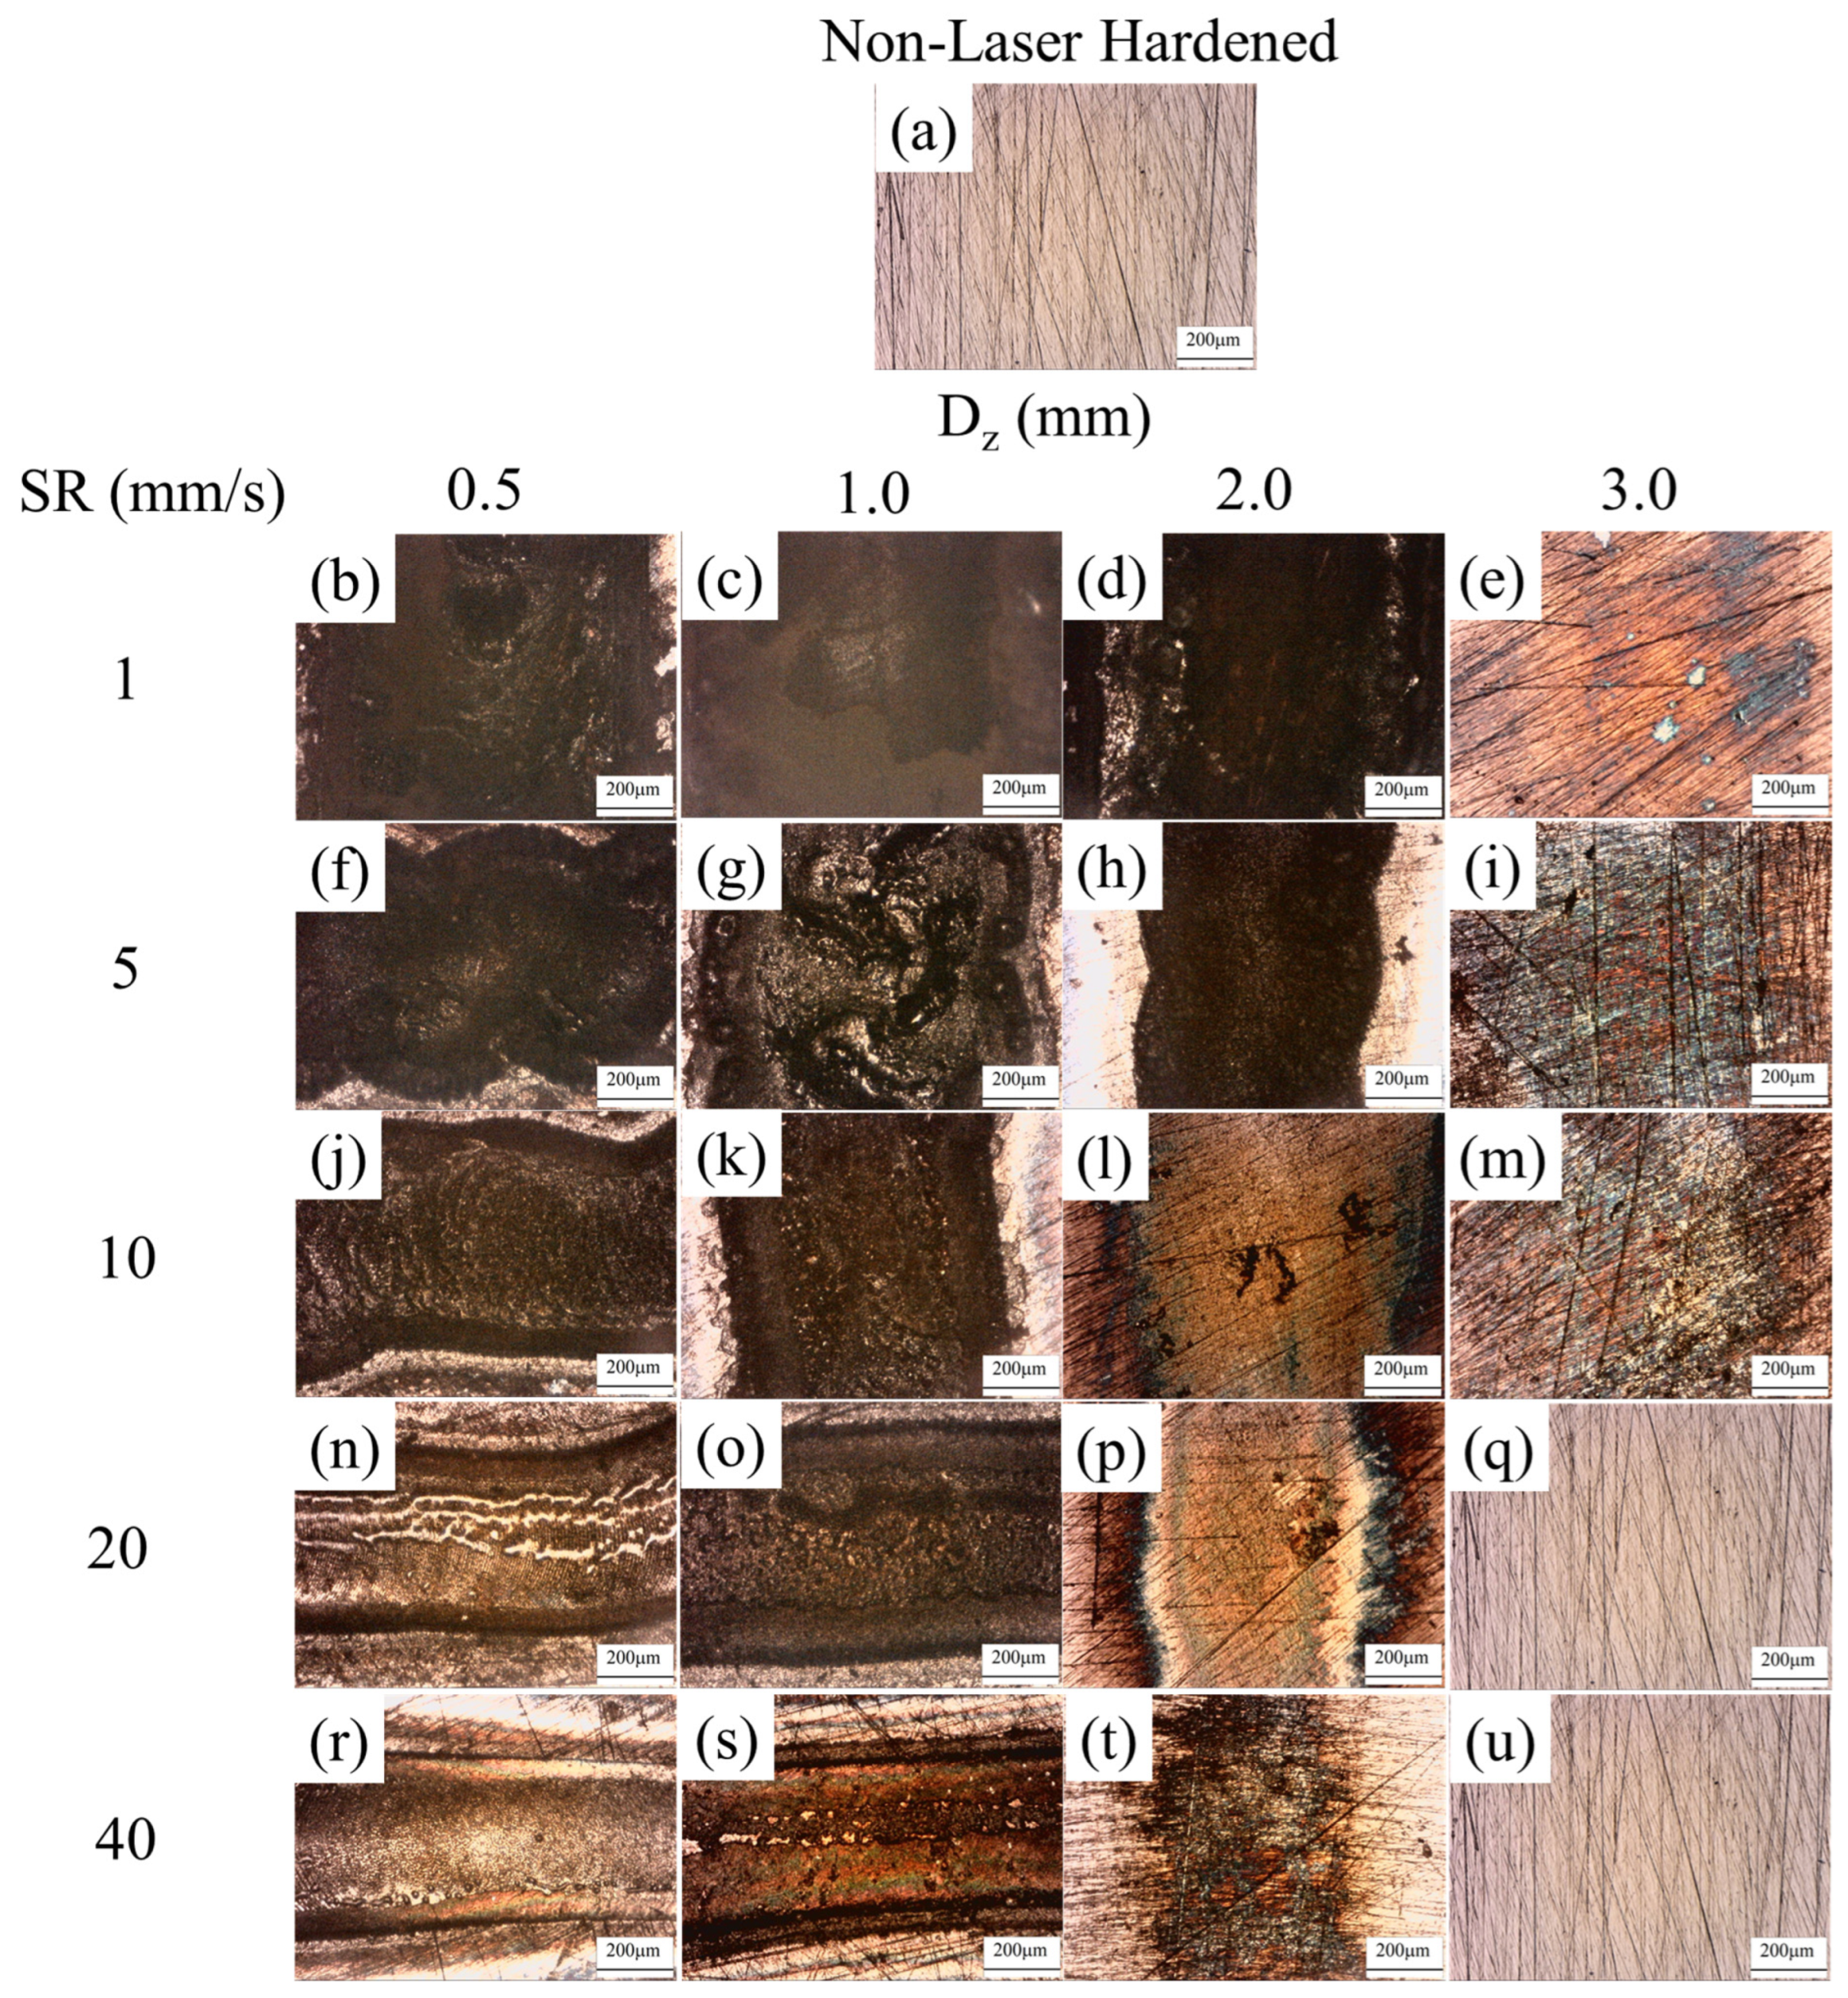
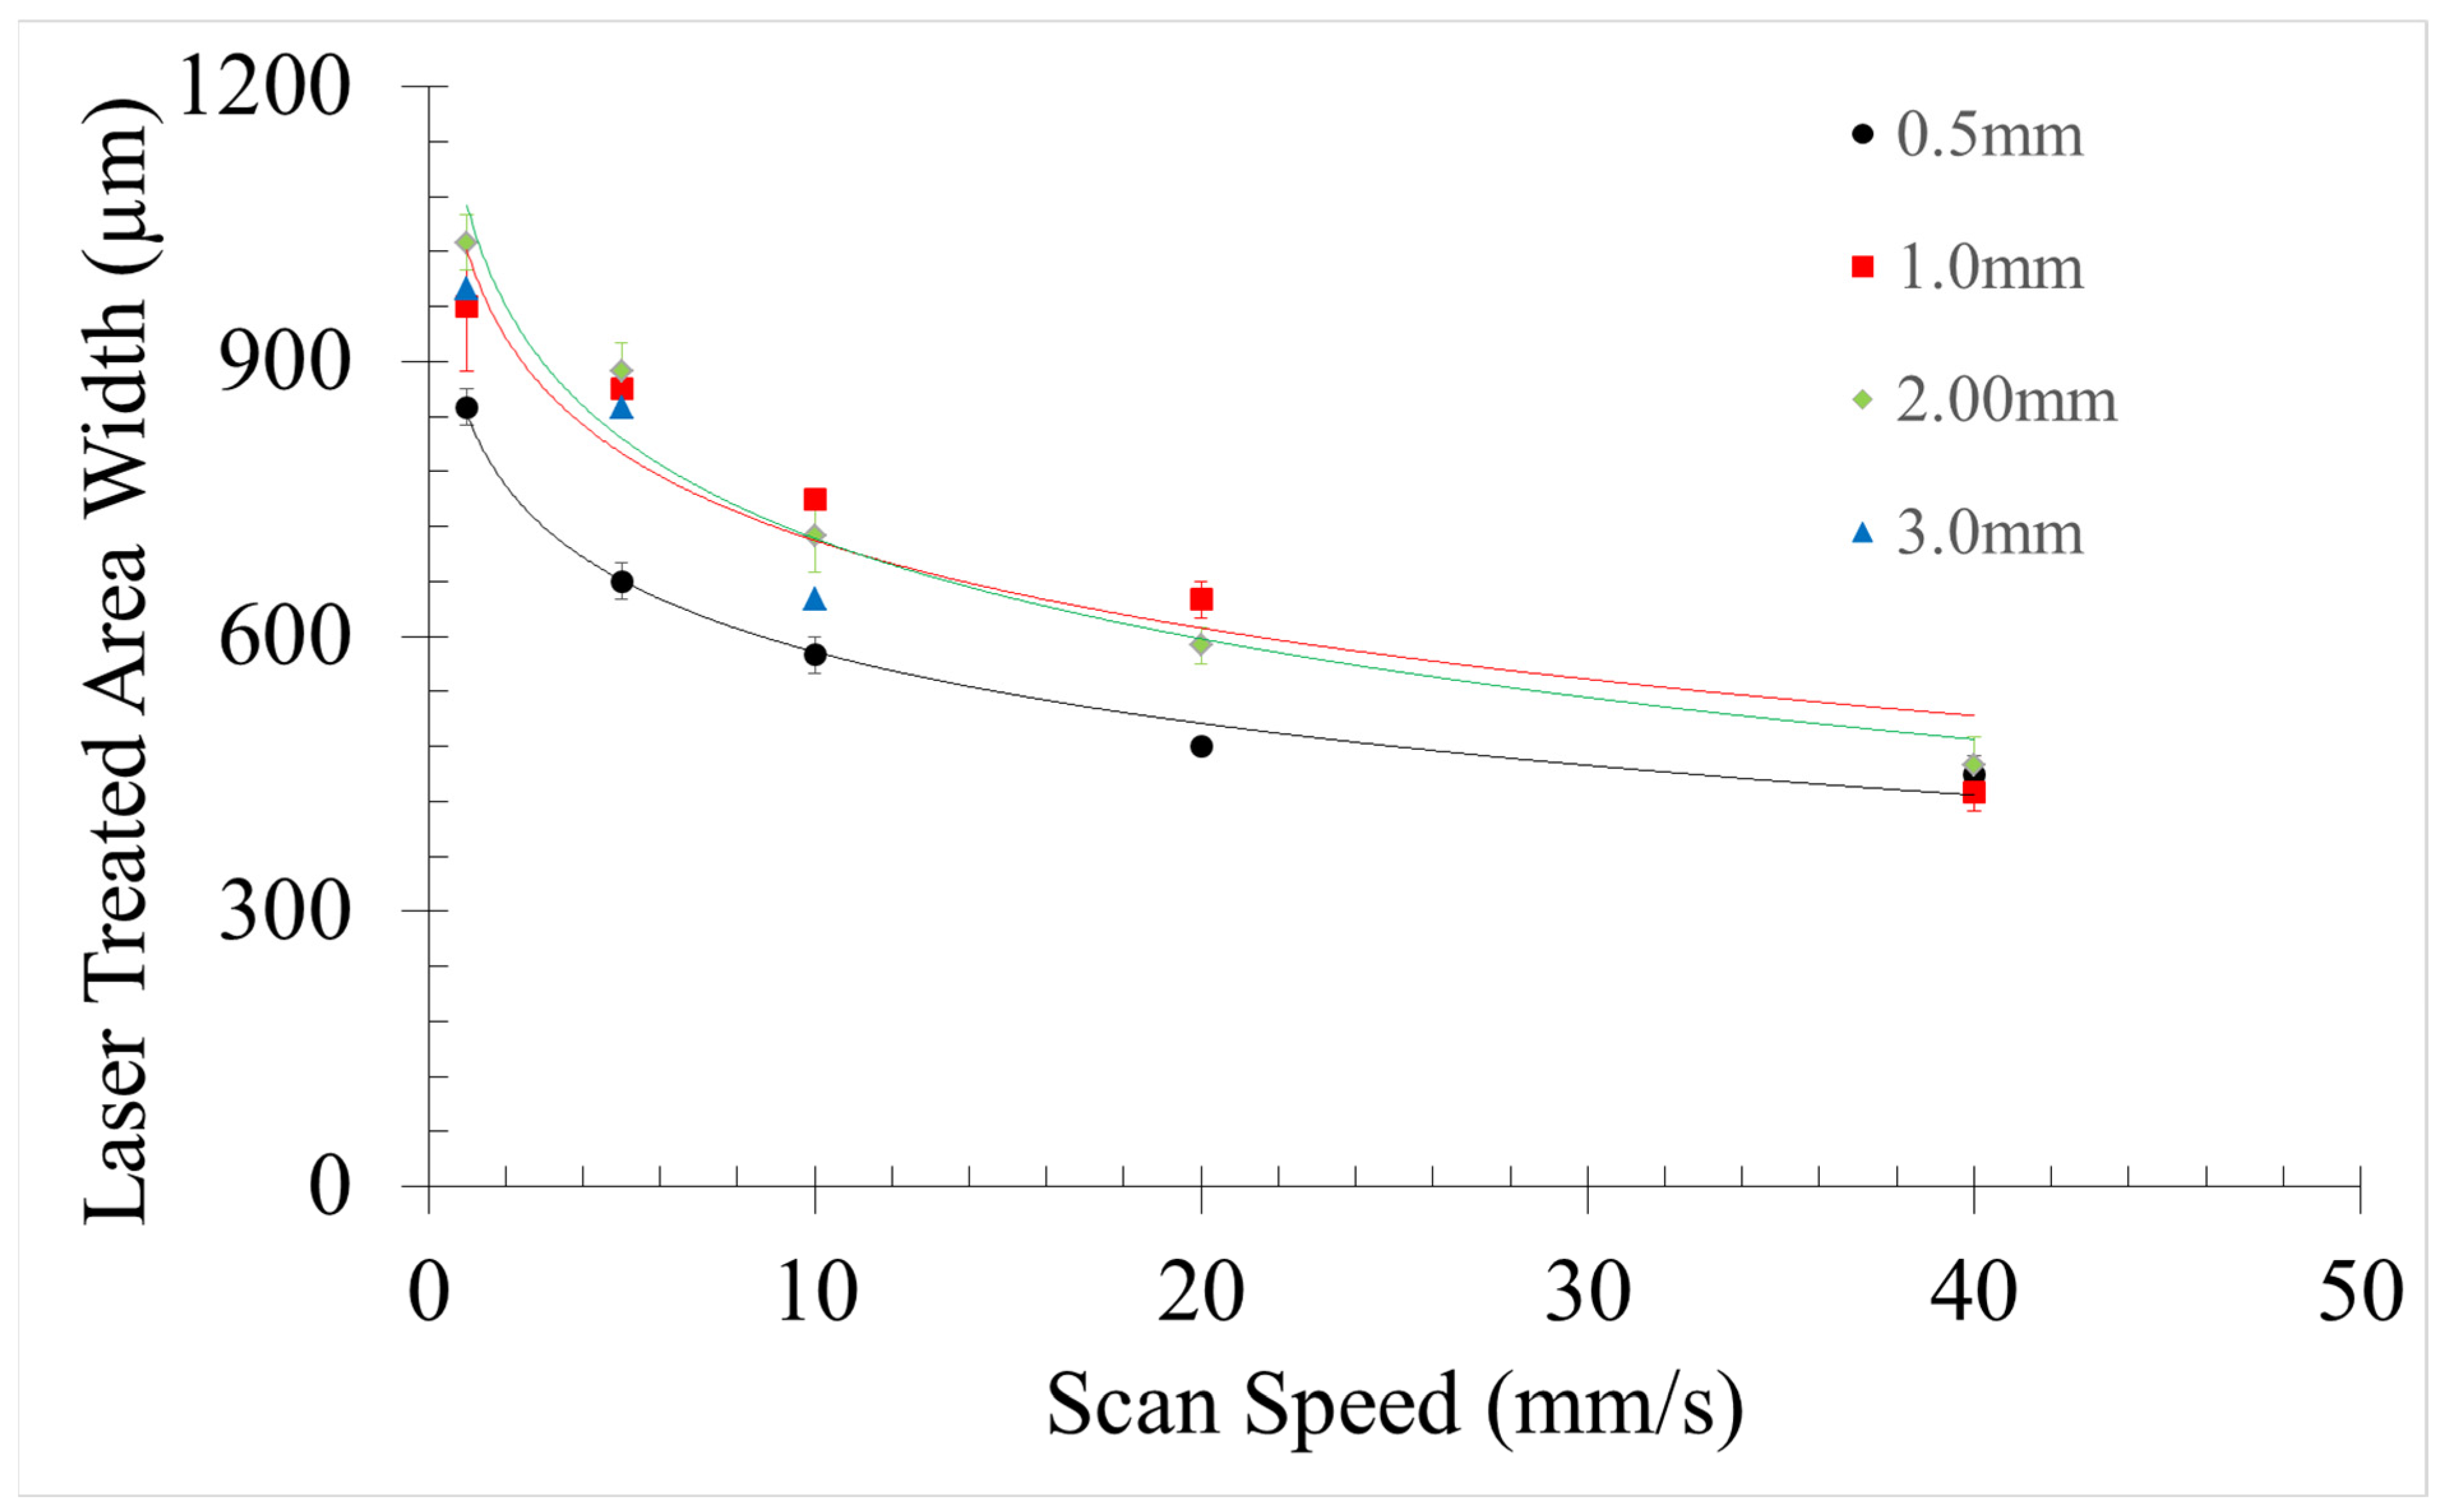
3.1.1. Surface Characterization

Figure 2 displays optical microscopy images of the sample surfaces. The laser-hardened samples exhibited varied aspects, revealing evaporated, molten, oxidized, and intact surfaces. The absorption of laser radiation triggers the excitation of valence electrons within the metallic material. Upon laser exposure, these electrons undergo de-excitation and collide with electrons from adjacent layers, resulting in material heating [14,15]. Depending on the absorbed laser energy, the metallic material can experience a range of states, from heating to melting or even evaporation. The laser energy density (Ed) is directly proportional to the power and inversely proportional to the defocused laser beam diameter and scan rate, as depicted in Equation (5) [33,34]:
E d = P S S × D Z
Among the laser-treated samples, those processed at 0.5 mm with 1 mm/s (Figure 1b) and 5 mm/s (Figure 2f) and at 1 mm/s with 1.0 mm (Figure 2c), and 1.0 mm/s (Figure 2d) exhibited surface evaporation attributed to the specific Ed values. Material melting was observed for laser processing at 0.5 mm and speeds of ≥10 mm/s (Figure 1j,n,r), 1.0 mm with speeds of ≥10 mm/s (Figure 2g,k,o,s), and at 2.0 mm with 1 mm/s (Figure 2d) and 5 mm/s (Figure 2h), as Ed at these levels is sufficient for melting. Dissimilar colouration compared to non-laser-hardened samples was noted for samples processed at 2.0 mm with speeds of ≥10 mm/s (Figure 2l,p,t), and at 3.0 mm between 1 mm/s and 10 mm/s (Figure 2e,i,m). This colour alteration is attributed to the oxidation of the metallic material surfaces. When exposed to atmospheric oxygen, the heated metallic material becomes highly reactive, leading to thermal oxidation [21]. The resulting red hue in the material suggests the presence of iron. Notably, this colour shift was also observed for the evaporated and molten samples, indicating the occurrence of thermal oxidation on those surfaces as well. When Ed is low, it heats the metallic alloy only up to a point of chemical reactivity. At larger laser beam diameters (3.0 mm) and high speeds (20 mm/s and 40 mm/s), the laser beam’s effect on the surfaces is relatively weak, as depicted in Figure 2q,u.
The influence of laser parameters on the width of the laser-molten surface (Wm) is illustrated in Figure 3. Increasing scan rate (SR) led to a reduction in Wm, while enlarging the defocused laser beam diameter (Dz) increased Wm, particularly at low speeds. However, at higher SS, the area was smaller with larger Dz. The spatial energy distribution of the laser beam adheres to a Gaussian pattern, with Wm determined by Equation (6) [35].
W m 2 = D z 2 × l n ( E d E d ( t h - s m ) )
Here, Ed(th-sm) denotes the energy density threshold required for melting the surface (minimum energy density needed to induce surface melting). This width is proportionate to the defocused laser beam diameter when the energy density is adequate for surface melting. Ed is inversely proportional to SS and DZ, as previously explained (Equation (5) [33,34]). When DZ and SS are high, only the central portion of the laser beam can initiate material melting, causing W to decrease with increasing DZ at high SR. Regarding SS, the molten width exhibits an exponential inverse relationship with this parameter, as indicated in Equation (6) [35].

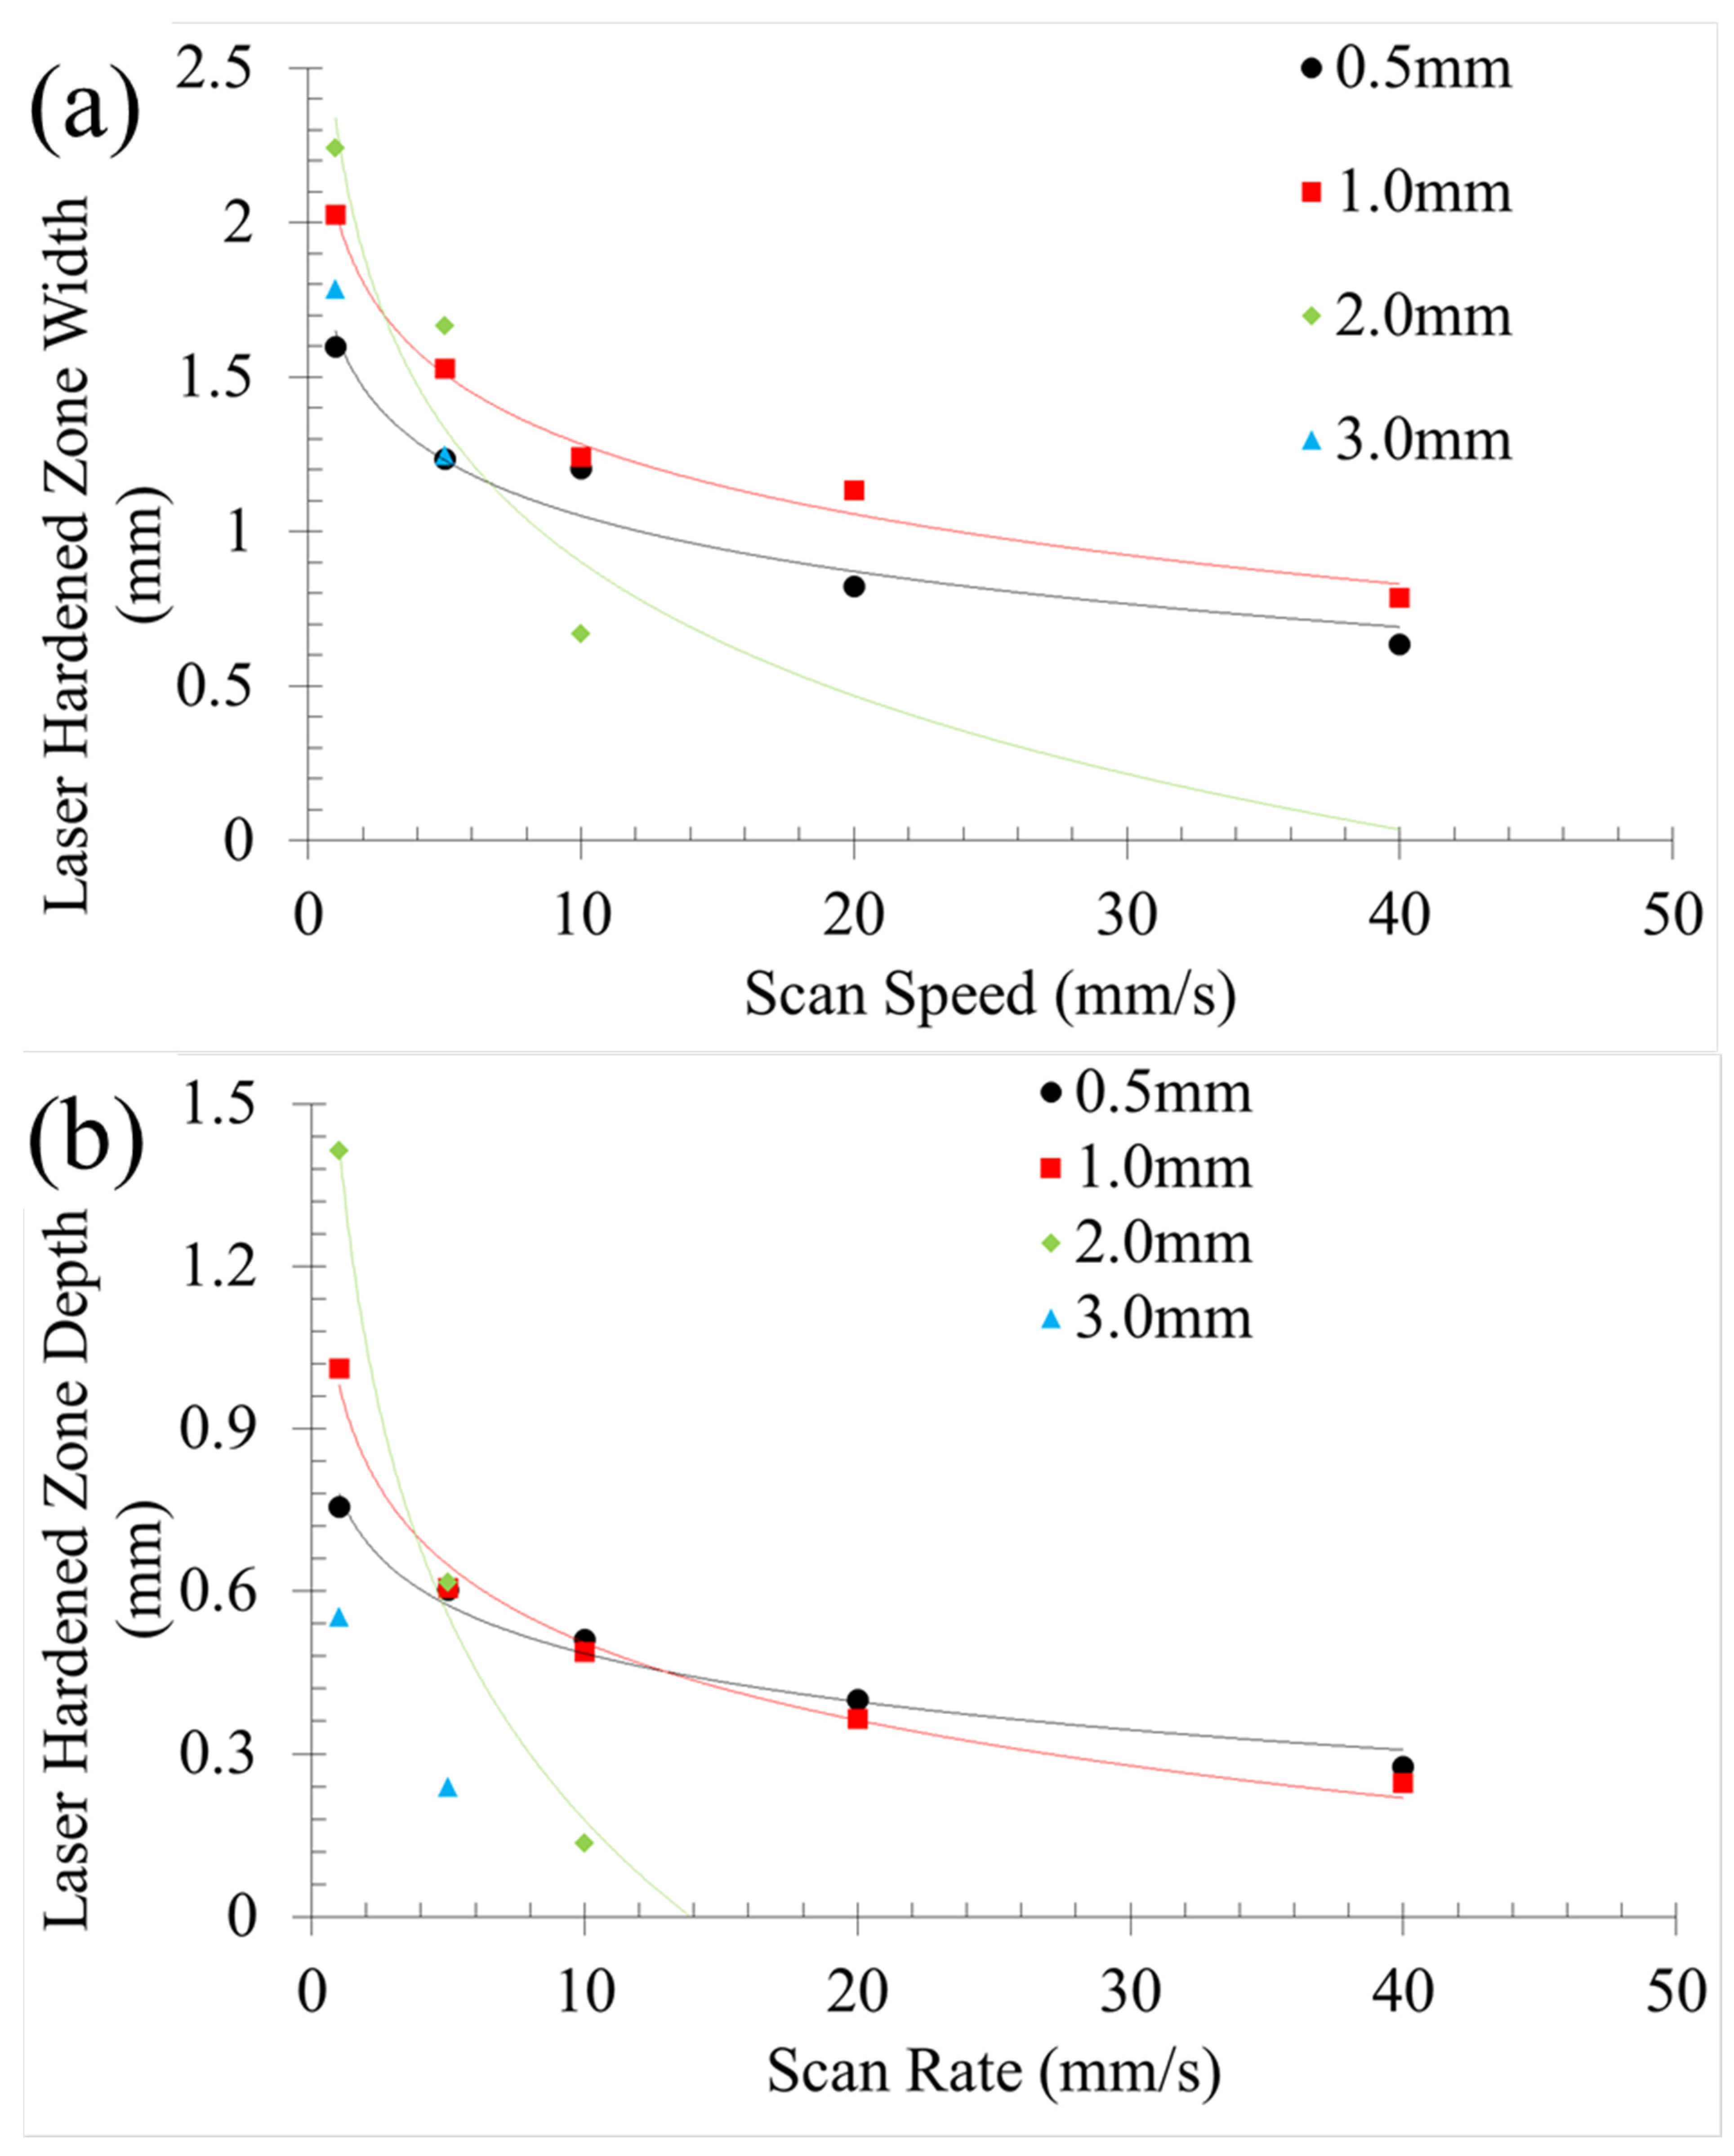
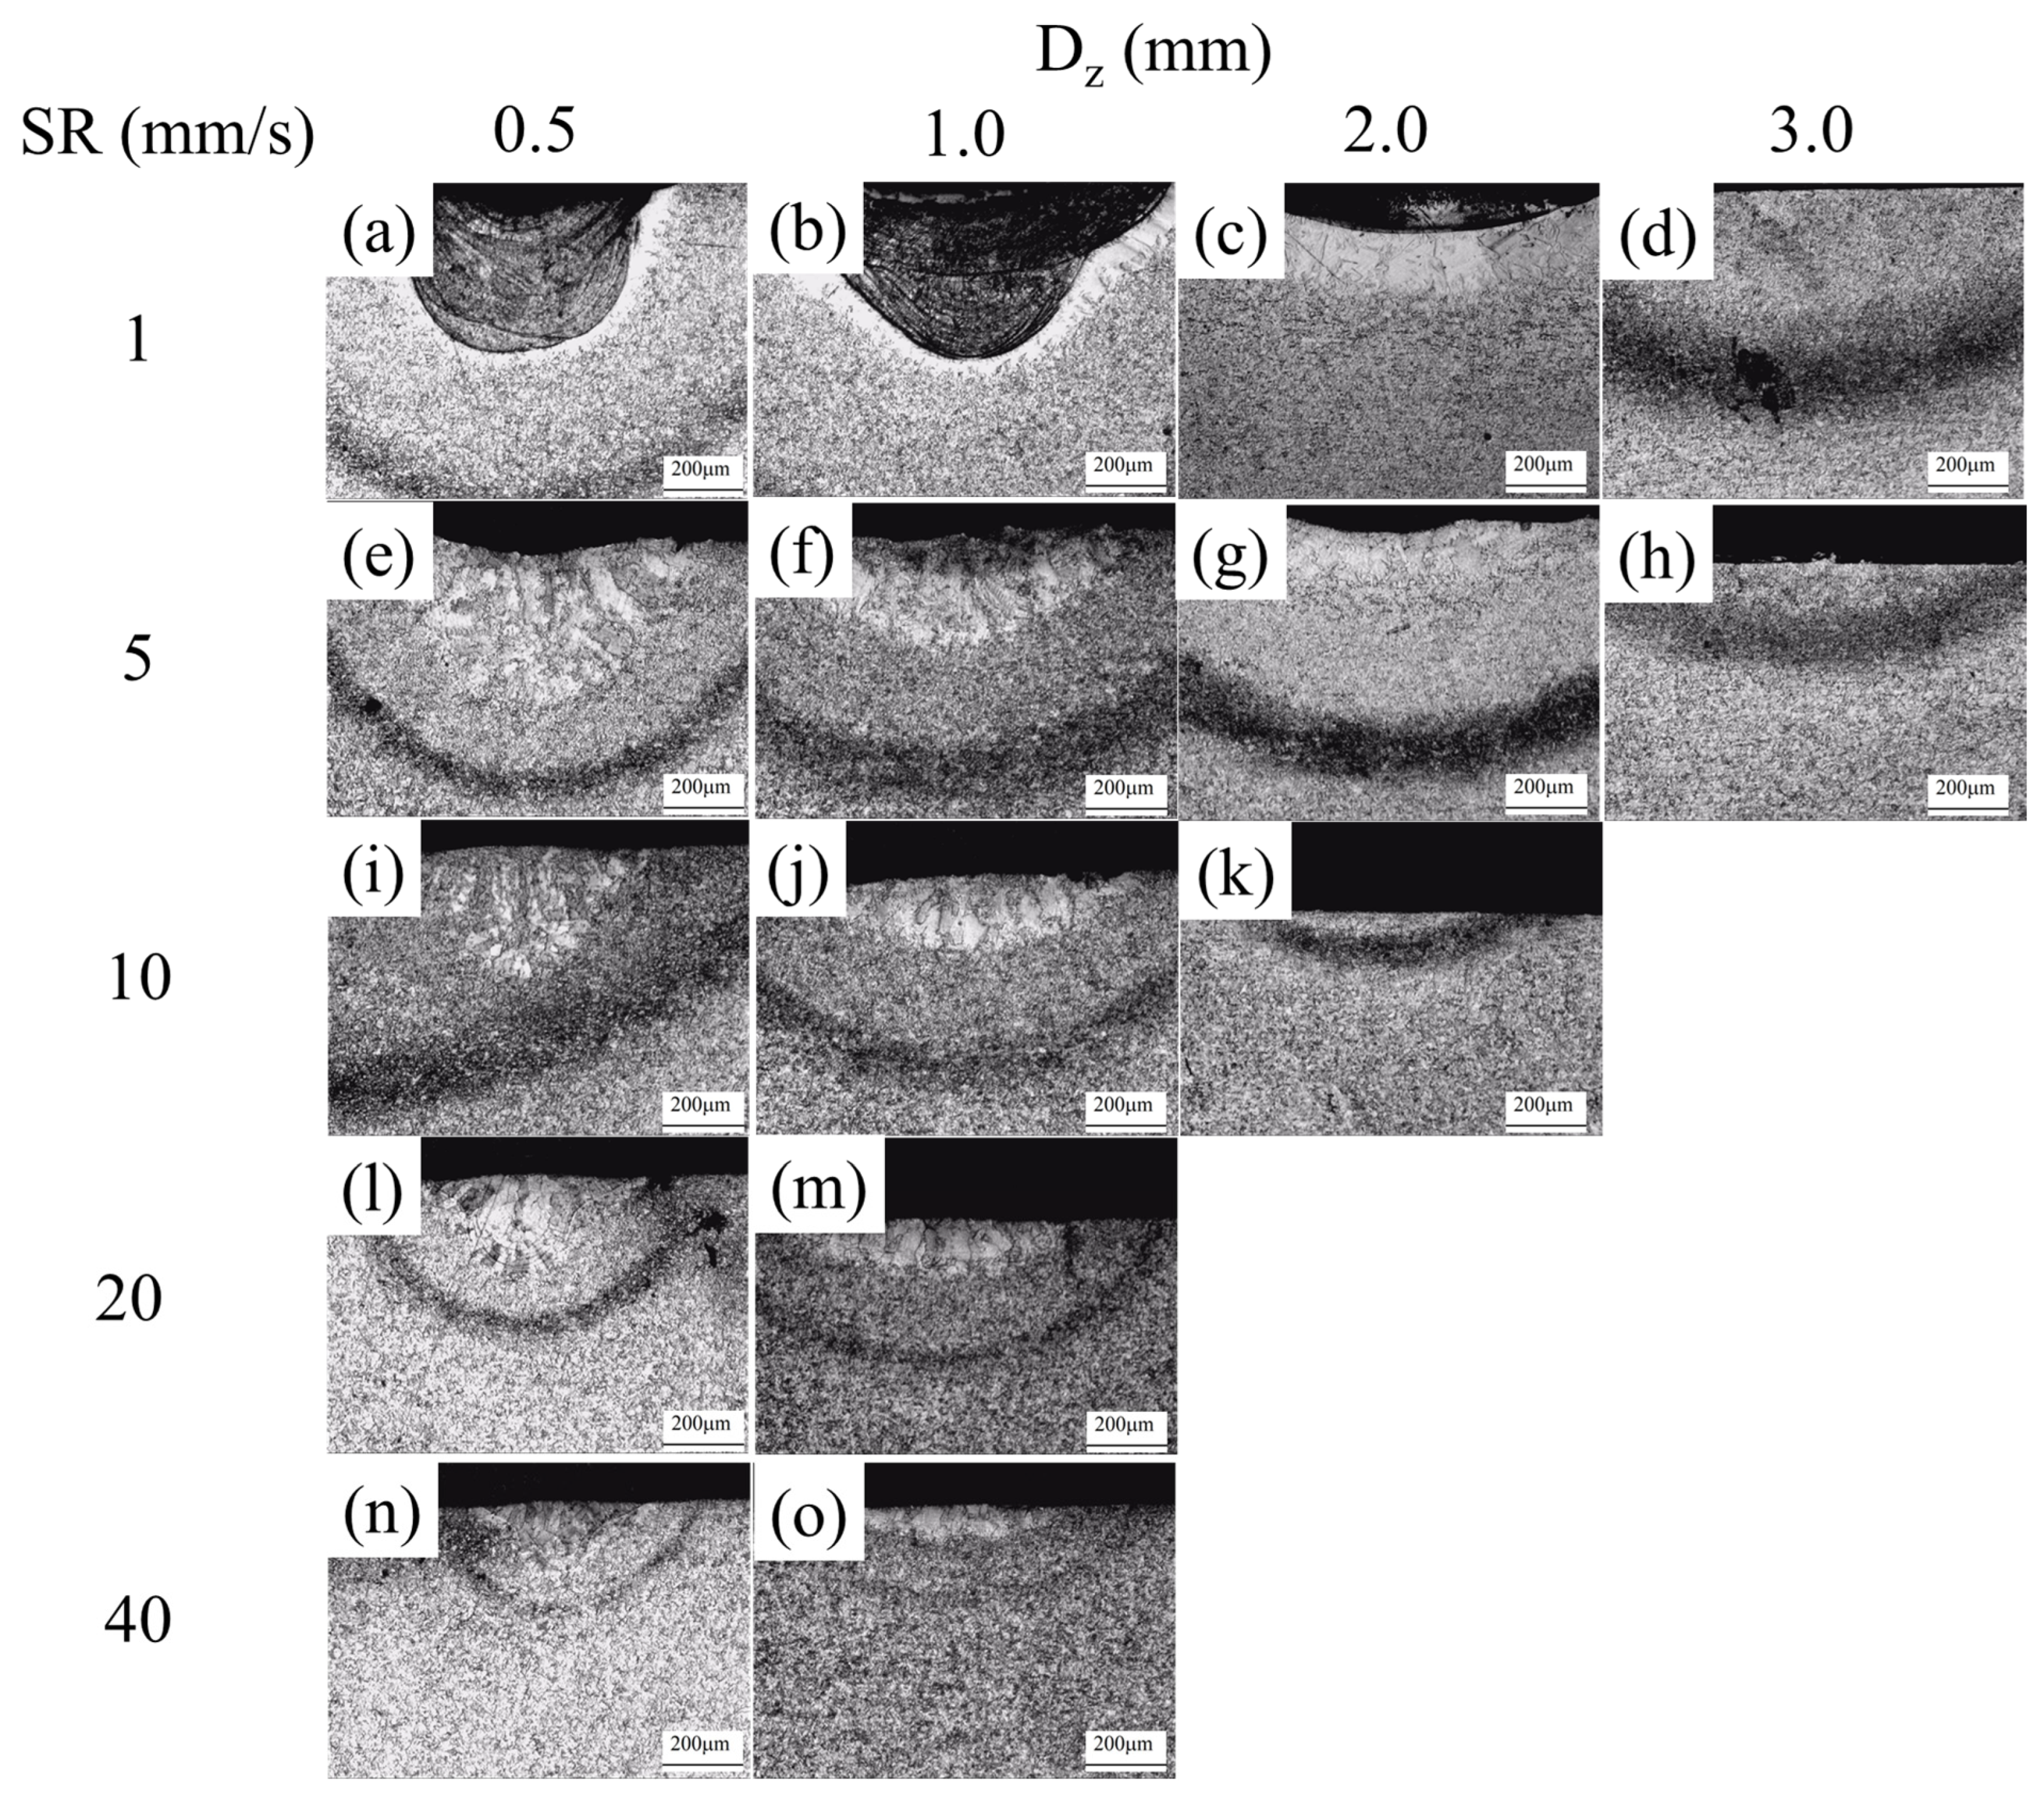
3.1.2. Cross-Section Featuring

The laser hardening process induced significant modifications in the microstructure of the metallic material at varying depths. The laser-hardened samples exhibited diverse microstructures based on factors such as depth, scan rate, and defocused laser beam diameter. The microstructures of the samples subjected to laser hardening at 1 mm/s and 1 mm are depicted in Figure 4. This specific laser track was chosen as it encompassed all the microstructures present in the other samples. Five distinct microstructures were identified in the laser-hardened samples.
The ultra-fine martensitic microstructure was observed in the molten zone (MZ) (Figure 4c,d). Backscattered electron imaging revealed darker regions, indicating potential variations in chemical composition compared to the matrix [36]. The internal compression stress produced encourages the formation of the ultra-fine microstructure. The thermal changes generate these stresses that increase the entropy of the ultra-fine martensitic structure. This was also seen by Zhang et al. [37] in the quenching process. The first heat-affected zone (HAZ I) exhibited a martensitic microstructure with larger grains (Figure 4e,f). The second heat-affected zone (HAZ II) (Figure 4g,h) displayed a microstructure similar to the non-laser-hardened zone (Figure 4m,n), both characterized as martensitic [38]. Darker regions in backscattered electron images (Figure 4h,n) suggested distinct chemical compositions compared to the matrix [36]. This microstructure pattern implied that the metallic alloy of the bike rim could be martensitic steel, stainless steel, or cast iron. The third (Figure 4i,j) and fourth (Figure 4k,l) heat-affected zones (HAZ III and HAZ IV) resembled each other, distinguished by pronounced grain boundaries. However, HAZ III exhibited less distinct grain boundaries than HAZ IV. The black colour in backscattered images (Figure 4j,l) indicated potential differences in chemical composition at the grain boundaries compared to the grain itself [36].
The diverse microstructures observed in the laser-hardened samples at varying depths stem from the temperature (T) achieved in the material, which is a function of depth (l), as demonstrated in Equation (7) [3,19].
T = A × P δ × D Z 2 × l T h e r × i e r f c l 2 l T h e r
In this context, A represents the laser radiation absorption of the metal alloy (0.65 [39]), δ signifies the thermal conductivity [35], and lTher represents the thermal laser energy penetration. The latter parameter, lTher, will be elaborated upon subsequently, as its definition is contingent upon the laser parameters. The attained material temperature during the laser hardening process dictates the subsequent alterations in the microstructure of the metallic alloy. The extent of alloyed element re-dissolution within the material contributes to the definition of the microstructure, which is intrinsically influenced by temperature variations [5].
The elemental compositions of the microstructures were determined through EDS analysis. They are presented in Table 2. The base material exhibited a matrix primarily composed of iron (base), while alloying elements such as chromium, manganese, and silicon were also present. In the grey area, these same elements were detected along with oxygen. The composition and concentration of these elements point to the potential identification of the steel as martensitic stainless steel of 420 and 410 grades [40]. Within the MZ matrix, there was an enrichment of iron due to the laser-induced re-melting of the martensitic stainless steel. The darker regions exhibited higher silicon concentrations compared to the MZ matrix, in addition to the presence of oxygen. This heightened silicon concentration in δ-ferritic regions has also been observed by Rabiei et al. [10]. The presence of oxygen suggests localized oxidation of the stainless steel. Upon melting, the molten material absorbs atmospheric oxygen, leading to chemical reactions with the melted metallic material, which becomes chemically active [41].
The chemical compositions of HAZ I and HAZ II exhibited similarities to the non-laser-hardened samples, implying that the alteration in these zones is predominantly related to changes in microstructure. In the case of HAZ III, while the grain composition resembled that of the previous case, the grain boundaries showed elevated levels of silicon, carbon, and oxygen. A similar trend was identified for the grain boundary of HAZ IV, yet the grain itself exhibited enrichment in silicon alongside the presence of oxygen. The accumulation of silicon, carbon, and oxygen at the limits of the laser-processed regions can be attributed to their pronounced segregation. These elements’ relatively small atomic sizes facilitate their diffusion within the stainless steel structure [19].
The cross-sectional views of the laser-hardened samples are depicted in Figure 5, revealing that certain laser process parameters, such as those at 2.0 mm and 2.0 mm with scan rates of ≥20 mm/s and ≥10 mm/s,, respectively, did not result in any observable microstructural alterations. This lack of microstructural change can be attributed to the inadequacy of the respective Ed values to induce significant modification, as Ed is inversely proportional to both DZ and SR, as previously discussed. The variety of microstructures observed in the laser-hardened samples was contingent upon the specific laser parameters employed. HAZ II, III, and IV were consistently present in all laser-hardened samples, while the occurrence of HAZ I was limited to instances with ≤1.0 mm (Figure 5a,b,e,f,i,j,l–o) and at 2.0 mm with 1 mm/s (Figure 5c) and 5 mm/s (Figure 5g).
Figure 4 reveals that only samples generated at 1 mm/s and ≤2.0 mm exhibited the presence of MZ (Molten Zone). The frequency of distinct microstructure types demonstrated an inverse correlation with the focused laser beam diameter (DZ) and the scan rate (SR). The temperature range achieved during laser hardening (T) is inversely proportional to DZ, as evidenced by Equation (7) [3,19]. The creation of each microstructure is contingent upon reaching specific temperatures. Additionally, SR also exerts influence on T through the parameter lTher, as outlined in Equation (8) [7,42].
l T h e r = ε × σ × D z S R
where ε is a geometrical factor and σ is the thermal diffusivity [35]. Dz can also define the types of microstructures by means of the cooling time (tc), as seen in Equation (9) [3,5].
t c = D Z 2 σ
The quick cooling time induces the generation of the metastable microstructures [3].
The dimensions of the laser-hardened zones exhibited notable variations corresponding to changes in the scan speed (SS) and defocused laser beam diameter (DZ), as visually represented in Figure 6. Specifically, the width (W) and depth (DL) of the laser-hardened zones experienced exponential reductions with the increment of both parameters. The interplay between these laser-parameters plays a pivotal role in defining the extents of the laser hardened zones, as elucidated through Equations (5) [33,34], (8) [7,42], 10 [35], and (11) [35].
W 2 = D Z 2 × l n ( E d E d - L H Z )
D L = l T h e r × l n ( E d E d - L H Z )
Ed-LHZ is the energy density threshold that induces microstructural change. SS and DZ had an extra influence on W and DL via lTher (Equation (8) [7,42]) and Ed-LHZ (Equation (12) [42]).
E d - L H Z = E × ε × σ × D z S S
where, E is the energy per volume needed to produce microstructural modification. This is noted that W was proportional to DZ while SS was influenced by the SS root.
The relationship between scan speed (SS) and defocused laser beam diameter (DZ) and the resulting thickness of the laser-treated zones is illustrated in Figure 7. As previously mentioned, the molten zone (MZ) was observed exclusively for laser hardening processes conducted at 1 mm/s and ≤2.0 mm DZ (Figure 7a). Among the MZs, the thickest was obtained at a defocused laser beam diameter of 1.0 mm, while the thinnest MZ resulted from laser hardening at 2.0 mm DZ. The thickness of the laser-treated zone depth is directly proportional to DZ through the parameter lTher, as defined in Equation (11) [35]. However, a higher DZ leads to a lower energy density (Ed) (Equation (5) [33,34]), resulting in a thinner laser-treated zone, as evident in Equation (11) [35].
The increment of SR led to a reduction in the thickness of the first (Figure 6b), second (Figure 7c), and third (Figure 7d) heat-affected zones due to the decrease in lTher (Equation (8) [7,42]) and Ed (Equation (5) [7,42]), as indicated in Equation (11) [35]. The effect of the defocused laser beam diameter (DZ) on thickness remained less clear. In the case of the fourth heat-affected zone, the influence of the laser parameters on thickness appeared to be uncertain. The segregation and accumulation of elements are influenced primarily by environmental factors and particle diffusivity [19].
The laser parameters chosen for the subsequent phase of the experiment were a SS of 1 mm/s and a defocused laser beam diameter (DZ) of 1.0 mm. This selection was based on the desired outcome of generating a substantial microstructural modification within wide areas, with a larger size and thickness of the resulting molten zone (MZ). Note that the microstructural changes are localized in MZ, as its characteristics (thickness and size) were the principal parameters of selection.

3.2. Overlapped Tracks

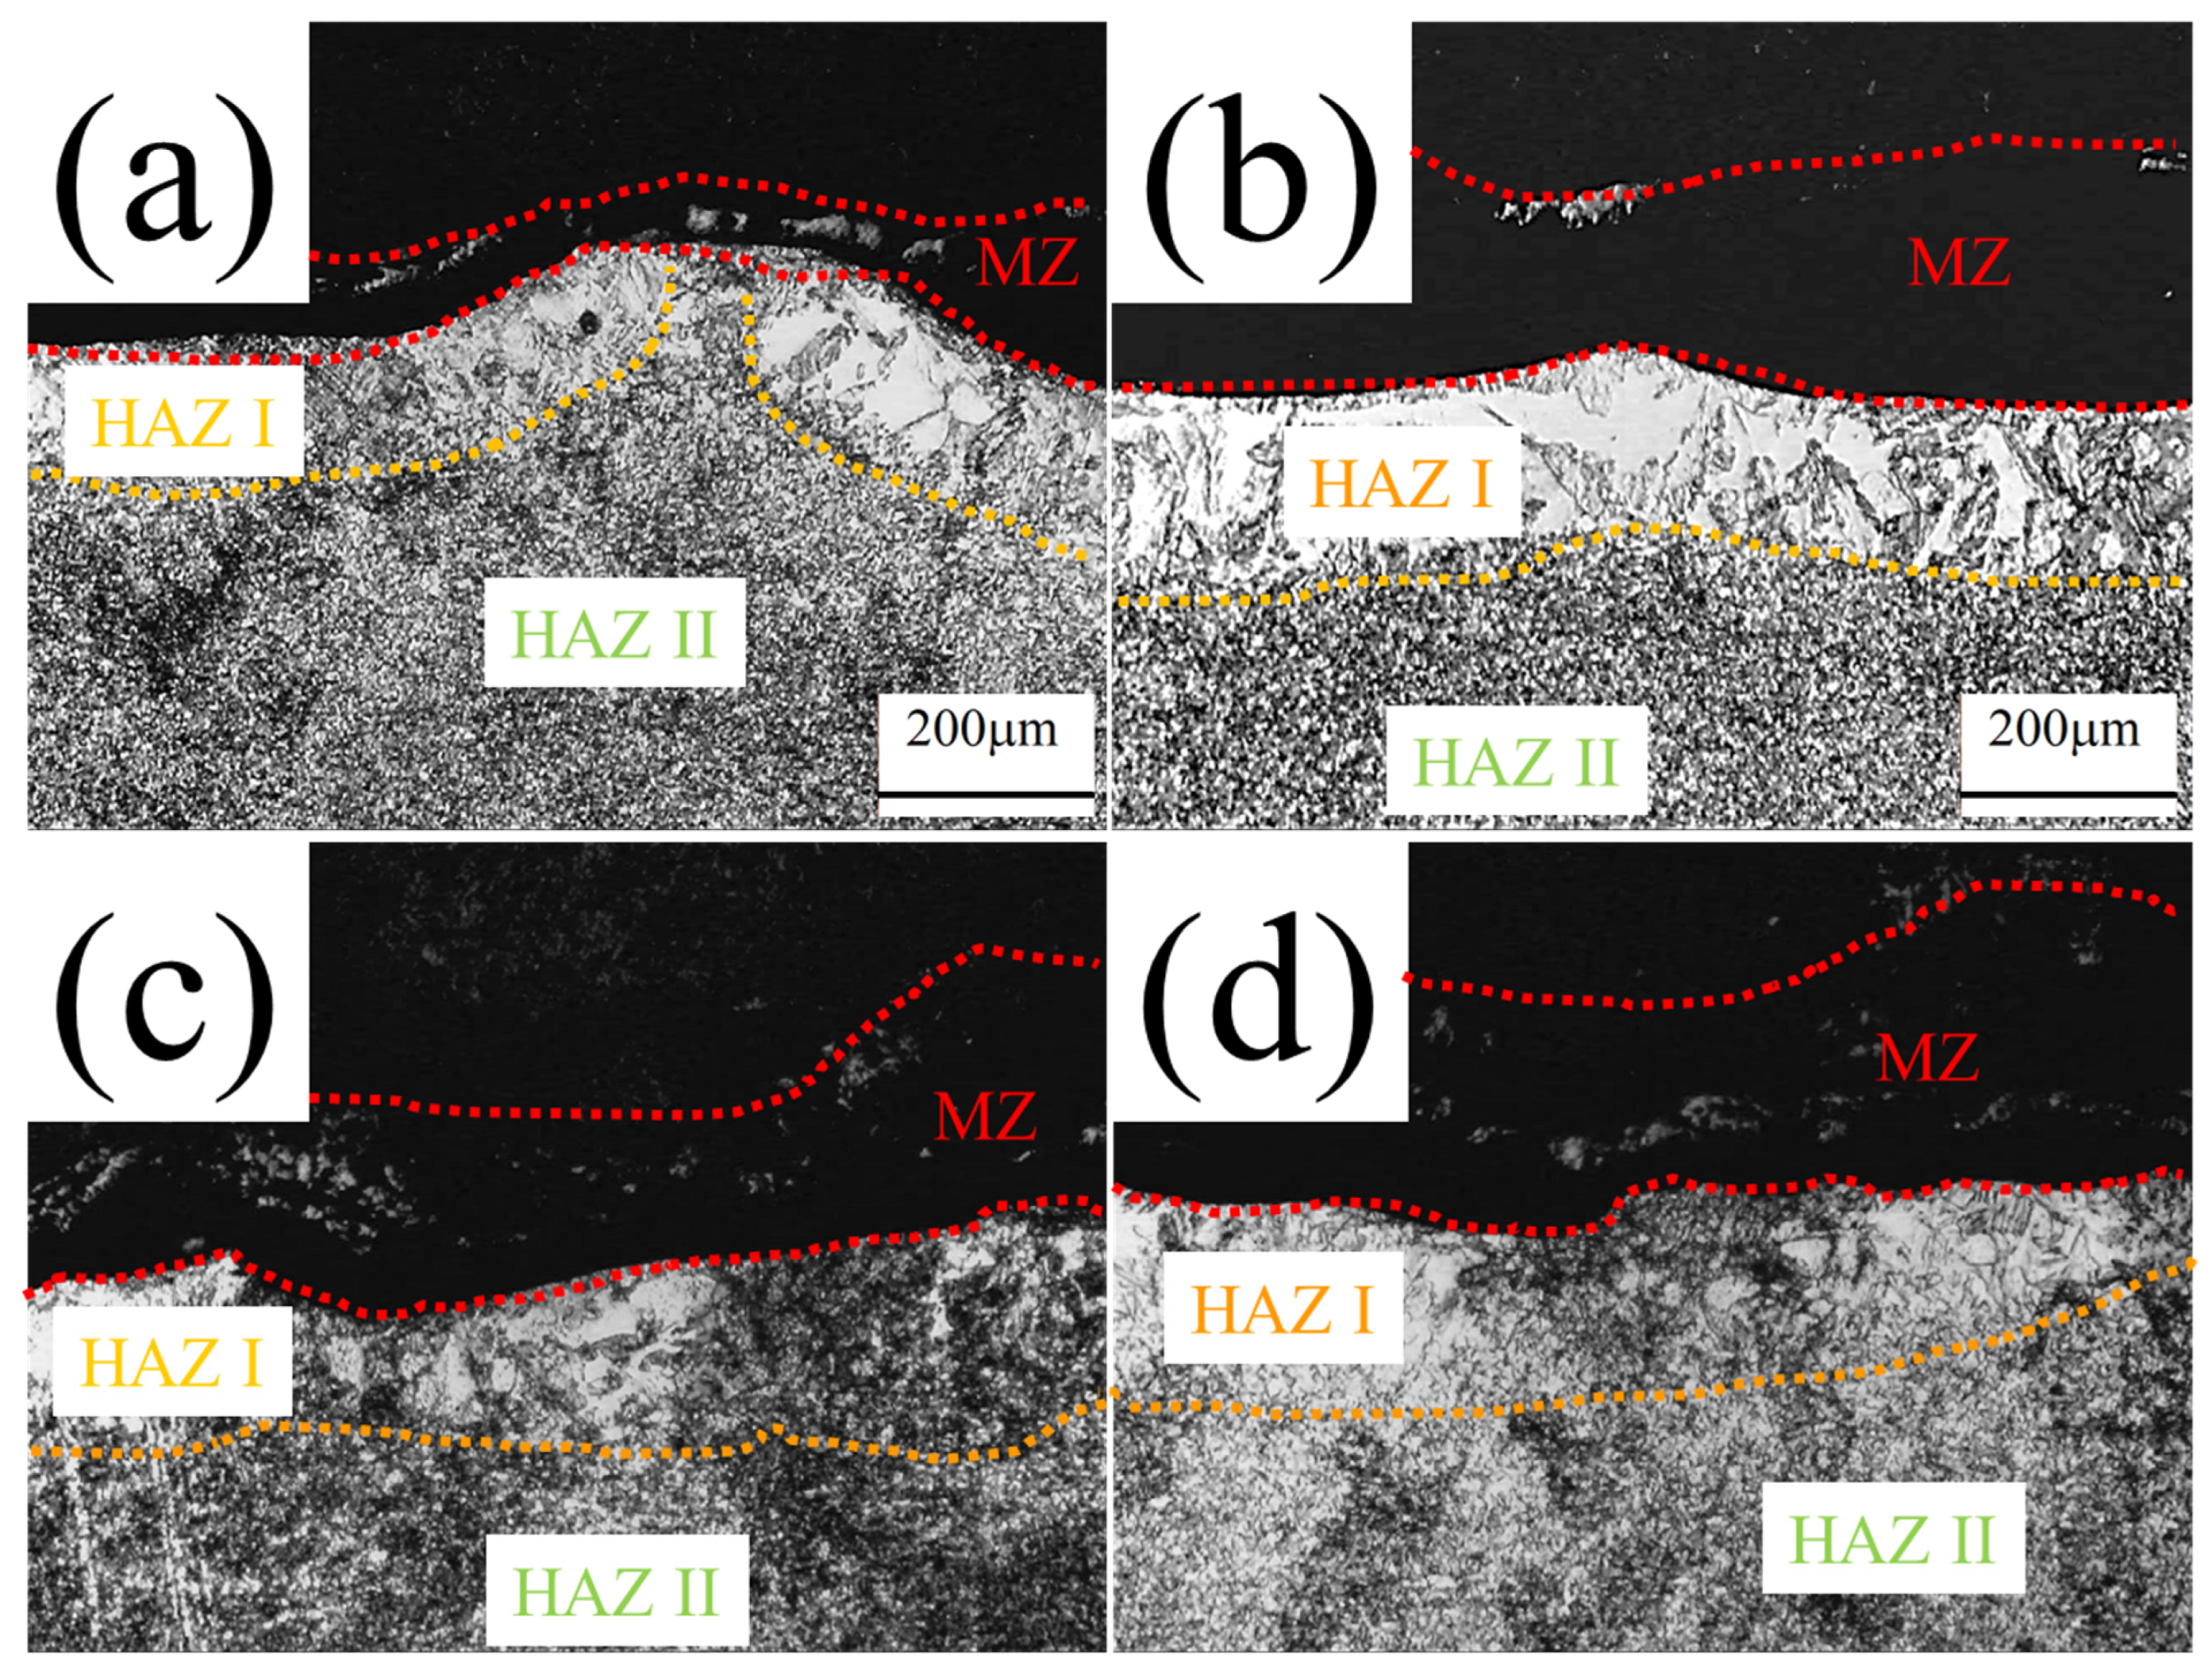
3.2.1. Surface Characterization

The surfaces subjected to overlapped laser scans exhibited a reddish hue (Figure 8), signifying the occurrence of thermal oxidation during the laser processing, as elaborated upon subsequently. This reddish hue was heterogeneous, indicating a non-homogeneous oxidation of the material. This can be due to the overlapping that modifies the oxidation grade. The limits of the overlapping areas featured crests due to the accumulation of the molten material on the scan edge. Notably, surfaces that underwent laser hardening with a 75% scan overlap displayed cracks (Figure 8d), which could be attributed to the thermal stress induced by increased thermal input [43]. The increase in thermal input, resulting from higher scan overlapping, is known to contribute to the development of thermal stress cracks [24]. These cracks were also extended to all areas and even between overlapped scans.

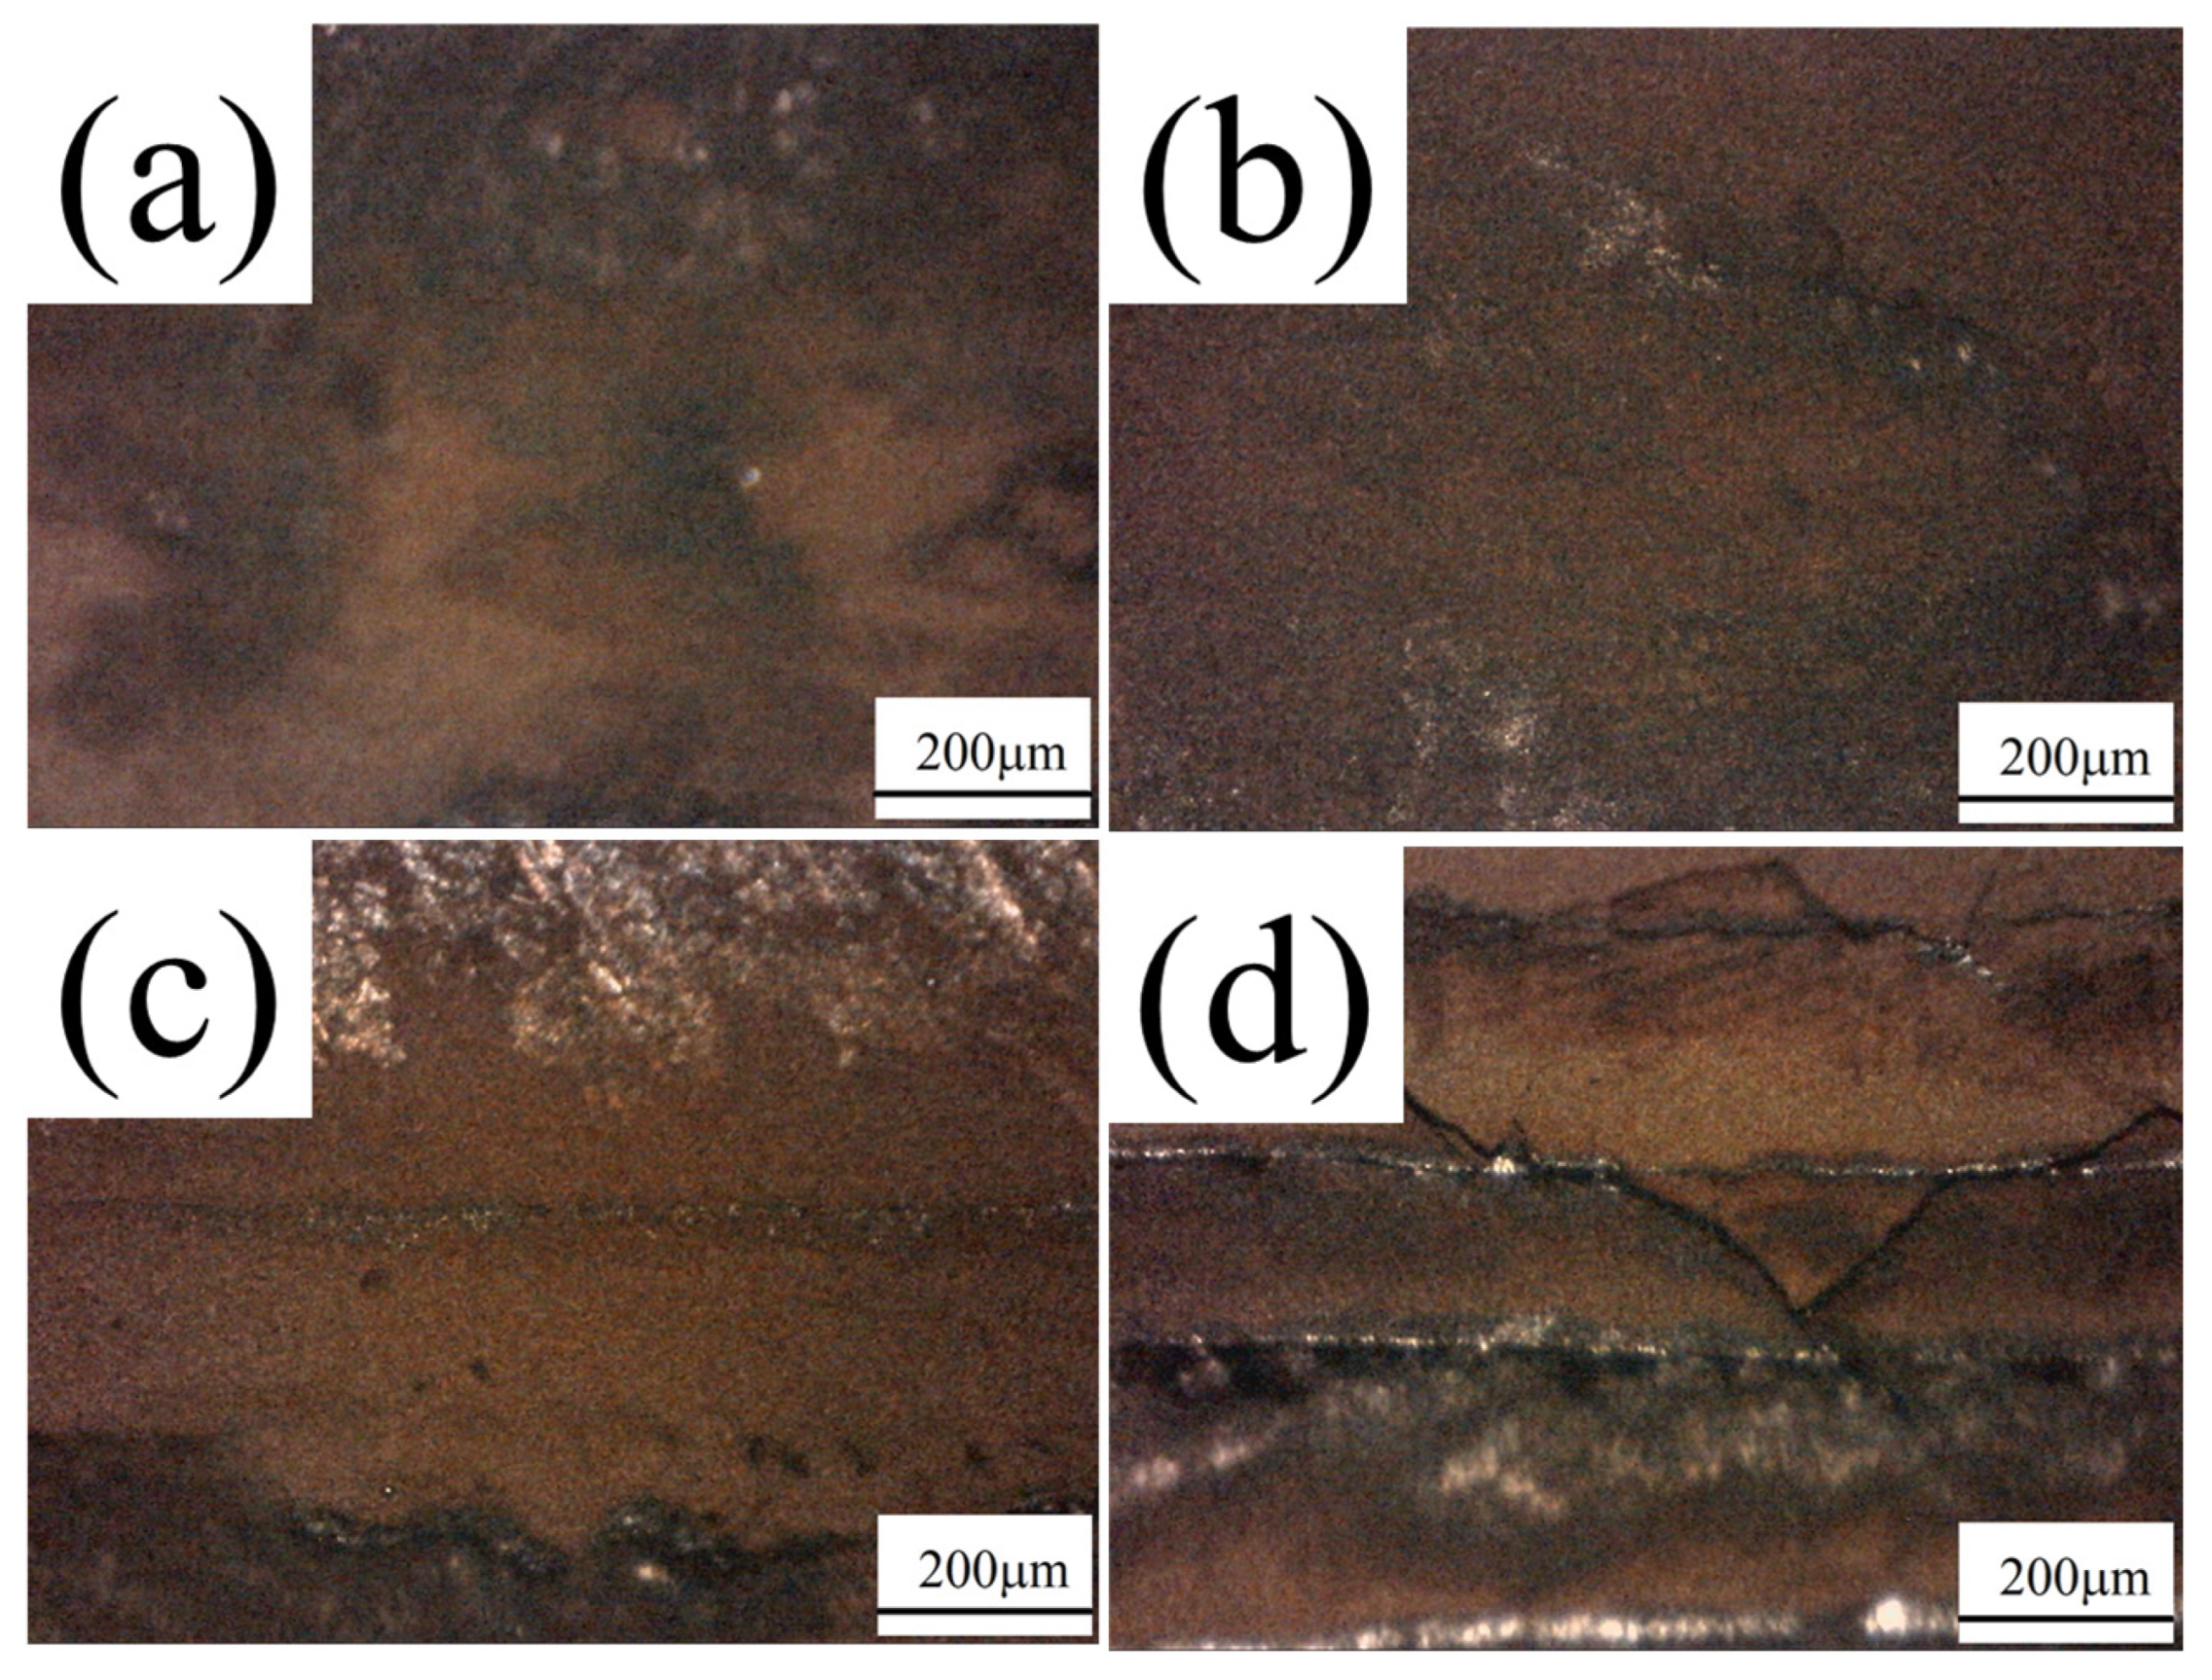
3.2.2. Cross-Section Study

The thickness of the laser-induced microstructures appeared to remain unaffected by the extent of scan overlap, as depicted in Figure 9. This can be seen in the homogeneous layer of the different zones for most of the samples. The only exception was samples with 25% overlap, where a small gap was observed between HAZ I. This is due to the low overlap. Thus, the overlap parameter had a minimal impact on the characteristics of the microstructures. This can indicate that the thermodynamic properties of the material will improve after the laser scan process.

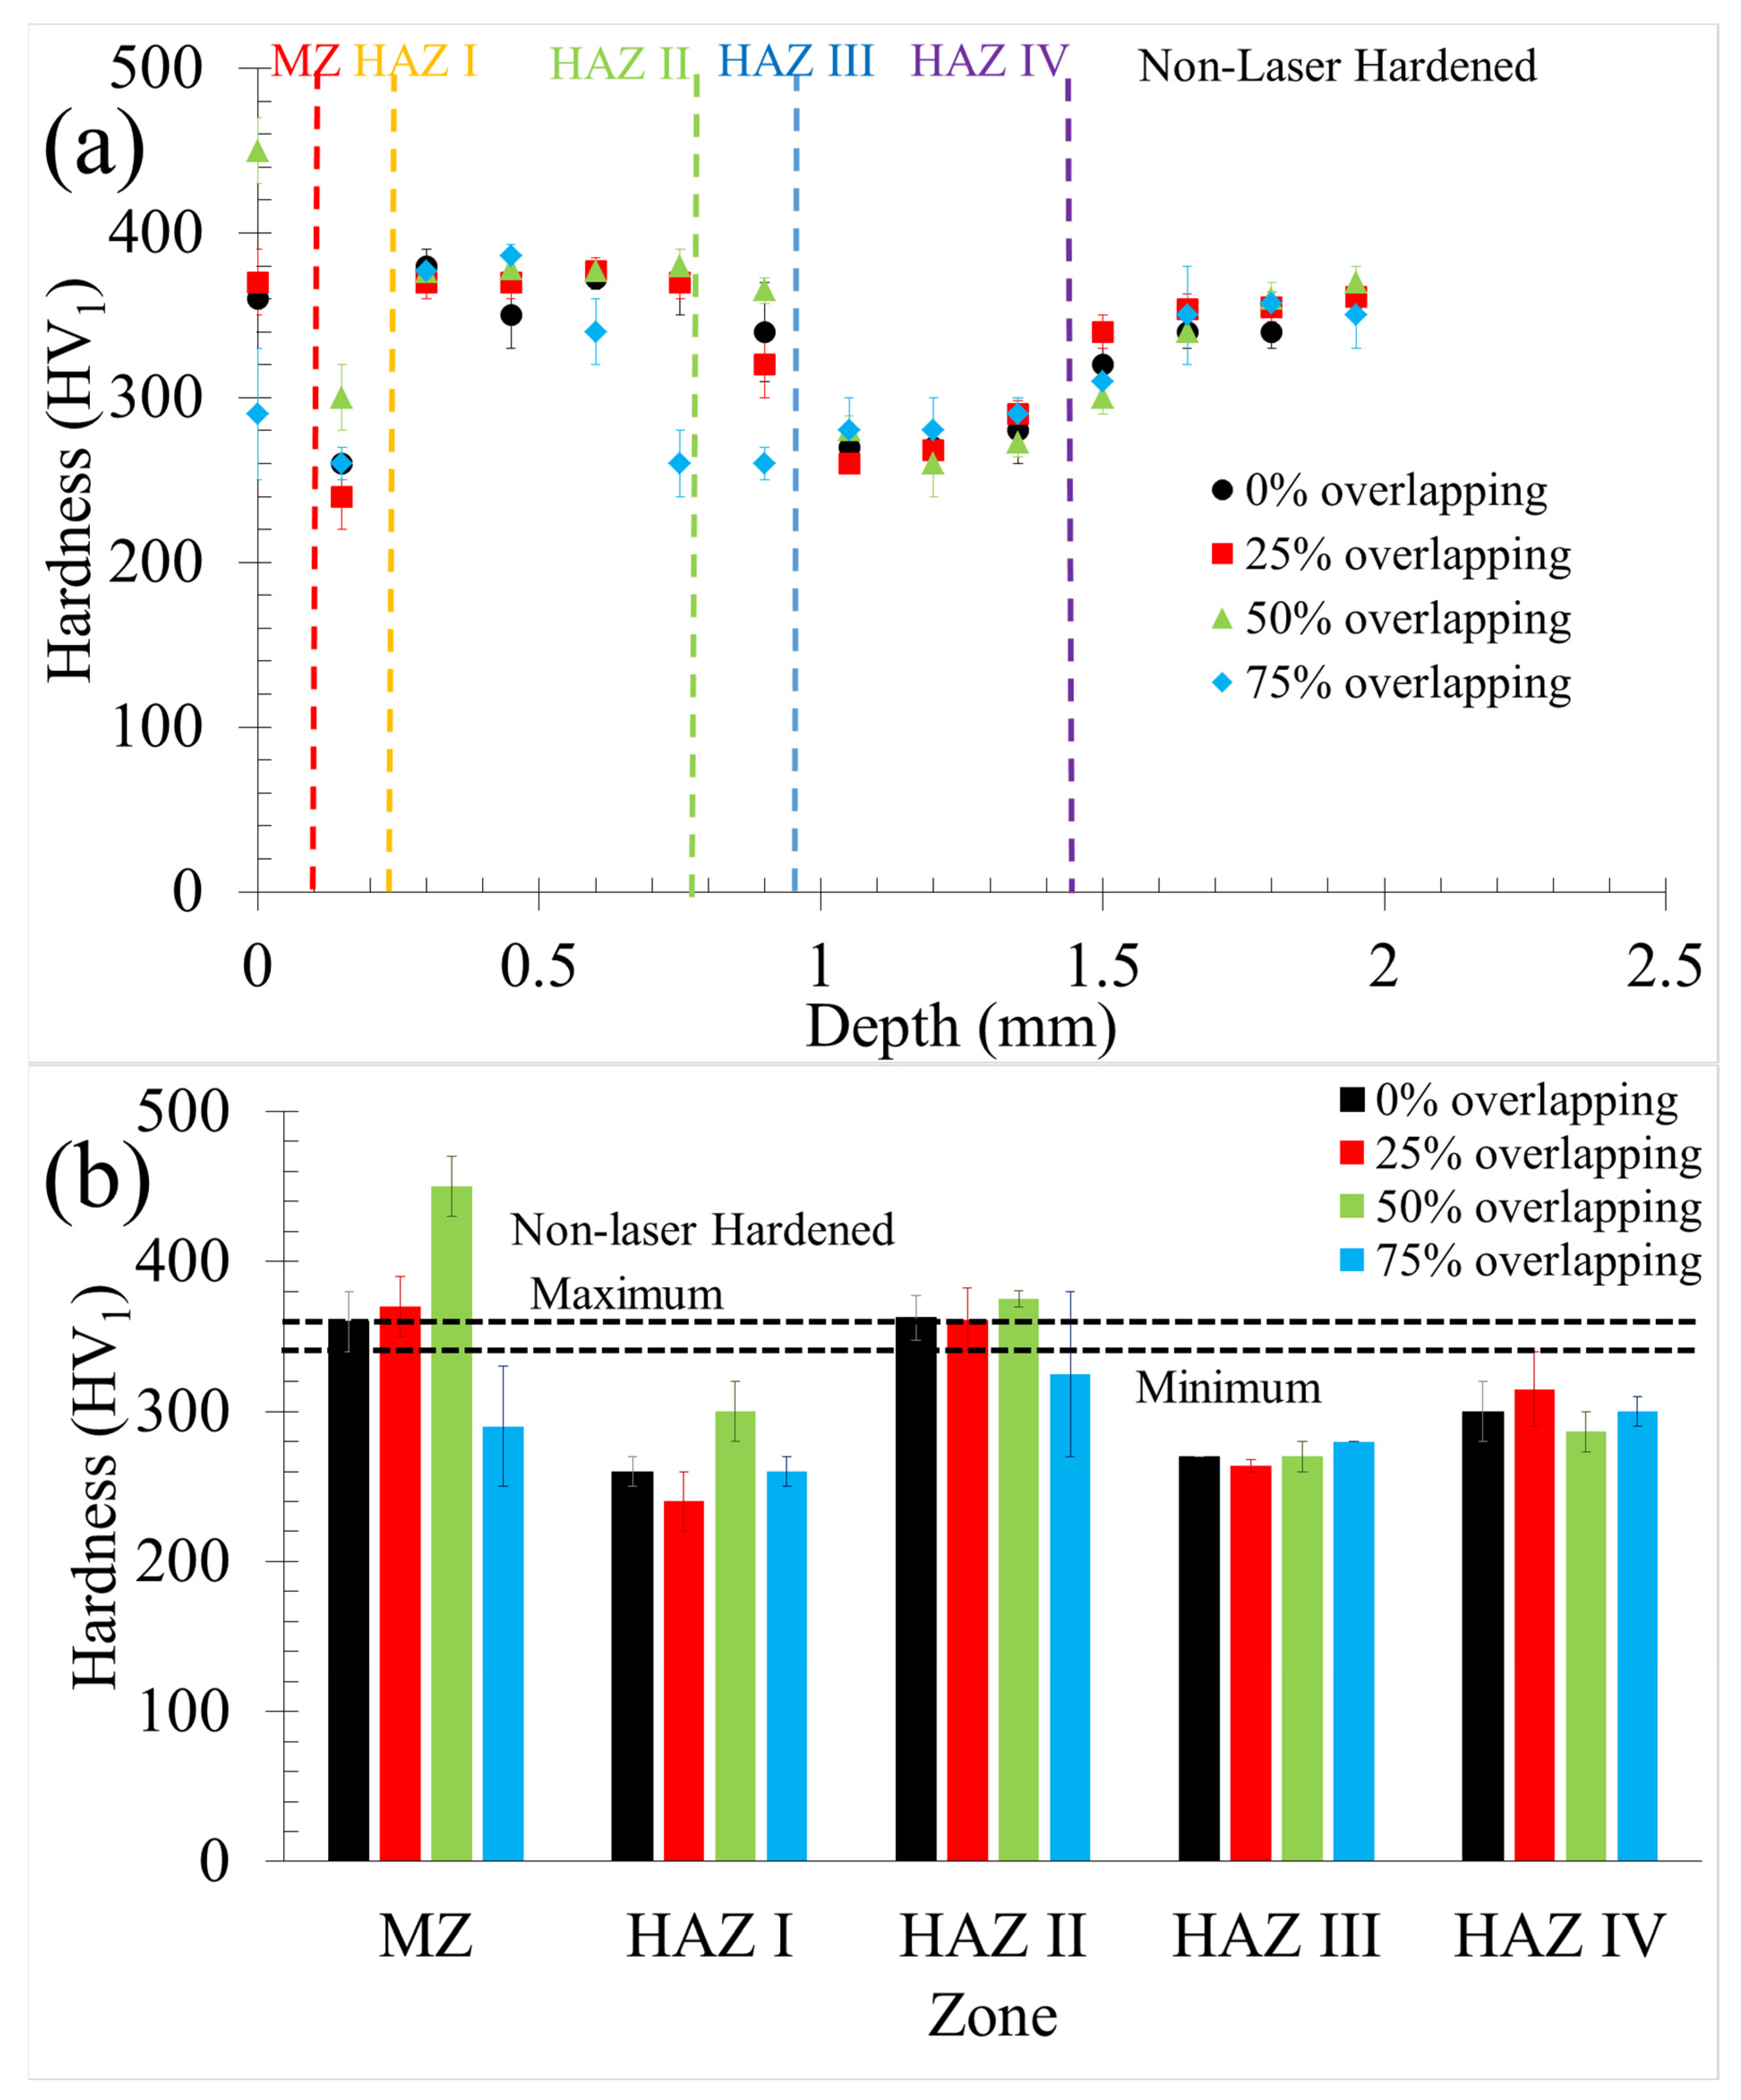
3.2.3. Hardness Measurements

The Vicker hardness of the samples demonstrated variations based on both the depth of the laser-processed zone (characterized by the microstructure type) and the degree of scan overlap, as illustrated in Figure 10. The hardness profile exhibited fluctuations with respect to the depth of the laser-processed zone (Figure 10a), primarily driven by the inherent microstructural properties that governed the material’s hardness (Figure 10b). It is noted that the hardness of zones (Figure 10b) was calculated with all measurements of the zone. The laser-hardened zones were defined using the optical microscope of the hardness measurement device. This was possible because the samples were etched.
Among the observed microstructures, HAZ I, III, and IV exhibited lower hardness compared to the non-laser-hardened sample. HAZs reduced hardness could be attributed to its coarser microstructure, which incurred lower microstructural stress [32]. For HAZ III and IV, the accumulation of carbon and silicon at grain boundaries led to the weakening of the 420–410 stainless steel due to the formation of δ-ferritic structures [1,44]. The refinement of microstructure in the molten zone contributed to enhanced material hardness by increasing grain boundary areas [32]. The laser-induced thermal stress in HAZ II resulted in hardness augmentation [6].
The impact of overlap on hardness was evident in MZ and HAZ III, particularly at ≤50% overlap, and could be traced back to distinct mechanisms. In the case of MZ, its hardness was proportional to the refinement of its microstructure, which in turn was influenced by overlap [2]. The effect of overlap on the hardness of HAZ I, III, and IV was relatively minimal due to inherent microstructural characteristics. However, for MZ and HAZ II, overlap exhibited a noticeable influence on hardness at ≤50%. This effect stemmed from different mechanisms. In both cases, an increase in overlap led to microstructure refinement, resulting in greater material hardness [32]. However, excessive overlap, as observed in samples produced with 75% overlap, could induce thermal cracks that subsequently reduce material hardness [24].
Furthermore, while thermal stresses could enhance the hardness of HAZ II, excessive stress levels could counteract this effect [19].
Thus, the overlapping has a clear influence on the hardness of MZ, HAZ I and II.

4. Conclusions

This study successfully achieved the hardening of a motorbike brake disc using an infrared fibre laser, investigating the effects of laser parameters on the resulting metallic microstructure and its subsequent impact on material hardness. The key conclusions drawn from this research are as follows:
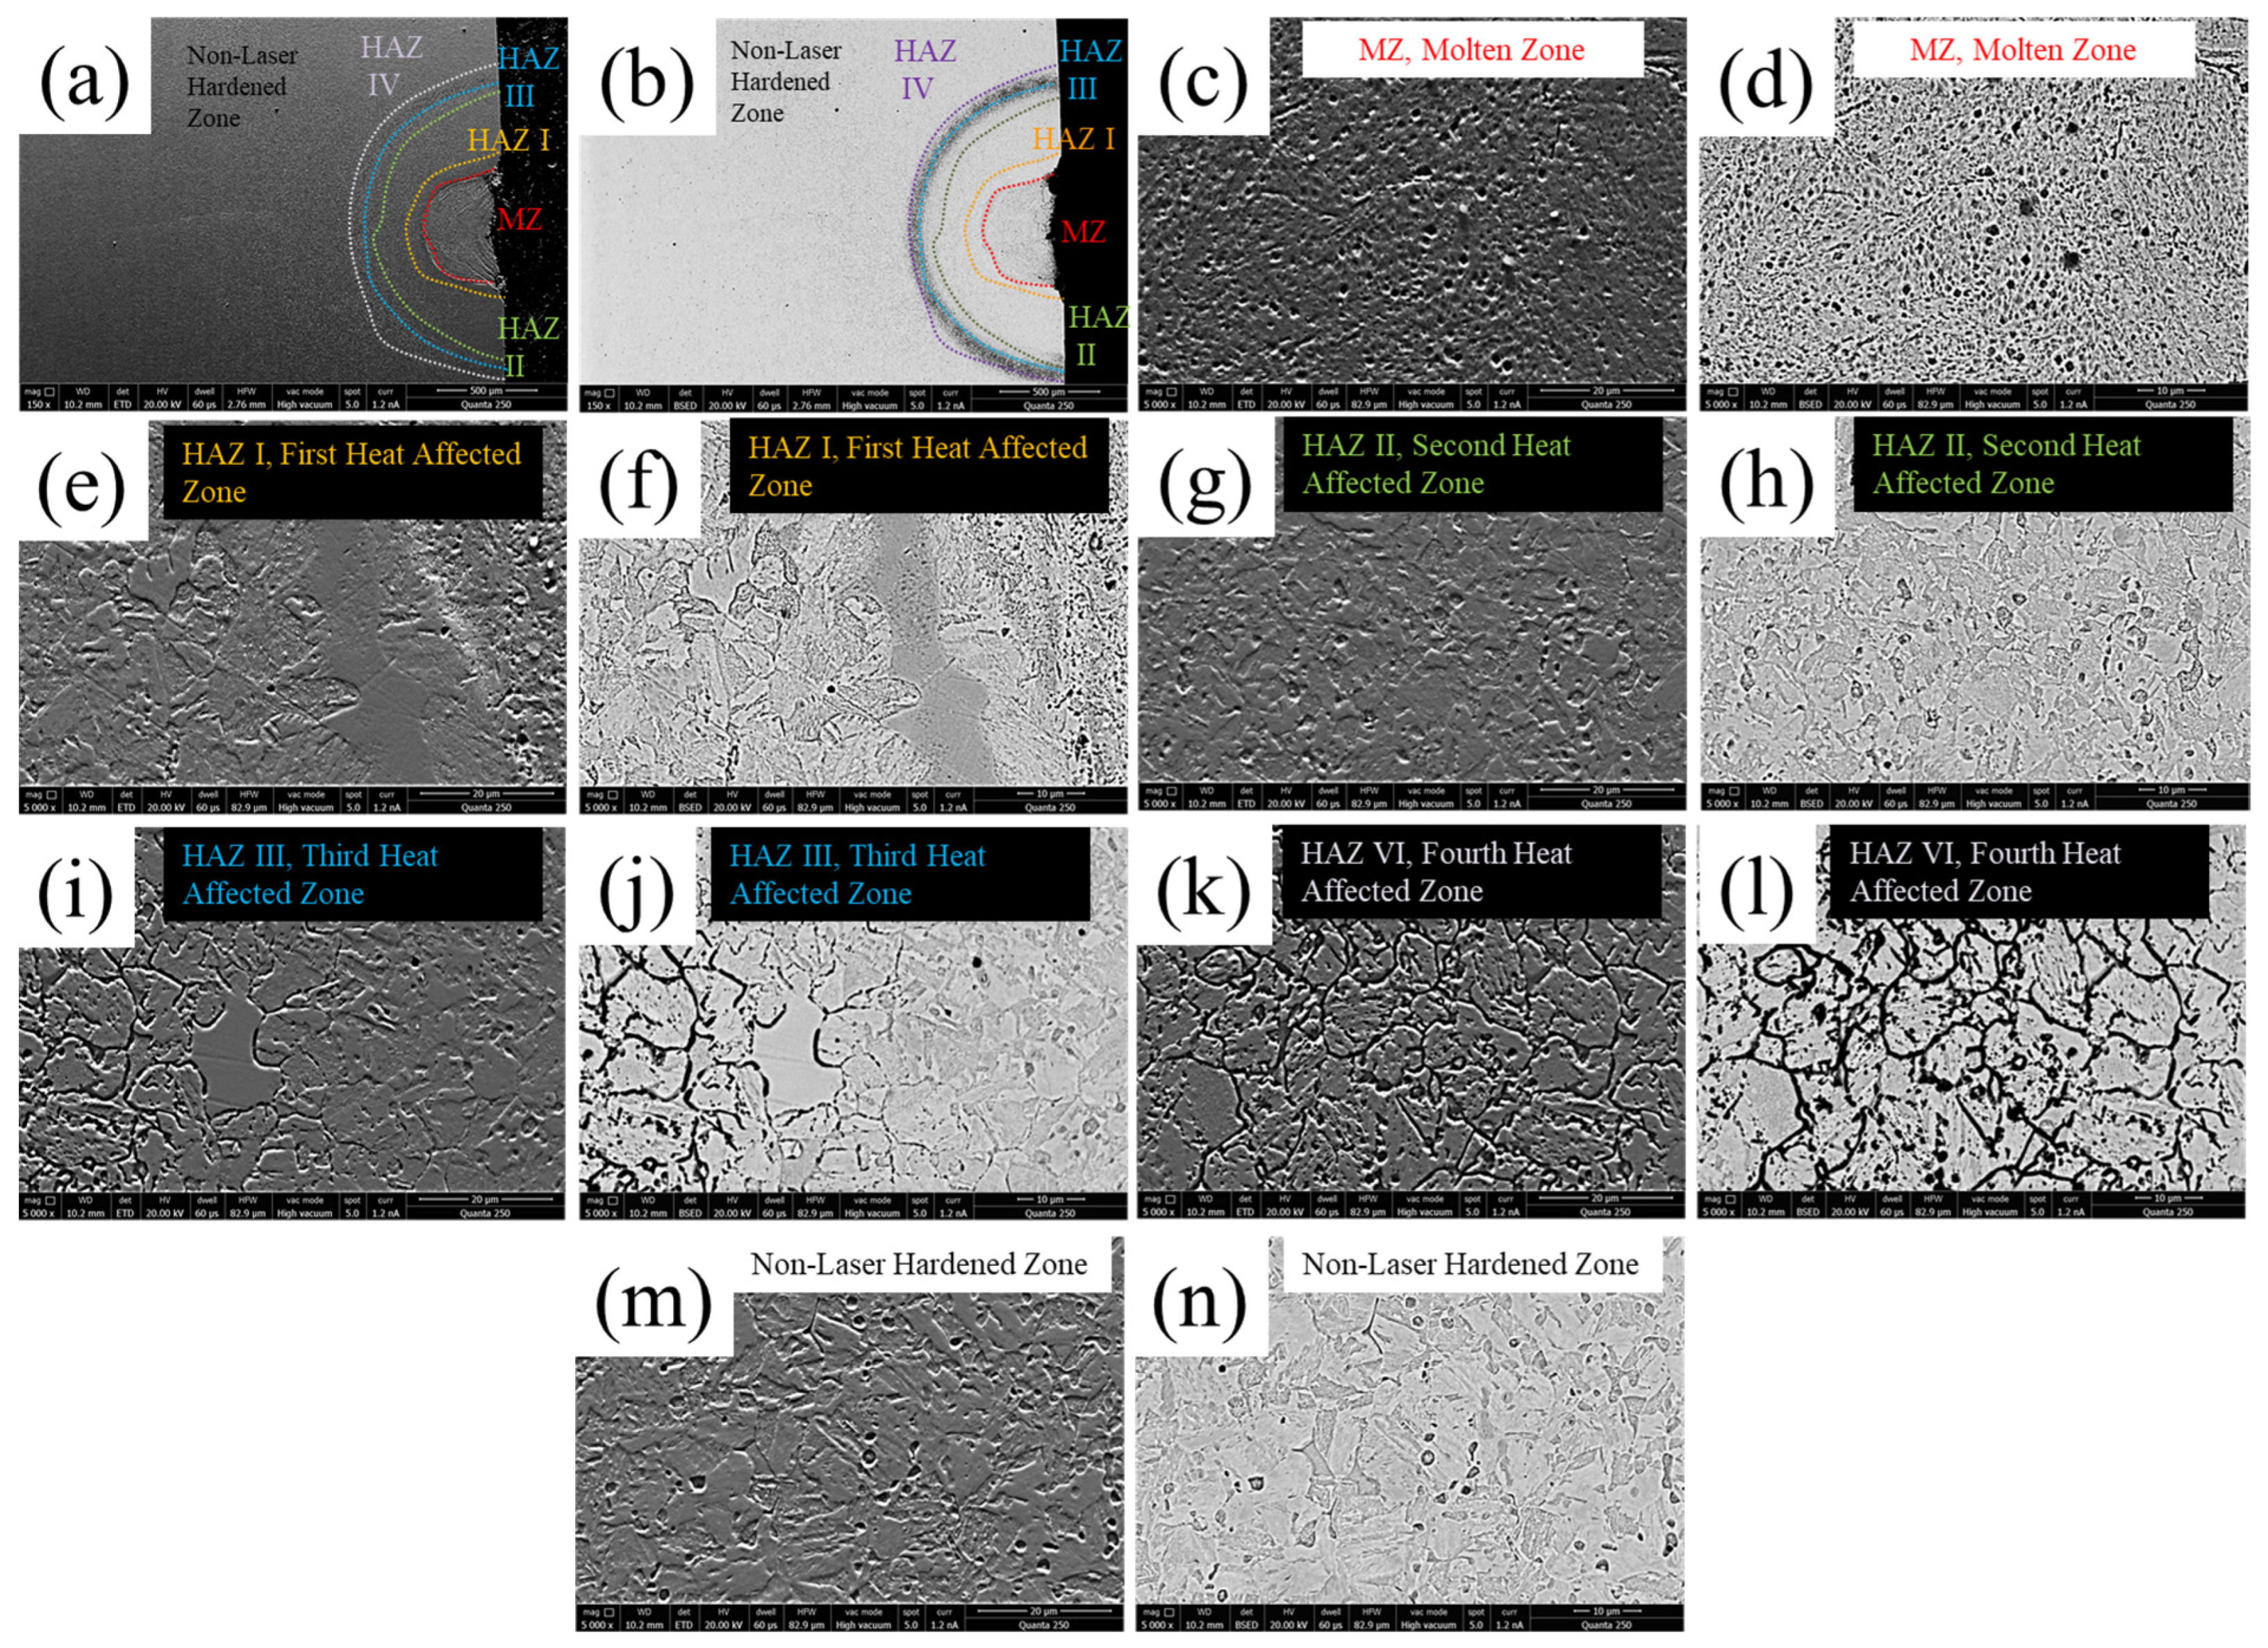
  • A continuous-wave fibre infrared laser can yield diverse microstructures within the same samples. By skilfully adjusting laser parameters, it is possible to design the specific microstructure of the bike rim material. The metallic material of the bike rim is identified as 420–410 stainless steel. Optimal conditions for achieving the maximum number of microstructures on a single sample involve utilizing the smallest defocused laser beam diameter and the slowest scan rate.
  • Comparatively, the refined microstructure found in the molten zone and in the thermally stressed zone (HAZ II) exhibits higher hardness than the original martensitic microstructure. Conversely, the presence of coarse microstructures and the accumulation of silicon and carbon (δ-ferritic) lead to diminished material hardness
  • The increase in laser scan overlap results in harder molten zones and HAZ II has up to 75% overlap. However, this condition triggers the formation of thermal cracks within these zones, leading to reduced hardness. Other laser-hardened zones, on the other hand, do not exhibit significant variations in hardness due to overlapping effects.
This study offers valuable insights into designing the microstructure of 420–410 stainless steel and provides guidance for selecting laser parameters to effectively harden commercial motorbike brake discs.

Author Contributions

All authors contributed to the study conception and design. The experiments, analysis and discussion of the results were developed by J.I.A.-T. The first draft of the manuscript was written by J.I.A.-T., and all authors commented on, and developed, subsequent versions of the manuscript. All authors have read and agreed to the published version of the manuscript.

Funding

The authors declare that no funds, grants, or other support were received during the preparation of this manuscript.

Data Availability Statement

The datasets generated during and/or analysed during the current study are available in the manuscript.

Conflicts of Interest

There are no conflicts of interest.

Nomenclature

Acronyms and Abbreviations:
EDSenergy-dispersive spectroscopy
HAZheat-affected zone
IRinfrared
SSscan speed
SEMscanning electron microscopy
Physical–Chemical Quantities:
d o theoretical focused laser beam diameter (μm)
F L focal length (m)
M 2 beam quality factor
λ wavelength(m)
D R laser beam raw diameter (mm)
D Z defocused laser beam diameter (μm)
R L Rayleigh length (mm)
O overlapping
L distance between single tracks (mm)
W single track width (μm)
E d energy density (kJ/cm2)
W m laser-molten surface width (μm)
E d ( t h - s m ) energy density threshold for surface melting (J/cm2)
MZmolten zone
HAZ Ifirst heat-affected zone
HAZ IIsecond heat-affected zone
HAZ IIIthird heat-affected zone
HAZ IVfourth heat-affected zone
T material temperature according to laser-processed depth (μm)
A laser radiation absorption of the material (%)
δ thermal conductivity of the material (J/K×cm2)
l T h e r thermal laser energy penetration (μm)
l depth of the laser-hardened zone (μm)
ε geometrical factor
σ thermal diffusivity (μm2/s)

References

  1. Moradi, M.; Ghorbani, D.; Moghadam, M.K.; Kazazi, M.; Rouzbahani, F.; Karazi, S. Nd: YAG laser hardening of AISI 410 stainless steel: Microstructural evaluation, mechanical properties, and corrosion behavior. J. Alloys Compd. 2019, 795, 213–222. [Google Scholar] [CrossRef]
  2. Moradi, M.; KaramiMoghadam, M. High power diode laser surface hardening of AISI 4130; statistical modelling and optimization. Opt. Laser Technol. 2019, 111, 554–570. [Google Scholar] [CrossRef]
  3. Dinesh Babu, P.; Balasubramanian, K.; Buvanashekaran, G. Laser surface hardening: A review. Int. J. Surf. Sci. Eng. 2011, 5, 131–151. [Google Scholar] [CrossRef]
  4. Molian, P.; Baldwin, M. Effects of single-pass laser heat treatment on erosion behavior of cast irons. Wear 1987, 118, 319–327. [Google Scholar] [CrossRef]
  5. Abboud, J.H.; Benyounis, K.; Olabi, A.; Hashmi, M. Laser surface treatments of iron-based substrates for automotive application. J. Mater. Process. Technol. 2007, 182, 427–431. [Google Scholar] [CrossRef]
  6. Sridhar, K.; Katkar, V.; Singh, P.; Haake, J. Dry sliding friction wear behaviour of high power diode laser hardened steels and cast iron. Surf. Eng. 2007, 23, 129–141. [Google Scholar] [CrossRef]
  7. Ion, J. Laser transformation hardening. Surf. Eng. 2002, 18, 14–31. [Google Scholar] [CrossRef]
  8. Liu, J.; Ye, C.; Dong, Y. Recent development of thermally assisted surface hardening techniques: A review. Adv. Ind. Manuf. Eng. 2021, 2, 100006. [Google Scholar] [CrossRef]
  9. Soady, K. Life assessment methodologies incoroporating shot peening process effects: Mechanistic consideration of residual stresses and strain hardening: Part 1—Effect of shot peening on fatigue resistance. Mater. Sci. Technol. 2013, 29, 637–651. [Google Scholar] [CrossRef]
  10. Rabiei, A.; Ghadami, F.; Malek, F. Microstructural characteristics and tribological properties of the localized laser surface treatment of AISI 420 stainless steel. Tribol. Int. 2023, 177, 107969. [Google Scholar] [CrossRef]
  11. Muthukumaran, G.; Dinesh Babu, P. Laser transformation hardening of various steel grades using different laser types. J. Braz. Soc. Mech. Sci. Eng. 2021, 43, 1–29. [Google Scholar] [CrossRef]
  12. Wang, Y.; Ma, E. Strain hardening, strain rate sensitivity, and ductility of nanostructured metals. Mater. Sci. Eng. A 2004, 375, 46–52. [Google Scholar] [CrossRef]
  13. Pinahin, I.; Chernigovskij, V.; Bracihin, A.; Yagmurov, M. Improvement of wear resistance of VK6, VK8, T5K10, and T15K6 hard alloys by volume pulsed laser hardening. J. Frict. Wear 2015, 36, 330–333. [Google Scholar] [CrossRef]
  14. Brown, M.S.; Arnold, C.B. Fundamentals of laser-material interaction and application to multiscale surface modification. In Laser Precision Microfabrication; Springer: Berlin/Heidelberg, Germany, 2010; pp. 91–120. [Google Scholar]
  15. Domke, M.; Nobile, L.; Rapp, S.; Eiselen, S.; Sotrop, J.; Huber, H.P.; Schmidt, M. Understanding thin film laser ablation: The role of the effective penetration depth and the film thickness. Phys. Procedia 2014, 56, 1007–1014. [Google Scholar] [CrossRef]
  16. Khorram, A.; Davoodi Jamaloei, A.; Jafari, A. Surface transformation hardening of Ti-5Al-2.5 Sn alloy by pulsed Nd: YAG laser: An experimental study. Int. J. Adv. Manuf. Technol. 2019, 100, 3085–3099. [Google Scholar] [CrossRef]
  17. Parker, K. Heat Treating with High Power Diode Lasers. Photonics 2017, 408, 764–4983. [Google Scholar]
  18. Liu, A.; Previtali, B. Laser surface treatment of grey cast iron by high power diode laser. Phys. Procedia 2010, 5, 439–448. [Google Scholar] [CrossRef]
  19. Monteiro, W.A.; Silva, E.; Silva, L.; de Rossi, W.; Buso, S. Microstructural and mechanical characterization of gray cast iron and AlSi alloy after laser beam hardening. Mater. Sci. Forum Trans Tech Publ. 2010, 638, 769–774. [Google Scholar] [CrossRef]
  20. Ganeev, R. Low-power laser hardening of steels. J. Mater. Process. Technol. 2002, 121, 414–419. [Google Scholar] [CrossRef]
  21. Maharjan, N.; Zhou, W.; Zhou, Y.; Guan, Y.; Wu, N. Comparative study of laser surface hardening of 50CrMo4 steel using continuous-wave laser and pulsed lasers with ms, ns, ps and fs pulse duration. Surf. Coat. Technol. 2019, 366, 311–320. [Google Scholar] [CrossRef]
  22. Somonov, V.; Tsibulskiy, I.; Mendagaliyev, R.; Akhmetov, A. Investigation of the Technological Possibility of Laser Hardening of Stainless Steel 14Cr17Ni2 to a Deep Depth of the Surface. Metals 2022, 12, 5. [Google Scholar] [CrossRef]
  23. Benyounis, K.; Fakron, O.; Abboud, J.; Olabi, A.; Hashmi, M. Surface melting of nodular cast iron by Nd-YAG laser and TIG. J. Mater. Process. Technol. 2005, 170, 127–132. [Google Scholar] [CrossRef]
  24. Tong, X.; Zhou, H.; Liu, M.; Dai, M.-J. Effects of striated laser tracks on thermal fatigue resistance of cast iron samples with biomimetic non-smooth surface. Mater. Des. 2011, 32, 796–802. [Google Scholar] [CrossRef]
  25. Al-Mahdy, A.; Kotadia, H.; Sharp, M.; Opoz, T.; Mullett, J.; Ahuir-Torres, J. Effect of Surface Roughness on the Surface Texturing of 316 l Stainless Steel by Nanosecond Pulsed Laser. Lasers Manuf. Mater. Process. 2023, 10, 141–164. [Google Scholar] [CrossRef]
  26. Wlodarczyk, K.L.; Ardron, M.; Waddie, A.J.; Dunn, A.; Kidd, M.D.; Weston, N.J.; Hand, D.P. Laser microsculpting for the generation of robust diffractive security markings on the surface of metals. J. Mater. Process. Technol. 2015, 222, 206–218. [Google Scholar] [CrossRef]
  27. Convert, L.; Bourillot, E.; François, M.; Pocholle, N.; Baras, F.; Politano, O.; Costil, S. Laser textured titanium surface characterization. Appl. Surf. Sci. 2022, 586, 152807. [Google Scholar] [CrossRef]
  28. Sola, D.; Conde, A.; García, I.; Gracia-Escosa, E.; De Damborenea, J.J.; Peña, J.I. Microstructural and wear behavior characterization of porous layers produced by pulsed laser irradiation in glass-ceramics substrates. Materials 2013, 6, 3963–3977. [Google Scholar] [CrossRef]
  29. Moradi, M.; Golchin, E. Investigation on the effects of process parameters on laser percussion drilling using finite element methodology; statistical modelling and optimization. Lat. Am. J. Solids Struct. 2017, 14, 464–484. [Google Scholar] [CrossRef]
  30. Oliveira, R.J.B.D.; Siqueira, R.H.M.D.; Lima, M.S.F.D. Microstructure and wear behaviour of laser hardened SAE 4130 steels. Int. J. Surf. Sci. Eng. 2018, 12, 161–170. [Google Scholar] [CrossRef]
  31. Demir, A.G.; Colombo, P.; Previtali, B. From pulsed to continuous wave emission in SLM with contemporary fiber laser sources: Effect of temporal and spatial pulse overlap in part quality. Int. J. Adv. Manuf. Technol. 2017, 91, 2701–2714. [Google Scholar] [CrossRef]
  32. E407-07 A; Standard Practice for Microetching Metals and Alloys. ASTM International: West Conshohocken, PA, USA, 2015.
  33. Suder, W.; Williams, S. Investigation of the effects of basic laser material interaction parameters in laser welding. J. Laser Appl. 2012, 24, 032009. [Google Scholar] [CrossRef]
  34. Heiderscheit, T.; Shen, N.; Wang, Q.; Samanta, A.; Wu, B.; Ding, H. Keyhole cutting of carbon fiber reinforced polymer using a long-duration nanosecond pulse laser. Opt. Lasers Eng. 2019, 120, 101–109. [Google Scholar] [CrossRef]
  35. Ahuir-Torres, J.; Sharp, M.; Bakradze, N.; Batako, A. Microstructural Design of the Cast Iron via Laser Hardening with Defocused Beam of the Continuous Wave CO2 Laser. J. Phys. Conf. Ser. IOP Publ. 2022, 2198, 012048. [Google Scholar] [CrossRef]
  36. Goldstein, J.I.; Newbury, D.E.; Michael, J.R.; Ritchie, N.W.; Scott, J.H.J.; Joy, D.C. Scanning Electron Microscopy and X-Ray Microanalysis; Springer: Berlin/Heidelberg, Germany, 2017. [Google Scholar]
  37. Zhang, Y.; Zhang, X.; Sheng, G.; Li, C.; Han, L.; Gu, J. Effect of ultra-fine martensite and retained austenite induced by slow quenching on the mechanical properties of 9Cr 1.5 Mo1Co (FB2) steel. Mater. Charact. 2021, 181, 111452. [Google Scholar] [CrossRef]
  38. Mabruri, E.; Pasaribu, R.R.; Sugandi, M.T.; Sunardi, S. Effect of high temperature tempering on the mechanical properties and microstructure of the modified 410 martensitic stainless steel. AIP Conf. Proc. Publ. 2018, 1964, 020032. [Google Scholar]
  39. Yang, Z.; Bauereiß, A.; Markl, M.; Körner, C. Modeling laser beam absorption of metal alloys at high temperatures for selective laser melting. Adv. Eng. Mater. 2021, 23, 2100137. [Google Scholar] [CrossRef]
  40. George, P.; Selvaraj, D.P. Cutting parameter optimization of CNC dry milling process of AISI 410 and 420 grade MSS. Mater. Today Proc. 2021, 42, 897–901. [Google Scholar] [CrossRef]
  41. Cui, C.; Cui, X.; Ren, X.; Qi, M.; Hu, J.; Wang, Y. Surface oxidation phenomenon and mechanism of AISI 304 stainless steel induced by Nd: YAG pulsed laser. Appl. Surf. Sci. 2014, 305, 817–824. [Google Scholar] [CrossRef]
  42. Yanez, A.; Alvarez, J.; Lopez, A.; Nicolas, G.; Perez, J.; Ramil, A.; Saavedra, E. Modelling of temperature evolution on metals during laser hardening process. Appl. Surf. Sci. 2002, 186, 611–616. [Google Scholar] [CrossRef]
  43. Hurtado-Delgado, E.; Huerta-Larumbe, L.; Miranda-Pérez, A.; Aguirre-Sánchez, Á. Microcracks reduction in laser hardened layers of ductile iron. Coatings 2021, 11, 368. [Google Scholar] [CrossRef]
  44. Moradi, M.; Fallah, M.M.; Jamshidi Nasab, S. Experimental study of surface hardening of AISI 420 martensitic stainless steel using high power diode laser. Trans. Indian Inst. Met. 2018, 71, 2043–2050. [Google Scholar] [CrossRef]
Figure 1. Sketch of the first (a) and second (b) step processes.
Jmmp 08 00018 g001
Figure 2. The micrographic pictures of the as-received (a) and laser-hardened surface with 1.0 mm/s (be), 5.0 mm/s (fi), 10 mm/s (jm), 20 mm/s (nq) and 40 mm/s (ru) at 0.5 mm (b,f,j,n,r), 1.0 mm (c,g,k,o,s), 2.0 mm (d,h,l,p,t) and 3.0 mm (e,i,m,q,u).
Jmmp 08 00018 g002
Figure 3. Graph of the laser-treated area width in function of the scan rate for each defocused laser beam diameter.
Jmmp 08 00018 g003
Figure 4. Scanning electron microscopy pictures with secondary (a,c,e,g,i,k,m) and backscattered (b,d,f,h,j,l,n) of the microstructure of the laser hardened samples at 1 mm/s with 1 mm, being full track (a,b), molten zone (MZ) (c,d), first heat affected zone (HAZ I) (e,f), second heat affected zone (HAZ II) (g,h), third heat affected zone (HAZ II) (i,j), fourth heat affected zone (HAZ IV) (k,l) and non-laser hardened zone (m,n).
Jmmp 08 00018 g004
Figure 5. Micrographs of the laser-hardened surface with 1.0 mm/s (ad), 5.0 mm/s (eh), 10 mm/s (ik), 20 mm/s (l,m) and 40 mm/s (n,o) at 0.5 mm (a,e,i,l,n), 1.0 mm (b,f,j,m,o), 2.0 mm (c,g,k) and 3.0 mm (d,h).
Jmmp 08 00018 g005
Figure 6. Width (a) and depth (b) of the laser hardened zones.
Jmmp 08 00018 g006
Figure 7. Thickness of the molten zone (a), first (b), second (c), third (d) and fourth (e) heat affected zone in function to defocused laser beam and scan rate.
Jmmp 08 00018 g007
Figure 8. Optical microscopy pictures of the laser hardened 402 stainless steel surfaces at 0% (a), 25% (b), 50% (c) and 75% (d) of overlapping at 200 W, 1.0 mm and 1 mm/s.
Jmmp 08 00018 g008
Figure 9. Optical microscopy pictures of the laser hardened sample cross-sections at 0% (a), 25% (b), 50% (c) and 75% (d) of overlapping at 200 W, 1.0 mm and 1 mm/s.
Jmmp 08 00018 g009
Figure 10. Hardness of the samples according to the depth (a) and microstructure kind (b).
Jmmp 08 00018 g010
Table 1. Selected continuous-wave laser parameters.
ParameterValue
Wavelength ,   λ (µm)1065 ± 5
ModeContinuous-Wave
TEM mode00
Focussing   lens   focal   length ,   F L (mm)125.00
Raw beam diameter, D R (mm)6.0
Beam   quality   factor ,   M 2 1.1
Scan   rate ,   S R (mm/s)1, 5, 10, 20 and 40
Rayleigh   length ,   R L (µm)650
Focus   beam   size ,   d o   (µm)≈32
Distance   from   focal   point ,   Z (mm)10.13520.30240.61960.93481.247
Defocused   laser   beam   diameter ,   D Z (µm)0.51.02.03.04.0
AtmosphereAir
Power, P (W)200
Overlapping ,   O (%)0, 25, 50 and 75
Table 2. Chemical composition of the microstructures and localizations found in laser-hardened samples at 1 mm and 1 mm/s.
ZoneMicrostructureConcentration (Atomic%)
FeCrMnSiOC
MZMatrix90.1 ± 0.88.4 ± 0.20.6 ± 0.10.9 ± 0.2--
Dark area78.0 ± 7.09.0 ± 1.00.7 ± 0.14.0 ± 2.011.0 ± 7.0-
HAZ IGrain83.6 ± 0.413.6 ± 0.31.7 ± 0.21.1 ± 0.1--
HAZ IIGrain83.5 ± 0.213.5 ± 0.11.7 ± 0.11.3 ± 0.1--
Black area75.0 ± 10.014.0 ± 2.02.0 ± 0.42.0 ± 1.07.0 ± 3.0-
HAZ IIIGrain82.7 ± 0.813.6 ± 0.11.7 ± 0.32.0 ± 1.0--
Grain boundary62.8 ± 0.810.9 ± 0.51.3 ± 0.35.0 ± 1.08.0 ± 1.012.0 ± 1.0
HAZ IVGrain72.0 ± 1.012.1 ± 0.51.5 ± 0.56.4 ± 0.68.0 ± 0.7-
Grain boundary51.0 ± 5.09.0 ± 2.01.1 ± 0.111.0 ± 1.013.0 ± 0.415.0 ± 5.4
Non-Laser HardenedGrain83.4 ± 0.413.6 ± 0.21.6 ± 0.11.4 ± 0.3--
Grey area75.9 ± 0.416.0 ± 1.01.5 ± 0.12.6 ± 0.34.0 ± 0.6
Disclaimer/Publisher’s Note: The statements, opinions and data contained in all publications are solely those of the individual author(s) and contributor(s) and not of MDPI and/or the editor(s). MDPI and/or the editor(s) disclaim responsibility for any injury to people or property resulting from any ideas, methods, instructions or products referred to in the content.

