
Remote Sensing Using Unmanned Aerial Vehicles for Water Stress Detection: A Review Focusing on Specialty Crops


Abstract
1. Introduction
2. Materials and Methods
3. Water Stress Management
3.1. Thermal Imaging
3.2. Multispectral
3.3. Hyperspectral
3.4. Fusion Approach
4. Future Work
5. Conclusions
Author Contributions
Funding
Conflicts of Interest
Acronyms
| ANN | Artificial Neural Network |
| ARVI | Atmospherically Resistant Vegetation Index |
| BGI | Blue–Green Index |
| C_area | Canopy Top-View Area |
| CARS-PLS | Competitive Adaptive Reweighted Sampling-Partial Least Squares |
| Chl-a | Chlorophyll a |
| Chl-b | Chlorophyll b |
| CIrededge | Chlorophyll Index at Red Edge |
| COR | Correlation |
| CUM_NDVI | Cumulative NDVI |
| CWSI | Crop Water Stress Index |
| DDD | Drought Damage Degree |
| DVI | Difference Vegetation Index |
| DRZ | Direct Root Zone |
| EL | Electrolyte Leakage |
| ENDVI | Enhanced NDVI |
| Fv/Fm | Maximum Efficiency of Photosystem II |
| G | Greenness Index |
| GBM | Gradient Boosting Machine |
| GC | Stomatal Conductance |
| GI | Greenness Index |
| GRVI | Green Ratio Vegetation Index |
| GNDVI | Green NDVI |
| Kc | Crop Coefficients |
| KNR | Support Vector Regression |
| MDA | Malondialdehyde |
| MCARI | Modified Chlorophyll Absorption in Reflectance Index |
| MOD_NDVI | Modified NDVI |
| MOD_RSRI | Modified Red Edge SRI |
| MSAVI | Modified Soil-Adjusted Vegetation Index |
| MSR | Modified Simple Ratio |
| MTVI | Modified Triangular Vegetation Index |
| MDA | Malondialdehyde |
| NDGI | Normalized Difference Greenness Index |
| NDRE | Normalized Difference Red Edge Index |
| NDVI | Normalized Difference Vegetation Index |
| NIR | Near-Infrared |
| NWSE | Non-Water-Stressed Baseline |
| OSAVI | Optimized Soil-Adjusted Vegetation Index |
| PCA | Principal Component Analysis |
| P_height | Plant Height |
| PLS | Partial Least Squares |
| PRI | Photochemical Reflectance Index |
| PSNDa | Pigment-Specific Normalized Difference for Chlorophyll A |
| PSNDb | Pigment-Specific Normalized Difference for Chlorophyll B |
| PSSRa | Pigment-Specific Simple Ratio for Chlorophyll A |
| PSSRb | Pigment-Specific Simple Ratio for Chlorophyll B |
| PSRI | Plant senescence reflectance index |
| ΨL | Leaf Water Potential |
| ΨSTEM | Stem Water Potential |
| RBF | Radial Basis Function |
| RDVI | Renormalized Difference Vegetation Index |
| REGI | Red Edge Green Normalized Difference Index |
| RF | Random Forest |
| RGRI | Red–Green Ratio Index |
| RNDVI | Red Edge NDVI |
| RVI | Ratio Vegetation Index |
| RVSI | Red Edge Vegetation Stress Index |
| SAVI | Soil-Adjusted Vegetation Index |
| SCN | Stochastic Configuration Networks |
| SEC | Second Moment |
| SHD | Super High-Density |
| SPA + RF | Successive Projections Algorithm + Random Forest |
| SR | Simple Ratio |
| SRGREEN | Simple Ratio Green |
| SRI | Simple Ratio Index |
| SS | Soluble Saccharide |
| SVR | support vector regression |
| SWIR | Shortwave Infrared |
| TCARI/OSAVI | Transformed Chlorophyll Absorption in Reflectance Index/Optimized Soil-Adjusted Vegetation Index |
| TVI | Triangular Vegetation Index |
| UAS | Unmanned Aerial System |
| UAV | Unmanned Aerial Vehicle |
| UVE + SVM | Uninformative Variable Elimination + Support Vector Machine |
| VPD | Vapor Pressure Deficit |
| VDVI | Visible Band Difference Vegetation Index |
| VOG REI | Vogelmann RedEdge Index |
| WI | Water Index |
| ZM | R750/R710 |
References
- Payne, W.Z.; Kurouski, D. Raman-Based Diagnostics of Biotic and Abiotic Stresses in Plants. A Review. Front. Plant Sci. 2021, 11, 616672. [Google Scholar] [CrossRef]
- Hunter, M.C.; Smith, R.G.; Schipanski, M.E.; Atwood, L.W.; Mortensen, D.A. Agriculture in 2050: Recalibrating Targets for Sustainable Intensification. Bioscience 2017, 67, 386–391. [Google Scholar] [CrossRef]
- United Nations. World Population Prospects 2019: Highlights; United Nations: New York, NY, USA, 2019. [Google Scholar]
- Pisante, M.; Stagnari, F.; Grant, C.A. Agricultural Innovations for Sustainable Crop Production Intensification. Ital. J. Agron. 2012, 7, e40. [Google Scholar] [CrossRef]
- Tsouros, D.C.; Bibi, S.; Sarigiannidis, P.G. A review on UAV-based applications for precision agriculture. Information 2019, 10, 349. [Google Scholar] [CrossRef]
- Barbedo, J.G.A. Detection of nutrition deficiencies in plants using proximal images and machine learning: A review. Comput. Electron. Agric. 2019, 162, 482–492. [Google Scholar] [CrossRef]
- Botvich, I.; Shevyrnogov, A.; Emelyanov, D. Crop Yield Map Development Based on Satellite and UAV Data. E3S Web Conf. 2021, 333, 01001. [Google Scholar] [CrossRef]
- Abdulridha, J.; Ampatzidis, Y.; Kakarla, S.C.; Roberts, P. Detection of target spot and bacterial spot diseases in tomato using UAV-based and benchtop-based hyperspectral imaging techniques. Precis. Agric. 2020, 21, 955–978. [Google Scholar] [CrossRef]
- Camino, C.; González-Dugo, V.; Hernández, P.; Sillero, J.; Zarco-Tejada, P.J. Improved nitrogen retrievals with airborne-derived fluorescence and plant traits quantified from VNIR-SWIR hyperspectral imagery in the context of precision agriculture. Int. J. Appl. Earth Obs. Geoinf. 2018, 70, 105–117. [Google Scholar] [CrossRef]
- Galieni, A.; D’Ascenzo, N.; Stagnari, F.; Pagnani, G.; Xie, Q.; Pisante, M. Past and Future of Plant Stress Detection: An Overview From Remote Sensing to Positron Emission Tomography. Front. Plant Sci. 2021, 11, 609155. [Google Scholar] [CrossRef]
- Gago, J.; Douthe, C.; Coopman, R.; Gallego, P.; Ribas-Carbo, M.; Flexas, J.; Escalona, J.; Medrano, H. UAVs challenge to assess water stress for sustainable agriculture. Agric. Water Manag. 2015, 153, 9–19. [Google Scholar] [CrossRef]
- Barbedo, J.G.A. A review on the use of unmanned aerial vehicles and imaging sensors for monitoring and assessing plant stresses. Drones 2019, 3, 40. [Google Scholar] [CrossRef]
- Awais, M.; Li, W.; Cheema, M.J.M.; Zaman, Q.U.; Shaheen, A.; Aslam, B.; Zhu, W.; Ajmal, M.; Faheem, M.; Hussain, S.; et al. UAV-based remote sensing in plant stress imagine using high-resolution thermal sensor for digital agriculture practices: A meta-review. Int. J. Environ. Sci. Technol. 2023, 20, 1135–1152. [Google Scholar] [CrossRef]
- Dong, H.; Dong, J.; Sun, S.; Bai, T.; Zhao, D.; Yin, Y.; Shen, X.; Wang, Y.; Zhang, Z.; Wang, Y. Crop water stress detection based on UAV remote sensing systems. Agric. Water Manag. 2024, 303, 109059. [Google Scholar] [CrossRef]
- Al-Tamimi, N.; Langan, P.; Bernád, V.; Walsh, J.; Mangina, E.; Negrão, S. Capturing crop adaptation to abiotic stress using image-based technologies. Open Biol. 2022, 12, 210353. [Google Scholar] [CrossRef]
- Jafarbiglu, H.; Pourreza, A. A comprehensive review of remote sensing platforms, sensors, and applications in nut crops. Comput. Electron. Agric. 2022, 197, 106844. [Google Scholar] [CrossRef]
- 2022 Census of Agriculture: Most U.S. Counties with High Concentration of Specialty Crop Farms Are Located Along Coasts. Available online: http://www.ers.usda.gov/data-products/chart-gallery/gallery/chart-detail/?chartId=109079 (accessed on 1 October 2024).
- Fedosov, A.Y.; Menshikh, A.M.; Ivanova, M.A. Deficient irrigation of vegetable crops. Veg. Crop. Russ. 2022, 44–49. [Google Scholar] [CrossRef]
- Ben Ammar, H.; Arena, D.; Treccarichi, S.; Di Bella, M.C.; Marghali, S.; Ficcadenti, N.; Scalzo, R.L.; Branca, F. The Effect of Water Stress on the Glucosinolate Content and Profile: A Comparative Study on Roots and Leaves of Brassica oleracea L. Crops. Agronomy 2023, 13, 579. [Google Scholar] [CrossRef]
- Tao, H.; Sun, H.; Wang, Y.; Wang, X.; Guo, Y. Effects of water stress on quality and sugar metabolism in ‘Gala’ apple fruit. Hortic. Plant J. 2023, 9, 60–72. [Google Scholar] [CrossRef]
- Iqbal, B.; Hussain, F.; Khan, M.S.; Iqbal, T.; Shah, W.; Ali, B.; Al Syaad, K.M.; Ercisli, S. Physiology of gamma-aminobutyric acid treated Capsicum annuum L. (Sweet pepper) under induced drought stress. PLoS ONE 2023, 18, e0289900. [Google Scholar] [CrossRef]
- Nemeskéri, E.; Helyes, L. Physiological responses of selected vegetable crop species to water stress. Agronomy 2019, 9, 447. [Google Scholar] [CrossRef]
- Gautam, D.; Pagay, V. A review of current and potential applications of remote sensing to study thewater status of horticultural crops. Agronomy 2020, 10, 140. [Google Scholar] [CrossRef]
- Ferreira, C.S.S.; Soares, P.R.; Guilherme, R.; Vitali, G.; Boulet, A.; Harrison, M.T.; Malamiri, H.; Duarte, A.C.; Kalantari, Z.; Ferreira, A.J.D. Sustainable Water Management in Horticulture: Problems, Premises, and Promises. Horticulturae 2024, 10, 951. [Google Scholar] [CrossRef]
- Gerhards, M.; Schlerf, M.; Mallick, K.; Udelhoven, T. Challenges and future perspectives of multi-/Hyperspectral thermal infrared remote sensing for crop water-stress detection: A review. Remote Sens. 2019, 11, 1240. [Google Scholar] [CrossRef]
- Hutton, R.; Loveys, B. A partial root zone drying irrigation strategy for citrus—Effects on water use efficiency and fruit characteristics. Agric. Water Manag. 2011, 98, 1485–1496. [Google Scholar] [CrossRef]
- Khanal, S.; Fulton, J.; Shearer, S. An overview of current and potential applications of thermal remote sensing in precision agriculture. Comput. Electron. Agric. 2017, 139, 22–32. [Google Scholar] [CrossRef]
- Agam, N.; Segal, E.; Peeters, A.; Levi, A.; Dag, A.; Yermiyahu, U.; Ben-Gal, A. Spatial distribution of water status in irrigated olive orchards by thermal imaging. Precis. Agric. 2014, 15, 346–359. [Google Scholar] [CrossRef]
- Egea, G.; Padilla-Díaz, C.M.; Martinez-Guanter, J.; Fernández, J.E.; Pérez-Ruiz, M. Assessing a crop water stress index derived from aerial thermal imaging and infrared thermometry in super-high density olive orchards. Agric. Water Manag. 2017, 187, 210–221. [Google Scholar] [CrossRef]
- Di Gennaro, S.F.; Matese, A.; Gioli, B.; Toscano, P.; Zaldei, A.; Palliotti, A.; Genesio, L. Multisensor approach to assess vineyard thermal dynamics combining high-resolution unmanned aerial vehicle (UAV) remote sensing and wireless sensor network (WSN) proximal sensing. Sci. Hortic. 2017, 221, 83–87. [Google Scholar] [CrossRef]
- Pou, A.; Diago, M.P.; Medrano, H.; Baluja, J.; Tardaguila, J. Validation of thermal indices for water status identification in grapevine. Agric. Water Manag. 2014, 134, 60–72. [Google Scholar] [CrossRef]
- Gómez-Candón, D.; Virlet, N.; Labbé, S.; Jolivot, A.; Regnard, J.-L. Field phenotyping of water stress at tree scale by UAV-sensed imagery: New insights for thermal acquisition and calibration. Precis. Agric. 2016, 17, 786–800. [Google Scholar] [CrossRef]
- Ludovisi, R.; Tauro, F.; Salvati, R.; Khoury, S.; Mugnozza, G.S.; Harfouche, A. Uav-based thermal imaging for high-throughput field phenotyping of black poplar response to drought. Front. Plant Sci. 2017, 8, 1681. [Google Scholar] [CrossRef]
- Gerhards, M.; Schlerf, M.; Rascher, U.; Udelhoven, T.; Juszczak, R.; Alberti, G.; Miglietta, F.; Inoue, Y. Analysis of airborne optical and thermal imagery for detection of water stress symptoms. Remote Sens. 2018, 10, 1139. [Google Scholar] [CrossRef]
- Park, S.; Nolan, A.; Ryu, D.; Fuentes, S.; Hernandez, E.; Chung, H.; O’connell, M. Estimation of crop water stress in a nectarine orchard using high-resolution imagery from unmanned aerial vehicle (UAV). In Proceedings of the 21st International Congress on Modelling and Simulation, Gold Coast, Australia, 29 November–4 December 2015; Volume 29. [Google Scholar]
- Santesteban, L.G.; Di Gennaro, S.F.; Herrero-Langreo, A.; Miranda, C.; Royo, J.B.; Matese, A. High-resolution UAV-based thermal imaging to estimate the instantaneous and seasonal variability of plant water status within a vineyard. Agric. Water Manag. 2017, 183, 49–59. [Google Scholar] [CrossRef]
- Bellvert, J.; Zarco-Tejada, P.J.; Girona, J.; Fereres, E. Mapping crop water stress index in a ‘Pinot-noir’; vineyard: Comparing ground measurements with thermal remote sensing imagery from an unmanned aerial vehicle. Precis. Agric. 2014, 15, 361–376. [Google Scholar] [CrossRef]
- Bellvert, J.; Zarco-Tejada, P.J.; Marsal, J.; Girona, J.; González-Dugo, V.; Fereres, E. Vineyard irrigation scheduling based on airborne thermal imagery and water potential thresholds. Aust. J. Grape Wine Res. 2016, 22, 307–315. [Google Scholar] [CrossRef]
- González-Dugo, V.; Goldhamer, D.; Zarco-Tejada, P.J.; Fereres, E. Improving the precision of irrigation in a pistachio farm using an unmanned airborne thermal system. Irrig. Sci. 2015, 33, 43–52. [Google Scholar] [CrossRef]
- Ramírez-Cuesta, J.; Ortuño, M.; Gonzalez-Dugo, V.; Zarco-Tejada, P.; Parra, M.; Rubio-Asensio, J.; Intrigliolo, D. Assessment of peach trees water status and leaf gas exchange using on-the-ground versus airborne-based thermal imagery. Agric. Water Manag. 2022, 267, 107628. [Google Scholar] [CrossRef]
- Sandholt, I.; Rasmussen, K.; Andersen, J. A simple interpretation of the surface temperature/vegetation index space for assessment of surface moisture status. Remote Sens. Environ. 2002, 79, 213–224. [Google Scholar] [CrossRef]
- Moran, M.; Clarke, T.; Inoue, Y.; Vidal, A. Estimating crop water deficit using the relation between surface-air temperature and spectral vegetation index. Remote Sens. Environ. 1994, 49, 246–263. [Google Scholar] [CrossRef]
- Gao, B.-C. NDWI—A normalized difference water index for remote sensing of vegetation liquid water from space. Remote Sens. Environ. 1996, 58, 257–266. [Google Scholar] [CrossRef]
- Zarco-Tejada, P.J.; Gonzalez-Dugo, V.; Williams, L.E.; Suárez, L.; Berni, J.A.J.; Goldhamer, D.; Fereres, E. A PRI-based water stress index combining structural and chlorophyll effects: Assessment using diurnal narrow-band airborne imagery and the CWSI thermal index. Remote Sens. Environ. 2013, 138, 38–50. [Google Scholar] [CrossRef]
- Park, S.; Ryu, D.; Fuentes, S.; Chung, H.; Hernández-Montes, E.; O’connell, M. Adaptive estimation of crop water stress in nectarine and peach orchards using high-resolution imagery from an unmanned aerial vehicle (UAV). Remote Sens. 2017, 9, 828. [Google Scholar] [CrossRef]
- Gonzalez-Dugo, V.; Zarco-Tejada, P.; Nicolás, E.; Nortes, P.A.; Alarcón, J.J.; Intrigliolo, D.S.; Fereres, E. Using high resolution UAV thermal imagery to assess the variability in the water status of five fruit tree species within a commercial orchard. Precis. Agric. 2013, 14, 660–678. [Google Scholar] [CrossRef]
- Poblete-Echeverría, C.; Sepulveda-Reyes, D.; Ortega-Farias, S.; Zuñiga, M.; Fuentes, S. Plant water stress detection based on aerial and terrestrial infrared thermography: A study case from vineyard and olive orchard. In Proceedings of the XXIX International Horticultural Congress on Horticulture: Sustaining Lives, Livelihoods and Landscapes (IHC2014), Brisbane, Australia, 17 August 2014; Volume 1112, pp. 141–146. [Google Scholar]
- Mokari, E.; Samani, Z.; Heerema, R.; Dehghan-Niri, E.; DuBois, D.; Ward, F.; Pierce, C. Development of a new UAV-thermal imaging based model for estimating pecan evapotranspiration. Comput. Electron. Agric. 2022, 194, 106752. [Google Scholar] [CrossRef]
- Govender, M.; Govender, P.; Weiersbye, I.; Witkowski, E.; Ahmed, F. Review of commonly used remote sensing and ground-based technologies to measure plant water stress. Water SA 2009, 35. [Google Scholar] [CrossRef]
- Baluja, J.; Diago, M.P.; Balda, P.; Zorer, R.; Meggio, F.; Morales, F.; Tardaguila, J. Assessment of vineyard water status variability by thermal and multispectral imagery using an unmanned aerial vehicle (UAV). Irrig. Sci. 2012, 30, 511–522. [Google Scholar] [CrossRef]
- Ballester, C.; Zarco-Tejada, P.J.; Nicolás, E.; Alarcón, J.J.; Fereres, E.; Intrigliolo, D.S.; Gonzalez-Dugo, V. Evaluating the performance of xanthophyll, chlorophyll and structure-sensitive spectral indices to detect water stress in five fruit tree species. Precis. Agric. 2018, 19, 178–193. [Google Scholar] [CrossRef]
- Gautam, D.; Ostendorf, B.; Pagay, V. Estimation of grapevine crop coefficient using a multispectral camera on an unmanned aerial vehicle. Remote Sens. 2021, 13, 2639. [Google Scholar] [CrossRef]
- Zhao, T.; Doll, D.; Wang, D.; Chen, Y. A New Framework for UAV-based Remote Sensing Data Processing and Its Application in Almond Water Stress Quantification. In Proceedings of the 2017 International Conference on Unmanned Aircraft Systems (ICUAS 2017), Miami, FL, USA, 13–16 June 2017; pp. 1794–1799. [Google Scholar] [CrossRef]
- Romero, M.; Luo, Y.; Su, B.; Fuentes, S. Vineyard water status estimation using multispectral imagery from an UAV platform and machine learning algorithms for irrigation scheduling management. Comput. Electron. Agric. 2018, 147, 109–117. [Google Scholar] [CrossRef]
- Xie, J.; Chen, Y.; Yu, Z.; Wang, J.; Liang, G.; Gao, P.; Sun, D.; Wang, W.; Shu, Z.; Yin, D.; et al. Estimating stomatal conductance of citrus under water stress based on multispectral imagery and machine learning methods. Front. Plant Sci. 2023, 14, 1054587. [Google Scholar] [CrossRef]
- Soubry, I.; Patias, P.; Tsioukas, V. Monitoring vineyards with UAV and multi-sensors for the assessment of water stress and grape maturity. J. Unmanned Veh. Syst. 2017, 5, 37–50. [Google Scholar] [CrossRef]
- Espinoza, C.Z.; Khot, L.R.; Sankaran, S.; Jacoby, P.W. High resolution multispectral and thermal remote sensing-based water stress assessment in subsurface irrigated grapevines. Remote Sens. 2017, 9, 961. [Google Scholar] [CrossRef]
- Matese, A.; Di Gennaro, S.F. Practical applications of a multisensor UAV platform based on multispectral, thermal and RGB high resolution images in precision viticulture. Agriculture 2018, 8, 116. [Google Scholar] [CrossRef]
- Tang, Z.; Jin, Y.; Alsina, M.M.; McElrone, A.J.; Bambach, N.; Kustas, W.P. Vine water status mapping with multispectral UAV imagery and machine learning. Irrig. Sci. 2022, 40, 715–730. [Google Scholar] [CrossRef]
- Carter, G.A. Primary and secondary effects of water content on the spectral reflectance of leaves. Am. J. Bot. 1991, 78, 916–924. [Google Scholar] [CrossRef]
- Ahmad, U.; Alvino, A.; Marino, S. A review of crop water stress assessment using remote sensing. Remote Sens. 2021, 13, 4155. [Google Scholar] [CrossRef]
- Zhao, T.; Stark, B.; Chen, Y.Q.; Ray, A.L.; Doll, D. Challenges in Water Stress Quantification Using Small Unmanned Aerial System (sUAS): Lessons from a Growing Season of Almond. J. Intell. Robot. Syst. 2017, 88, 721–735. [Google Scholar] [CrossRef]
- Zhang, L.; Zhang, H.; Niu, Y.; Han, W. Mapping maizewater stress based on UAV multispectral remote sensing. Remote Sens. 2019, 11, 605. [Google Scholar] [CrossRef]
- Kandylakis, Z.; Falagas, A.; Karakizi, C.; Karantzalos, K. Water Stress Estimation in Vineyards from Aerial SWIR and multispectral UAV data. Remote Sens. 2020, 12, 2499. [Google Scholar] [CrossRef]
- Berry, A.; Vivier, M.A.; Poblete-Echeverría, C. Evaluation of canopy fraction-based vegetation indices, derived from multispectral UAV imagery, to map water status variability in a commercial vineyard. Irrig. Sci. 2024, 43, 135–153. [Google Scholar] [CrossRef]
- Poblete, T.; Ortega-Farías, S.; Ryu, D. Automatic coregistration algorithm to remove canopy shaded pixels in UAV-borne thermal images to improve the estimation of crop water stress index of a drip-irrigated cabernet sauvignon vineyard. Sensors 2018, 18, 397. [Google Scholar] [CrossRef]
- Niu, H.; Zhao, T.; Wang, D.; Chen, Y. Estimating Evapotranspiration of Pomegranate Trees Using Stochastic Configuration Networks (SCN) and UAV Multispectral Imagery. J. Intell. Robot. Syst. 2022, 104, 66. [Google Scholar] [CrossRef]
- Mwinuka, P.R.; Mbilinyi, B.P.; Mbungu, W.B.; Mourice, S.K.; Mahoo, H.; Schmitter, P. The feasibility of hand-held thermal and UAV-based multispectral imaging for canopy water status assessment and yield prediction of irrigated African eggplant (Solanum aethopicum L). Agric. Water Manag. 2021, 245, 106584. [Google Scholar] [CrossRef]
- Stagakis, S.; González-Dugo, V.; Cid, P.; Guillén-Climent, M.; Zarco-Tejada, P. Monitoring water stress and fruit quality in an orange orchard under regulated deficit irrigation using narrow-band structural and physiological remote sensing indices. ISPRS J. Photogramm. Remote Sens. 2012, 71, 47–61. [Google Scholar] [CrossRef]
- Tang, Z.; Jin, Y.; Brown, P.H.; Park, M. Estimation of tomato water status with photochemical reflectance index and machine learning: Assessment from proximal sensors and UAV imagery. Front. Plant Sci. 2023, 14, 1057733. [Google Scholar] [CrossRef]
- Zovko, M.; Žibrat, U.; Knapič, M.; Kovačić, M.B.; Romić, D. Hyperspectral remote sensing of grapevine drought stress. Precis. Agric. 2019, 20, 335–347. [Google Scholar] [CrossRef]
- Loggenberg, K.; Strever, A.; Greyling, B.; Poona, N. Modelling water stress in a Shiraz vineyard using hyperspectral imaging and machine learning. Remote Sens. 2018, 10, 202. [Google Scholar] [CrossRef]
- Laroche-Pinel, E.; Albughdadi, M.; Duthoit, S.; Chéret, V.; Rousseau, J.; Clenet, H. Understanding vine hyperspectral signature through different irrigation plans: A first step to monitor vineyard water status. Remote Sens. 2021, 13, 536. [Google Scholar] [CrossRef]
- Izzo, R.R.; Lakso, A.N.; Marcellus, E.; Bauch, T.; Raqueño, N.; van Aardt, J. An initial analysis of real-time sUAS-based detection of grapevine water status in the Finger Lakes wine country of upstate New York. In Autonomous Air and Ground Sensing Systems for Agricultural Optimization and Phenotyping IV; Thomasson, J.A., McKee, M., Moorhead, R.J., Eds.; SPIE: Bellingham, WA, USA, 2019; p. 35. [Google Scholar] [CrossRef]
- Amatya, S.; Karkee, M.; Alva, A.K.; Larbi, P.; Adhikari, B.; Dallas, H.A. Hyperspectral Imaging for Detecting Water Stress in Potatoes. In Proceedings of the 2012 ASABE Annual International Meeting, Dallas, TX, USA, 29 July–1 August 2012; American Society of Agricultural and Biological Engineers: St. Joseph, MI, USA, 2012. [Google Scholar]
- Elsayed, S.; Mistele, B.; Schmidhalter, U. Can changes in leaf water potential be assessed spectrally? Funct. Plant Biol. 2011, 38, 523–533. [Google Scholar] [CrossRef]
- Burnett, A.C.; Serbin, S.P.; Davidson, K.J.; Ely, K.S.; Rogers, A. Detection of the metabolic response to drought stress using hyperspectral reflectance. J. Exp. Bot. 2021, 72, 6474–6489. [Google Scholar] [CrossRef]
- Penuelas, J.; Pinol, J.; Ogaya, R.; Filella, I. Estimation of plant water concentration by the reflectance Water Index WI (R900/R970). Int. J. Remote Sens. 1997, 18, 2869–2875. [Google Scholar] [CrossRef]
- Sims, D.A.; Gamon, J.A. Estimation of vegetation water content and photosynthetic tissue area from spectral reflectance: A comparison of indices based on liquid water and chlorophyll absorption features. Remote Sens. Environ. 2003, 84, 526–537. [Google Scholar] [CrossRef]
- Sims, D.A.; A Gamon, J. Relationships between leaf pigment content and spectral reflectance across a wide range of species, leaf structures and developmental stages. Remote Sens. Environ. 2002, 81, 337–354. [Google Scholar] [CrossRef]
- Kim, N.Y.; Glenn, N.D.M.; Park, J.; Ngugi, H.K.; Lehman, N.B.L. Hyperspectral Image Analysis for Plant Stress Detection. In Proceedings of the 2010 ASABE Annual International Meeting, Pittsburgh, PA, USA 20–23 June 2010; American Society of Agricultural and Biological Engineers: St. Joseph, MI, USA, 2010. [Google Scholar] [CrossRef]
- Vogelmann, J.E.; Rock, B.N.; Moss, D.M. Red edge spectral measurements from sugar maple leaves. Int. J. Remote Sens. 1993, 14, 1563–1575. [Google Scholar] [CrossRef]
- Poobalasubramanian, M.; Park, E.-S.; Faqeerzada, M.A.; Kim, T.; Kim, M.S.; Baek, I.; Cho, B.-K. Identification of Early Heat and Water Stress in Strawberry Plants Using Chlorophyll-Fluorescence Indices Extracted via Hyperspectral Images. Sensors 2022, 22, 8706. [Google Scholar] [CrossRef]
- Susič, N.; Žibrat, U.; Širca, S.; Strajnar, P.; Razinger, J.; Knapič, M.; Vončina, A.; Urek, G.; Stare, B.G. Discrimination between abiotic and biotic drought stress in tomatoes using hyperspectral imaging. Sens. Actuators B Chem. 2018, 273, 842–852. [Google Scholar] [CrossRef]
- Kumar, P.; Eriksen, R.L.; Simko, I.; Mou, B. Molecular Mapping of Water-Stress Responsive Genomic Loci in Lettuce (Lactuca spp.) Using Kinetics Chlorophyll Fluorescence, Hyperspectral Imaging and Machine Learning. Front. Genet. 2021, 12, 634554. [Google Scholar] [CrossRef]
- Duarte-Carvajalino, J.M.; Silva-Arero, E.A.; Góez-Vinasco, G.A.; Torres-Delgado, L.M.; Ocampo-Paez, O.D.; Castaño-Marín, A.M. Estimation of water stress in potato plants using hyperspectral imagery and machine learning algorithms. Horticulturae 2021, 7, 176. [Google Scholar] [CrossRef]
- Chen, S.; Gao, Y.; Fan, K.; Shi, Y.; Luo, D.; Shen, J.; Ding, Z.; Wang, Y. Prediction of Drought-Induced Components and Evaluation of Drought Damage of Tea Plants Based on Hyperspectral Imaging. Front. Plant Sci. 2021, 12, 695102. [Google Scholar] [CrossRef]
- Zarco-Tejada, P.J.; González-Dugo, V.; Berni, J.A.J. Fluorescence, temperature and narrow-band indices acquired from a UAV platform for water stress detection using a micro-hyperspectral imager and a thermal camera. Remote Sens. Environ. 2012, 117, 322–337. [Google Scholar] [CrossRef]
- Delalieux, S.; Zarco-Tejada, P.J.; Tits, L.; Bello, M.A.J.; Intrigliolo, D.S.; Somers, B. Unmixing-based fusion of hyperspatial and hyperspectral airborne imagery for early detection of vegetation stress. IEEE J. Sel. Top. Appl. Earth Obs. Remote Sens. 2014, 7, 2571–2582. [Google Scholar] [CrossRef]
- Wu, Z.; Cui, N.; Zhang, W.; Yang, Y.; Gong, D.; Liu, Q.; Zhao, L.; Xing, L.; He, Q.; Zhu, S.; et al. Estimation of soil moisture in drip-irrigated citrus orchards using multi-modal UAV remote sensing. Agric. Water Manag. 2024, 302, 108972. [Google Scholar] [CrossRef]
- Chandel, A.K.; Khot, L.R.; Molaei, B.; Peters, R.T.; Stöckle, C.O.; Jacoby, P.W. High-resolution spatiotemporal water use mapping of surface and direct-root-zone drip-irrigated grapevines using uas-based thermal and multispectral remote sensing. Remote Sens. 2021, 13, 954. [Google Scholar] [CrossRef]
- Rud, R.; Cohen, Y.; Alchanatis, V.; Levi, A.; Brikman, R.; Shenderey, C.; Heuer, B.; Markovitch, T.; Dar, Z.; Rosen, C.; et al. Crop water stress index derived from multi-year ground and aerial thermal images as an indicator of potato water status. Precis. Agric. 2014, 15, 273–289. [Google Scholar] [CrossRef]
- Awika, H.O.; Solorzano, J.; Cholula, U.; Shi, A.; Enciso, J.; Avila, C.A. Prediction modeling for yield and water-use efficiency in spinach using remote sensing via an unmanned aerial system. Smart Agric. Technol. 2021, 1, 100006. [Google Scholar] [CrossRef]
- Raouhi, E.M.; Lachgar, M.; Hrimech, H.; Kartit, A. Unmanned Aerial Vehicle-based Applications in Smart Farming: A Systematic Review. Int. J. Adv. Comput. Sci. Appl. 2023, 14, 1150–1165. [Google Scholar] [CrossRef]
- Boukabara, S.-A.; Krasnopolsky, V.; Stewart, J.Q.; Maddy, E.S.; Shahroudi, N.; Hoffman, R.N. Leveraging modern artificial intelligence for remote sensing and NWP benefits and challenges. Bull. Am. Meteorol. Soc. 2019, 100, ES473–ES491. [Google Scholar] [CrossRef]
- Katsigiannis, P.; Galanis, G.; Dimitrakos, A.; Tsakiridis, N.; Kalopesas, C.; Alexandridis, T.; Chouzouri, A.; Patakas, A.; Zalidis, G. Fusion of spatio-temporal UAV and proximal sensing data for an agricultural decision support system. In Proceedings of the Fourth International Conference on Remote Sensing and Geoinformation of the Environment (RSCy2016), Paphos, Cyprus, 4–8 April 2016; SPIE: Bellingham, WA, USA, 2016; p. 96881R. [Google Scholar] [CrossRef]
- Boursianis, A.D.; Papadopoulou, M.S.; Diamantoulakis, P.; Liopa-Tsakalidi, A.; Barouchas, P.; Salahas, G.; Karagiannidis, G.; Wan, S.; Goudos, S.K. Internet of Things (IoT) and Agricultural Unmanned Aerial Vehicles (UAVs) in smart farming: A comprehensive review. Internet Things 2022, 18, 100187. [Google Scholar] [CrossRef]
- Delavarpour, N.; Koparan, C.; Nowatzki, J.; Bajwa, S.; Sun, X. A Technical Study on UAV Characteristics for Precision Agriculture Applications and Associated Practical Challenges. Remote Sens. 2021, 13, 1204. [Google Scholar] [CrossRef]
- Rudd, J.D.; Roberson, G.T.; Classen, J.J. Application of satellite, unmanned aircraft system, and ground-based sensor data for precision agriculture: A review. In Proceedings of the 2017 ASABE Annual International Meeting, Spokane, WA, USA, 16–19 July 2017; American Society of Agricultural and Biological Engineers: St. Joseph, MI, USA, 2017. [Google Scholar] [CrossRef]
- Mangalraj, P.; Cho, B.-K. Recent trends and advances in hyperspectral imaging techniques to estimate solar induced fluorescence for plant phenotyping. Ecol. Indic. 2022, 137, 108721. [Google Scholar] [CrossRef]
- Lachowiec, J.; Feldman, M.J.; Matias, F.I.; LeBauer, D.; Gregory, A. Adoption of unoccupied aerial systems in agricultural research. Plant Phenome J. 2024, 7, e20098. [Google Scholar] [CrossRef]
- Alexopoulos, A.; Koutras, K.; Ben Ali, S.; Puccio, S.; Carella, A.; Ottaviano, R.; Kalogeras, A. Complementary Use of Ground-Based Proximal Sensing and Airborne/Spaceborne Remote Sensing Techniques in Precision Agriculture: A Systematic Review. Agronomy 2023, 13, 1942. [Google Scholar] [CrossRef]
- Poblete, T.; Ortega-Farías, S.; Moreno, M.A.; Bardeen, M. Artificial neural network to predict vine water status spatial variability using multispectral information obtained from an unmanned aerial vehicle (UAV). Sensors 2017, 17, 2488. [Google Scholar] [CrossRef] [PubMed]


| Camera Model | Resolution | Wavelength | Scale | Temporal Resolution | Waveband |
|---|---|---|---|---|---|
| ThermaCAM SC2000 | 320 × 240 | 7.5–13 µm | Field/Canopy | 50–60 Hz | LWIR [28] |
| Tau II 324 | 324 × 256 | 7.5 to 13.5 µm | Field/Canopy | Up to 60 Hz | LWIR [29] |
| Tau II 320 | 320 × 256 | 7.5 to 13.5 µm | Field/Canopy | Up to 60 Hz | LWIR [30] |
| ThermaCAM P640 | 640 × 480 | 7.5 to 13 µm | Field/Canopy | 30 Hz | LWIR [31] |
| Miricle 307 K | 640 × 480 | 8 to 12 µm | Field/Canopy | Up to 60 Hz | LWIR [32] |
| FLIR A35 TIR | 320 × 256 | 7.5 to 13 µm | Field/Canopy | Up to 60 Hz | LWIR [33] |
| Hyper-Cam LW | High-definition | 8 to 12 µm | Leaf/Field/Canopy | Depends on settings | LWIR [34] |
| ThermalCAM SC 640 | 640 × 480 | 7.5 to 13 µm | Field/Canopy | 30 Hz | LWIR [13] |
| Optris PI 450 | 382 × 288 | 7.5 to 13 µm | Field/Canopy | Up to 60 Hz | MWIR [13] |
| ICI 9640 P | 640 × 480 | 7.5 to 14 µm | Field/Canopy | 30 Hz | LWIR [13] |
| FLIR A65 | 640 × 512 | 7.5–14 µm | Field/Canopy | Up to 60 Hz | LWIR [35] |
| Camera Model | Resolution | Scale | Spectral Bands |
|---|---|---|---|
| RedEdge-M | 1.2 MP (1280 × 960) per band | Field/Canopy | Blue (475 nm), Green (560 nm), Red (668 nm), Red Edge (717 nm), NIR (840 nm) [52] |
| MultiSPEC 4C | 1.2 MP per sensor | Field/Canopy | Green (550 nm), Red (660 nm), Red Edge (735 nm), NIR (790 nm) [56] |
| Tetracam MCA-6 | 1.2 MP per sensor (1280 × 960) | Field/Canopy | User-configurable (typically visible + NIR) [57] |
| Parrot Sequoia | 1.2 MP per band (multispectral), 16 MP (RGB) | Field/Canopy | Green (550 nm), Red (660 nm), Red Edge (735 nm), NIR (790 nm) [54] |
| Tetracam ADC Snap | 3.2 MP total | Field/Canopy | NIR, Red, Green (3 bands typical) [58] |
| Sensor Name | Scale | Spectral Range (nm) |
|---|---|---|
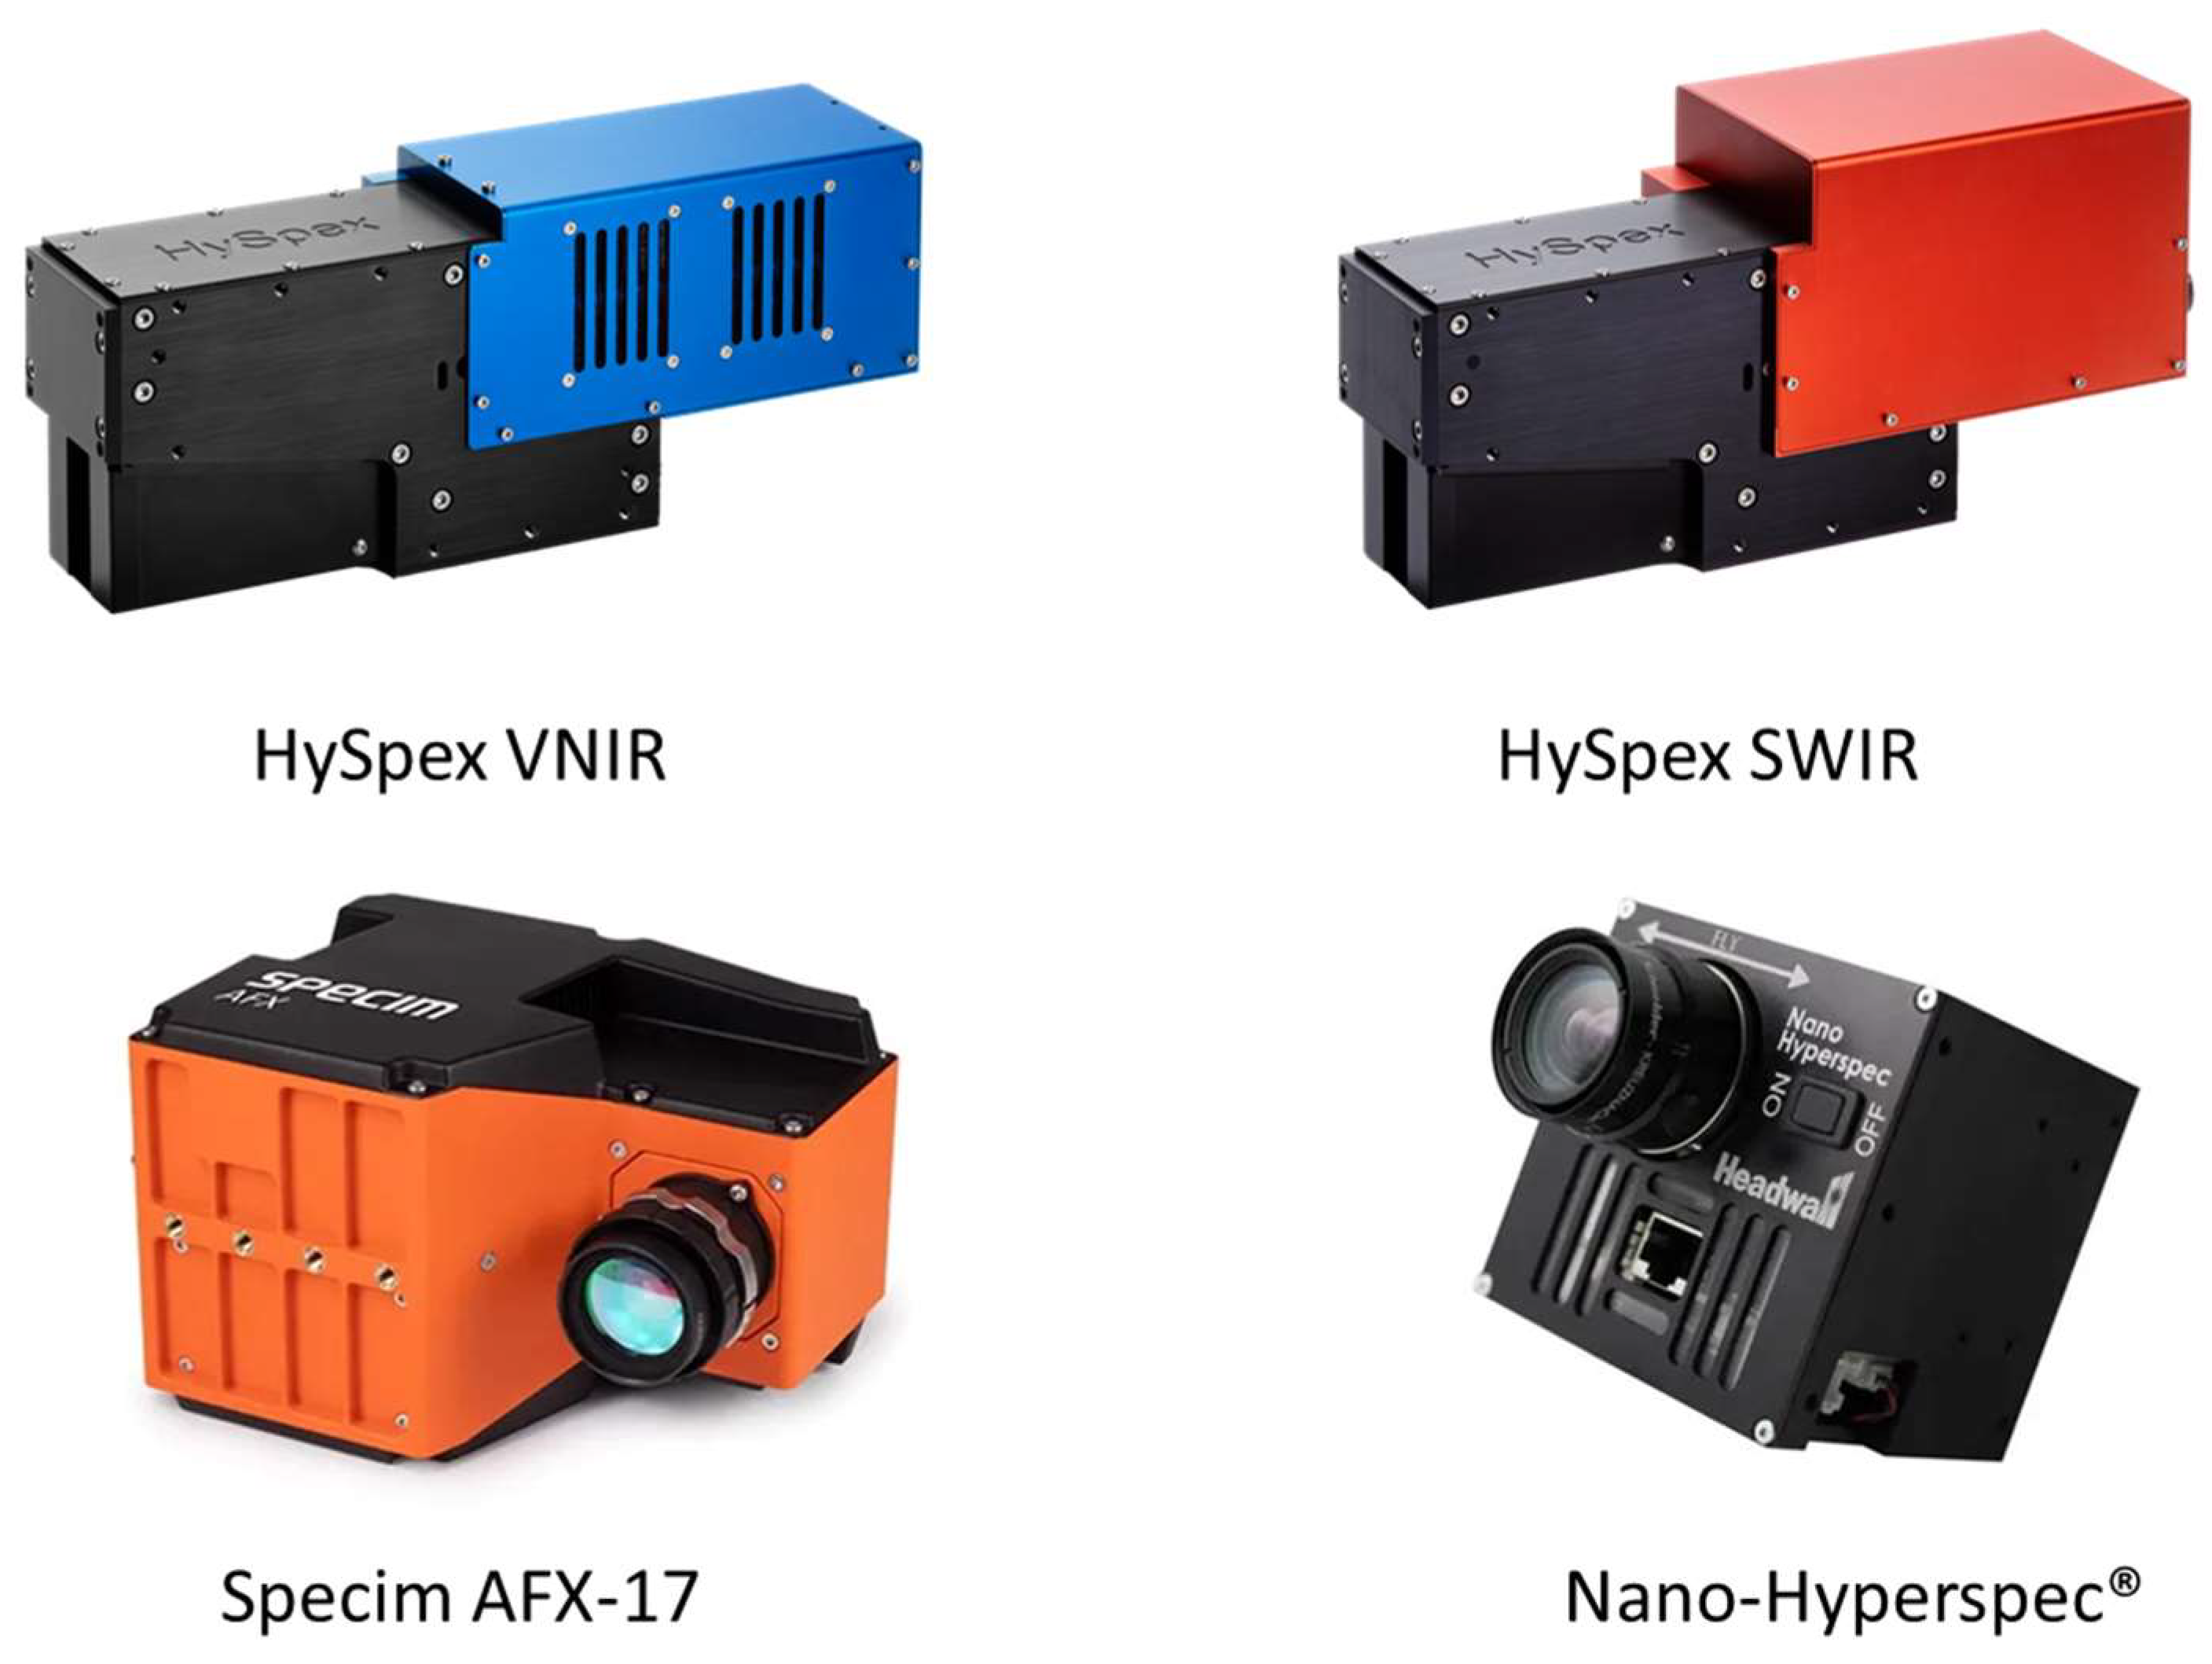
| HySpex VNIR | leaf/Canopy | 400–990 [71] |
| HySpex SWIR | leaf/Canopy | 950–2500 [72] |
| Simera HX MkII | leaf/Canopy | 450–1000 [72] |
| Specim AFX-17 | leaf/Canopy | 900–1700 [73] |
| Nano-Hyperspec® | leaf/Canopy | 400–1000 [74] |
| SWIR Hyperspec® | leaf/Canopy | 1000–2500 [74] |
| Micro-Hyperspec VNIR | leaf/Canopy | 400–1000 [37] |
| Hyperspec VNIR 1003A- 10143 | leaf/Canopy | 400–1000 [75] |
| Crop | Sensor Type | Ground Truth Data | VI | Model | Results |
|---|---|---|---|---|---|
| Nectarine | Thermal | Stem water potential | CWSI | R2 = 0.92 [35] | |
| Stomatal conductance | R2 = 0.97 [35] | ||||
| Olive | Thermal | Stomatal conductance | CWSI | R2 = 0.91 [29] | |
| Stem water potential | R2 = 0.73 [29] | ||||
| Leaf water potential | R2 = 0.71 [29] | ||||
| Leaf transpiration rate | R2 = 0.60 [29] | ||||
| Vineyard | Thermal | Stomatal conductance | CWSI | R2 = 0.71 [36] | |
| Stem water potential | R2 = 0.69 [36] | ||||
| Nectarine and Peach | Thermal | Stem water potential | CWSI | R2 = 0.27 [45] | |
| Stomatal conductance | R2 = 0.34 [45] | ||||
| Stem water potential | Adaptive CWSI | R2 = 0.72 [45] | |||
| Stomatal conductance | R2 = 0.82 [45] | ||||
| Vineyard | Multispectral | Crop coefficient | P_height | R2 = 0.12 [52] | |
| C_area | R2 = 0.295, RMSE = 0.091, MAE = 0.076 [52] | ||||
| GI | R2 = 0.04 [52] | ||||
| NDVI | R2 = 0.1 [52] | ||||
| VDVI | R2 = 0.3 [52] | ||||
| ENDVI2 | R2 = 0.11 [52] | ||||
| ENDVI3 | R2 = 0.04 [52] | ||||
| Cum_NDVI | R2 = 0.11 [52] | ||||
| C_area | Random forest model | R2 = 0.675, RMSE = 0.062, and MAE = 0.047 [52] | |||
| Generalized linear | R2 = 0.528, RMSE = 0.074, and MAE = 0.061 [52] | ||||
| Generalized additive | R2 = 0.594, RMSE = 0.069, and MAE = 0.055 [52] | ||||
| Convolutional neural network | R2 = 0.619, RMSE = 0.072, and MAE = 0.060 [52] | ||||
| Vineyard | Multispectral | Stem water potential | NDVI | R2 = 0.2 [54] | |
| NDGI | R2 = 0.18 [54] | ||||
| NDRE | R2 = 0.05 [54] | ||||
| GI | R2 = 0.14 [54] | ||||
| RGRI | R2 = 0.2 [54] | ||||
| SR | R2 = 0.27 [54] | ||||
| RDVI | R2 = 0.05 [54] | ||||
| OSAVI | R2 = 0.42 [54] | ||||
| MSAVI | R2 = 0.25 [54] | ||||
| DVI | R2 = 0.23 [54] | ||||
| Combined VIs | Artificial neural network | R2 = 0.80 and RMSE = 0.12 [54] | |||
| Vineyard | Multispectral | Stem water potential | NDVI | R2 = 0.35 [66] | |
| GNDVI | R2 = 0.31 [66] | ||||
| PRI | R2 = 0.09 [66] | ||||
| TCARI-OSAVI | R2 = 0.09 [66] | ||||
| GI | R2 = 0.06 [66] | ||||
| MCARI | R2 = 0.02 [66] | ||||
| MCARI1 | R2 = 0.03 [66] | ||||
| MCARI2 | R2 = <0.001 [66] | ||||
| MSAVI | R2 = 0.00 [66] | ||||
| MSR | R2 = 0.34 [66] | ||||
| MTVI3 | R2 = 0.03 [66] | ||||
| SRI | R2 = 0.06 [66] | ||||
| RDVI | R2 = 0.00 [66] | ||||
| NDVI, GNDVI, and MSR | Artificial neural network1 | R2 = 0.87, RMSE = 0.12 [66] | |||
| Artificial neural network2 | R2 = 0.87, RMSE = 0.12 [66] | ||||
| Artificial neural network3 | R2 = 0.84, RMSE = 0.13 [66] | ||||
| Artificial neural network4 | R2 = 0.78, RMSE = 0.15 [66] | ||||
| Artificial neural network5 | R2 = 0.78, RMSE = 0.15 [66] | ||||
| Artificial neural network6 | R2 = 0.68, RMSE = 0.2 [66] | ||||
| Artificial neural network7 | R2 = 0.56, RMSE = 0.22 [66] | ||||
| Vineyard | Multispectral | Leaf water potential | NDVI | R= 0.01 [59] | |
| SR | R = 0.11 [59] | ||||
| ARVI | R = 0.01 [59] | ||||
| SAVI | R = −0.06 [59] | ||||
| OSAVI | R = −0.03 [59] | ||||
| EVI | R = −0.06 [59] | ||||
| GNDVI | R = −0.16 [59] | ||||
| GRVI | R = −0.25 [59] | ||||
| SRgreen | R = −0.16 [59] | ||||
| NDRE | R = −0.27 [59] | ||||
| PSRI | R = 0.02 [59] | ||||
| REGI | R = −0.08 [59] | ||||
| NDRE | Random forest model | R2 = 0.78, RMSE = 0.12 [59] | |||
| NDRE | Linear Regression | R2 = 0.66, RMSE = 0.16 [59] | |||
| NDRE | Support vector regression | R2 = 0.67, RMSE = 0.15 [59] | |||
| NDRE | Extreme Gradient Regression | R2 = 0.77, RMSE = 0.13 [59] | |||
| Almonds | Multispectral | Stem water potential | P1 | R2 = 0.77 [53] | |
| NDVI | R2 = 0.21 [53] | ||||
| PCA | R2 = 0.81 [53] | ||||
| Citrus | Multispectral | Stomatal conductance | NDRE, RVI, VAR, SEC, and COR | SVR-Modeling set | R2 = 0.87 and RMSE = 0.00113 [55] |
| RF-Modeling set | R2 = 0.63 and RMSE = 0.00141 [55] | ||||
| KNR-Modeling set | R2 = 0.93 and RMSE = 0.0006 [55] | ||||
| Texture based | SVR-Modeling set | R2 = 0.7 and RMSE = 0.00135 [55] | |||
| RF-Modeling set | R2 = 0.62 and RMSE = 0.00132 [55] | ||||
| KNR-Modeling set | R2 = 0.90 and RMSE = 0.00077 [55] | ||||
| Pomegranate | Multispectral | Crop coefficient | NDVI | Stochastic configuration networks | R2 = 0.995 and RMSE = 0.046 [67] |
| Linear regression model | R2 = 0.975 and RMSE = 0.005 [67] | ||||
| Vineyard | Hyperspectral | Stem water potential | standard reflectance | Random Forest (RF) | test accuracies of 83.3% [72] |
| Extreme Gradient Boosting (XGBoost) | test accuracies of 80.0% [72] | ||||
| Vineyard | Hyperspectral | Stem water potential | standard reflectance | KNN | R2 = 0.64 and RMSE = 0.09 [73] |
| Extra tree | R2 = 0.99 and RMSE = <0.001 [73] | ||||
| RF | R2 = 0.85 and RMSE = 0.006 [73] | ||||
| GBM | R2 = 0.98 and RMSE = 0.002 [73] | ||||
| PLS | R2 = 0.69 and RMSE = 0.0089 [73] | ||||
| SVM | R2 = 0.64 and RMSE = 0.09 [73] | ||||
| Potato | Hyperspectral | Soil moisture content | WI | R = −0.027 [75] | |
| NDVI(640) | R = −0.83 [75] | ||||
| NDBI(680) | R = −0.64 [75] | ||||
| rNDVI | R = −0.88 [75] | ||||
| modNDVI | R = −0.86 [75] | ||||
| Mod_rSRI | R = −0.86 [75] | ||||
| VOG REI 1 | R = 0.87 [75] | ||||
| VOG REI 2 | R = 0.86 [75] | ||||
| VOG REI 3 | R = 0.86 [75] | ||||
| PSRI | R = 0.61 [75] | ||||
| All VIs | Regression Model | R2 = 0.8 [75] | |||
| Strawberry | Hyperspectral | Controlled environment | RVSI | Importance score = 0.26 [83] | |
| PSSRb | Importance score = 0.18 [83] | ||||
| Chl-b | Importance score = 0.17 [83] | ||||
| CIreddge | Importance score = 0.13 [83] | ||||
| SR | Importance score = 0.08 [83] | ||||
| NDRE | Importance score = 0.08 [83] | ||||
| PSSRa | Importance score= 0.06 [83] | ||||
| Chl-a | Importance score = 0.05 [83] | ||||
| All VIs | RBF | 67% accuracy in stress detection [83] | |||
| Polynomial | 64% accuracy in stress detection [83] | ||||
| Decision tree | 70% accuracy in stress detection [83] | ||||
| Random Forest model | 94% accuracy in stress detection [83] | ||||
| Adaboosting | 57% accuracy in stress detection [83] | ||||
| Gradient boosting | 76% accuracy in stress detection [83] | ||||
| XG boosting | 79% accuracy in stress detection [83] | ||||
| RVSI, Chl-b, PSSRb, and CIrededge | RBF | 67% accuracy in stress detection [83] | |||
| Polynomial | 64% accuracy in stress detection [83] | ||||
| Decision tree | 82% accuracy in stress detection [83] | ||||
| Random Forest model | 85% accuracy in stress detection [83] | ||||
| Adaboosting | 57% accuracy in stress detection [82] | ||||
| Gradient boosting | 93% accuracy in stress detection [82] | ||||
| XG boosting | 76% accuracy in stress detection [83] | ||||
| Tea | Hyperspectral | MDA | UVE + SVM | Rcal = 0.97, Rp = 0.90, RPD = 3.19 [87] | |
| SPA + RF | Rcal = 0.96, Rp = 0.91, RPD = 3.01 [87] | ||||
| CARS − PLS | Rcal = 0.96, Rp = 0.92, RPD = 3.51 [87] | ||||
| EL | UVE + SVM | Rcal = 0.88, Rp = 0.75, RPD = 1.78 [87] | |||
| SPA + RF | Rcal = 0.9, Rp = 0.81, RPD = 2 [87] | ||||
| CARS − PLS | Rcal = 0.88, Rp = 0.76, RPD = 1.9 [87] | ||||
| Fv/Fm | UVE + SVM | Rcal = 0.98, Rp = 0.81, RPD = 2.29 [87] | |||
| SPA + RF | Rcal = 0.94, Rp = 0.83, RPD = 2.15 [87] | ||||
| CARS − PLS | Rcal = 0.8, Rp = 0.76, RPD = 2.23 [87] | ||||
| SS | UVE + SVM | Rcal = 0.87, Rp = 0.84, RPD = 2.41 [87] | |||
| SPA + RF | Rcal = 0.93, Rp = 0.86, RPD = 2.46 [87] | ||||
| CARS − PLS | Rcal = 0.87, Rp = 0.87, RPD = 2.72 [87] | ||||
| DDD | UVE + SVM | Rcal = 0.97, Rp = 0.95, RPD = 4.28 [87] | |||
| SPA + RF | Rcal = 0.96, Rp = 0.92, RPD = 3.27 [87] | ||||
| CARS − PLS | Rcal = 0.92, Rp = 0.91,RPD = 3.27 [87] | ||||
| Citrus | Thermal and Hyperspectral | Stomatal conductance | Crown temperature | R2 = 0.78 [88] | |
| PRI570 | R2 = 0.37 [88] | ||||
| PRI515 | R2 = 0.59 [88] | ||||
| ZM | R2 = 0.26 [88] | ||||
| VOG1 | R2 = 0.29 [88] | ||||
| TCARI | R2 = 0.52 [88] | ||||
| TCARI/OSAVI | R2 = 0.45 [88] | ||||
| G | R2 = 0.31 [88] | ||||
| BGI1 | R2 = 0.62 [88] | ||||
| BGI2 | R2 = 0.48 [88] | ||||
| BRI1 | R2 = 0 [88] | ||||
| BRI2 | R2 = 0 [88] | ||||
| LIC3 | R2 = 0.34 [88] | ||||
| R520/R500 | R2 = 0.49 [88] | ||||
| R515/R570 | R2 = 0 [88] | ||||
| R515/R670 | R2 = 0.23 [88] | ||||
| NDVI | R2 = 0.32 [88] | ||||
| RDVI | R2 = 0.61 [88] | ||||
| DR | R2 = 0.33 [88] | ||||
| MDR | R2 = 0.33 [88] | ||||
| OSAVI | R2 = 0.52 [88] | ||||
| MTVI1 | R2 = 0.66 [88] | ||||
| TVI | R2 = 0.64 [88] | ||||
| L747−L762 | R2 = 0.39 [88] | ||||
| L780−L762 | R2 = 0.55 [88] | ||||
| L747/L762 | R2 = 0.05 [88] | ||||
| L780/L762 | R2 = 0 [88] | ||||
| ((L747 + L780)/2)-L762 | R2 = 0.49 [88] | ||||
| FLD2 (747; 762) | R2 = 0.67 [88] | ||||
| FLD2 (780; 762) | R2 = 0.67 [88] | ||||
| FLD3 (747; 762; 780) | R2 = 0.67 [88] | ||||
| ∫ [747,780] | R2 = 0.62 [88] | ||||
| Curvature index | R2 = 0.47 [88] | ||||
| Stem water potential | Crown temperature | R2 = 0.34 [88] | |||
| PRI570 | R2 = 0.37 [88] | ||||
| PRI515 | R2 = 0.38 [88] | ||||
| ZM | R2 = 0.02 [88] | ||||
| VOG1 | R2 = 0.02 [88] | ||||
| TCARI | R2 = 0.54 [88] | ||||
| TCARI/OSAVI | R2 = 0.51 [88] | ||||
| G | R2 = 0.41 [88] | ||||
| BGI1 | R2 = 0.49 [88] | ||||
| BGI2 | R2 = 0.43 [88] | ||||
| BRI1 | R2 = 0 [88] | ||||
| BRI2 | R2 = 0.04 [88] | ||||
| LIC3 | R2 = 0.23 [88] | ||||
| R520/R500 | R2 = 0.48 [88] | ||||
| R515/R570 | R2 = 0.05 [88] | ||||
| R515/R670 | R2 = 0.35 [88] | ||||
| NDVI | R2 = 0.24 [88] | ||||
| RDVI | R2 = 0.44 [88] | ||||
| DR | R2 = 0.23 [88] | ||||
| MDR | R2 = 0.23 [88] | ||||
| OSAVI | R2 = 0.4 [88] | ||||
| MTVI1 | R2 = 0.49 [88] | ||||
| TVI | R2 = 0.47 [88] | ||||
| L747−L762 | R2 = 0.46 [88] | ||||
| L780−L762 | R2 = 0.49 [88] | ||||
| L747/L762 | R2 = 0 [88] | ||||
| L780/L762 | R2 = 0 [88] | ||||
| ((L747 + L780)/2)-L762 | R2 = 0.49 [88] | ||||
| FLD2 (747; 762) | R2 = 0.66 [88] | ||||
| FLD2 (780; 762) | R2 = 0.66 [88] | ||||
|  | FLD3 (747; 762; 780) | R2 = 0.66 [88] | |||
| ∫ [747,780] | R2 = 0.6 [88] | ||||
| Curvature index | R2 = 0.51 [88] | ||||
| Apple | Thermal, visible, and near-infrared | Temperature measurement | Surface temperature extracted from thermal images | R2 = 0.768 [32] | |
| Citrus | Hyperspectral–hyperspatial fusion | water content | PRI | R2 = 0.93 [90] | |
| Chlorophyll map | R2 = 0.86 [90] | ||||
| Vineyards | Thermal and Multispectral | Stem water potential | CWSI | R2 = 0.77, RMSE = 0.1 MPa [66] | |
| Vineyards | RGB, Multispectral, and Thermal | Shoot weights | NDVI | R2 = 0.69 [58] | |
| Vineyards | SWIR and Multispectral | Stomatal conductance | NDVI and NDWI | R2 = 0.72 to 0.89 [64] | |
| Vineyards | Multispectral and Thermal | evapotranspiration | UASM- T maps | R = 0.95 [91] | |
| Potato | Thermal and RGB | Stomatal conductance | CWSI | R2 = 0.64 to 0.99 [92] | |
| Vineyard | Multispectral and Thermal | Stomatal conductance | NDVI | R = 0.56 [57] | |
| GNDVI | R = 0.65 [57] | ||||
| Fruit yield | NDVI | R = 0.68 [57] | |||
| GNDVI | R = 0.73 [57] | ||||
| Stomatal conductance | Canopy temperature | R = −0.63 [57] | |||
| Fruit yield | R = −0.83 [57] |
Disclaimer/Publisher’s Note: The statements, opinions and data contained in all publications are solely those of the individual author(s) and contributor(s) and not of MDPI and/or the editor(s). MDPI and/or the editor(s) disclaim responsibility for any injury to people or property resulting from any ideas, methods, instructions or products referred to in the content. |
© 2025 by the authors. Licensee MDPI, Basel, Switzerland. This article is an open access article distributed under the terms and conditions of the Creative Commons Attribution (CC BY) license (https://creativecommons.org/licenses/by/4.0/).
Share and Cite
Sharma, H.; Sidhu, H.; Bhowmik, A. Remote Sensing Using Unmanned Aerial Vehicles for Water Stress Detection: A Review Focusing on Specialty Crops. Drones 2025, 9, 241. https://doi.org/10.3390/drones9040241
Sharma H, Sidhu H, Bhowmik A. Remote Sensing Using Unmanned Aerial Vehicles for Water Stress Detection: A Review Focusing on Specialty Crops. Drones. 2025; 9(4):241. https://doi.org/10.3390/drones9040241
Chicago/Turabian StyleSharma, Harmandeep, Harjot Sidhu, and Arnab Bhowmik. 2025. "Remote Sensing Using Unmanned Aerial Vehicles for Water Stress Detection: A Review Focusing on Specialty Crops" Drones 9, no. 4: 241. https://doi.org/10.3390/drones9040241
APA StyleSharma, H., Sidhu, H., & Bhowmik, A. (2025). Remote Sensing Using Unmanned Aerial Vehicles for Water Stress Detection: A Review Focusing on Specialty Crops. Drones, 9(4), 241. https://doi.org/10.3390/drones9040241