Highlights
What are the main findings?
- An unmanned aerial vehicle (UAV) equipped with a scanning–sampling tunable diode laser absorption spectroscopy (TDLAS) system was developed for CH4 emission rate quantification.
- An average methane emission rate of 1.425 kg/h was detected at eight well sites in Changqing Oilfield, China, higher than the 1.061 kg/h from ground measurements.
What is the implication of the main finding?
- Offers the oil/gas industry a better diffuse CH4 monitoring tool.
- The scanning sampling pattern can cover a large range of oil and gas well sites, improve sampling efficiency, reduce flight time and costs, and is suitable for large-scale monitoring.
Abstract
This study presents a novel top-down approach to quantify diffuse methane (CH4) emissions at oil and gas well sites. It uses an unmanned aerial vehicle (UAV) equipped with a scanning–sampling tunable diode laser absorption spectroscopy (TDLAS) CH4 measurement instrument. By integrating the top-down emission rate retrieval algorithm (TERRA) and adopting concentric circular sampling, the method aims to overcome the limitations of traditional ground-based measurements. The UAV system was deployed at 11 oil and gas sites in the Changqing Oilfield. The results show that the average CH4 emission rate detected by the UAV is 1.425 kg/h (excluding non-detected samples), which is larger than the 1.061 kg/h obtained from ground-based onsite direct measurement. This discrepancy may be because the UAV’s scanning–sampling capability can cover a larger area, capturing scattered or hidden diffuse emission sources that might be missed by ground-based onsite direct measurement. The study demonstrates that the UAV-based approach with a scanning–sampling TDLAS CH4 measurement instrument, integrated with the TERRA and concentric circular sampling, is effective in capturing diffuse CH4 emissions at oil and gas well sites, providing a viable method for large-scale and efficient monitoring of such emissions. This approach could provide an effective pathway for large-scale, efficient, and cost-effective monitoring of methane emissions.
1. Introduction
Methane (CH4), a potent greenhouse gas, contributes significantly to global climate change, with the oil and gas (O&G) sector being a major anthropogenic source of emissions [1,2]. Traditional monitoring techniques, such as ground-based surveys and satellite remote sensing, face limitations in spatial resolution, operational flexibility, and cost-effectiveness, particularly for facility-level quantification [3]. These gaps have created a need for more adaptable and precise monitoring tools tailored to the specific demands of oil and gas site emission assessment. Unmanned aerial vehicles (UAVs) equipped with advanced sensors have emerged as a transformative solution, enabling high-precision, scalable CH4 detection and quantification at O&G sites.
UAV systems have demonstrated practical value in real-world O&G scenarios. Johnson et al. [4] utilized airborne mass balance methods to reveal that CH4 emissions from Alberta’s O&G facilities were 5–17 times higher than industry reports. Similarly, Karion et al. [5] identified systematic underestimation in conventional inventory methods through UAV-based measurements in the Barnett Shale region. Fixed-wing UAVs outperformed multirotor systems for offshore platforms (error < 16% under stable conditions) [6], while hybrid approaches combining UAVs with ground-based optical gas imaging enhanced leak detection [7].
The effectiveness of UAV-based detection relies on sensor–platform synergy. Tunable diode laser absorption spectroscopy (TDLAS) dominates due to high sensitivity/selectivity, with miniaturized systems achieving <16% quantification errors [6]. Closed-path cavity ring-down spectroscopy (CRDS) and quantum cascade laser absorption spectroscopy (QCLAS) improve accuracy by reducing ambient interference [8], but balancing sensor miniaturization with UAV endurance remains challenging [3].
CH4 flux estimation depends on algorithms like mass balance and Gaussian models. Conley et al. [9] optimized flight paths using Gaussian theorem-based sampling, reducing flux errors to <10%. Shah et al. [10] improved precision with the near-field Gaussian inversion (NGI) model and adaptive sampling. However, model robustness under complex meteorology (e.g., atmospheric instability) needs refinement [11]. Key uncertainties stem from meteorological variability (e.g., >20% flux errors from wind inaccuracies) [12] and model simplifications (e.g., Gaussian assumptions for non-uniform plumes) [13]. Low winds cause ±54% biases due to poor mixing [8], highlighting the need for adaptive sampling.
Recent sampling strategies focus on reducing uncertainties: single transect (±60–100% uncertainty, simple but oversimplified) [10]; single screen (±30–80%, better vertical resolution but sensitive to background) [8]; upwind–downwind screen (±40%, isolates background but turbulence-sensitive) [6]; box method (±20–30%, good for large areas but slow) [9]; and cylindrical methods (±20–30%, high precision via multi-height sampling) [7,14]. The cylindrical method is divided into single-height and multi-height types. The multi-height type is suitable for spatial point concentration, offers high spatial resolution for concentration, and requires a large number of samples. The single-height type, on the other hand, is suitable for path-integrated concentration and has the advantages of speed and high efficiency. However, operational complexity and sensor limits under dynamic conditions hinder scalability, requiring further optimization of flight paths and systems.
There remains a need for scenario-specific UAV systems that balance performance and cost. Scanning-type TDLAS systems offer high efficiency but low resolutions, and they are less common than point-sampling systems in the literature, with unclear suitability for oil/gas well site quantification. Thus, this study used a rotary-wing UAV with a scanning sampling TDLAS instrument and single-height concentric circular sampling to quantify emissions at 11 Changqing Oilfield well sites. The results were compared with onsite direct measurements to analyze uncertainty, propose improvements, and evaluate applicability.
2. Methods
2.1. Aircraft and Instrumentation
The CH4 quantification system is based on the flying platform DJI Matrice 300-RTK from Shenzhen Dajiang Innovation Technology Co., Ltd., located in Shenzhen city, China. The maximum flight time of the DJI M300-RTK is 55 min with a maximum load of 2.7 kg, and the maximum wind speed that can be tolerated is 12 m/s. Real-time kinematic is used for positioning, with an error in longitude and latitude of approximately to degrees and an error in height of approximately 5 to 10 cm. The CH4 detection instrument AiLF U10 from AiLF (Shandong) Instruments Co., Ltd., Weihai city, Shandong province, China, is a light-weight (0.7 kg), high-sensitivity gas detector based on tunable diode laser absorption spectroscopy (TDLAS), which enables rapid identification of CH4 from up to 100 m away or at a concentration as low as 5 ppm.m with 40 Hz monitoring frequency. The time used to stabilize the instrument before the start is about 15 min. It emits an infrared laser beam at a specific wavelength (methane has a characteristic absorption peak around 1.65 μm). When the laser passes through methane gas, part of its energy is absorbed. The detector infers the methane concentration by analyzing the degree of light intensity attenuation. Its optical path is designed as follows: The laser is emitted from the transmitter, collimated by an optical lens, and then projected to the target area. The reflected light is captured by the receiver and focused onto a photodetector, which converts the optical signal into an electrical signal for processing.
The CH4 concentration unit ppm·m represents the total absorption of methane along the laser path, which is the product of the methane concentration (in ppm) and the optical path length (in meters). For example, if the methane concentration in a certain area is 10 ppm and the optical path length through which the laser passes is 5 m, the reading is 50 ppm·m, reflecting the overall distribution of methane along this path. In terms of spatial resolution, point concentration is superior to line concentration; however, path-integrated concentration is suitable for rapid, large-scale sampling and monitoring.
The Sniffer4D Ultrasonic Wind Speed & Direction Sensing Module from Soarability Corporation, Shenzhen city, China, offers the real-time capture of temperature, humidity, atmospheric pressure, wind speed, and wind direction. It is equipped with four shapes, which can cover the two wind speed components (U and V) in the horizontal plane. However, attitude correction is required when the UAV is tilted or vertical airflow is significant, which poses a risk of data fusion errors. Ultrasonic wind speed and direction measurement instruments were employed to measure meridional wind (), zonal wind (), and wind direction was measured with a sampling frequency of 1 Hz. Its built-in algorithms for translational motion compensation, attitude compensation, and rotational motion compensation allow real-time wind speed and direction output, achieving accurate meteorological measurements while the UAV is in motion. The accuracy of wind speed measurement is ±0.1 m/s, and the accuracy of wind direction measurement is ±1.0°. The UAV mainly causes two types of interference with respect to the wind speed and direction measurements of the onboard Sniffer4D. The rotor generates downwash airflow (typically 2–5 m per second) and an unstable flight attitude. The downwash airflow creates local turbulence, which disrupts the ultrasonic wave propagation time. Although Sniffer4D is equipped with calibration algorithms, residual errors still exist in turbulent conditions—with wind speed errors ranging from 4.3% to 15.5% and wind direction errors ranging from 2.6° to 8.0° [15,16].
The installation position of the instruments is shown in Figure 1. The anemometer is mounted above the UAV, with a 37 cm height distance from the eight propellers (4 × 2). The TDLAS CH4 sensor is installed near the longitudinal centerline of the UAV. The rotary motion of UAV propellers generates considerable turbulence in ambient airflow patterns and disturbs natural gas dispersion fields, thereby potentially compromising the accuracy of environmental measurements. Experimental evidence suggests that the effective mitigation strategy involves positioning measurement sensors or their intake ports within the aerodynamic shadow zone immediately above the UAV’s central body or installing the equipment near the longitudinal centerline of the UAV, where rotor-induced interference is minimized (Hedworth et al., 2021 [17]; Suchanek et al., 2023 [18]).
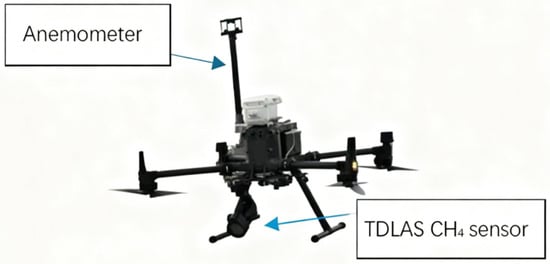
Figure 1.
The instrument’s installation locations on the UAV platform.
2.2. Study Area and Sampling Pattern
The aircraft flew 19 flights over the Changqing oilfield region in Shanxi province, China, between 21 August and 2 September 2024. The diffuse emission sources at the well sites of oil and gas fields include leakage from various pipe fittings, valve packings, tanks and heating furnaces, and compressor seals. Each box flight path was designed to fly around the boundary of the oil field well site. The fixed flight height is 50–60 m. By analyzing the vertical concentration variation, Xu et al. [12] proposed that a minimum flight altitude of 50 m can capture most of the rising plumes in UAV methane monitoring for similar oil and gas fields. The flight diameter is about 100–240 m, and the UAV flew in a circle around the source every 20–30 m. The 4–8 circles form multiple closed screens around the detection target, obtaining the longitude and latitude, CH4 concentration (ppm·m), wind speed and direction, temperature, and pressure of each detection point. The flight trajectory is shown in Figure 2.
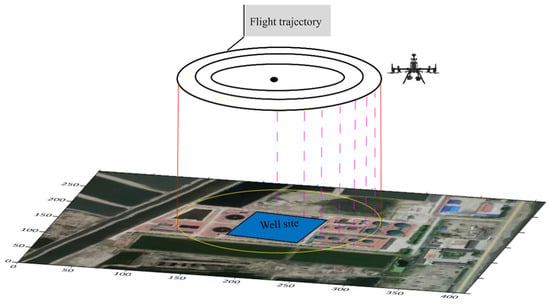
Figure 2.
The fight trajectory of the oil well site.
The UAV platform, flying at a speed of about 10 m per second, takes approximately 63 s to circle a well site with a radius of 100 m once. With 4 to 8 flight circles, the total time required to complete monitoring is approximately 252 to 504 s. Therefore, the emission rate refers to the average value over this period. During UAV methane atmospheric monitoring, sudden stops, turns, and banked flights may all generate abnormal values due to airflow disturbances, changes in sampling conditions, or sensor attitude deviations. The 3-standard-deviation (3σ) method is used as the threshold to identify abnormal values, and data exceeding this threshold are excluded in subsequent statistical analyses.
2.3. TERRA Method and Onsite Direct Measurement Method
According to Gordon et al. [19], the top-down emission rate retrieval algorithm (TERRA) was described for estimating area emission rates within oil site boundaries. It was estimated based on the divergence theorem, which equates the change in mass within the cylinder with the integrated mass flux through the surface of a cylinder:
where is the total emission rate integrated over all activities within the cylinder; is the horizontal advective flux through the lateral surface of a cylinder; is the horizontal turbulent flux through the lateral surface of a cylinder; is the advective flux through the top surface of a cylinder; is the turbulent flux through the top surface of a cylinder; is the deposition to the surface; is the increase in mass within the volume due to a change in air density; is the increase in mass due to chemical changes in the compound within the cylinder volume. The latter three terms all account for the mass changes in the compound caused by physical and chemical factors. Under the assumption of steady-state conditions, these three terms are all assumed to be zero. This will lead to a deviation from −25% to 24% in the emission rate [20]. In addition, compared to advective flux, turbulent flux can be neglected. According to Gordon et al. [19], the horizontal advective flux accounted for more than 97.7% of the total advective flux on average. Considering the above factors, the calculation of the total emissions rate in the control volume of a cylinder can be simplified as follows:
where denotes horizontal advective flux leaving the lateral surface of a cylinder, and denotes horizontal advective flux entering the lateral surface of a cylinder. Unfolding along the flight path lines (S) and performing integration yields the total emission rate.
where denotes the mass flux, kg/(m2·h); denotes the circumferential length of the flight path, m; denotes the flight altitude, m. In discretized computation, selecting an arbitrary point on the flight path, unfold the lateral surface of the cylinder clockwise along the line to form a rectangle, and then, divide the computational grid according to the sampling point interval along the path, as shown in Figure 3.
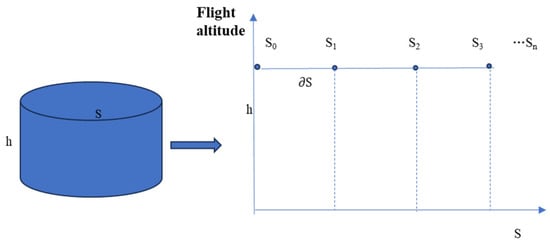
Figure 3.
The division of the computational grid.
The emission rate per unit time is obtained by calculating the cumulative sum of the CH4 release rates for all grids:
where is CH4 emissions of each enclosed path, g/s; i is the ith grid; is the mass concentration of CH4 in the ith grid, g/m2; is the trajectory distance between i and (i − 1) grid, m; is the normal wind speed of the ith grid, m/s.
The formula for converting the volume concentration of CH4 detection at each sampling point into mass concentration is as follows:
where is the molecular weight of CH4; is the volumetric concentration of CH4, ppm·m; is the molar density of the atmosphere, mol/m3, which can be calculated by using the ideal gas law:
where is atmospheric pressure, Pa; is the universal gas constant, 8.314; is atmospheric temperature, K.
The calculation formula of is as follows:
where is the meridional wind speed of the ith grid; is the distance between sampling points i and (i−1) in the x-coordinate; is the zonal wind speed of the ith grid; is the distance between sampling points i and (i−1) in the y-coordinate. The trajectory distance is calculated by the following formula:
where is the x-coordinate value of the ith grid, m; is the y-coordinate value of the ith grid, m.
By integrating the negative fluxes and positive fluxes of each circle and averaging the net flux of each circle, the average CH4 emissions () of the targeted source can be estimated as follows:
where n is the number of shapes that enclose the emission source, and is the total flux of each enclosed path.
The CH4 release rates were also calculated using onsite direct measurements (ODMs). This method is a “bottom-up” quantification method [21,22]. According to the mining process in the natural gas well site, the pollution sources are divided into tank leakage, heating furnace emissions, leakage at sealing points, and open liquid surface leakage. For tank leakage and heating furnace emissions, which are organized emission sources, the direct measurement method is adopted to measure the flow rate and CH4 concentration. Open liquid surface leakage belongs to a diffuse emission source, and the mass balance method is used to calculate the emission rate. The emission sources of the sealing point were first identified during a comprehensive site survey using a handheld laser CH4 detector. Facility-level emissions estimates were then performed using a high-flow sampler (Hi Flow®) to measure CH4 emissions from each identified point source. Finally, the total emission rate of the entire well site was obtained by accumulating the emission rates of these four items. When the UAV-based methane monitoring platform starts measuring, the ODM measurement is conducted simultaneously, with a measurement duration of no less than 1 h. The ODM measurement represents the average value over this one-hour period. When comparing the results of UAV-based methods, a mismatch between their measurement durations will introduce a certain degree of deviation.
2.4. Uncertainty Analysis
The types of model uncertainty include uncertainty in parameters and assumptions (structures) [23]. The parameter uncertainties are based upon the variability in each variable of Equation (1), including the variability of wind speed (including the meridional and zonal wind speed). Here, the wind speed and direction measurements are orthogonally decomposed into meridional and zonal wind readings. The wind speed and wind direction uncertainties consist of measurement uncertainty and temporal variation. The volumetric concentration of CH4 () also consists of measurement uncertainty and temporal variation. The background concentration is obtained through upwind cross-section monitoring, with a monitoring height of 50–60 m and a range of 74.05 to 99.30 ppm·m. The uncertainty associated with the background level is indeed minimal and is not considered in this paper. Although other parameters, such as air temperature and atmospheric pressure, have a certain impact on the quantitative results, previous studies have shown that the impact is not significant and can be ignored [13,19,24,25].
The total uncertainty based on the error propagation method can be expressed as follows:
where is the total uncertainty; is the standard deviation (1σ) caused by wind speed; is the standard deviation (1σ) caused by wind direction; is the standard deviation (1σ) caused by CH4 concentration measurement; is the wind speed measurement error; is the standard deviation (1σ) of over measuring time; is the standard deviation (1σ) of over measuring time; is the wind direction measurement error; is the standard deviation (1σ) of wind direction over measuring time; is the CH4 concentration measurement error; is the standard deviation (1σ) of the CH4 concentration over measuring time.
3. Result
3.1. Quantitative Results of CH4 Emissions
The contour lines of CH4 emission concentration at the oil and gas well sites based on the UAV method are shown in Figure 4. The measured concentration range is from 300 to 6300 ppm·m, which is approximately 5 to 105 ppm. The measured concentration values of oil well sites QSJ, S6-5, and S36-7 were lower than 250–300 ppm·m, indicating that CH4 is not detected. Here, since the TDLAS used has a resolution of 5 ppm·m for methane and the fixed measurement height is 50–60 m, the minimum detection limit of the methane instrument at this height is thus 250–300 ppm·m.
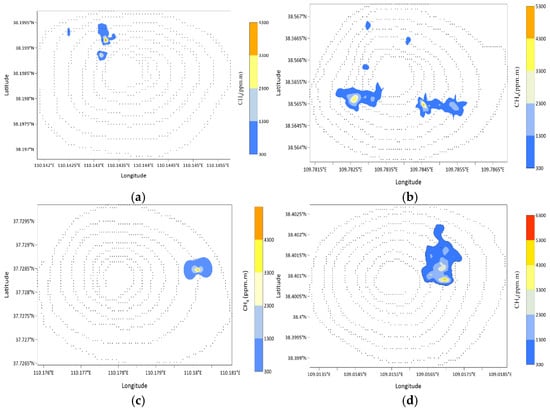
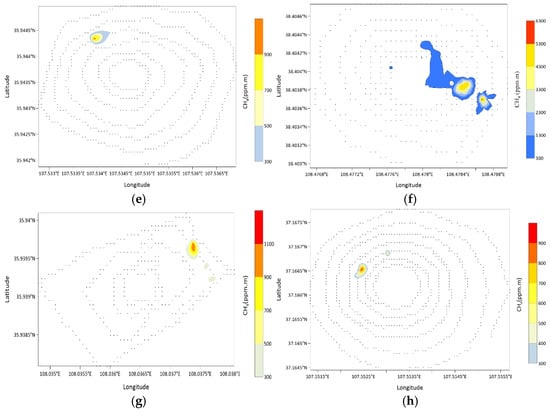
Figure 4.
The contour lines of CH4 emission concentrations in the oil field well site. (1) Panels a to h represent the spatial distribution of CH4 concentrations (ppm·m) in 8 oil and gas field well sites (XEL, ZEL, WYL, XYL, SMC, JXC, MZC, and DLC), obtained by performing ordinary Kriging interpolation on the detection values of the CH4 quantification system at the oil and gas field well sites. It represents the spatial variation of methane concentrations at different locations in the detected oil and gas field well sites. The abscissa and ordinate represent the longitude and latitude of the sampling points of the CH4 quantification system, respectively. The concentric circles formed by dashed lines indicate the flight paths. Different colors in the graph represent the magnitude of methane concentration, and the range represents the extent of influence. (2) Oil and gas field well sites with a maximum concentration of over 3300 ppm·m and a wide distribution range include JXC, XYL, and ZEL, which suggests that the methane emission rates of these well sites are relatively high. Although the maximum concentration reaches over 2300 ppm·m, oil and gas field well sites with a small distribution range include XEL and WYL, implying that the methane emission rates of these well sites are relatively moderate. Oil and gas field well sites with a maximum concentration of only 900 ppm·m include SMC, MZC, and DLC, indicating that the methane emission rates of these well sites are relatively low. The QSJ, S6-5, and S36-7 oil well sites are excluded from Figure 3 because their maximum concentration is less than 300 ppm·m, which means that they are undetectable. (a) XEL well site; (b) ZEL well site; (c) WYL well site; (d) XYL well site; (e) SMC well site; (f) JXC well site; (g) MZC well site; (h) DLC well site.
The quantification results of CH4 emissions from each well site based on the UAV method are shown in Table 1. The oil field well sites QSJ, S6-5, and S36-7 were excluded from the table due to non-detection. The quantification results of CH4 range from 486.3 to 3.209 kg/h, with an average of 1.425 kg/h. The maximum value is JXC, and the minimum value is SMC. The calculated results of the onsite direct measurement (ODM) are shown in Table 1. This bottom-up approach calculated emissions from four source types, including tank leakages, heating furnace emissions, leakage at sealing points, and open liquid surface leakages. Among these, tank leakages exhibited the largest average emission rate at 0.683 kg/h, while heating furnace emissions showed the smallest emissions, which were not detected. In terms of the total release rate, the average value is 1.061 kg/h. The average deviation of the two methods is 33.4%. The maximum deviation is 53.50% for the JXC well site, and the minimum deviation is −12.8% for the SMC well site.

Table 1.
The estimation results of the CH4 emission rate (kg/h) by the ODM method.
The quantification result of the UAV method is larger than that of the ODM method. The UAV-based method enables large-scale, three-dimensional coverage of the entire well site. This allows it to capture emissions from scattered or hard-to-reach sources—such as leaks in remote pipelines, valve fittings in elevated areas, or temporary, intermittent releases—that ground-based measurements, which are often limited to fixed sampling points or accessible locations, may miss. Moreover, diffuse emissions in oil and gas well sites are typically dispersed and dynamic, with fluctuations in emission intensity over time and space. The UAV’s ability to perform real-time, continuous scanning across the entire area ensures that it captures short-term peak emissions or transient leaks that ground-based measurements, relying on discrete time-point sampling, might overlook.
3.2. Uncertainty Analysis Results
The uncertainty analysis results of CH4 quantification are presented in Table 2. The uncertainty attributed to concentration ranges from 28.6% to 133.7%, with an average of 89.4%, while the uncertainty caused by wind speed and direction ranges from 14.3% to 40.9%, with an average of 23.4%. The CH4 concentration-induced uncertainty in quantitative results is the most significant factor.

Table 2.
Uncertainty analysis results of CH4 emission quantification.
Strategies to reduce uncertainty include optimizing sampling design, such as avoiding monitoring screens that are too close to pollution sources to prevent turbulence interference (for example, more than 100 m [26]), selecting favorable meteorological conditions during monitoring time, and improving the measurement precision of the instrument.
4. Discussion
The TERRA method quantifies the source emission rate under steady-state conditions, including stable wind speed and direction, and the source emission rate during measurement time [20]. The changes in measured CH4 concentration and wind direction and wind speed over time are shown in Figure 5 and Figure 6. The influencing factors of the calculation deviation of CH4 release rates are shown in Figure 7.
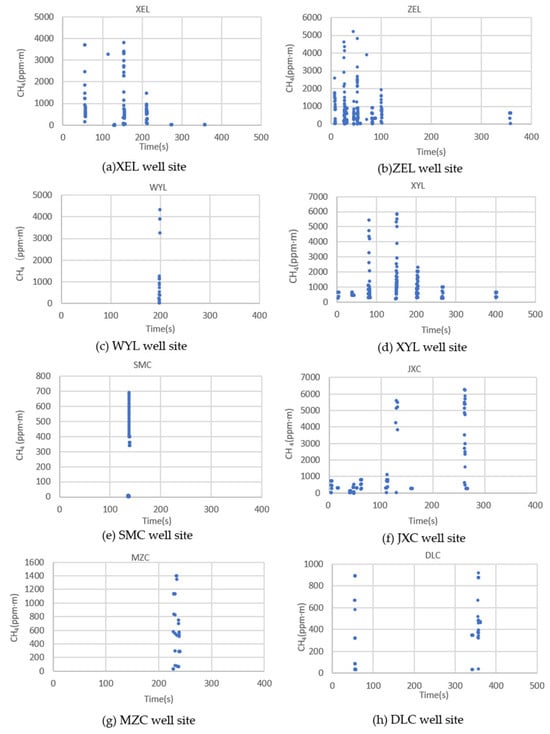
Figure 5.
Time variation in CH4 concentration during measurement. It represents the variation in methane concentration with monitoring time in the detected oil and gas field well sites. The horizontal blank intervals between points indicate that no methane concentration was detected during these time periods. The graph appears in a dotted-line form because the sampling interval is extremely small, with a monitoring frequency of 40 Hz. Most of the time, in each panel, the methane concentration is not detected, which indicates that the overall methane emission rate of the oil and gas field well sites is relatively low. Similarly to the spatial distribution, a greater number of sampling points with detected concentrations implies a higher emission rate.
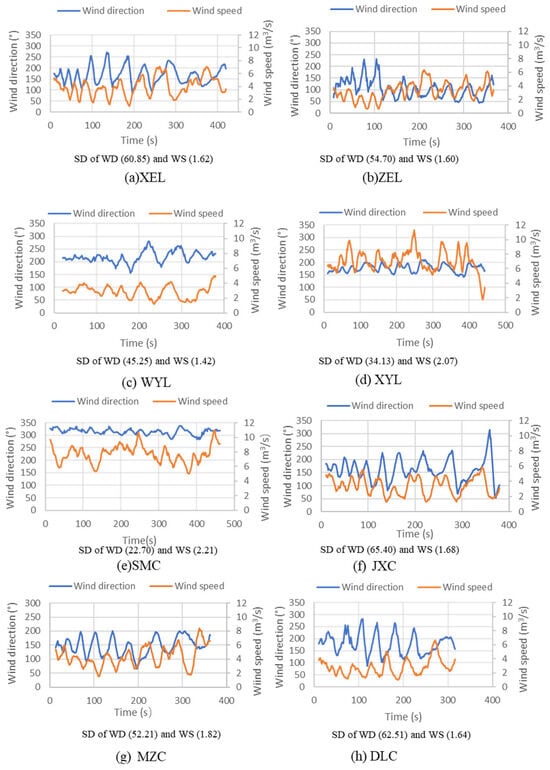
Figure 6.
The time variation in wind speed and wind direction during measurement. SD—Standard deviation; WD—wind direction; WS—wind speed. SD of WD. The SD of WD ranges from 22.70 to 65.40, with an average of 49.72. The larger the SD of WD, the greater the deviation between UAV-based quantification results and ground measurement results, as shown in (a,f). When its high values range from 60.85 to 65.40, the deviation is as high as 53.4% to 53.5%. The SD of the WS ranges from 1.42 to 2.21, with an average of 1.76. However, there is little correlation between the SD of WS and the deviation.
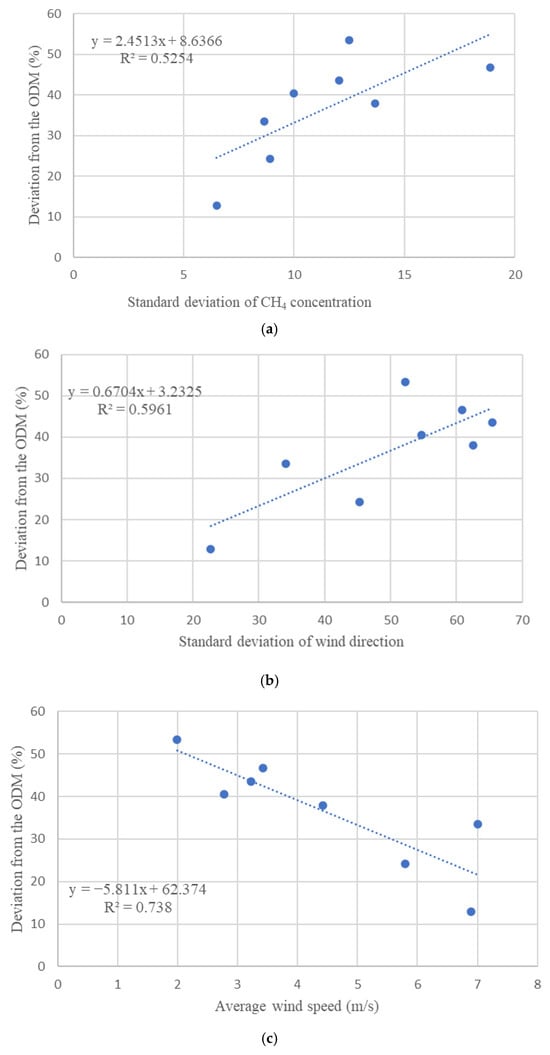
Figure 7.
Influencing factors of the calculation deviation of the CH4 release rate. (a) The relationship between the calculation deviation of the CH4 release rate and the variation in CH4 concentration; (b) the relationship between the calculation deviation of the CH4 release rate and the standard deviation of wind direction; (c) the relationship between the calculation deviation of the CH4 release rate and the average wind speed.
From Figure 4, the scanning–sampling method for monitoring CH4 has a relatively low resolution for many non-detectable states during the monitoring period, which may lead to an underestimation of CH4 emissions and inaccurate quantification. To address this issue, multiple scans in multiple circles increase the probability of capturing low-concentration emissions. Through multiple circular scans, the sample size is increased, and the sampling error is reduced.
Moreover, CH4 emissions from oil and gas well sites exhibit significant spatial heterogeneity and may come from multiple scattered sources, such as pipe fittings, valve sealings, and tank leaks. Sampling within a single circle or within a small range is difficult, as fully capturing such uneven distributions is challenging, while a radius range from 100 to 240 m can cover the core area of the well site and the surrounding potential diffusion area, ensuring that the major emission sources are included in the monitoring range. Meanwhile, the design of a circle spacing of 20–30 m can capture concentration gradients at different spatial scales—the close-range circles can focus on core emission points such as wellheads, while long-range circles can reflect the distribution of CH4 after diffusion, thereby more comprehensively depicting the spatial changes in the concentration field.
From Figure 6, it can be seen that during the measurement process at each well site, the wind direction and wind speed cannot remain constant, and their fluctuations are relatively obvious, which will have a significant impact on quantification results. Therefore, it is necessary to further analyze the specific impact of wind direction and wind speed on quantification results.
Time variations in the CH4 concentration, wind speed, and wind direction during measurement show that the state variables of the mass balance system are not stable, which has a negative impact on the quantification of the release rate of CH4. The fluctuations in concentration and wind may violate the principle of mass balance, which requires state variables to remain constant, thus leading to “storage-and release” events [20] and ultimately increasing quantification errors. Figure 7a shows that the quantitative error is positively correlated with the standard deviation of the CH4 concentration. The greater the concentration fluctuation, the larger the calculation deviation of the CH4 release rate. In order to obtain a deviation value of the CH4 release rate that is less than 30%, it is necessary to control the standard deviation of the CH4 concentration to be less than 10 (Figure 7a). It can be seen from Figure 7b,c that the quantitative error is directly proportional to the standard deviation of wind direction and inversely proportional to the wind speed. In order to ensure that the calculation deviation of the CH4 release rate is less than 30%, it is necessary to control the wind direction deviation to be less than 40° and the wind speed to be greater than 5.5 m/s. The authors of [8,27] indicate that low wind speeds can amplify measurement errors, while larger wind velocities (>2.3 m/s) enhance accuracy. The stability of wind direction has a significant impact on quantification results. When the wind direction variability (standard deviation) is less than 33.1 degrees, the accuracy of the quantified emissions is better than 50% [27].
The 19 measurements were completed over 9 days, both on cloudy and sunny days. This avoided precipitation, heavy fog, or strong wind events that could disrupt UAV stability, sensor accuracy (e.g., TDLAS laser transmission), and methane plume dispersion. All flights were carried out between 9:00 and 10:00 a.m. This temporal window was chosen to reduce extreme diurnal variations (e.g., morning inversion dissipation, afternoon turbulence intensification), but it also limited the dataset to daytime conditions. Most wind speeds during the measurements were 2–6 m/s. The standard deviation (SD) of wind speed across all well sites was 1.42–2.21 m/s, with an average of 1.76 m/s (Figure 6). The SD of the wind direction was 22.70–65.40°, with an average of 49.72°. High wind direction variability (e.g., JXC well site: 65.40°; XEL well site: 60.85°) directly violated TERRA’s steady-state assumption, leading to “storage-and-release” effects [20] and increasing emission quantification errors (e.g., deviations up to 53.4% for well sites with high SD, Figure 7b). Diurnal variations (especially the nighttime stable atmospheric boundary layer) were not investigated. They require future experiments with 24 h monitoring (covering day/night) and adjusted flight altitudes.
Adaptive sampling serves as a solution that essentially involves dynamically adjusting the sampling strategy based on real-time data feedback and predefined optimization objectives rather than relying on fixed flight paths. In recent studies, Dooley et al. [28] utilized high-sensitivity sensors to capture methane concentration gradients in real time; when a concentration increase exceeding the threshold is detected, the system automatically increases the density of sampling points or tracks the plume core area. Another method involved the combination of diffusion models (e.g., the Gaussian plume model, advection–diffusion equation) with collected data to predict plume boundaries and peak positions, thereby generating the next sampling points [29]. Wong et al. [30] focus on the identification of data gaps and high-variability areas through algorithms such as Kriging interpolation, with sampling prioritized in these regions.
CH4’s concentration in some well sites, especially in the QSJ, S6-5, and S36-7 well sites, is too low to be detected by the UAV-based method. This implies that there is a minimum quantification limit of the UAV-based method. The minimum quantification limit can be obtained according to the formula (1) based on the minimum detection limit of wind speed (0.1 m/s), CH4 concentration (5 ppm·m), and the minimum flight trajectory perimeter (314 m with a radius of 50 m). The calculation result is about 0.404 kg/h. However, the minimum quantification limit is affected by the distance to the emission source. A value of 0.404 kg/h is limited to the scenario of oil and gas field well sites. For other pollution sources, Fosco et al. [31] have successfully quantified emissions as low as 0.078 g/s. This explains why QSJ, S6-5, and S36-7 cannot be detected by the UAV-based quantification method. According to the China greenhouse gas inventory study, in emissions from conventional crude oil extraction facilities, the CH4 emission factor for a crude oil production well site (calculated based on 10 wells) is 0.263 kg/h; for the oil storage devices of a wellsite, it is 0.685 kg/h; for the transfer devices of a wellsite, it is 0.331 kg/h; for a terminal station, it is 0.211 kg/h [32]. This implies that the low resolution of laser scanning for measuring CH4 concentrations may not be suitable for a terminal station.
Compared with the point sampling pattern of downwind measurements [33] or the TERRA method [12], the scanning–sampling pattern has some advantages. First, it is highly efficient for large-scale monitoring by scanning the line concentration of CH4. With a single flight, it can cover a large area, collecting data from multiple points along the flight path. This is especially beneficial for large industrial sites such as oil and gas fields, where it can quickly assess overall CH4 emissions. Second, it is cost-effective. Since it reduces the need for numerous flights and ground-based stations, it cuts down on costs related to UAV operation, equipment wear, and labor. Third, it can detect fugitive emissions from surface sources that traditional ground-based methods often miss, enhancing the comprehensiveness of emission monitoring. It may be suitable for identifying the location of leakage points [34] and preliminarily quantifying the natural gas source. Its major drawback is poor measurement accuracy and resolution. The average value in the scanning line may be less representative compared to point sampling, leading to less precise quantification results. Also, its minimum detection limit restricts the detection of low-concentration CH4 emissions, which may result in the underestimation of total emissions.
5. Conclusions
This study introduced an innovative UAV-based method using a scanning sampling TDLAS CH4 measurement instrument to quantify CH4 emissions at oil and gas well sites. The method, integrated with the TERRA algorithm and concentric circular sampling, aimed to overcome the limitations of traditional ground-based measurements.
The UAV-based approach detected an average CH4 emission rate of 1.425 kg/h across eight well sites in the Changqing Oilfield, higher than ground-based measurements (1.061 kg/h). The UAV-based approach detects higher CH4 emissions and better captures diffuse ones due to its advanced tools (e.g., TDLAS), enabling large-scale 3D surveys and capturing scattered/inaccessible sources missed by ground methods with fixed points. It is capable of carrying out real-time, continuous scanning to catch dynamic, transient emissions, unlike discrete ground sampling. This indicates its effectiveness in capturing diffuse emissions of oil and gas well sites. The UAV-based approach, with the advantages of large-scale 3D scanning and real-time continuous monitoring, can accurately capture scattered, hidden, and transient emission sources in oil and gas fields, effectively compensating for the shortcomings of traditional ground-based monitoring methods. It provides a technical path for the quantitative assessment of diffuse emissions in the oil and gas industry.
However, several challenges were identified. The CH4 concentration-induced variation was the primary source of uncertainty, with an average deviation of 89.4%. The sensor resolution of 5 ppm·m and the steady-state assumptions of the TERRA method restricted the precision. The detection limit of the UAV-based method is about 0.404 kg/h, making it unable to identify low-emission sites. Future research should focus on enhancing the method to enable the comprehensive monitoring of low-emission sources, such as improvements in sensor sensitivity and the optimization of measurement conditions, providing a more reliable and cost-effective solution for quantifying diffuse CH4 releases in the oil and gas industry.
Author Contributions
Conceptualization, D.X., Z.L. and X.W.; methodology, D.X.; software, C.W.; validation, Z.L.; investigation, T.G., H.L. and Y.L.; resources, Z.L. and Z.T.; data curation, C.W., H.L., Z.T. and X.W.; writing—original draft, D.X.; visualization, T.G.; project administration, Z.L.; funding acquisition, D.X. All authors have read and agreed to the published version of the manuscript.
Funding
This study was supported by the Fund Project of Basic Scientific Research and Strategic Reserve Technology Research in Institutes Directly Affiliated to China National Petroleum Corporation: Research on Key Technologies for the Construction of Methane Emission MRV System in Oil and Gas Fields (No. 2023DQ03-A5).
Data Availability Statement
The original contributions presented in this study are included in this article. Further inquiries can be directed to the corresponding authors.
Acknowledgments
We would like to extend our gratitude to the reviewers and editors for their suggestions, which helped improve this manuscript.
Conflicts of Interest
Author Degang Xu, Chen Wang, Tao Gu, Zi Long, Hui Luan, Zhihe Tang, and Yinfei Liu were employed by State Key Laboratory of Petroleum Pollution Control, CNPC Research Institute of Safety and Environment Technology. The remaining authors declare that the research was conducted in the absence of any commercial or financial relationships that could be construed as a potential conflict of interest. Author Xuan Wang was employed by the company PetroChina Yumen Oilfield Company. The remaining authors declare that the research was conducted in the absence of any commercial or financial relationships that could be construed as a potential conflict of interest.
References
- IPCC. Climate Change 2023: Synthesis Report. Contribution of Working Groups I, II and III to the Sixth Assessment Report of the Intergovernmental Panel on Climate Change; Lee, H., Romero, J., Eds.; IPCC: Geneva, Switzerland, 2023; p. 184. [Google Scholar] [CrossRef]
- Liu, Y.; Paris, J.-D.; Broquet, G.; Roy, V.B.; Fernandez, T.M.; Andersen, R.; Berlanga, A.R.; Christensen, E.; Courtois, Y.; Dominok, S.; et al. Assessment of current methane emissions quantification techniques for natural gas midstream applications. Atmos. Meas. Tech. 2023, 17, 1633–1649. [Google Scholar] [CrossRef]
- Shaw, J.T.; Shah, A.; Yong, H.; Allen, G. Methods for quantifying methane emissions using unmanned aerial vehicles: A review. Phil. Trans. R. Soc. A 2021, 379, 20200450. [Google Scholar] [CrossRef] [PubMed]
- Johnson, M.R.; Tyner, D.R.; Conley, S.; Schwietzke, S.; Zavala-Araiza, D. Comparisons of airborne measurements and inventory estimates of methane emissions in the Alberta upstream oil and gas sector. Environ. Sci. Technol. 2017, 51, 13008–13017. [Google Scholar] [CrossRef] [PubMed]
- Karion, A.; Sweeney, C.; Kort, E.A.; Shepson, P.B.; Brewer, A.; Cambaliza, M.; Conley, S.A.; Davis, K.; Deng, A.; Hardesty, M.; et al. Aircraft-based estimate of total methane emissions from the Barnett shale region. Environ. Sci. Technol. 2015, 49, 8124–8131. [Google Scholar] [CrossRef]
- Corbett, A.; Smith, B. A study of a miniature TDLAS system onboard two unmanned aircraft to independently quantify methane emissions from oil and gas production assets and other industrial emitters. Atmosphere 2022, 13, 804. [Google Scholar] [CrossRef]
- Gemerek, J.R.; Ferrari, S.; Albertson, J.D. Fugitive Gas Emission Rate Estimation Using Multiple Heterogeneous Mobile Sensors. In Proceedings of the ISOCS/IEEE International Symposium on Olfaction and Electronic Nose (ISOEN), Montreal, QC, Canada, 28–31 May 2017; pp. 1–3. [Google Scholar]
- Morales, R.; Ravelid, J.; Vinkovic, K.; Korbeń, P.; Tuzson, B.; Emmenegger, L.; Chen, H.; Schmidt, M.; Humbel, S.; Brunner, D. Controlled-release experiment to investigate uncertainties in UAV-based emission quantification for methane point sources. Atmos. Meas. Tech. 2022, 15, 2177–2198. [Google Scholar] [CrossRef]
- Conley, S.; Faloona, I.; Mehrotra, S.; Suard, M.; Lenschow, D.H.; Sweeney, C.; Herndon, S.; Schwietzke, S.; Pétron, G.; Pifer, J.; et al. Application of Gauss’s theorem to quantify localized surface emissions from airborne measurements of wind and trace gases. Atmos. Meas. Tech. 2017, 10, 3345–3358. [Google Scholar] [CrossRef]
- Shah, A.; Allen, G.; Pitt, J.R.; Ricketts, H.; Williams, P.I.; Helmore, J.; Finlayson, A.; Robinson, R.; Kabbabe, K.; Hollingsworth, P.; et al. A Near-Field Gaussian plume inversion flux quantification method, applied to unmanned aerial vehicle sampling. Atmosphere 2019, 10, 396. [Google Scholar] [CrossRef]
- Kim, Y.M.; Park, M.H.; Jeong, S.; Lee, K.H.; Kim, J.Y. Evaluation of error inducing factors in unmanned aerial vehicle mounted detector to measure fugitive methane from solid waste landfill. Waste Manag. 2021, 124, 368–376. [Google Scholar] [CrossRef]
- Xu, D.; Da, H.; Wang, C.; Tang, Z.; Luan, H.; Li, J.; Zeng, Y. Methodology and uncertainty analysis of methane flux measurement for small sources based on unmanned aerial vehicles. Drones 2024, 8, 366. [Google Scholar] [CrossRef]
- Cambaliza, M.O.L.; Shepson, P.B.; Caulton, D.R.; Stirm, B.; Samarov, D.; Gurney, K.R.; Turnbull, J.; Davis, K.J.; Possolo, A.; Karion, A.; et al. Assessment of uncertainties of an aircraft-based mass balance approach for quantifying urban greenhouse gas emissions. Atmos. Chem. Phys. 2014, 14, 9029–9050. [Google Scholar] [CrossRef]
- Shi, T.; Han, Z.; Han, G.; Ma, X.; Chen, H.; Andersen, T.; Mao, H.; Chen, C.; Zhang, H.; Gong, W. Retrieving CH4-emission rates from coal mine ventilation shafts using UAV-based AirCore observations and the genetic algorithm–interior point penalty function (GA-IPPF) model. Atmos. Chem. Phys. 2022, 22, 13881–13896. [Google Scholar] [CrossRef]
- Li, Z.; Hu, H.; Shen, Y. The influence of rotor rotation of hexacopter on wind measurement accuracy. J. Exp. Fluid Mech. 2019, 33, 7–14. (In Chinese) [Google Scholar]
- Thielicke, W.; Hübert, W.; Müller, U.; Eggert, M.; Wilhelm, P. Towards accurate and practical drone-based wind measurements with an ultrasonic anemometer. Atmos. Meas. Tech. 2021, 14, 1303–1318. [Google Scholar] [CrossRef]
- Hedworth, H.A.; Sayahi, T.; Kelly, K.E.; Saad, T. The effectiveness of drones in measuring particulate matter. J. Aerosol Sci. 2021, 152, 105702. [Google Scholar] [CrossRef]
- Suchanek, G.; Filipek, R.; Goła’s, A. Design and implementation of a particulate matter measurement system for energy efficient searching of air pollution sources using a multirotor robot. Energies 2023, 16, 2959. [Google Scholar] [CrossRef]
- Gordon, M.; Li, S.-M.; Staebler, R.; Darlington, A.; Hayden, K.; O’BRien, J.; Wolde, M. Determining air pollutant emission rates based on mass balance using airborne measurement data over the Alberta oil sands operations. Atmos. Meas. Tech. 2015, 8, 3745–3765. [Google Scholar] [CrossRef]
- Fathi, S.; Gordon, M.; Makar, P.A.; Akingunola, A.; Darlington, A.; Liggio, J.; Hayden, K.; Li, S.-M. Evaluating the impact of storage-and-release on aircraft-based mass-balance methodology using a regional air-quality model. Atmos. Chem. Phys. 2021, 21, 15461–15491. [Google Scholar] [CrossRef]
- Bell, C.S.; Vaughn, T.L.; Zimmerle, D.; Herndon, S.C.; Yacovitch, T.I.; Heath, G.A.; Pétron, G.; Edie, R.; Field, R.A.; Murphy, S.M.; et al. Comparison of methane emission estimates from multiple measurement techniques at natural gas production pads. Elem. Sci. Anth. 2017, 5, 79. [Google Scholar] [CrossRef]
- Jia, W.; Jia, P.; Gu, L.; Ren, L.; Zhang, Y.; Chen, H.; Wu, X.; Feng, W.; Cai, J. Quantification of methane emissions from typical natural gas stations using on-site measurement technology. J. Pipeline Sci. Eng. 2025, 5, 100229. [Google Scholar] [CrossRef]
- Salman, C.A.; Thorina, E.; Yan, J. Uncertainty and influence of input parameters and assumptions on the design and analysis of thermochemical waste conversion processes: A stochastic approach. Energy Convers. Manag. 2020, 214, 112867. [Google Scholar] [CrossRef]
- Vinković, K.; Andersen, T.; de Vries, M.; Kers, B.; van Heuven, S.; Peters, W.; Hensen, A.; van den Bulk, P.; Chen, H. Evaluating the use of an Unmanned Aerial Vehicle (UAV)-based active AirCore system to quantify methane emissions from dairy cows. Sci. Total Environ. 2022, 831, 154898. [Google Scholar] [CrossRef] [PubMed]
- Erland, B.M.; Adams, C.; Darlington, A.; Smith, M.L.; Thorpe, A.K.; Wentworth, G.R.; Conley, S.; Liggio, J.; Li, S.-M.; Miller, C.E.; et al. Comparing airborne algorithms for greenhouse gas flux measurements over the Alberta oil sands. Atmos. Meas. Tech. 2022, 15, 5841–5859. [Google Scholar] [CrossRef]
- Andersen, T.; Vinkovic, K.; de Vries, M.; Kers, B.; Necki, J.; Swolkien, J.; Roiger, A.; Peters, W.; Chen, H. Quantifying methane emissions from coal mining ventilation shafts using an unmanned aerial vehicle (UAV)-based active AirCore system. Atmos. Environ. X 2021, 12, 100135. [Google Scholar] [CrossRef]
- Yang, S.; Talbot, R.W.; Frish, M.B.; Golston, L.M.; Aubut, N.F.; Zondlo, M.A.; Gretencord, C.; McSpiritt, J. Natural gas fugitive leak detection using an unmanned aerial vehicle: Measurement system description and mass balance approach. Atmosphere 2018, 9, 383. [Google Scholar] [CrossRef]
- Dooley, J.F.; Herndon, S.C.; Roscioli, J.R.; Worsnop, D.R.; Kolb, C.E. A new aerial approach for quantifying and attributing methane emissions: Implementation and validation. Atmos. Meas. Tech. 2024, 17, 5091–5110. [Google Scholar] [CrossRef]
- Euler, J.; Stryk, O. Optimized vehicle-specific trajectories for cooperative process estimation by sensor-equipped UAVs. In Proceedings of the 2017 IEEE International Conference on Robotics and Automation (ICRA), Singapore, 29 May–3 June 2017; pp. 3397–3403. [Google Scholar]
- Wong, G.; Wang, H.; Park, M.; Park, J.; Ahn, J.-Y.; Sung, M.; Choi, J.; Park, T.; Ban, J.; Kang, S.; et al. Optimizing an airborne mass-balance methodology for accurate emission rate quantification of industrial facilities: A case study of industrial facilities in South Korea. Sci. Total Environ. 2024, 912, 169204. [Google Scholar] [CrossRef]
- Fosco, D.; De Molfetta, M.; Renzulli, P.A.; Notarnicola, B.; Astuto, F. High-Precision Methane Emission Quantification Using UAVs and Open-Path Technology. Methane 2025, 4, 15. [Google Scholar] [CrossRef]
- Department of Climate Change, National Development and Reform Commission, China. Research on China’s Greenhouse Gas Inventory: 2005; China Environmental Press: Beijing, China, 2014. [Google Scholar]
- Xue, M.; Li, X.C.; Zhao, Y.W.; Cao, D.D.; Cui, X.Y.; Liu, G.Q.; Ding, Q. Methane emissions from shale gas production sites in southern Sichuan, China: A field trial of methods. Adv. Clim. Change Res. 2023, 14, 624–631. [Google Scholar] [CrossRef]
- Golston, L.M.; Aubut, N.F.; Frish, M.B.; Yang, S.; Talbot, R.W.; Gretencord, C.; McSpiritt, J.; Zondlo, M.A. Natural gas fugitive leak detection using an unmanned aerial vehicle: Localization and quantification of emission rate. Atmosphere 2018, 9, 333. [Google Scholar] [CrossRef]
Disclaimer/Publisher’s Note: The statements, opinions and data contained in all publications are solely those of the individual author(s) and contributor(s) and not of MDPI and/or the editor(s). MDPI and/or the editor(s) disclaim responsibility for any injury to people or property resulting from any ideas, methods, instructions or products referred to in the content. |
© 2025 by the authors. Licensee MDPI, Basel, Switzerland. This article is an open access article distributed under the terms and conditions of the Creative Commons Attribution (CC BY) license (https://creativecommons.org/licenses/by/4.0/).