Article

Designing a User-Centered Interaction Interface for Human–Swarm Teaming

by
Mohammad Divband Soorati
1,*,
Jediah Clark
1,
Javad Ghofrani
2,
Danesh Tarapore
1 and
Sarvapali D. Ramchurn
1
1
School of Electronics and Computer Science, University of Southampton, Southampton SO17 1BJ, UK
2
Institute of Computer Engineering, University of Lübeck, 23562 Lübeck, Germany
*
Author to whom correspondence should be addressed.
Drones 2021, 5(4), 131; https://doi.org/10.3390/drones5040131
Submission received: 30 September 2021 / Revised: 27 October 2021 / Accepted: 2 November 2021 / Published: 5 November 2021
(This article belongs to the Special Issue Feature Papers of Drones)

Abstract

:
A key challenge in human–swarm interaction is to design a usable interface that allows the human operators to monitor and control a scalable swarm. In our study, we restrict the interactions to only one-to-one communications in local neighborhoods between UAV-UAV and operator-UAV. This type of proximal interactions will decrease the cognitive complexity of the human–swarm interaction to O ( 1 ) . In this paper, a user study with 100 participants provides evidence that visualizing a swarm as a heat map is more effective in addressing usability and acceptance in human–swarm interaction. We designed an interactive interface based on the users’ preference and proposed a controlling mechanism that allows a human operator to control a large swarm of UAVs. We evaluated the proposed interaction interface with a complementary user study. Our testbed and results establish a benchmark to study human–swarm interaction where a scalable swarm can be managed by a single operator.

1. Introduction

Unmanned aerial vehicles (UAVs) are now commonly used to rapidly gather situational awareness in emergency responses or security applications. However, most applications are limited to high operator (n) to vehicle ratios (m), i.e., n m . This severely limits the use of inexpensive, low-power, UAVs at scale. Hence, a number of works have focused on using a swarm of autonomous UAVs [1,2,3], where the UAVs have high degrees of autonomy and can coordinate with each other using simple rules and low-power communication. These limitations on computation and communication (e.g., to avoid using up their battery or to avoid detection by threats) introduce huge challenges when it comes to monitoring and managing the collective actions of the swarm [4]. Specifically, as the size of the swarm grows, so does the complexity that human operators face in terms of directing individual UAVs, orienting to the, possibly delayed, information relayed by the swarm, and monitoring the health of the swarm (e.g., UAVs may be taken down by threats such as fires or enemy attack).
Against this background, in this paper, we aim to the improve operator to vehicle ratios (to n < m ) for large scale deployments of UAV swarms. We develop the notion of human–swarm teaming with proximal interactions, whereby, operators can direct the swarm via coarse instructions. The operator can have one-to-one interactions (in the worst case) with members of the swarm. Similarly, individual UAVs can only communicate with their neighbours (UAVs or human) within a limited range. By ‘coarse instructions’ we mean that they cannot individually instruct each UAV where to go but set a target for the swarm to achieve. This control approach is in a similar vein to the indirect parameter setting that exists in the literature [5,6]. Indeed, each UAV maintains a high degree of autonomy and can decide where to go and what to do based on its local inputs.
Our approach builds upon interactive user interfaces to allow operators to visualize the state of the swarm (state estimation), direct the swarm (control), and monitor the information it generates (monitoring). Our interfaces combine direct manipulation with autonomous UAV decision-making. We do not force the swarm to maintain a communication channel with the human UAVs at all times [7,8]. The operator, instead, uses the messages that the UAVs broadcast (to their nearest neighbor) to estimate the swarm’s state. Lindner et al. [9] evaluated the complexity of supervising a swarm of UAVs with a manned aerial vehicle by displaying the swarm as an avatar to the plane pilots. Despite the effectiveness in reducing the cognitive complexity, the resolution of the swarm’s coverage display is greatly sacrificed. The pilots in the study reported that the monitoring of the swarm was complex and that more swarm autonomy and control options are required. Patel et al. [10] use an interface with augmented reality to specify the overall goal for the swarm with a mixture of robot and environment-oriented modalities. We use a more informative visualization compared to [9] and there is flexible autonomy that allows the operator to adjust the autonomy of the swarm by modifying the messages that are exchanged with the UAVs [11]. The operator can choose to not intervene and grant full autonomy to the swarm, which makes our study different from [10]. There are also other studies that focus on the autonomy level of the swarm [12,13], different human–swarm interaction methods [10,14,15] and visualization techniques for the human–swarm systems [8,16] but this paper advances the state of the art in the following ways:
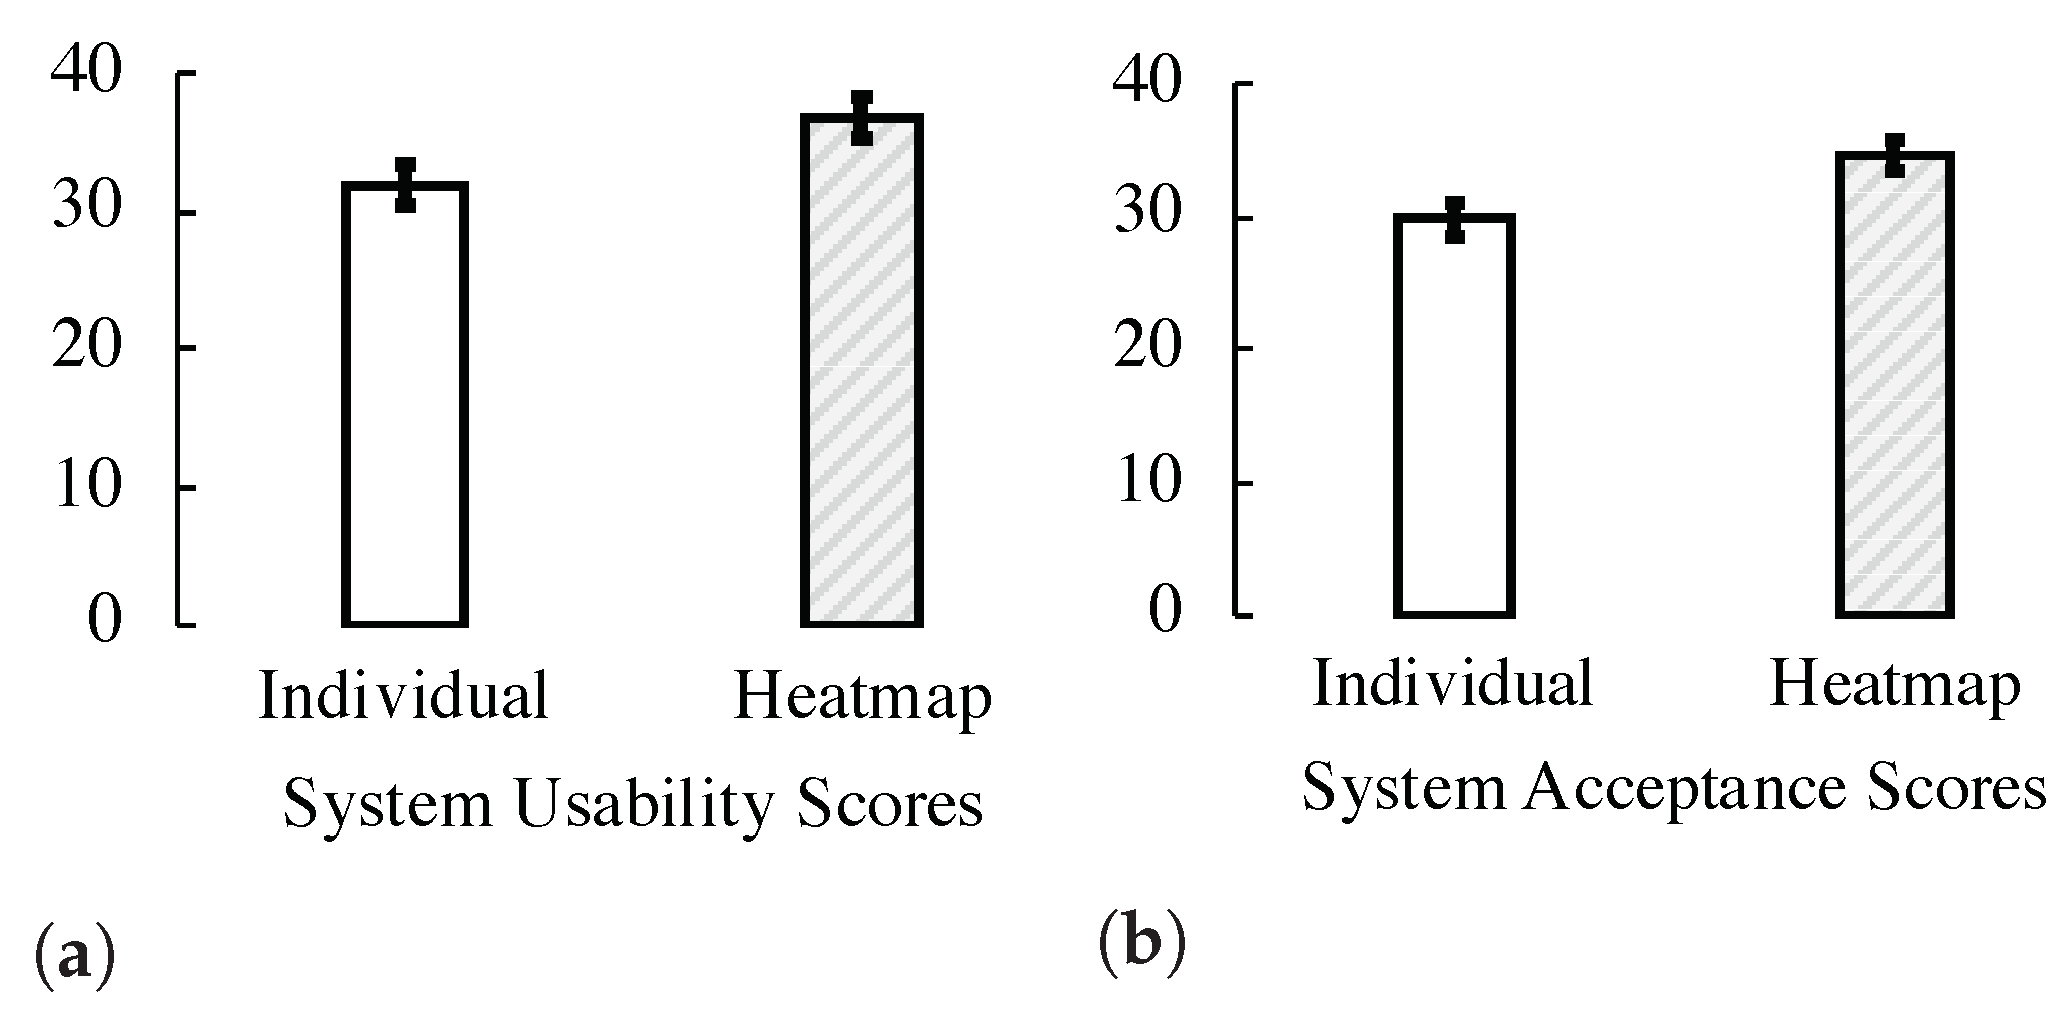
  • In a user study with 100 participants, we evaluated the effect of different visualization techniques on the usability of human–swarm interaction interface and reported the result;
  • The preferred visualization method is then used to build an interaction interface. This method reduces the number of visualizations that an operator has to use to control and monitor the swarm;
  • We propose a human-in-the-loop collective decision-making method that governs the human–swarm decisions. Our model is task-generic for human–swarm teaming (i.e., the operator is treated as an agent as well) with proximal interactions that allows for state estimation and control;
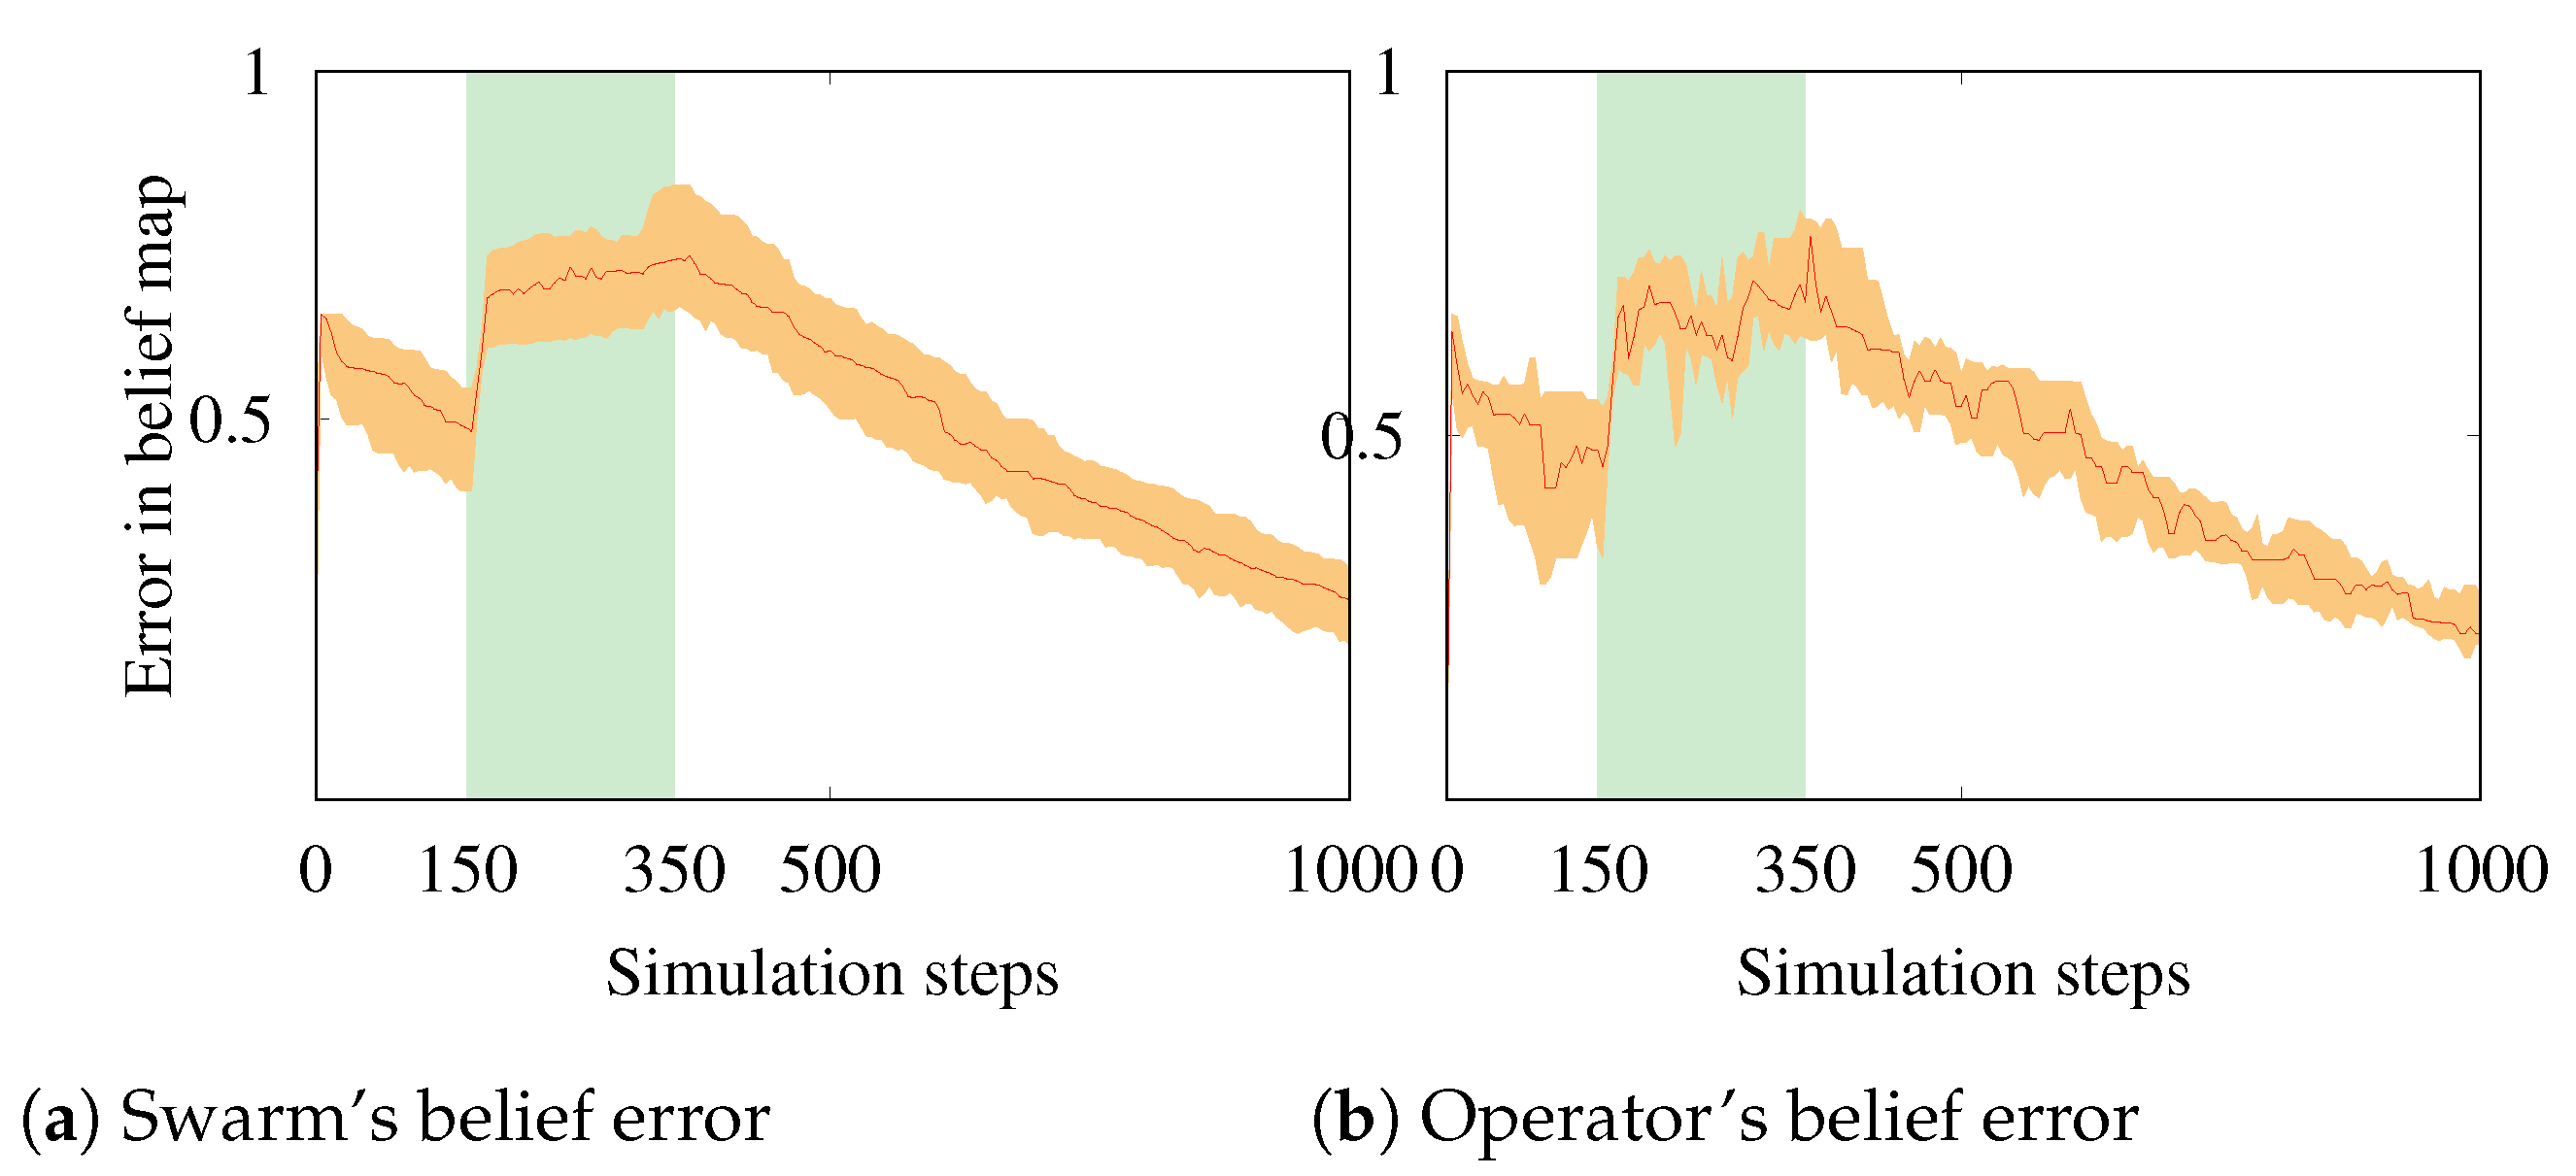
  • Through simulation, we demonstrate the effectiveness of the swarm in tracking an unfolding event (a fire spreading) through minimal interactions by a single operator.
When taken together, our methods and results provide a new benchmark for the development of human–swarm teaming models and interaction mechanisms that embed the notion of flexible autonomy.

2. User Evaluation of Human–Swarm Visualization Methods

To explore the basis in which display methods should be designed, this section presents findings on how users’ acceptance and usability vary between individual UAV and heat map swarm coverage visualization methods. This user-interaction study provides the basis in which models, maps, and simulations are constructed in the following sections.

2.1. Design and Procedure

One hundred participants (62 female, 37 male, 1 non-binary) took part in an online visualization evaluation. Ethical approval was given by the University of Southampton ethics committee (ERGO number: 66360.A1). To be included in the user-study, participants were required to hold a BSc degree or an equivalent qualification. Participants watched a video of a swarm display showing individual UAVs, followed by a heat map to represent coverage.
Videos were created by recording a rudimentary UAV simulation displaying only swarm coverage with no human-interaction involved. Each video consisted of 35 s, where 50 drones were represented using black-point dots or a density heat-map indicating the density of UAVs in 2D space. After viewing each video, participants were asked questions from the System Usability Scale [17] and the System Acceptance Scale [18] to measure how easily each could be interpreted. After viewing both videos, participants were asked to provide their preferred display method given a variety of contextual factors related to swarm size, communication-constrained environments, coverage, time-criticality, error detection and transparency (see Table 1).

2.2. Results

Responses to the post-study questionnaire were analyzed using chi-square goodness of fit tests [19] to identify any preferences for heat map or individual drone displays for a variety of swarm/environmental contexts. The alpha level was corrected using the Bonferroni method [20], according to the number of analyses conducted. The chi-square goodness of fit analyses showed that heat maps were preferred when a larger swarm is being displayed, to display motion and coverage, and when time was a critical factor to task success (see Table 1). On the other hand, individual drone displays would be preferred for detecting errors in the swarm. There was no significant difference when communication would be constrained, when time was not a critical factor of task success, and for being more transparent with the operator. Table 1 shows the frequency of participants that reported either individual or heat map displays as their preferred display method, given each contextual factor.
Two repeated measured ANOVAs [21] were conducted to identify whether the coverage display method had an effect on the System Usability Scores and System Acceptance Scores reported by participants. The analyses found a significant effect of display-type on usability scores (F(1,99) = 22.53, p < 0.001, η p2 = 0.185) and acceptance scores (F(1,99) = 29.89, p < 0.001, η p2 = 0.232) indicating that the heat map display method had a greater level of usability and acceptance among participants when compared with displaying individual UAVs. These results show that, overall, heat map displays are perceived as being more usable, acceptable, and more effective in displaying information when time is less available and when large numbers of UAVs are being represented.

2.3. Conclusions

This user-study provides evidence that heat map methods are more effective in addressing usability and acceptance in human–swarm interaction (see Figure 1). Further, in situations of larger swarm sizes, time-criticality, and displaying motion and coverage, a heat map has shown to have a higher preference among participants. Conversely, for detecting errors within the swarm, individual drone displays may be more appropriate. Due to 79 of the participants stating that a larger swarm sizes would be better displayed via a heat map, this display method shows greater promise for scalability. However, under conditions where detecting errors with individual drones is crucial to task performance, an individual drone display may be more appropriate, perhaps added as a diagnostic tool in addition to the heat map display, rather than being the core display method. Given these results, a heat map interaction method forms the basis for the development of human–swarm teaming interactions in the following sections.

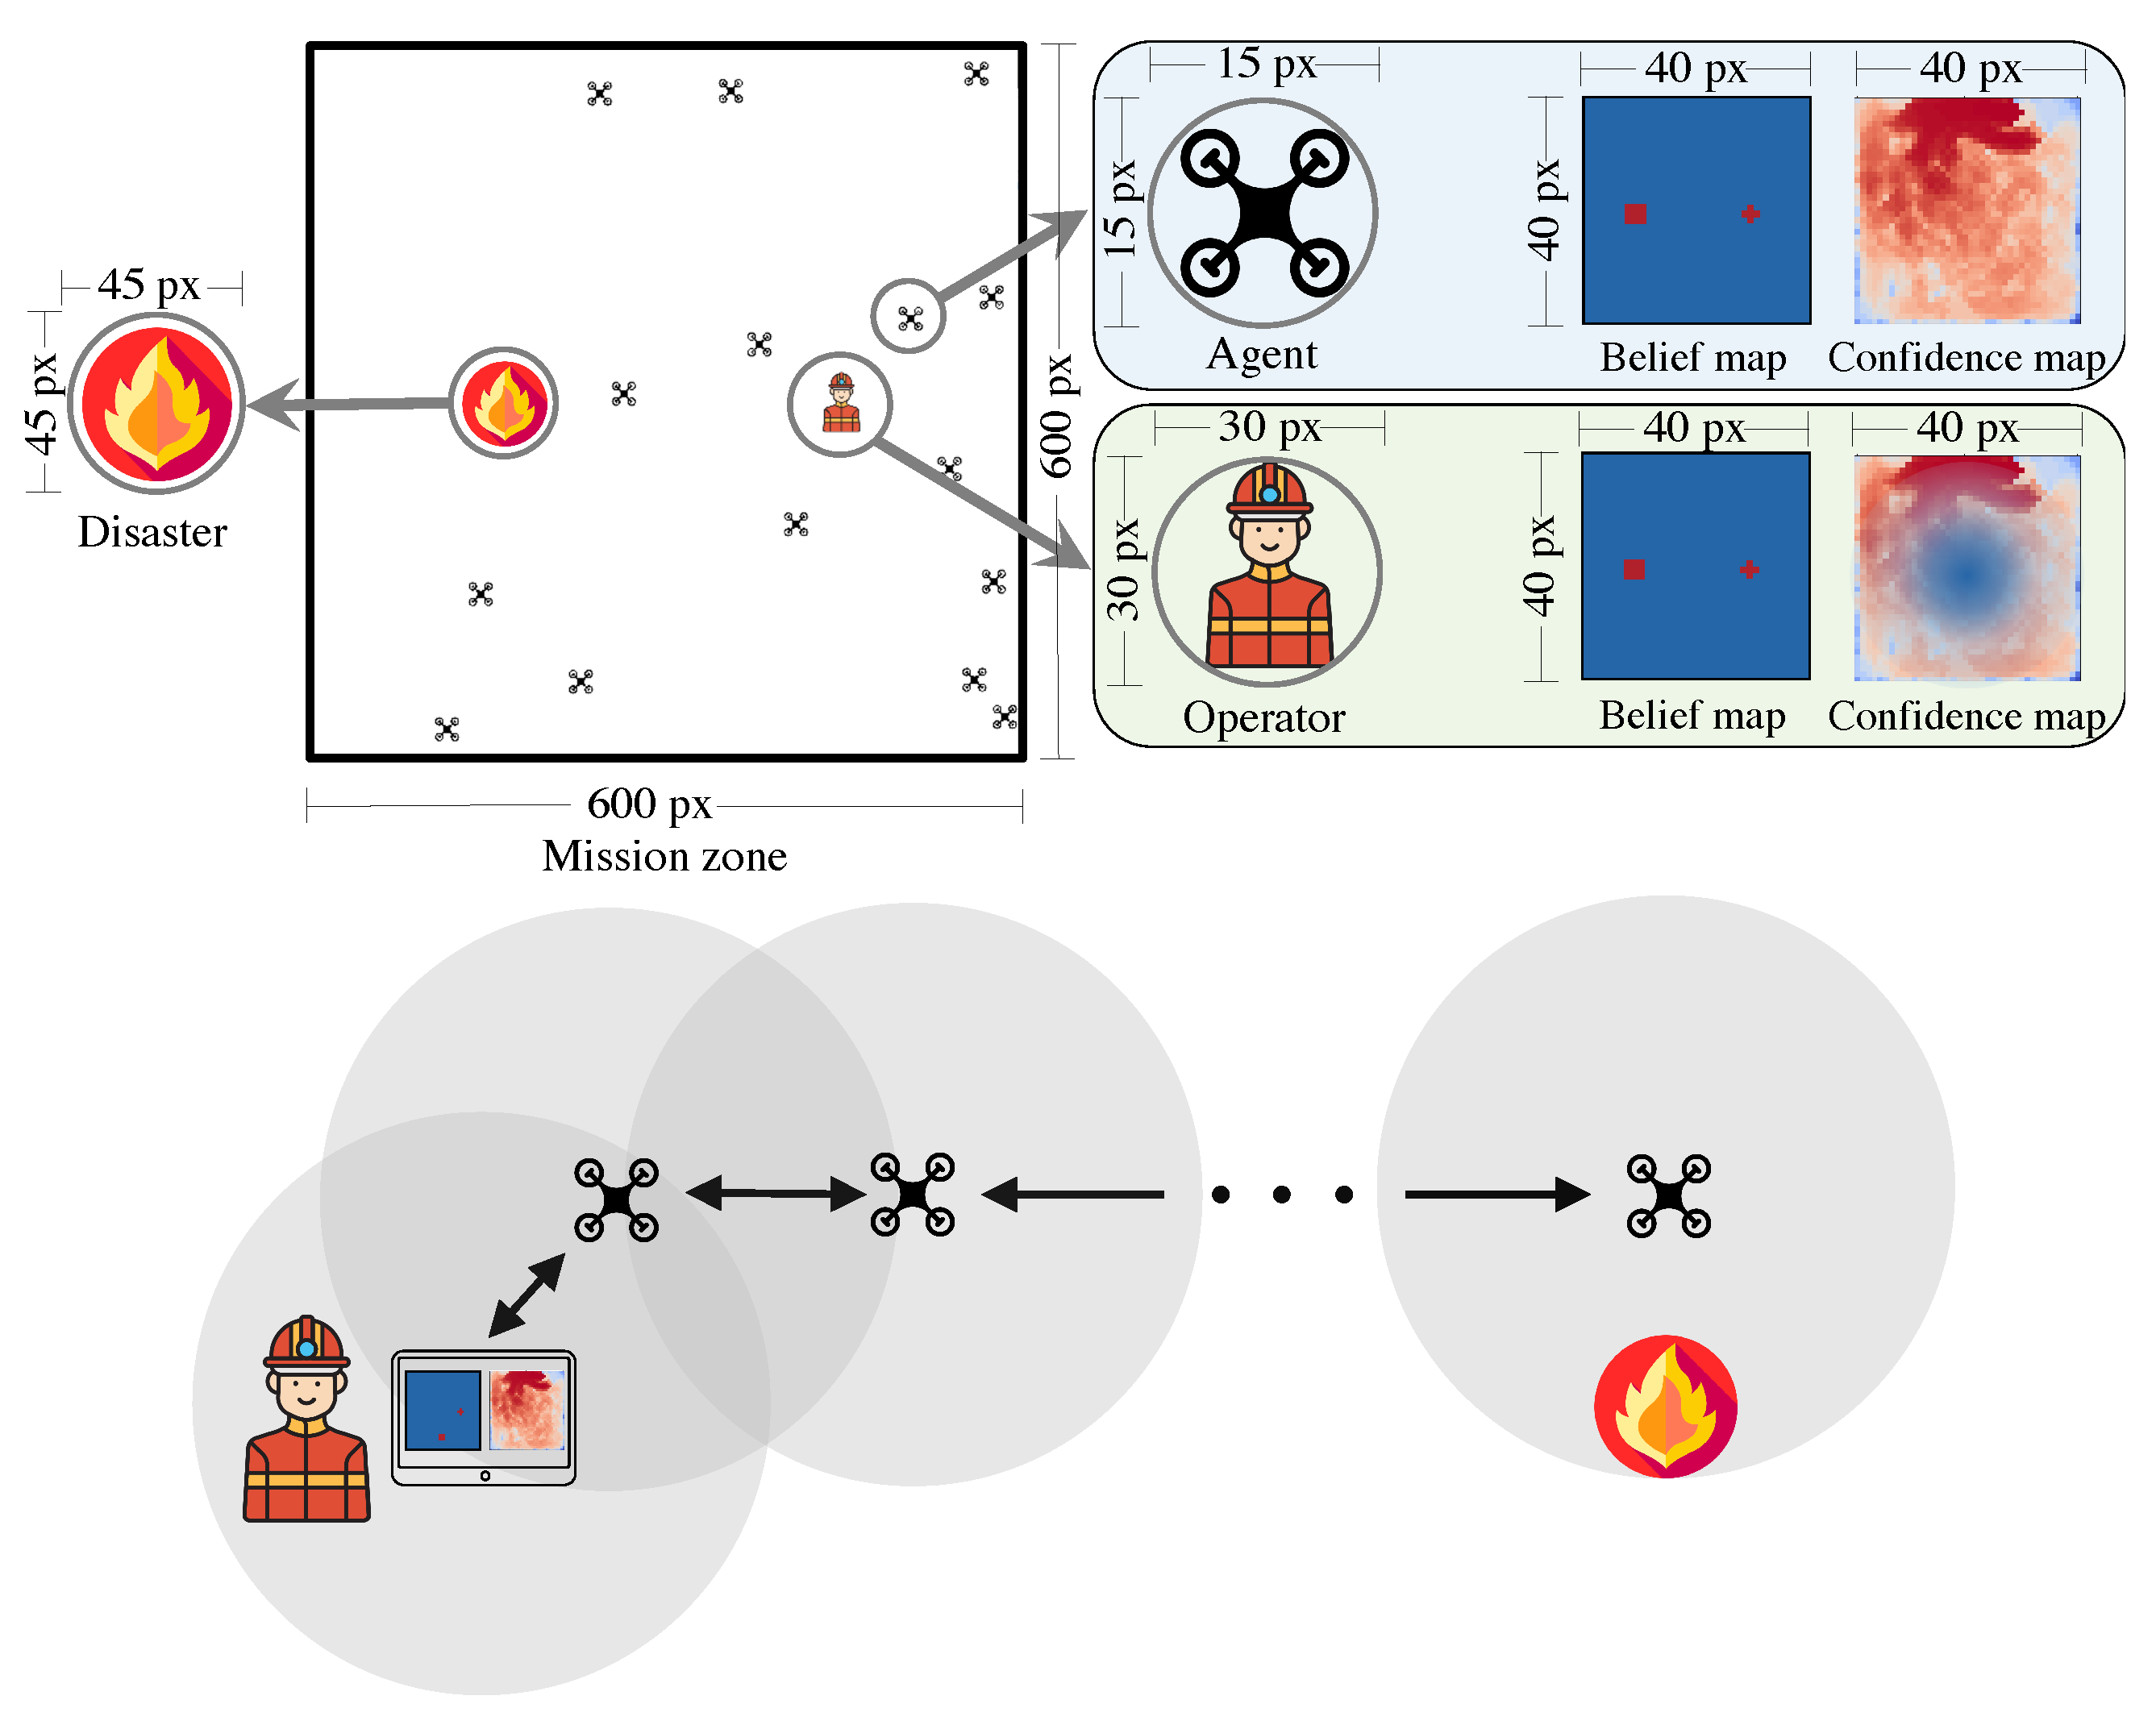
3. Human–Swarm Teaming Model

In this section, we describe the UAV model and the interactive user interface. We go on and describe our human–swarm collective decision-making process. We will use the term UAV and agent interchangeably in the rest of this paper.

3.1. UAV Model

We consider that agents can be heterogeneous in terms of their capabilities (e.g., influence, dynamics, sensor). This means that they may gather information differently and at different speeds. The speed of the UAVs impacts on the delays in gathering information. In terms of completing a mission, the sensing capabilities may determine the number of dimensions that an operator has to consider and the size of messages that are exchanged. Here, we model UAVs that only return information about their own health; for instance, whether they are flying, the sensors are on or not, and whether they have detected a target or not. The approach can be extended to cover the detection of different kinds of targets, and we will leave this for future work. For now, we will only consider UAVs that can return an integer value denoting the state of their position, for example, the temperature that may be indicative of a fire, or the number of people in their area. We use a point model and we do not consider external environmental factors such as gravity, wind, etc.

3.2. Operator and Swarm Interactions

UAVs move around the mission zone, over the human operator, and over the disaster zone (see Figure 2). We can add an arbitrary number of operators and disaster zones, but in this paper, our scenario contains one operator, one disaster area, and 15 UAVs. The operator can communicate with the UAVs that are in their local neighborhood and send/receive information. Similar to other UAVs, the operator can also move around and explore the environment, but in this study we assume that the operator is fixed and the UAVs move at most 5 pixels at each simulation step. In our scenario of disaster management, we set the position of the human operator and the disaster as important points that need to be noted and stored by the UAVs. The motivation for marking both operators and disasters is to facilitate further use cases in disaster management, such as forming a safe path between the operator and the disaster area (not discussed in this paper).
Our interface design contains two heat maps, a belief and a confidence map, to comply to the findings of our initial user study (see Section 2). The operator uses these two maps to observe and control the swarms.

3.2.1. The Belief Map

UAVs continuously explore and observe the mission zone for potential disasters or the areas with the human operators. A matrix—a belief map—is used as a map representation of the mission zone. UAVs use the belief map to store their observation of the area. Figure 3a–c show the formation of the operator’s belief map over time, where the location of the human operator and the disaster zone are highlighted. The location of the interest areas in the belief map emerge very early in the process. Over time, the UAVs obtain a stronger belief on the area that they explore. This is shown by intensity of the belief that increases over time and turns into red.

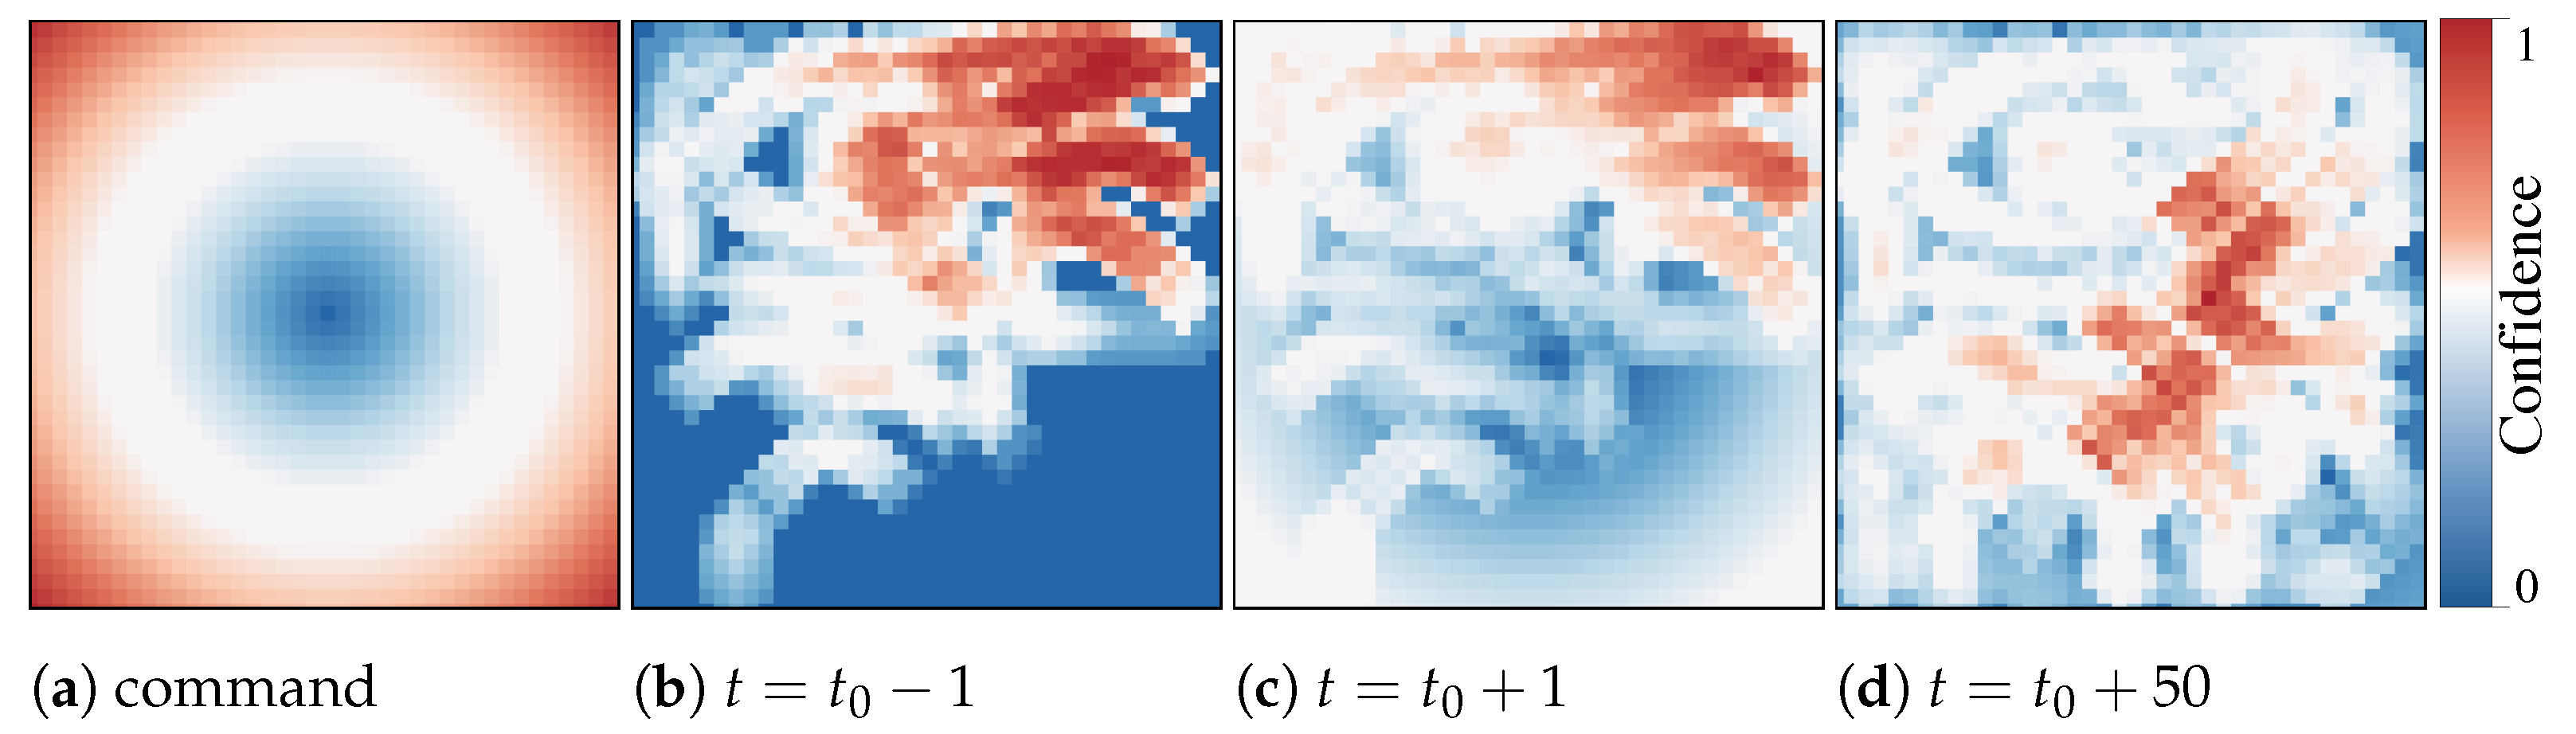
3.2.2. The Confidence Map

Another heat map—a confidence map—not only represents the distribution of the swarm as seen by individual agents (see Figure 4) but also determines the agents’ certainty level of the information in the corresponding cell of the belief map. We later show how the same map is used for controlling the swarm as well.
Using the belief and confidence maps, the agents store their representation of the environment and keep their confidence level about its correctness. As agents move and explore the mission zone, the cells in the belief maps are updated. The corresponding confidence values of the recently visited cells in the confidence map also increase.

3.3. Human–Swarm Collective Decision-Making Model

Each drone has a limited perception and communication range that makes it hard for them to individually solve a complex task. The swarm can establish a distributed sensing on a large area of the environment and when working together, the swarm will be able to construct an opinion about a certain property of the environment. In our earlier work, we have shown how a swarm can collectively decide which half of an environment is brighter and stay adaptive to changes [22]. This class of problems in swarm robotics is called the best-of-n problem, that is, the capability of the swarm to find the best option among a finite set of alternatives [23]. An unsolved challenge is to provide a collective decision-making strategy that is capable of solving the best-of-n problem with spatial constraints [24]. In our context, the swarm is exploring the environment and the swarm’s motion is limited (e.g., not permitted in no-fly zone). The second challenge is that in the literature, the collective perception of the features in an environment is limited to few options [25]. To the best of our knowledge, none of the existing collective decision-making strategies including Direct Modulation of Voter-based Decisions [26], Direct Modulation of Majority-based Decisions [27], Direct Comparison [25] that are widely common in the swarm robotics applications can be directly applied to our scenario, as UAVs need to continuously measure the environment and disseminate whenever another UAV or an operator is in range. We are building upon our previous work on adaptive decision-making in robot swarms and add a human in the loop to find a choice among a large set of options in a dynamic environment [22].
The operator, similar to the UAVs, has a confidence that is updated based on the neighboring UAVs. The operator can decide to manipulate their own map, regardless of the current state, and propagate it back to the swarm. The modified confidence map, once received by the UAVs, enforces an attraction/repulsion mechanism that controls the swarm. The operator can focus on the overall goal and implement strategies abstracted from the detailed interactions and behaviors of each UAV, making it an ideal multi-robot organizational scheme. The cognitive complexity of such a form of interaction between the human and the swarm, where the human has to operate a maximum C number of UAVs (the number of agents that can fit into a communication range of an operator), regardless of the swarm size, is O ( 1 ) [28].
The operator receives the maps from the UAVs in their neighborhood and may decide to temporarily explore a certain region in the mission zone as external information may indicate a disaster. The UAVs can be, temporarily or permanently, repelled from a prohibited region (e.g., high voltage cables). The operator can manipulate their own confidence map and introduce a major decrease/increase in the certainty of an interest zone, and constantly share it with the swarm. This forces the swarm to react to the new forces and collectively explore the areas with low confidence or avoid the areas with high confidence.
Agents continuously disseminate their belief and confidence maps as they meet. Equations (1) and (2) determine the update for each cell in the maps of agent i after communication with agent j.
c i , t ( m , n ) = c i , t 1 ( m , n ) c i , t 1 ( m , n ) θ h i g h c j , t 1 ( m , n ) c j , t 1 ( m , n ) θ h i g h c i , t 1 ( m , n ) c i , t 1 ( m , n ) θ l o w c j , t 1 ( m , n ) c j , t 1 ( m , n ) θ l o w φ ρ i c i , t 1 ( m , n ) + ( 1 φ ) ρ j c j , t 1 ( m , n ) ρ i + ρ j o . w .
b i , t ( m , n ) = φ ρ i b i , t 1 ( m , n ) + ( 1 φ ) ρ j b j , t 1 ( m , n ) ρ i + ρ j
where b x , t ( m , n ) and c x , t ( m , n ) are the cells in the belief and confidence maps of agent x at the time t. θ s represent the higher and lower bounds for the higher priority information stored in the confidence map based on human operator’s influence. In each simulation step, the confidence map ages with the factor α < 1 to account for information quality decay. For a while, the operator’s influence is locked and will circulate among the swarm until the quality decay brings the values back to the modifiable range of { θ l o w , θ h i g h } . The idea behind this locking mechanism is to overrule the swarm’s decision and reserve a larger impact for the operator’s commands. Each agent carries a reliability factor ( ρ ) that indicates to which extent its passing information is reliable. This can depend on the hardware capacity, battery level, authority to influence other agents, etc. ρ can be extracted from the incoming messages but it may pose a potential security threat if additional security measures are not put in place. Alternatively, the receiving agent can keep a list of ρ values and internally decide on whether an incoming message is from a reliable UAV or not (decreases scalability). φ determines how much each agent is open for influence from other agents. In our experiments, for simplicity, all agents have φ = 0.5 and ρ = 1 .

3.4. Swarm’s Path Planning

The operator can create an artificial potential field where high confidence is repulsive and low confidence is attractive. Using potential field-based algorithms to repel UAVs from each other and from obstacles while being attracted to the target zones was studied before [29,30]. As opposed to these studies, we use one interface for state estimation, visualization, and indirect parameter setting with proximal interactions.
The swarm continuously follows the downhill gradient of the potential calculated by applying Sobel filter on the confidence map [31]. UAVs move towards the least confidence area and, therefore, try to maximize their confidence about the environment.
The confidence of the boundaries is set to 1 to repel the UAVs. This also prevents them from getting locked in clusters around the corners or near the boundaries and keeps the UAVs inside the mission zone. The two forces applied to the UAVs are the local ( f l , i ( t ) = l o c a l ( c i , t ) ) and global gradients ( f g , i ( t ) = g l o b a l ( c i , t ) ) of their own confidence map. The total force is given by
f i ( t ) = ω f l , i ( t ) + ( 1 ω ) f g , i ( t ) : f I R 2 ,
where f i determines the motion of the UAV i and ω specifies the weighting factor between local and global forces.
By defining the dynamics of each UAV as given in Equation (3), the mobility of the swarm can be controlled by adjusting the weight coefficient ω . Higher ω pushes the UAVs to explore their local neighborhood and stay in a small exploration range, while lower ω prioritizes the global certainty and the entire swarm moves towards the common targets. When the UAVs prefer to stay in their local neighborhood, their belief map will only be precise about the area around them and the UAVs across the swarm will have diverse belief and confidence maps that might mislead the operator. On the contrary, lower ω may lead to a high congestion around the common targets. In this case, UAVs perform a flocking behavior that decreases the swarm utilization as all UAVs will have common targets and will not distributively explore the mission zone. Assigning different ω values to the swarm may prove useful for developing a diversity in the swarm behavior for exploration and exploitation. In this paper, ω = 0.99 and fixed for all experiments. The UAVs move in a 2D space and all forces are applied on a plane with constant altitude and parallel to the x y -plane.

4. Simulation Platform

There are several multi-UAV/swarm simulation environments based on commercial (e.g., MATLAB [32], X-Plane flight simulator [33]) and non-commercial platforms (e.g., ARGoS [34]). We designed our own simulation environment based on an open-source video game library, Arcade [35], to be able to freely modify the simulator and also use the high usability characteristic of a game environment. The parameters are optimized to run on low computational power machines. For our experiments, we used a local machine with a 1.4 GHz Intel Core i5 processor and 16 GB 2133 MHz of memory. The images taken from the mission zone have the resolution of 600 × 600 pixels. We use the term pixels in images or cells in matrices to refer to the same concept of information stored in the high- or low-resolution images taken from the mission zone. The UAVs decrease the resolution of the images to 40 × 40 pixels to speed up the computation and decrease the load on the communication channels.

Belief and Confidence Maps Setup

The belief and confidence maps are initialized to zero. As the UAVs move, they observe a radius of 2 pixels from their current position ( r = 2 px in belief and confidence maps and r = 30 px in high resolution) and communicate within a radius of 4 pixels ( r = 60 px in high resolution). The confidence of radius 2 px (a disk with a diameter of 5 pixels) is set to one. The belief map gets updated based on the observed images. If there is a disaster or an operator within the vision range (r), the corresponding cells of the map will be set to one. Changes in the environment may make the stored information obsolete. Therefore, we associate time to the confidence by multiplying the confidence matrix with the decay factor ( α = 0.0001 ) at each simulation step. The parameters can be tuned based on the experiments and the domain of application. For instance, a lower decay factor is suitable for dynamic environments as UAVs quickly lose their confidence and frequently need to explore the areas again. Here, we chose our parameters based on empirical observations for proving the concept. Cells with higher confidence clearly have greater impacts on the neighbors. As the UAVs have limited sensor range, the communication enables them to exchange information and broaden their perception to the boundaries of the complete zone.
Another advantage of using confidence maps as a basis for motion pattern is collision avoidance, as the attraction/repulsion mechanism indirectly results into a motion with low collision rates, assuming that there is no communication failure. Recently visited cells have high confidence values and as neighboring UAVs approach each other and share their confidence maps, they repel from the cells that their neighbor recently visited and collisions will be avoided. This also leads to spatial division of the mission zone between the neighboring UAVs (indirect coordination) as the UAVs prefer not to use the same paths that their neighbors recently took.

5. Empirical Evaluation

We designed four experiments to examine our interface and the swarm’s behavior with different levels of autonomy. First, the swarm’s performance in exploring the mission zone with full autonomy—no human intervention—is examined (Experiment I). We evaluate how the swarm reacts to dynamic environments with evolving disasters in Experiment II. In Experiment III, the level of autonomy decreases and we measure the swarm’s response to human interactions. Finally, we perform a separate interactive user study to evaluate our interface in Experiment IV.
We ran 15 simulation runs with 1000 simulation steps and for each experiment the mission zone consisted of a disaster area, a human operator, and 15 UAVs that are positioned randomly at start of each trial. The swarm is examined with three different locations of the disaster area to make sure that the results are not biased to a certain setup.

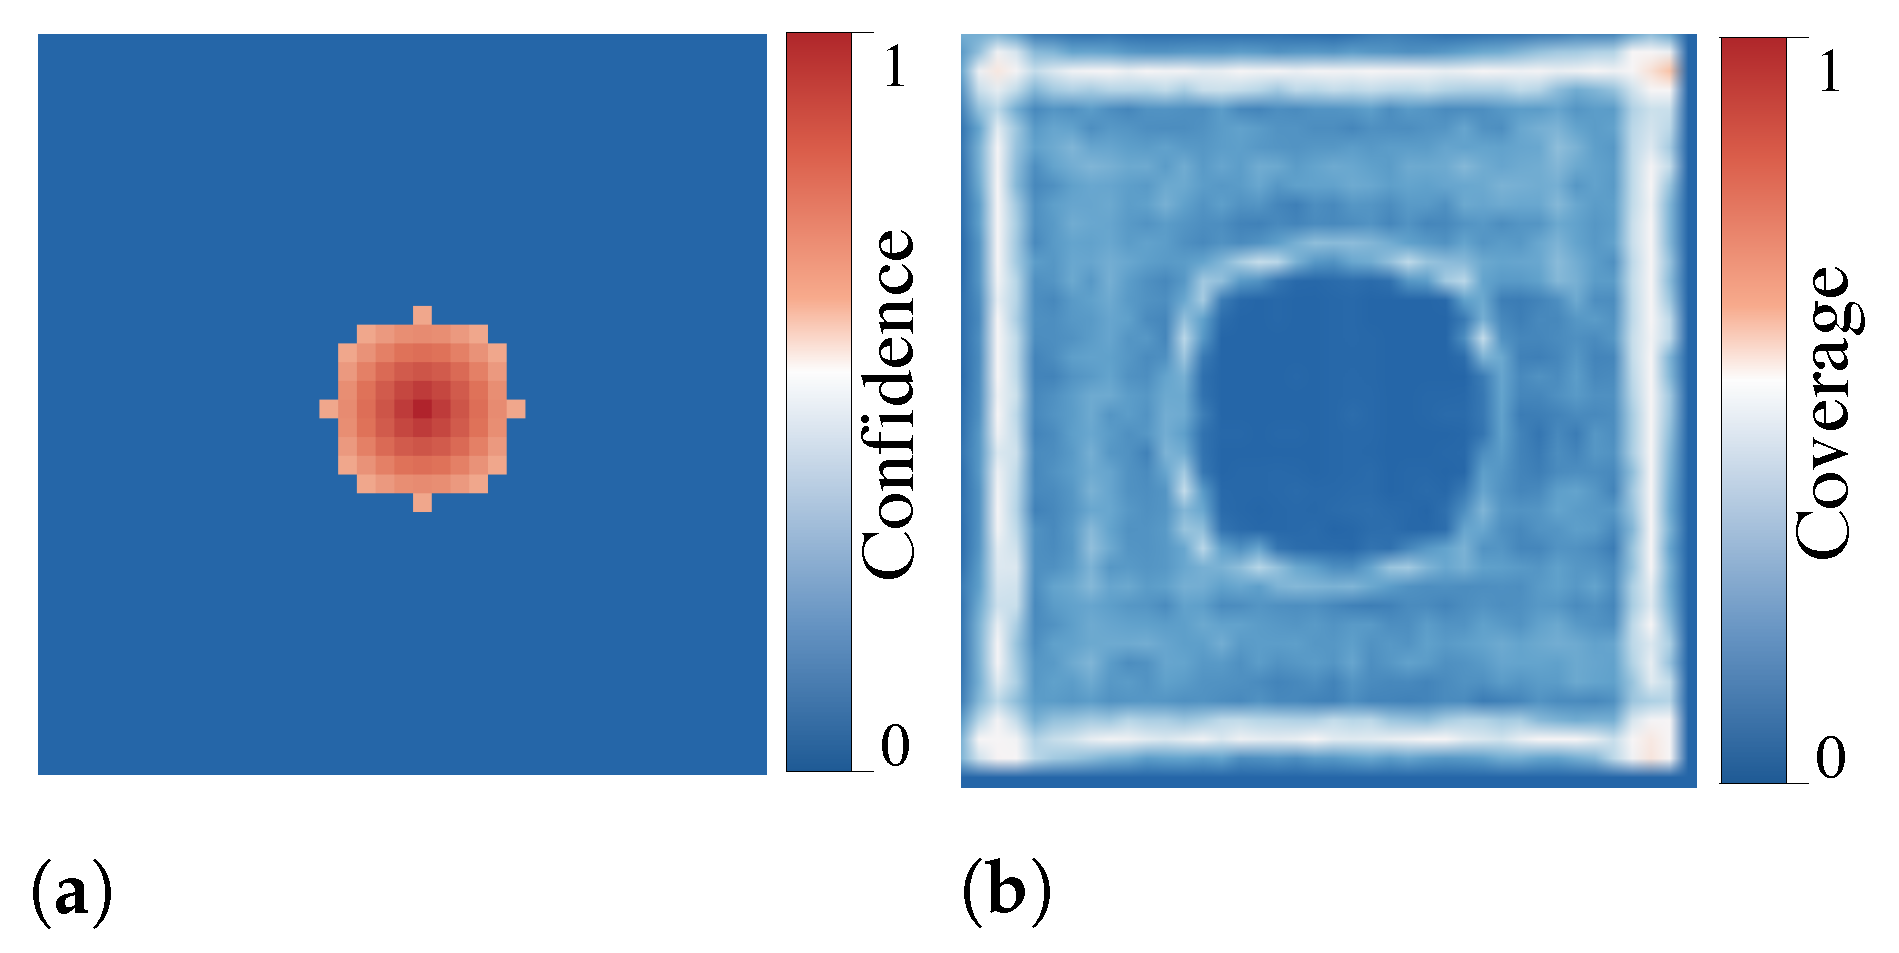
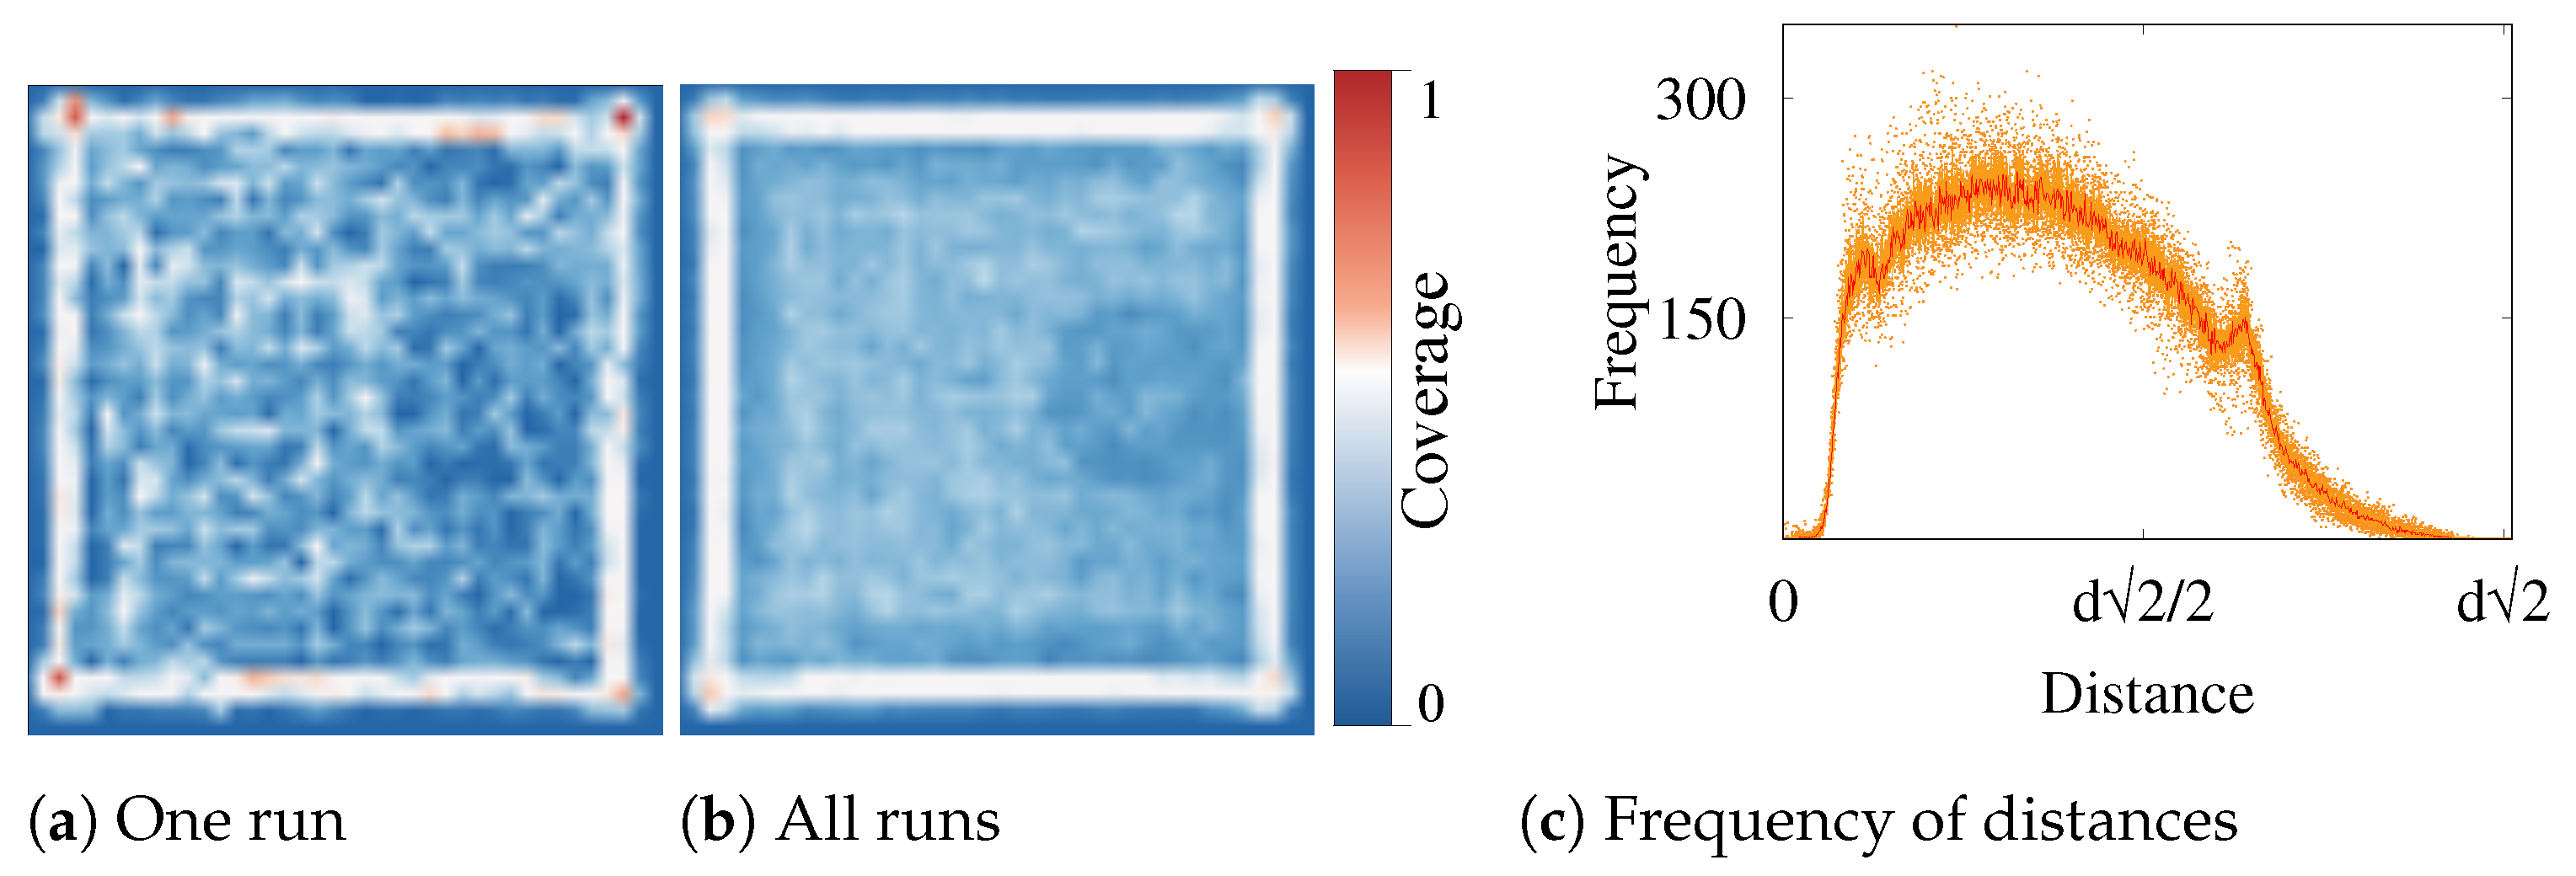
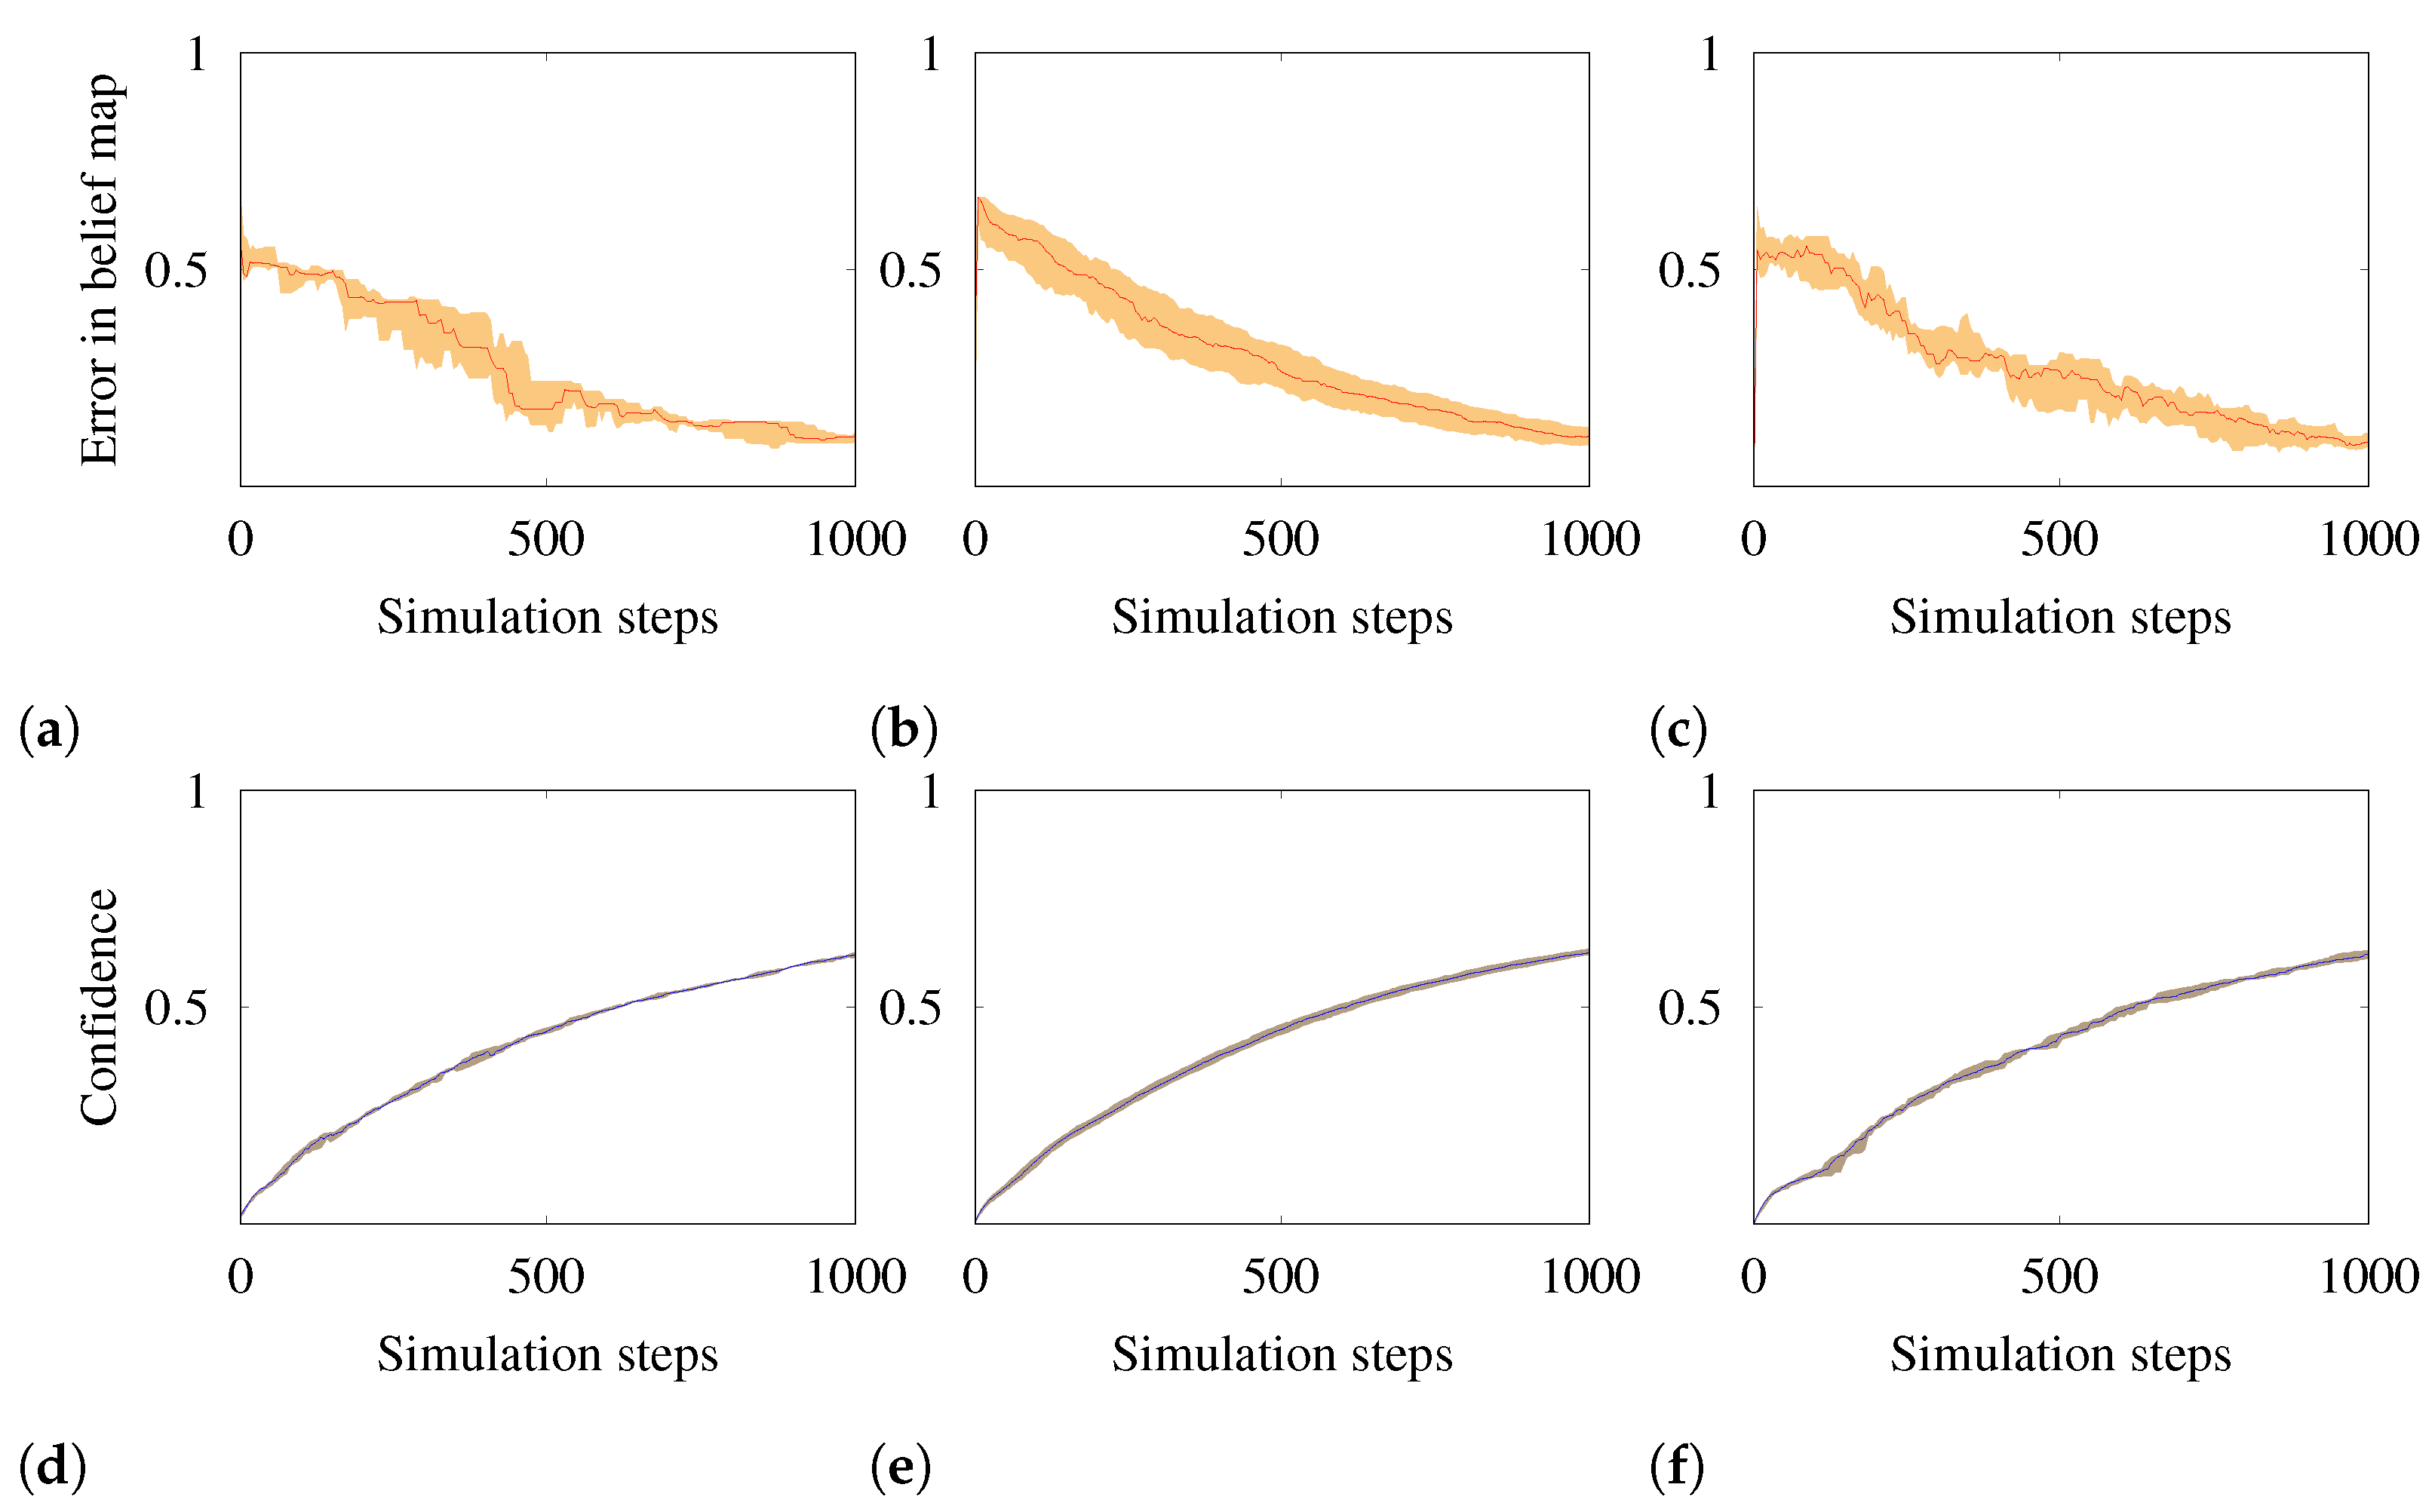
5.1. Experiment I: Autonomous Exploration

In the first experiment, the operator monitors the swarm while the UAVs explore the area, gain confidence over the entire mission zone, build a belief map, and inform the operator about the situation. We measure the accuracy of the resulting belief map by comparing it to the actual situation.
Confidence maps evolve as the UAVs explore the environment and receive information from their neighbors. This evolution also depends on the decay factor ( α ). In this case, the confidence map does not age fast and the certainty accumulates until the entire area is marked with high confidence.
Figure 5 shows the area coverage accumulated during one simulation run (see Figure 5a) and an averaged coverage for all 15 simulation runs (see Figure 5b). The distribution of the swarm is almost uniform, except near the boundaries (white), where there are denser footprints due to boundary avoidance. Figure 5b also shows a circular area at the right side of the zone (dark blue) with sparser coverage. This area is the communication range of the operator with high confidence values. The reason for having a high confidence in this region is that the confidence maps that the operator receives always have high values around the operator, as this is where the UAVs visited most recently. When an UAV enters this region, it receives an update from the operator and by averaging its confidence with the one from the operator, the UAV notices an area with high confidence values and refuses to explore it. By averaging over all simulation runs we see that this region is less explored.
Figure 5c shows the frequency of distances between the UAVs. The low frequency of distances around zero shows that the collisions are rare. The two minor peaks before and after the global maximum are caused by the clusters of UAVs around the boundaries (white box in Figure 5b).
Figure 6 shows the accuracy of the mapping over time. The error in the belief map is the absolute difference between the UAVs’ belief maps and the actual disaster scenario in the mission zone. Using a belief map of size 40 × 40, the theoretical maximum level of error is 1600. Nonetheless, the highest error we see during our experiments is 21 and for visibility we use that as our maximum error in the figures. Similarly, with the human intervention, the confidence can theoretically reach a very high or a very low value, but in our experiments we bound the range to [ 0 , 2000 ] . Errors in the belief map start at around 14 pixels, which is the number of cells in the belief map that cover the disaster zone and the operator (normalized to 0 . 6 ¯ ; maximum is 21). The swarm explores the area and gradually constructs an accurate map and the error in the belief map decreases. The confidence level increases over time and with all the cells in a confidence map of size 40 × 40 set to one, the confidence can rise up to 1600 (normalized to 0.8 ; maximum is 2000). Figure 6 shows the precision of the belief map that the operator receives (see Figure 6c) and the average belief error among the UAVs (see Figure 6b). We can also observe the growth in the confidence level (see Figure 6d–f. We separately plot the progress in the maps of the swarm and the operator to compare the quality of the swarm’s perception and the information that is passed on to the operator (monitoring quality).

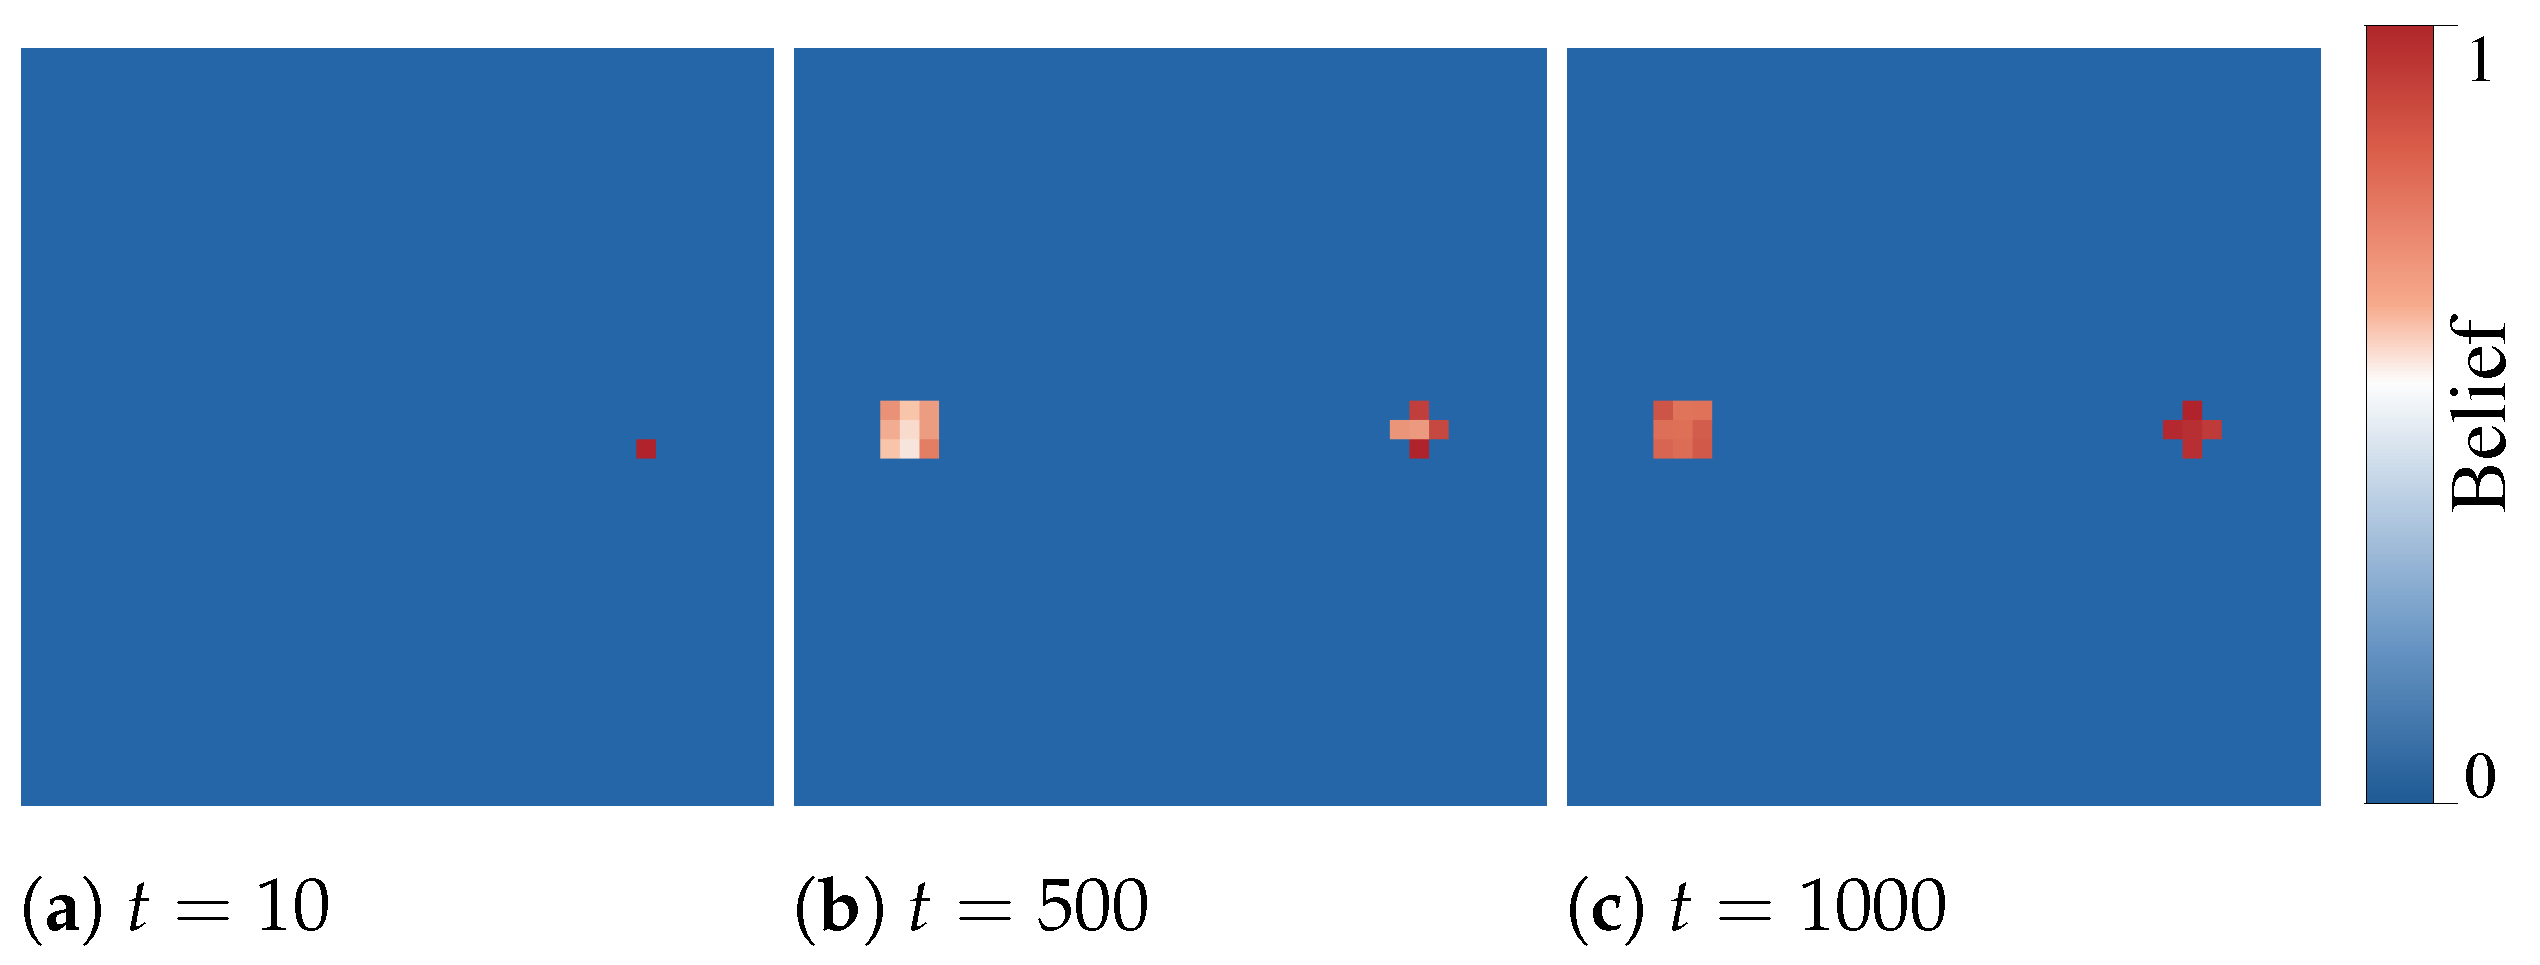
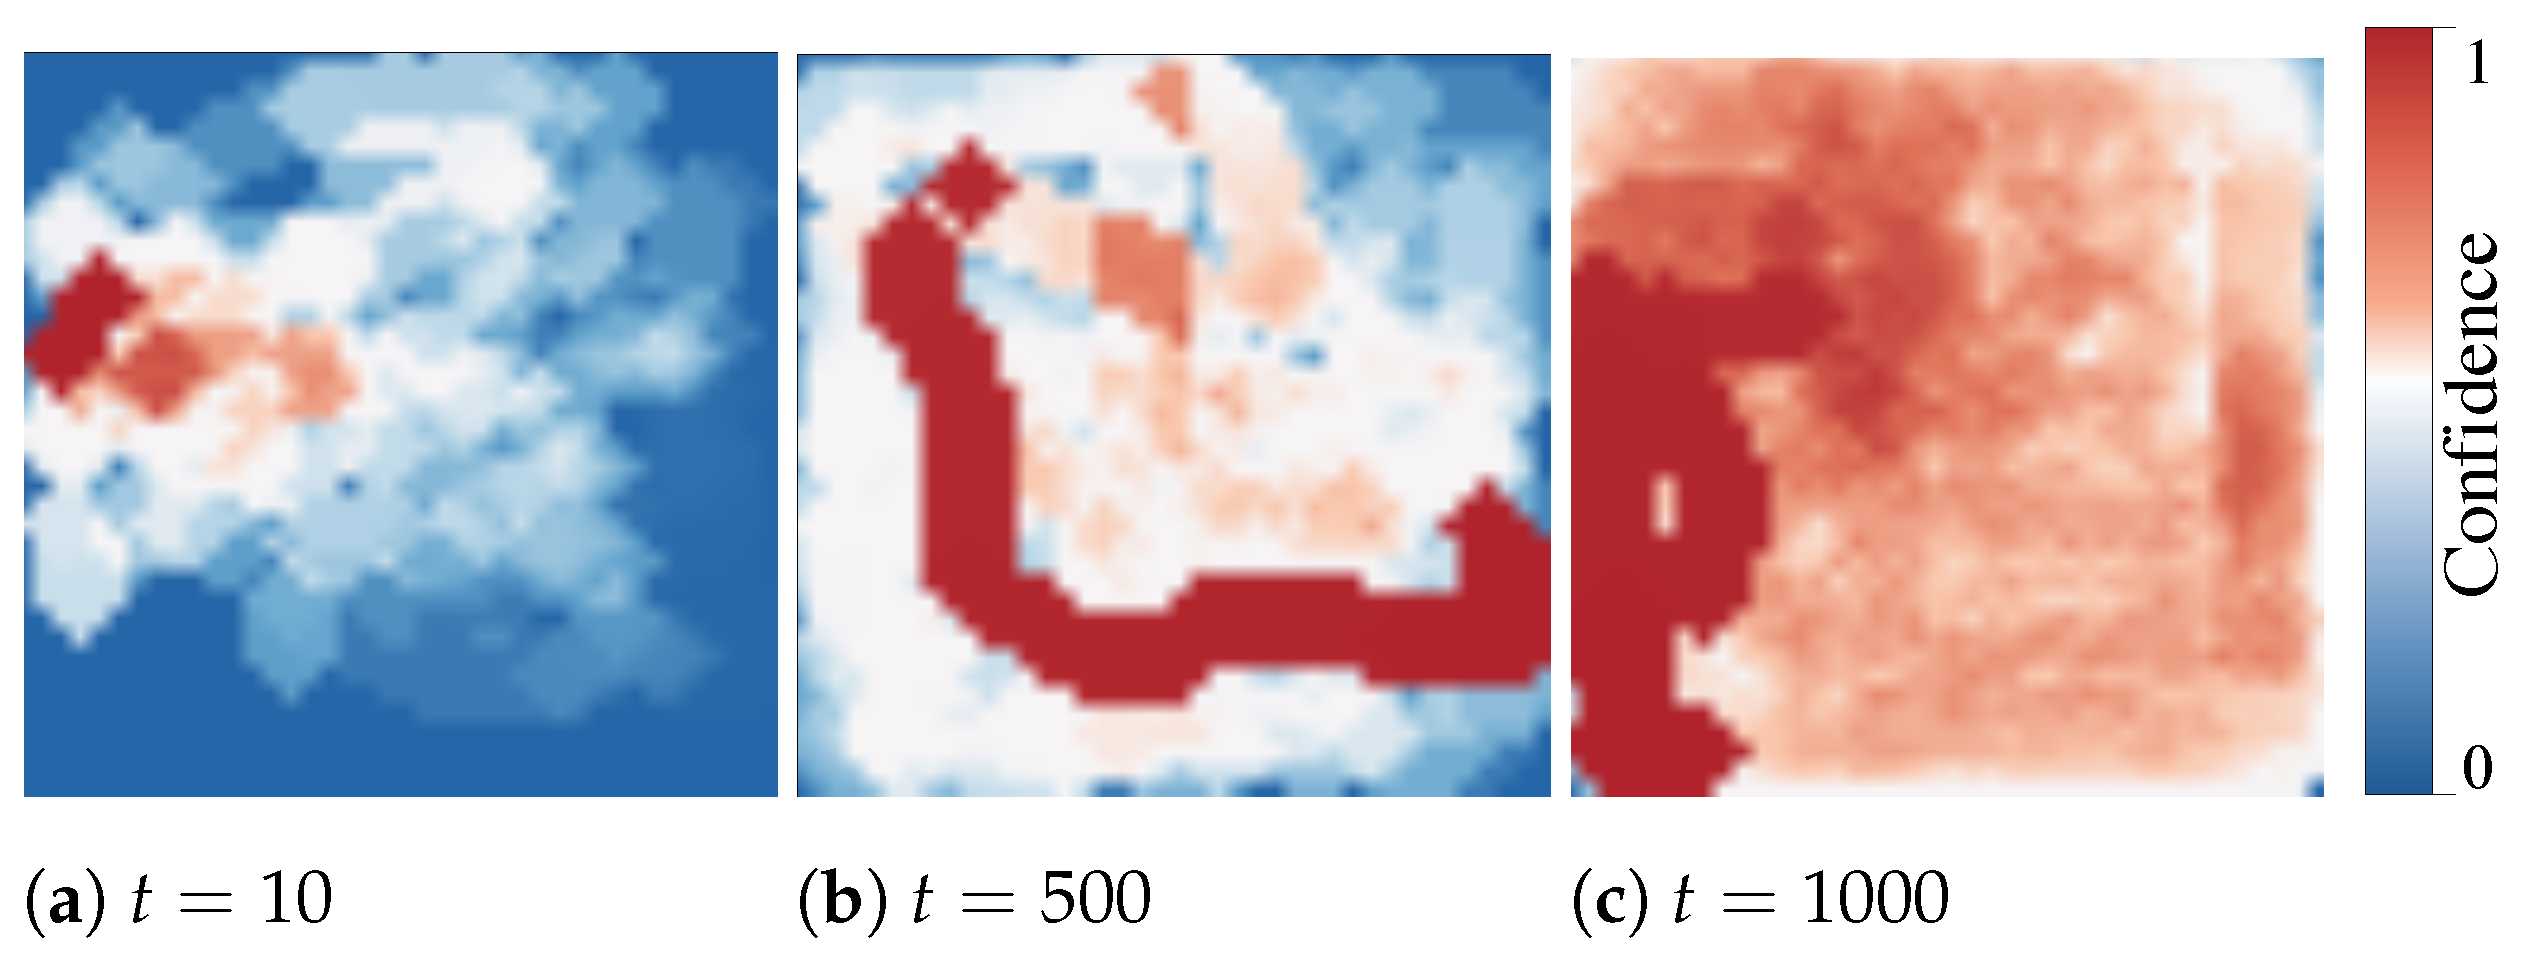
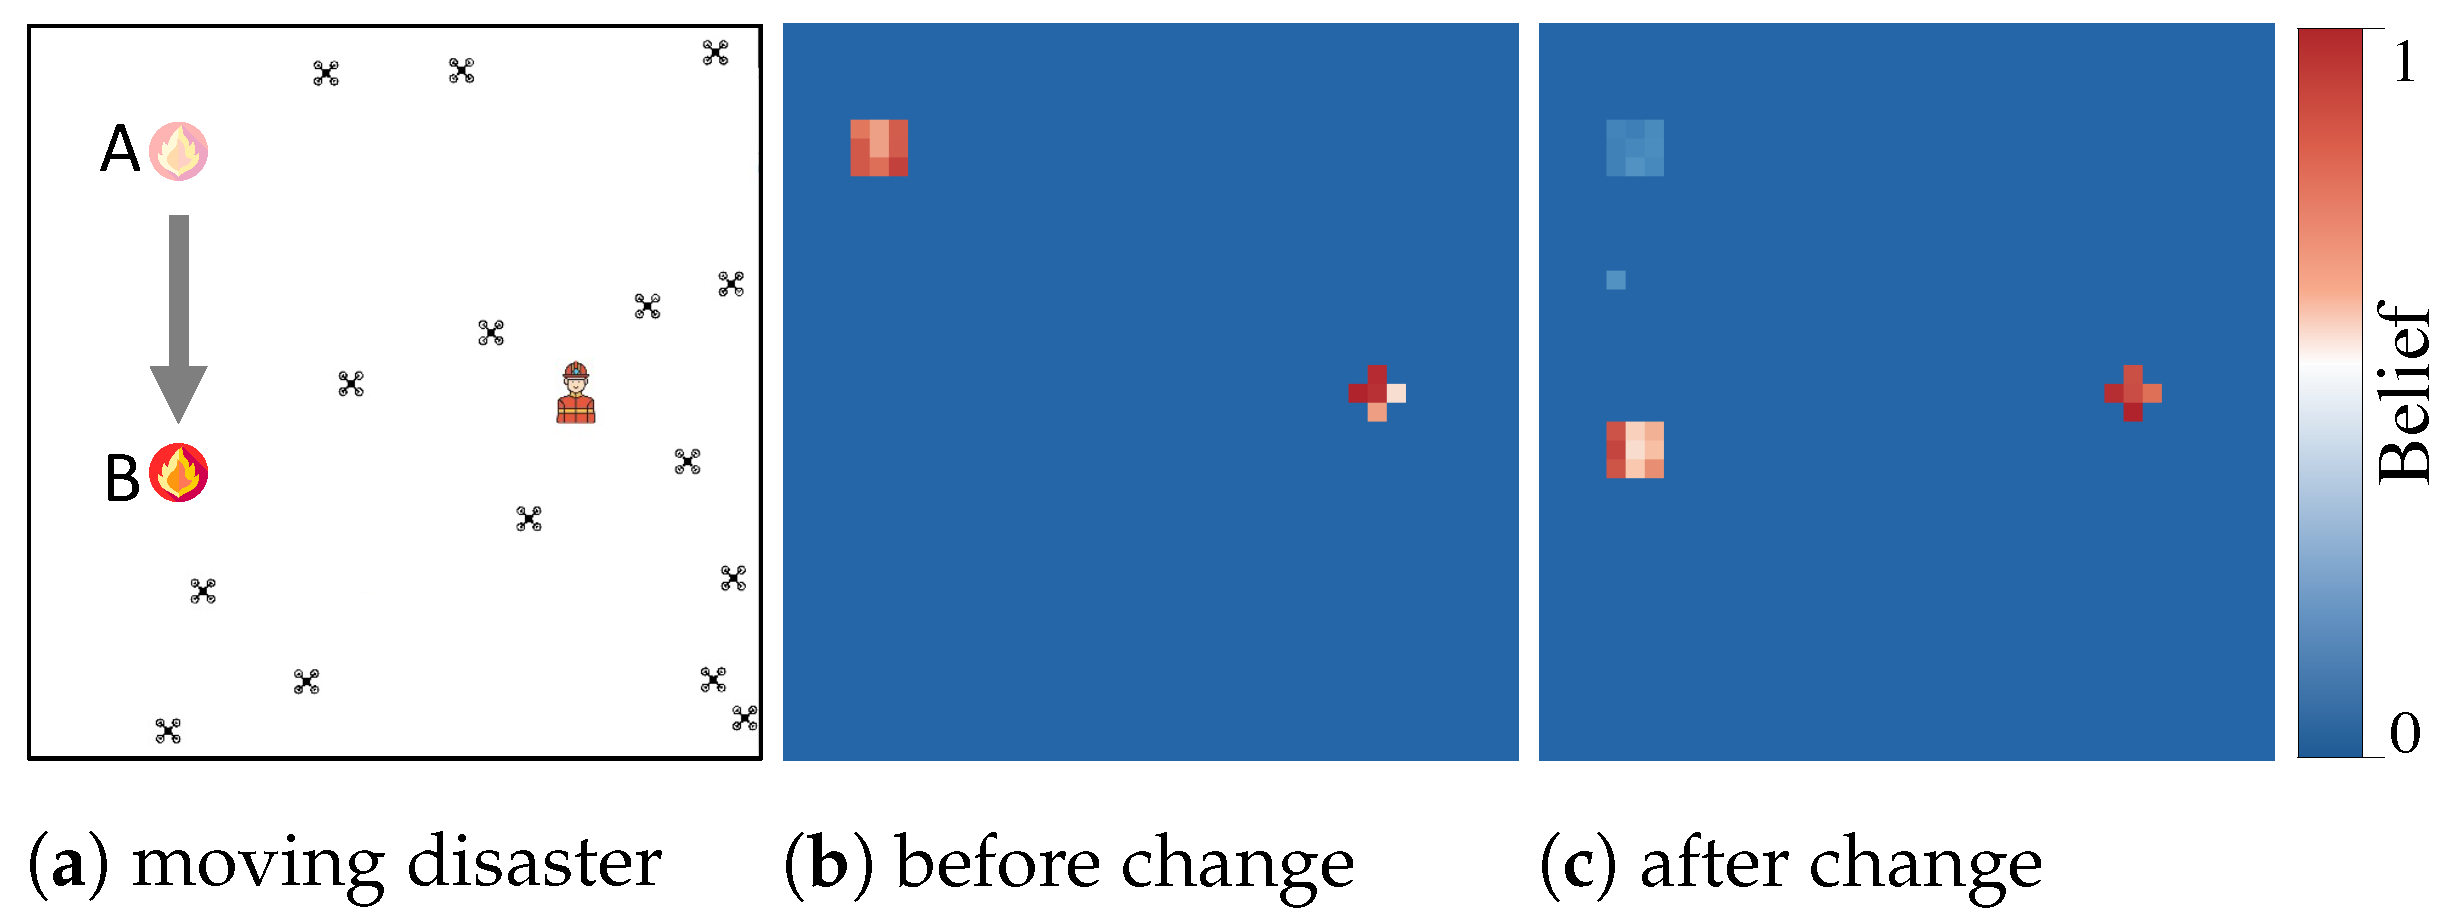
5.2. Experiment II: Response to Evolving Disaster

In this experiment, we examine the adaptivity of the mapping in a dynamic environment with an evolving disaster. As opposed to Experiment I, here we assume that the disaster zone is not fixed and it can move to another point in the area. The disaster zone moved between 150 < t < 350 simulation steps. We observe how this change is reflected in the performance of the swarm and the operator’s understanding of the environment. Note that the swarm still has full autonomy and the operator only monitors the swarm. Figure 7a shows the direction of the disaster displacement and Figure 7b shows the belief map when the motion is stopped. The operator’s belief map gradually adapts to the new position of the disaster (see Figure 7b,c). Figure 8a,b show the effect of a dynamic environment on the error in the belief of the swarm and the operator over time. The error increases at first as the environment starts to change, but after a while the swarm successfully adapts itself.
This behavior can also be seen in Figure 7b,c by the former positions of the disaster slowly fading away and the new positions appearing in the belief maps. Shortly after, the UAVs successfully map the environment and notify the operator. The results from the evolving disaster experiment show that the swarm is resilient to changes in the environment and the operator’s belief map stays updated.

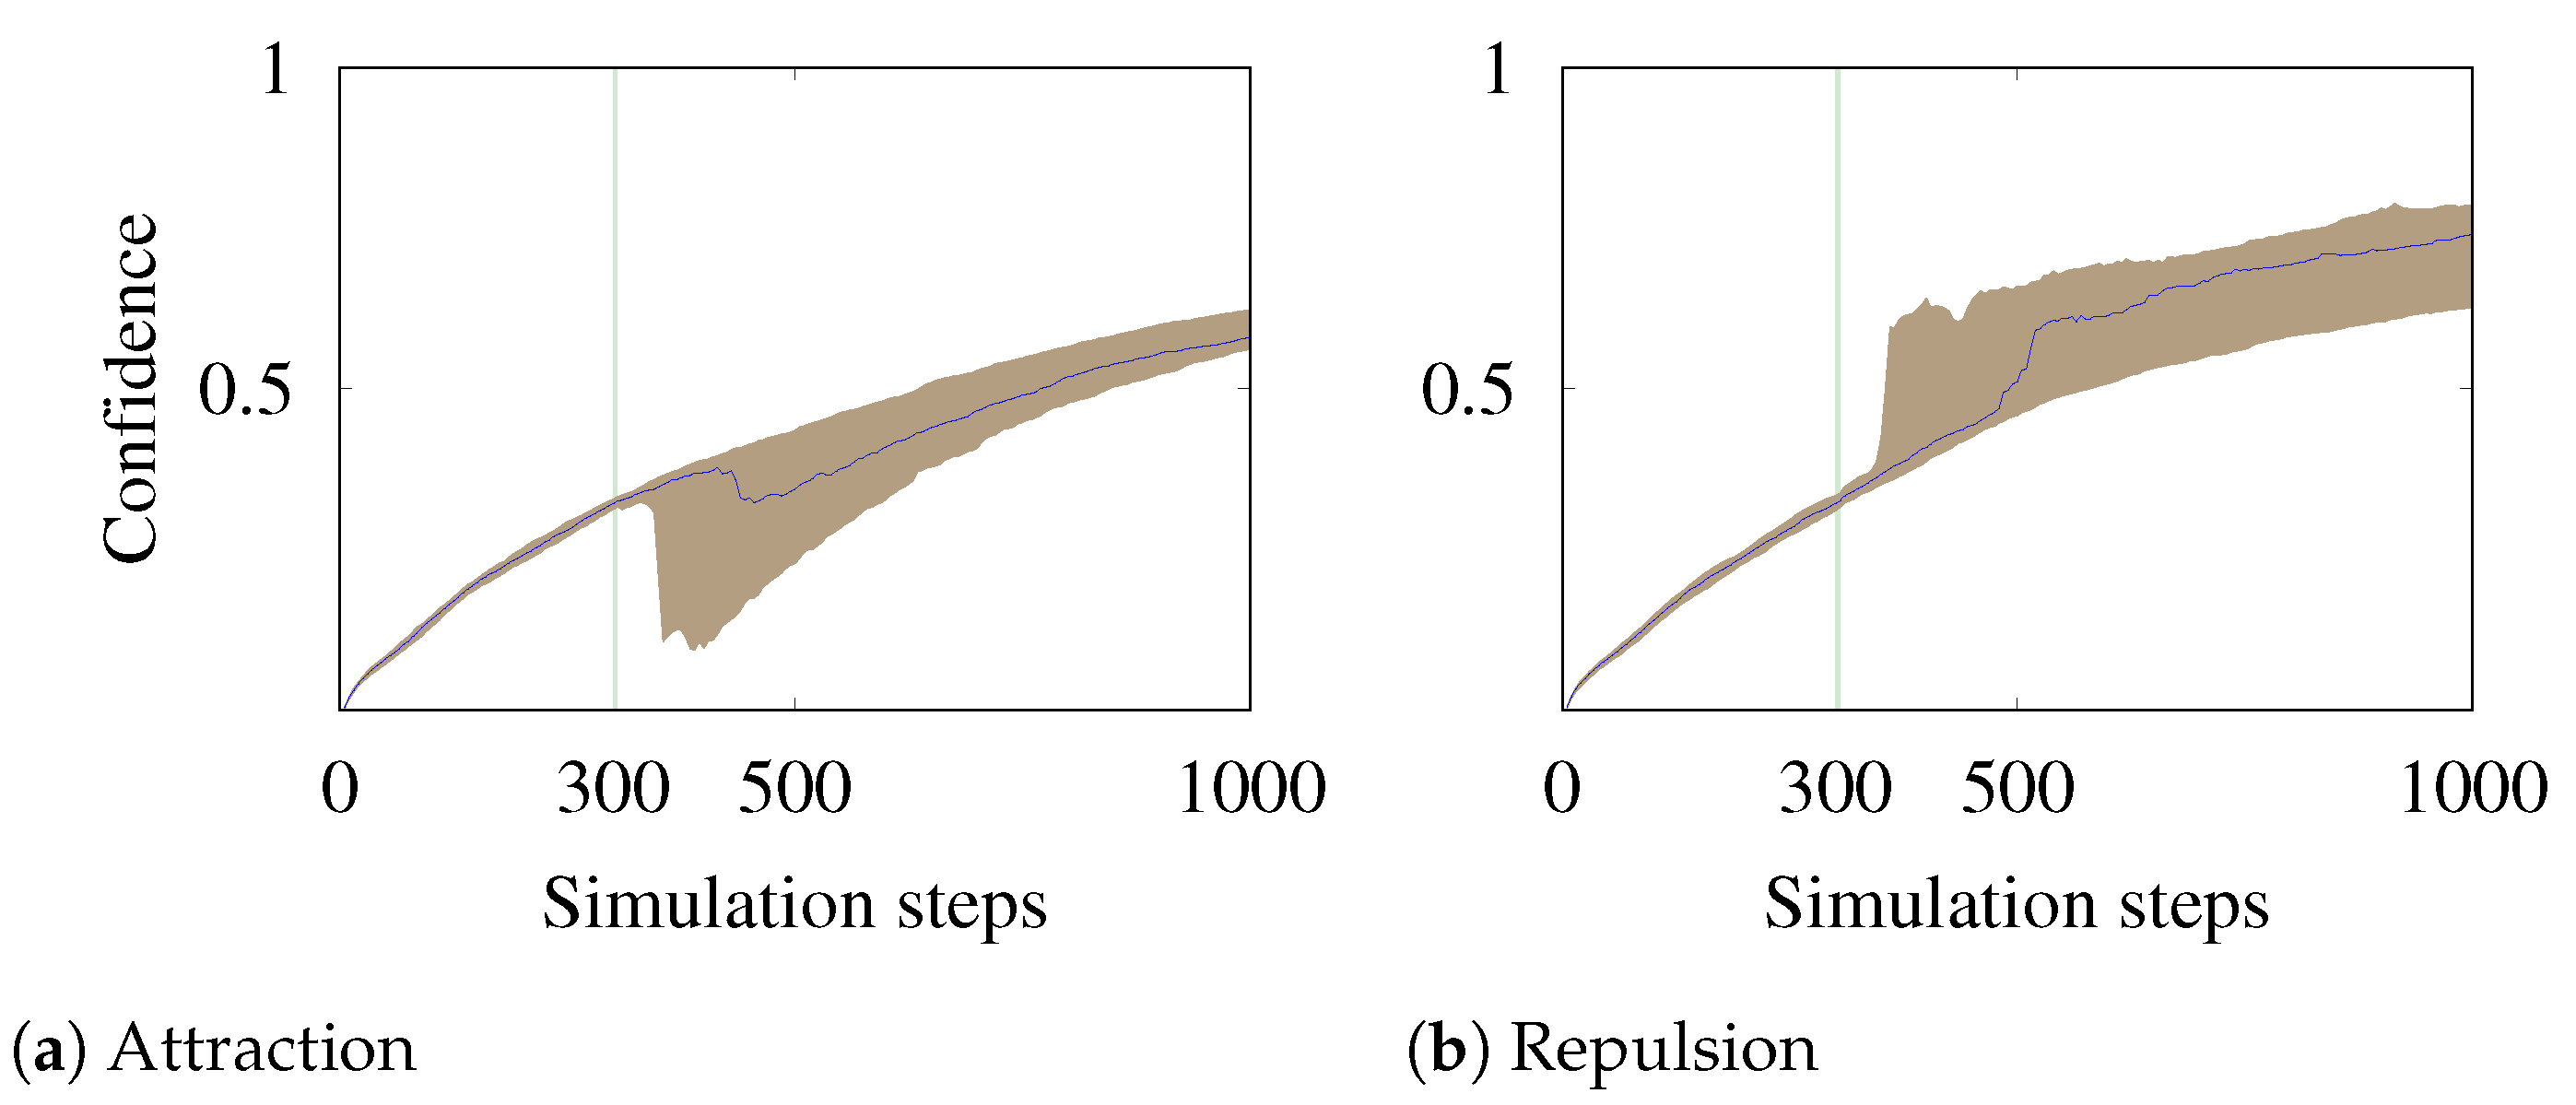
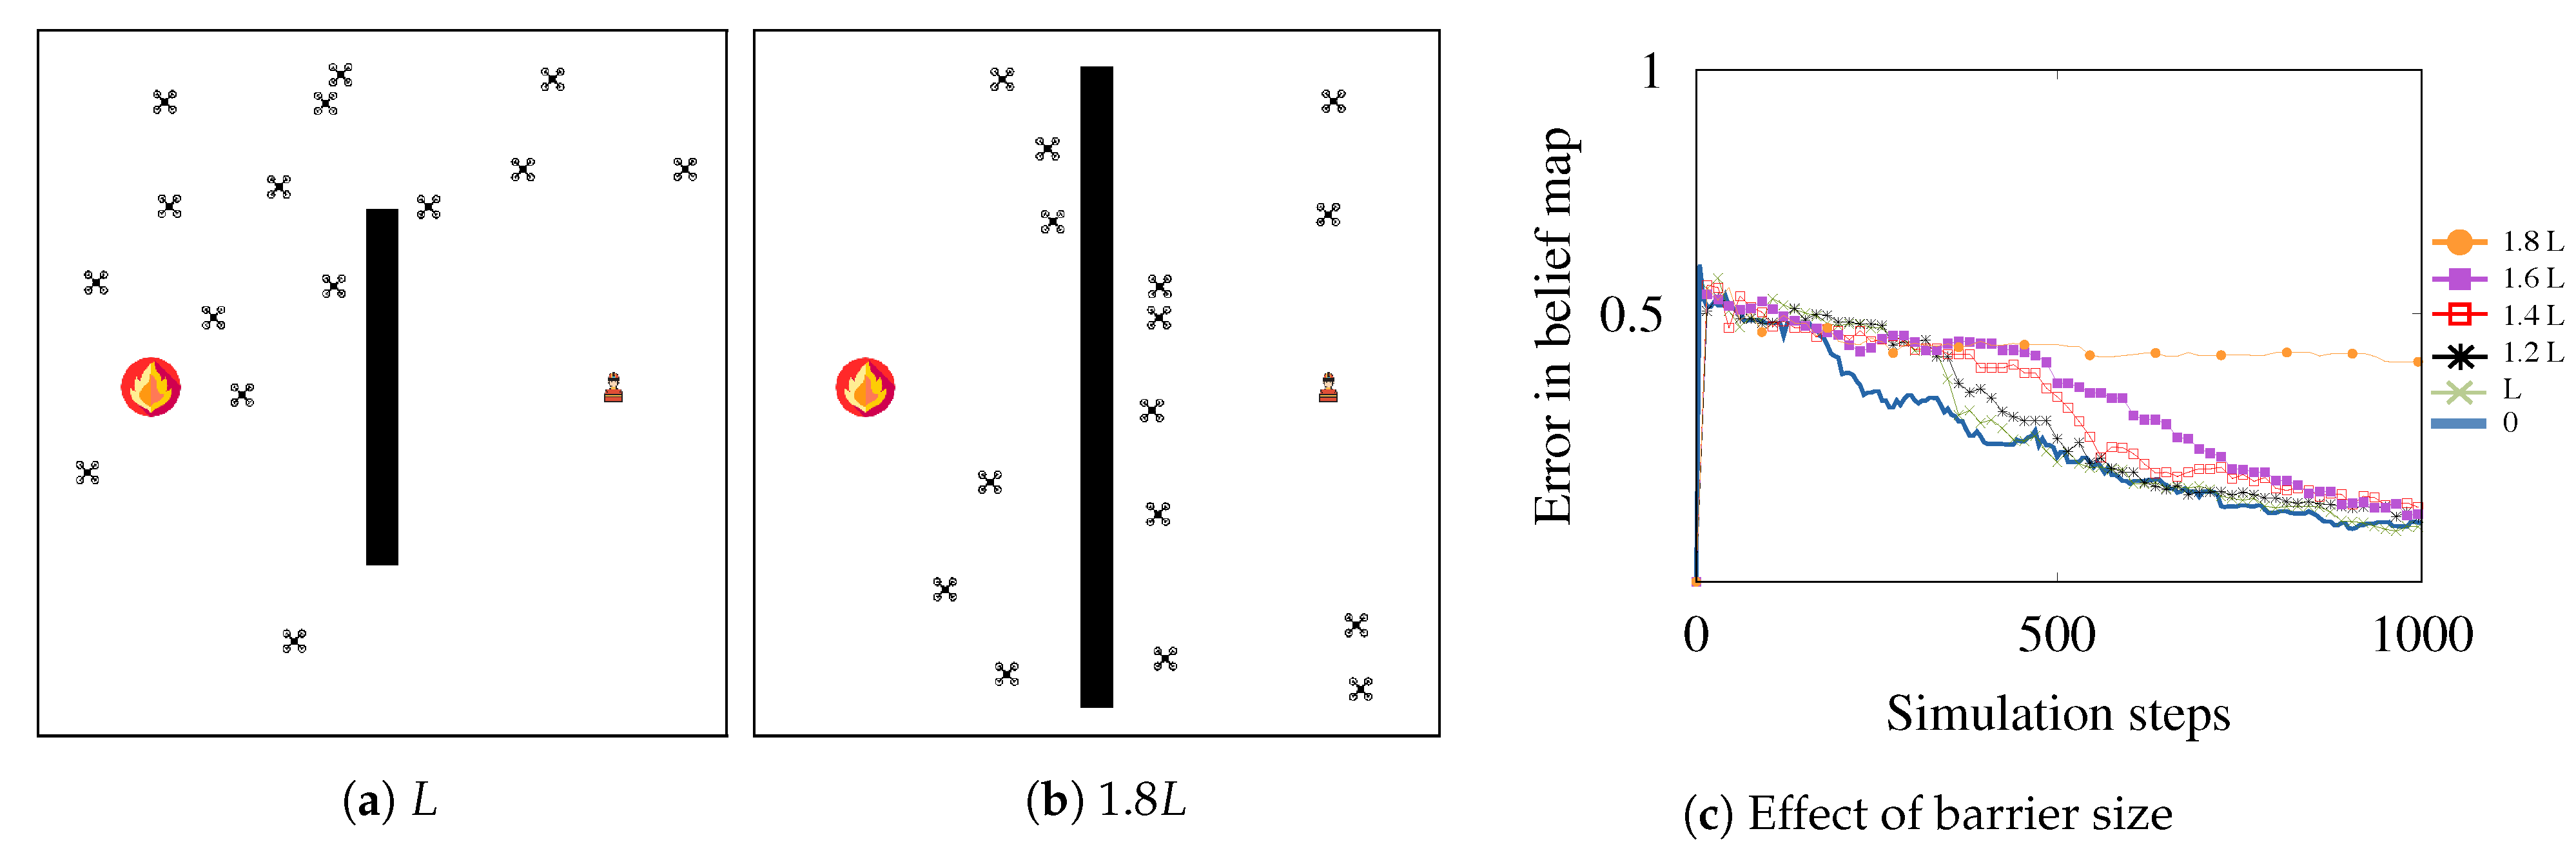
5.3. Experiment III: Human Interaction

After investigating the swarm’s autonomous behavior, we now focus on the human–swarm communication link.
The decision of whether to influence the map or not can entirely affect the autonomy of the swarm (i.e., flexible autonomy). Leaving the confidence map untouched allows a fully autonomous swarm approach while manipulating the entire map would create an almost fully manual control over the swarm’s behavior.
In this experiment, we observe the behavior of the swarm with the operator’s control and evaluate the task completion. The operator can lead the swarm to explore an area of interest (attraction) or prevent them from flying over a no-fly zone (repulsion) by manipulating its own confidence map and disseminating it to the neighboring UAVs. For example, the operator can send a new confidence map with attraction in the middle of the mission zone to its neighboring UAVs. As the UAVs continuously update their confidence map based on their neighbors, some of them may receive the operator’s confidence map and move according to the potential field.
Figure 9 shows the influence of the operator’s command on the confidence of an UAV and how the UAV is controlled. Figure 9a illustrates the confidence map that the operator introduces to the swarm to attract them to the middle of the arena. After receiving the command, the UAV in this example computes the mean of its previous confidence map (see Figure 9b) and the command to update its map (see Figure 9c). As a result of the attraction force, the UAVs move towards the area in the middle and this influence diminishes. The UAVs’ presence in the middle of the arena can be inferred as the values in the middle of the confidence map increase (see Figure 9d). The operator’s communication range determines the controlling impact of the operator on the swarm.
Using wider communication ranges, the operator influences more UAVs and therefore the effect is more significant. Figure 10 shows the effect of a human interaction on the confidence level of the swarm. At t = 300 the operator disseminates a command once and it takes 100 to 200 simulation steps to significantly influence the entire swarm. In case of attraction, UAVs quickly move to the cells with low confidence and immediately compensate the drop in the certainty level (see the valley in Figure 10a), while in repulsion the UAVs cannot visit the cell to recover from the added value to the confidence as they are repelled from that region. This explains the recovery of the confidence levels in Figure 10a and the bias that stays in the swarm for the rest of the experiment in Figure 10b.
So far, we have covered the temporary attraction and repulsion. We also assume a disaster situation where UAVs must avoid a certain area at all times. An example can be the frequent flying zone of an airport or a no-fly area with high voltage cables. For that, the operator can continuously apply a repulsion force from the prohibited zone. Figure 11a shows the confidence bias that the operator introduces to the swarm. The cells highlighted with red mark the barrier or the prohibited zone. The blue area in Figure 11a can be either empty, which allows the swarm to keep the knowledge about the confidence and only manipulate the values in the interest zone or it can be set to zero, which may gradually decrease the swarm’s confidence level on all the other areas. Figure 11b shows the average distribution of the UAVs in all simulation runs as a result of the permanent repulsion at the center. From the low coverage at the center of Figure 11b, it is clear that the operator successfully controlled the swarm to avoid the area in the middle of the mission zone. As the communication range is limited, there is a delay until all UAVs become aware of the new force introduced by the operator. In the meantime, even though the operator command is already issued, some UAVs are unaware and cross the prohibited zone. The ring in the distribution around the repellent zone is caused by the area with the equilibrium between different repulsion forces.
We increased the task complexity and simulated the influence of five permanent no-fly zones of length L to 1.8 L (imposed restrictions by the operator) in the middle of the arena (see Figure 12a,b). We assume that the messages cannot travel through the obstacles. Figure 12c shows the error in the operator’s belief map with and without barriers. As the size of the barrier grows, the precision of the mapping decreases. For 1.8 L, the barrier is too spacious for the swarm to adequately travel around it and keep the operator updated about the situation, and the precision of the belief map decreases (i.e., the belief error does not significantly decline over time). Our results show that the swarm is able to follow a wide range of control commands and continue to offer a precise mapping of the environment.

5.4. Experiment IV: Human–Swarm Interaction User Study

In this final experiment, we performed an additional technology-probe user study. We compared the situation awareness of a fully autonomous swarm, a human–swarm system, where only the target is specified by the operator (Task I). Despite the preference of the users, discussed in Section 2, we conducted another experiment where the operator controls individual drones (Task II). We posted a call for participation in a small online community. Fifteen computer scientists with BSc and MSc degrees in Computer Science or Engineering were recruited. The users were given a remote access to the machine with the simulation environment. We briefed the users about the goal of the experiment in a 10- to 15-minute video call before the experiment. We made another call for 10–15 minutes to collect their feedback after they performed the experiment. Users could observe the belief and confidence maps. They were asked to predict the significance of the areas that needed to be further explored. The number of clicks on the confidence map (number of commands) was left as a choice to the users. In Task II, the users had access to the list of UAVs. They could select the UAVs and assign a target to it by clicking on a cell of the confidence map. The Black line-point in Figure 13 shows the median belief error using this approach.
For Task I, we asked the users to operate the swarm using our interface. They needed to only click on a cell in the confidence map that they wanted to be explored. They did not need to select single UAVs themselves. The blue points in Figure 13 show the median belief error using our interface. In both experiments, the disaster moves in a random direction and the human operator waits for a while to let the swarm explore the area (neglect benevolence [36]). This explains the overlapping performance between all experiments (autonomous exploration, operator controlling a single UAV, and operator controlling the swarm) at the early stage of the experiment. Once the new location of the disaster emerges, we observe that the operator frequently commands the swarm to narrow the exploration area to the points with higher belief values. As shown in Figure 13, the accuracy with human intervention is better than the results from the fully autonomous exploration. We also observe that the performance with our interface (Task I) and the individual UAV control (Task II) is almost identical. However, the cognitive workload of having to select individual UAVs first and then selecting the target area is much higher than only picking the target areas. For larger swarm sizes, controlling individual UAVs is not feasible. On the contrary, our interface is scalable. The operator can select areas of interest, regardless of the swarm size and the swarm will self-organize to assign individual target points.

6. Discussion and Future Work

Establishing a reliable interaction between human operators and a swarm comes with plenty of issues. In this paper, we focused on the issue of situation awareness with a swarm and an operator when all interactions are local without imposing a high cognitive complexity. Our results show that the same map can be used for both visualization and control of the swarm. The operator has to interact with the swarm via this map and there is no need for one-to-one interaction with each member of the swarm, which can be overwhelming for a human operator. We made a few assumptions to prove the concept. We have not performed a parameter sensitivity analysis and our parameters were chosen experimentally. For instance, our swarm size was fixed when studies show that the swarm density has an effect on performance [37]. Another point of discussion is the scalability of our approach. Our method relies on local interactions and allows for scalable human–swarm interaction in mapping an unexplored environment. The only limit for scalability is that as the exploration area grows, the mapping resolution decreases. A potential solution for this can be registering local images and constructing a global image at the human operator’s side.
There are several directions that this research can be extended: (1) We plan to investigate the effect of multiple dynamic disaster areas and human operators with collaborative/competitive management strategies. Besides the competing operator commands, there may also be intruder attacks by other UAVs or operators that need to be detected and eliminated from the decision-making process; (2) The effect of noise (communication, positioning, and sensing) on the performance of the swarm and detecting malfunctioning/lost UAVs need to be investigated as well; (3) Speed versus accuracy can be studied with several messaging qualities. (4) One of our next steps will be to co-create an interaction interface for human–swarm teams with experts from the industry and perform a more comprehensive user study; (5) Variations that may be induced by the operator bias in the human-in-the-loop experimentation; (6) In some use-cases it might prove useful to direct a subset of the swarm by a more complex communication protocol that allows access to certain members of the swarm without affecting the entire swarm; (7) We also plan to address some of these challenges and implement our approach on physical UAVs and evaluate the performance of the swarm in real world applications.

7. Conclusions

A user study with 100 participants showed that users prefer to have a global overview of the swarm’s coverage instead of monitoring individual agents, especially for large swarm sizes and when the time is critical. We showed that a human–swarm interaction based on a global view of the swarm with a human-in-the-loop decision-making can assist the swarm to map a dynamic environment. Using our approach, human operators do not require a fully-connected communication network with all UAVs to be able to monitor the swarm and control them. In our experiments, an operator controlled a group of simulated UAVs and successfully explored the environment even when it was dynamic. Our approach is easily reproducible and can serve as a basis for monitoring and controlling the swarm in various application domains such as agricultural missions, space exploration, etc.

Author Contributions

Conceptualization, M.D.S., D.T. and S.D.R.; methodology, M.D.S., D.T. and S.D.R.; software, M.D.S. and J.G.; validation, M.D.S. and J.C.; formal analysis, M.D.S. and J.C.; investigation, M.D.S. and J.C.; resources, M.D.S.; data curation, M.D.S. and J.C.; writing—original draft preparation, M.D.S., J.C., J.G., D.T., and S.D.R.; writing—review and editing, M.D.S. and J.C.; visualization, M.D.S. and J.C.; supervision, D.T. and S.D.R.; project administration, S.D.R.; funding acquisition, M.D.S. and S.D.R.; All authors have read and agreed to the published version of the manuscript.

Funding

We acknowledge funding from the UKRI Trustworthy Autonomous Systems Hub (EP/V00784X/1).

Institutional Review Board Statement

The study was conducted according to the Data Protection Act 1998, and approved by the Ethics Committee of University of Southampton (Ethics and Research Governance Online number 66360.A1 on 23 August 2021).

Informed Consent Statement

Informed consent was obtained from all subjects involved in the study.

Data Availability Statement

Not applicable.

Acknowledgments

Not applicable.

Conflicts of Interest

The authors declare no conflict of interest.

References

  1. Innocente, M.S.; Grasso, P. Self-organising swarms of firefighting drones: Harnessing the power of collective intelligence in decentralised multi-robot systems. J. Comput. Sci. 2019, 34, 80–101. [Google Scholar] [CrossRef]
  2. Gkotsis, I.; Kousouraki, A.C.; Eftychidis, G.; Kolios, P.; Terzi, M. Swarm of UAVs as an emergency response technology. Risk Analysis Based on Data and Crisis Response Beyond Knowledge. In Proceedings of the 7th International Conference on Risk Analysis and Crisis Response (RACR 2019), Athens, Greece, 15–19 October 2019; p. 353. [Google Scholar]
  3. Busnel, Y.; Caillouet, C.; Coudert, D. Self-organized Disaster Management System by Distributed Deployment of Connected UAVs. In Proceedings of the ICT-DM 2019-6th International Conference on Information and Communication Technologies for Disaster Management, Paris, France, 18–20 December 2019; pp. 1–8. [Google Scholar]
  4. Chung, S.J.; Paranjape, A.A.; Dames, P.; Shen, S.; Kumar, V. A survey on aerial swarm robotics. IEEE Trans. Robot. 2018, 34, 837–855. [Google Scholar] [CrossRef] [Green Version]
  5. Hexmoor, H.; McLaughlan, B.; Baker, M. Swarm Control in Unmanned Aerial Vehicles. In Proceedings of the IC-AI, Vegas, NV, USA, 27–30 June 2005; pp. 911–917. [Google Scholar]
  6. Liu, R.; Jia, F.; Luo, W.; Chandarana, M.; Nam, C.; Lewis, M.; Sycara, K. Trust-Aware Behavior Reflection for Robot Swarm Self-Healing. In Proceedings of the 18th International Conference on Autonomous Agents and MultiAgent Systems, Montreal, QC, Canada, 13–17 May 2019; pp. 122–130. [Google Scholar]
  7. Matsuka, K.; Feldman, A.O.; Lupu, E.S.; Chung, S.J.; Hadaegh, F.Y. Decentralized Formation Pose Estimation for Spacecraft Swarms. Adv. Space Res. 2020, 67, 3527–3545. [Google Scholar] [CrossRef]
  8. Cain, M.S.; Wendell, D.M. Human perception and prediction of robot swarm motion. Micro-and Nanotechnology Sensors, Systems, and Applications XI. Int. Soc. Opt. Photonics 2019, 10982, 1098226. [Google Scholar]
  9. Lindner, S.; Schulte, A. Evaluation of Swarm Supervision Complexity. In International Conference on Intelligent Human Systems Integration; Springer: Berlin/Heidelberg, Germany, 2021; pp. 50–55. [Google Scholar]
  10. Patel, J.; Xu, Y.; Pinciroli, C. Mixed-granularity human-swarm interaction. In Proceedings of the 2019 International Conference on Robotics and Automation (ICRA), IEEE, Montreal, QC, Canada, 20–24 May 2019; pp. 1059–1065. [Google Scholar]
  11. Ramchurn, S.D.; Wu, F.; Jiang, W.; Fischer, J.E.; Reece, S.; Roberts, S.; Rodden, T.; Greenhalgh, C.; Jennings, N.R. Human–agent collaboration for disaster response. Auton. Agents Multi-Agent Syst. 2016, 30, 82–111. [Google Scholar] [CrossRef] [Green Version]
  12. Nam, C.; Walker, P.; Li, H.; Lewis, M.; Sycara, K. Models of trust in human control of swarms with varied levels of autonomy. IEEE Trans. Hum.-Mach. Syst. 2019, 50, 194–204. [Google Scholar] [CrossRef]
  13. Ashcraft, C.C. Moderating Influence as a Design Principle for Human-Swarm Interaction; Brigham Young University: Provo, UT, USA, 2019. [Google Scholar]
  14. Oliveira, T.L.; Batista, M.R.; Romero, R.A. Analysis of human-swarm interaction through potential field manipulation. In Proceedings of the 2017 Latin American Robotics Symposium (LARS) and 2017 Brazilian Symposium on Robotics (SBR), IEEE, Curitiba, Brazil, 8–10 November 2017; pp. 1–6. [Google Scholar]
  15. Levillain, F.; St-Onge, D.; Zibetti, E.; Beltrame, G. More than the sum of its parts: Assessing the coherence and expressivity of a robotic swarm. In Proceedings of the 2018 27th IEEE International Symposium on Robot and Human Interactive Communication (RO-MAN), IEEE, Nanjing, China, 27–31 August 2018; pp. 583–588. [Google Scholar]
  16. Capelli, B.; Secchi, C.; Sabattini, L. Communication through motion: Legibility of multi-robot systems. In Proceedings of the 2019 International Symposium on Multi-Robot and Multi-Agent Systems (MRS), IEEE, New Brunswick, NJ, USA, 22–23 August 2019; pp. 126–132. [Google Scholar]
  17. Brooke, J. SUS - A Quick and Dirty Usability Scale. Usability Eval. Ind. 1996, 189, 4–7. [Google Scholar]
  18. Van Der Laan, J.D.; Heino, A.; De Waard, D. A simple procedure for the assessment of acceptance of advanced transport telematics. Transp. Res. Part C: Emerg. Technol. 1997, 5, 1–10. [Google Scholar] [CrossRef]
  19. Lancaster, H.O.; Seneta, E. Chi-square distribution. Encycl. Biostat. 2005, 2. [Google Scholar] [CrossRef]
  20. Shaffer, J.P. Multiple hypothesis testing. Annu. Rev. Psychol. 1995, 46, 561–584. [Google Scholar] [CrossRef]
  21. Girden, E.R. ANOVA: Repeated Measures; Number 84; Sage: Newcastle upon Tyne, UK, 1992. [Google Scholar]
  22. Soorati, M.D.; Krome, M.; Mora-Mendoza, M.; Ghofrani, J.; Hamann, H. Plasticity in Collective Decision-Making for Robots: Creating Global Reference Frames, Detecting Dynamic Environments, and Preventing Lock-ins. In Proceedings of the 2019 IEEE/RSJ International Conference on Intelligent Robots and Systems (IROS), IEEE, Macau, China, 3–8 November 2019; pp. 4100–4105. [Google Scholar]
  23. Valentini, G.; Ferrante, E.; Dorigo, M. The best-of-n problem in robot swarms: Formalization, state of the art, and novel perspectives. Front. Robot. AI 2017, 4, 9. [Google Scholar] [CrossRef] [Green Version]
  24. Dorigo, M.; Theraulaz, G.; Trianni, V. Reflections on the future of swarm robotics. Sci. Robot. 2020, 5, eabe4385. [Google Scholar] [CrossRef] [PubMed]
  25. Valentini, G.; Brambilla, D.; Hamann, H.; Dorigo, M. Collective perception of environmental features in a robot swarm. In International Conference on Swarm Intelligence; Springer: Berlin/Heidelberg, Germany, 2016; pp. 65–76. [Google Scholar]
  26. Valentini, G.; Hamann, H.; Dorigo, M. Self-organized collective decision making: The weighted voter model. In Proceedings of the AAMAS, Paris, France, 5–9 May 2014; pp. 45–52. [Google Scholar]
  27. Valentini, G.; Hamann, H.; Dorigo, M. Efficient decision-making in a self-organizing robot swarm: On the speed versus accuracy trade-off. In Proceedings of the 2015 International Conference on Autonomous Agents and Multiagent Systems, Istanbul, Turkey, 4–8 May 2015; pp. 1305–1314. [Google Scholar]
  28. Kolling, A.; Walker, P.; Chakraborty, N.; Sycara, K.; Lewis, M. Human interaction with robot swarms: A survey. IEEE Trans. Hum.-Mach. Syst. 2015, 46, 9–26. [Google Scholar]
  29. Kolling, A.; Sycara, K.; Nunnally, S.; Lewis, M. Human swarm interaction: An experimental study of two types of interaction with foraging swarms. J. Hum.-Robot Interact. 2013, 2, 104–129. [Google Scholar] [CrossRef] [Green Version]
  30. Brown, D.S.; Kerman, S.C.; Goodrich, M.A. Human-swarm interactions based on managing attractors. In Proceedings of the 2014 ACM/IEEE International Conference on Human-Robot Interaction, Bielefeld, Germany, 3–6 March 2014; pp. 90–97. [Google Scholar]
  31. Choset, H.; Lynch, K.M.; Hutchinson, S.; Kantor, G.; Burgard, W.; Kavraki, L.E.; Thrun, S. Principles of Robot Motion: Theory, Algorithms, and Implementations; Chapter 7; The MIT Press: Cambridge, MA, USA, 2005. [Google Scholar]
  32. Soria, E.; Schiano, F.; Floreano, D. SwarmLab: A Matlab Drone Swarm Simulator. arXiv 2020, arXiv:2005.02769. [Google Scholar]
  33. Garcia, R.; Barnes, L. Multi-UAV Simulator Utilizing X-Plane. J. Intell. Robot. Syst. 2010, 57, 393–406. [Google Scholar] [CrossRef]
  34. Pinciroli, C.; Trianni, V.; O’Grady, R.; Pini, G.; Brutschy, A.; Brambilla, M.; Mathews, N.; Ferrante, E.; Di Caro, G.; Ducatelle, F.; et al. ARGoS: A modular, parallel, multi-engine simulator for multi-robot systems. Swarm Intell. 2012, 6, 271–295. [Google Scholar] [CrossRef] [Green Version]
  35. The Python Arcade Library. Project Website. 2019. Available online: http://arcade.academy/ (accessed on 1 November 2021).
  36. Walker, P.; Nunnally, S.; Lewis, M.; Kolling, A.; Chakraborty, N.; Sycara, K. Neglect benevolence in human control of swarms in the presence of latency. In Proceedings of the IEEE International Conference on Systems, Man, and Cybernetics (SMC), Seoul, Korea, 14–17 October 2012; pp. 3009–3014. [Google Scholar]
  37. Hamann, H.; Reina, A. Scalability in computing and robotics. IEEE Trans. Comput. 2021. [Google Scholar] [CrossRef]
Figure 1. Bar graphs to show mean usability (a) and acceptance (b) scores from subjective measures. Error bars = 95% CIs.
Drones 05 00131 g001
Figure 2. A map of a mission zone with UAVs, a disaster, and a human operator. All agents (UAVs and the operator) have belief and confidence maps with a lower resolution (40 × 40) compared to the actual images (600 × 600). The operator uses the interface to communicate with the UAVs in their local neighborhood.
Drones 05 00131 g002
Figure 3. The operator’s belief map at several simulation steps.
Drones 05 00131 g003
Figure 4. Confidence map at t = 10, 500, 1000 simulation steps.
Drones 05 00131 g004
Figure 5. The area coverage with the swarm at the end of a randomly selected run (a) and the average over all 15 simulation runs (b) in Experiment I. The frequency of distances between the UAVs in autonomous exploration experiment is also shown (c) where d is width/length of the mission zone.
Drones 05 00131 g005
Figure 6. The precision of mapping is shown in the error level of the belief map. This figure shows the belief error and the confidence level for the autonomous exploration experiment. The top row shows the errors in the belief map and the bottom row depicts the confidence levels over time. (a,d) are from one simulation run. (b,e) show the median values over all simulation runs. (c,f) are the belief error and the confidence level of the operator.
Drones 05 00131 g006
Figure 7. In Experiment II, the disaster area moves from point A to B (a) and the belief of the swarm gradually adapts to the change (b,c).
Drones 05 00131 g007
Figure 8. Median errors in the belief maps of the swarm (a) and the operator (b) in Experiment II. The disaster zone moves between 150 and 350 simulation steps (green area) as shown in Figure 7.
Drones 05 00131 g008
Figure 9. An example of the operator’s command at t 0 (a), an UAV’s confidence map before (b) and after receiving the command (c), and after swarm’s reaction to the influence by moving to the center (d) in Experiment III.
Drones 05 00131 g009
Figure 10. Influence of the operator’s command at t = 300 on the swarm’s confidence.
Drones 05 00131 g010
Figure 11. Operator’s confidence map for introducing a permanent repulsion (a) and the swarm’s distribution (b).
Drones 05 00131 g011
Figure 12. Error in the operator’s belief map for different sizes of the repulsion zones.
Drones 05 00131 g012
Figure 13. Median errors in the operator’s belief map with autonomous exploration (Experiment II, red line), human control of individual UAVs (Experiment IV: Task II, black line-point), and human–swarm teaming with our interface (Experiment IV: Task I, blue points).
Drones 05 00131 g013
Table 1. Table to show the frequency of display preferences among users for each contextual factor and respective Chi-square analysis results.
Contextual FactorIndividualHeat Map χ 2 p
Larger swarm size2179 33.64 0.001 *
Communication constrained4357 1.96 0.162
Displaying motion and coverage3169 14.44 0.001 *
Time critical2872 19.36 0.001 *
Time non-critical4357 1.96 0.162
Detecting errors7426 23.04 0.001 *
Transparency4456 1.44 0.23
Note. Bonferroni Corrected α = 0.0071. * = p < 0.0071.
Publisher’s Note: MDPI stays neutral with regard to jurisdictional claims in published maps and institutional affiliations.

