Article

UAV Patrolling for Wildfire Monitoring by a Dynamic Voronoi Tessellation on Satellite Data

by
Alessandro Giuseppi
*,†,
Roberto Germanà
,
Federico Fiorini
,
Francesco Delli Priscoli
and
Antonio Pietrabissa
Department of Computer, Control and Management Engineering, La Sapienza, University of Rome, Via Ariosto 25, 00187 Rome, Italy
*
Author to whom correspondence should be addressed.
Cybersecurity and Satellite Research Groups, CRAT, Via Nicotera 29, 00195 Rome, Italy.
Drones 2021, 5(4), 130; https://doi.org/10.3390/drones5040130
Submission received: 20 September 2021 / Revised: 26 October 2021 / Accepted: 2 November 2021 / Published: 3 November 2021

Abstract

:
Fire monitoring and early detection are critical tasks in which Unmanned Aerial Vehicles (UAVs) are commonly employed. This paper presents a system to plan the drone patrolling schedule according to a real-time estimation of a fire propagation index that is derived from satellite data, such as the Normalized Difference Vegetation Index (NDVI) measurement and the Digital Elevation Model (DEM) of the surveilled area. The proposed system employs a waypoint scheduling logic, derived from a dynamic Voronoi Tessellation of the area, that combines characteristics of the territory (e.g., vegetation density) with real-time measurements (e.g., wind speed and direction). The system is validated on a case study in Italy, in the municipality of the city of L’Aquila, on three different fire scenarios. In normal situations, the designed waypoint-based navigation system provided an effective monitoring of the area, enabling the early detection of starting fires. The developed solution also demonstrated good performance in tracking and anticipating the fire front advance, potentially providing a better situational awareness to emergency operators and support their response policies. Both the test environment and the simulator have been made open-source.

1. Introduction

Forest fires have always been a fundamental element in the global ecosystem balance [1], but, with the industrialization of society, global warming and the ever-increasing deforestation process, climate experts predict a significant increase in their frequency and intensity [2]. In fact, more than three billion animals deaths were estimated in the 2019–2020 Australian bushfires [3], with unprecedented environmental [4,5] and economic impacts [6].
Efficient systems for fire management are then one of the utmost priorities for any environmental protection policy. In fact, a fast response and an adequate and preemptive employment of fire response resources has immediate impacts on the preservation of both the territory and the economic fabric of the region.
This work presents the system developed in the scope of the project ARIES, funded by the European Space Agency (ESA), dedicated to drone surveillance of forests and wildfire monitoring. The proposed system exploits satellite data to build a digital twin of the monitored area, in the form of a dynamical model employed to predict the propagation of fire during emergencies. The fire propagation model will then be used to determine a real-time and adaptive waypoint scheduling for a fleet of drones with the purpose of offering to fire response operators a better situational awareness and more precise fire observations.
The remainder of the paper is structured as follows: Section 2 reports some related works; Section 3 details the overall logical architecture of the proposed system; Section 4 details the satellite data used in our system and the dynamical model employed to predict the fire propagation; Section 5 provides the needed background on the concept of Voronoi tessellation and then details how it has been applied on the fire risk distribution identified by the dynamical model to determine the optimal waypoint scheduling for the drone patrolling; Section 6 details the simulated environment and the case study in Italy; finally, Section 7 draws the conclusions and highlights some possible future works.

2. Related Works and Main Contributions

Drones are commonly used to provide operators with an aerial perspective of the interested area in various applicative scenarios. Regarding emergency management, drones proved to be useful to access and gather data from impervious zone, enhancing the situational awareness and response velocity to critical events, such as earthquakes, floods, and forest fires [7]. Regarding wildfire management, drone formations can be deployed both to respond to ongoing emergencies and to preventively patrol vulnerable areas for the early detection of fire break-outs.
Several works in literature propose integrated systems for fire management, e.g., reference [8,9,10,11]. In reference [9], Skorput, Mandzuka, and Vojvodic proposed a system architecture to guarantee constant communication between small Unmanned Aerial Vehicles (UAVs) and human operators on a test case in Croatia. The system proposed in reference [10] validated this time on an area in Spain and Portugal, determining the optimal patrolling schedule for UAVs based on satellite weather data and the Nesterov index [12], while the solution presented in reference [11] consists of a real-time algorithm to allow a fleet of UAV equipped with an infrared sensor track the fire perimeter of an ongoing emergency.
Several classes of drones have been studied for fire detection and monitoring purposes, such as high altitude/large coverage UAVs [13], quadrotors [14], and fixed wing or stratospheric UAVs for long-term flights [15], with some solutions even envisaging the deployment of fleets of heterogeneous drones [16,17,18] to better exploit their different capabilities. In fact, drone patrolling has always been connected to the problem of formation control, as different drones may be equipped with different sensors or devices to offer specific sensing functionalities. In the recent study [18], Afghah et al. proposed a framework to monitor wildfires in various environments using a flock composed by different types of drones, and, in order to guarantee the full coverage of the interested area, they developed a decentralized leader-follower structure.
The aerial operations of UAVs can be enhanced by combining their observations with data gathered on the ground by a heterogeneous network of sensors. In this direction, a solution for real-time wildfire prediction and forecasting based on the IoT/Fog computing paradigm was proposed [19]. Mao et al. proposed, in reference [20], an optimization framework to determine the optimal drone positioning strategy to support the ground IoT segment with the advanced connectivity and the low-latency computing capabilities offered by UAVs.
A different approach was followed by Simoes et al. in reference [21], where drone formations are used to provide support to firefighters during operations, providing them with information regarding the fire perimeter and guidance. In the work, drones are able to autonomously position to provide the information required by firefighters, who can interact with them through a ground station.
The prediction of the wildfire propagation is a crucial functionality needed to enable any kind of proactive measure. For this reason, several models [22,23,24,25] have been proposed in the literature. By combining the model predictions with a real-time feedback gathered by distributed sensors and UAVs, it is possible to attain precise short-term forecasts on the fire evolution, further increasing the importance of an effective strategy for drone patrolling.
Compared to the existing literature, the main contributions of this work are:
  • the design of an integrated system for drone surveillance/patrolling against wildfires, employing a dynamical system that is built starting from satellite-sensed data;
  • the formulation of an adaptive Voronoi tessellation-based solution for the identification of the optimal waypoints for the drone patrolling, determined on a fire propagation risk index;
  • the validation of the proposed scheme on a case study in Italy on a simulated environment; and
  • the presentation of the open-sourced simulator used for the validation of the proposed system [26].

3. System Architecture

The architecture of the main functional blocks of the proposed system is reported in Figure 1. The system is composed by three main functionalities, namely the Cellular Automata, the Voronoi Tessellation subsystem, and the Patrolling Controller, that determine a flight schedule for a fleet of drones, equipped with monitoring sensors, starting from the analysis of satellite and terrestrial data.
The core element of the architecture is the Cellular Automata (described in Section 4.2), which is the dynamical model that will be used as a digital twin of the monitored area to produce fire spreading predictions.
The Cellular Automata is fed with offline data available from satellite sources, as described in Section 4.1, and real-time data from ground sensors. The offline data is employed to determine the characteristics of the model dynamics, whereas the real-time fire detection is used as a feedback to determine the initial conditions for the fire propagation predictions. Note that the real-time measurement on the wind speed and direction is employed by the Cellular Automata as an exogenous input/disturbance to determine the fire evolution. The two outputs of the Cellular Automata are: (i) a fire risk distribution, denoted by p b u r n in the figure, that describes the likelihood of fire spreading in the monitored area, and (ii) a short-term prediction of the fire propagation.
On the basis of the fire risk distribution, the system determines a Voronoi Tessellation (described in Section 5.2) of the area, whose centroids will be used as waypoints by the drone fleet.
Based on the fire prediction, the Patrolling Controller (described in Section 5.3) determines the optimal flight planning for the fleet, in terms of waypoints visiting order, so that areas more subject to fire risk—or even areas in which the fire front is moving into—are monitored first and/or more frequently.

4. Fire Propagation Modeling

In this section, we present the fire propagation modeling employed, analyzing in particular how different sources of data have been used to obtain a realistic simulated environment. In particular, Section 4.1 starts with an analysis of the used satellite images; Section 4.2 describes of the implemented fire dynamics.

4.1. Satellite Data

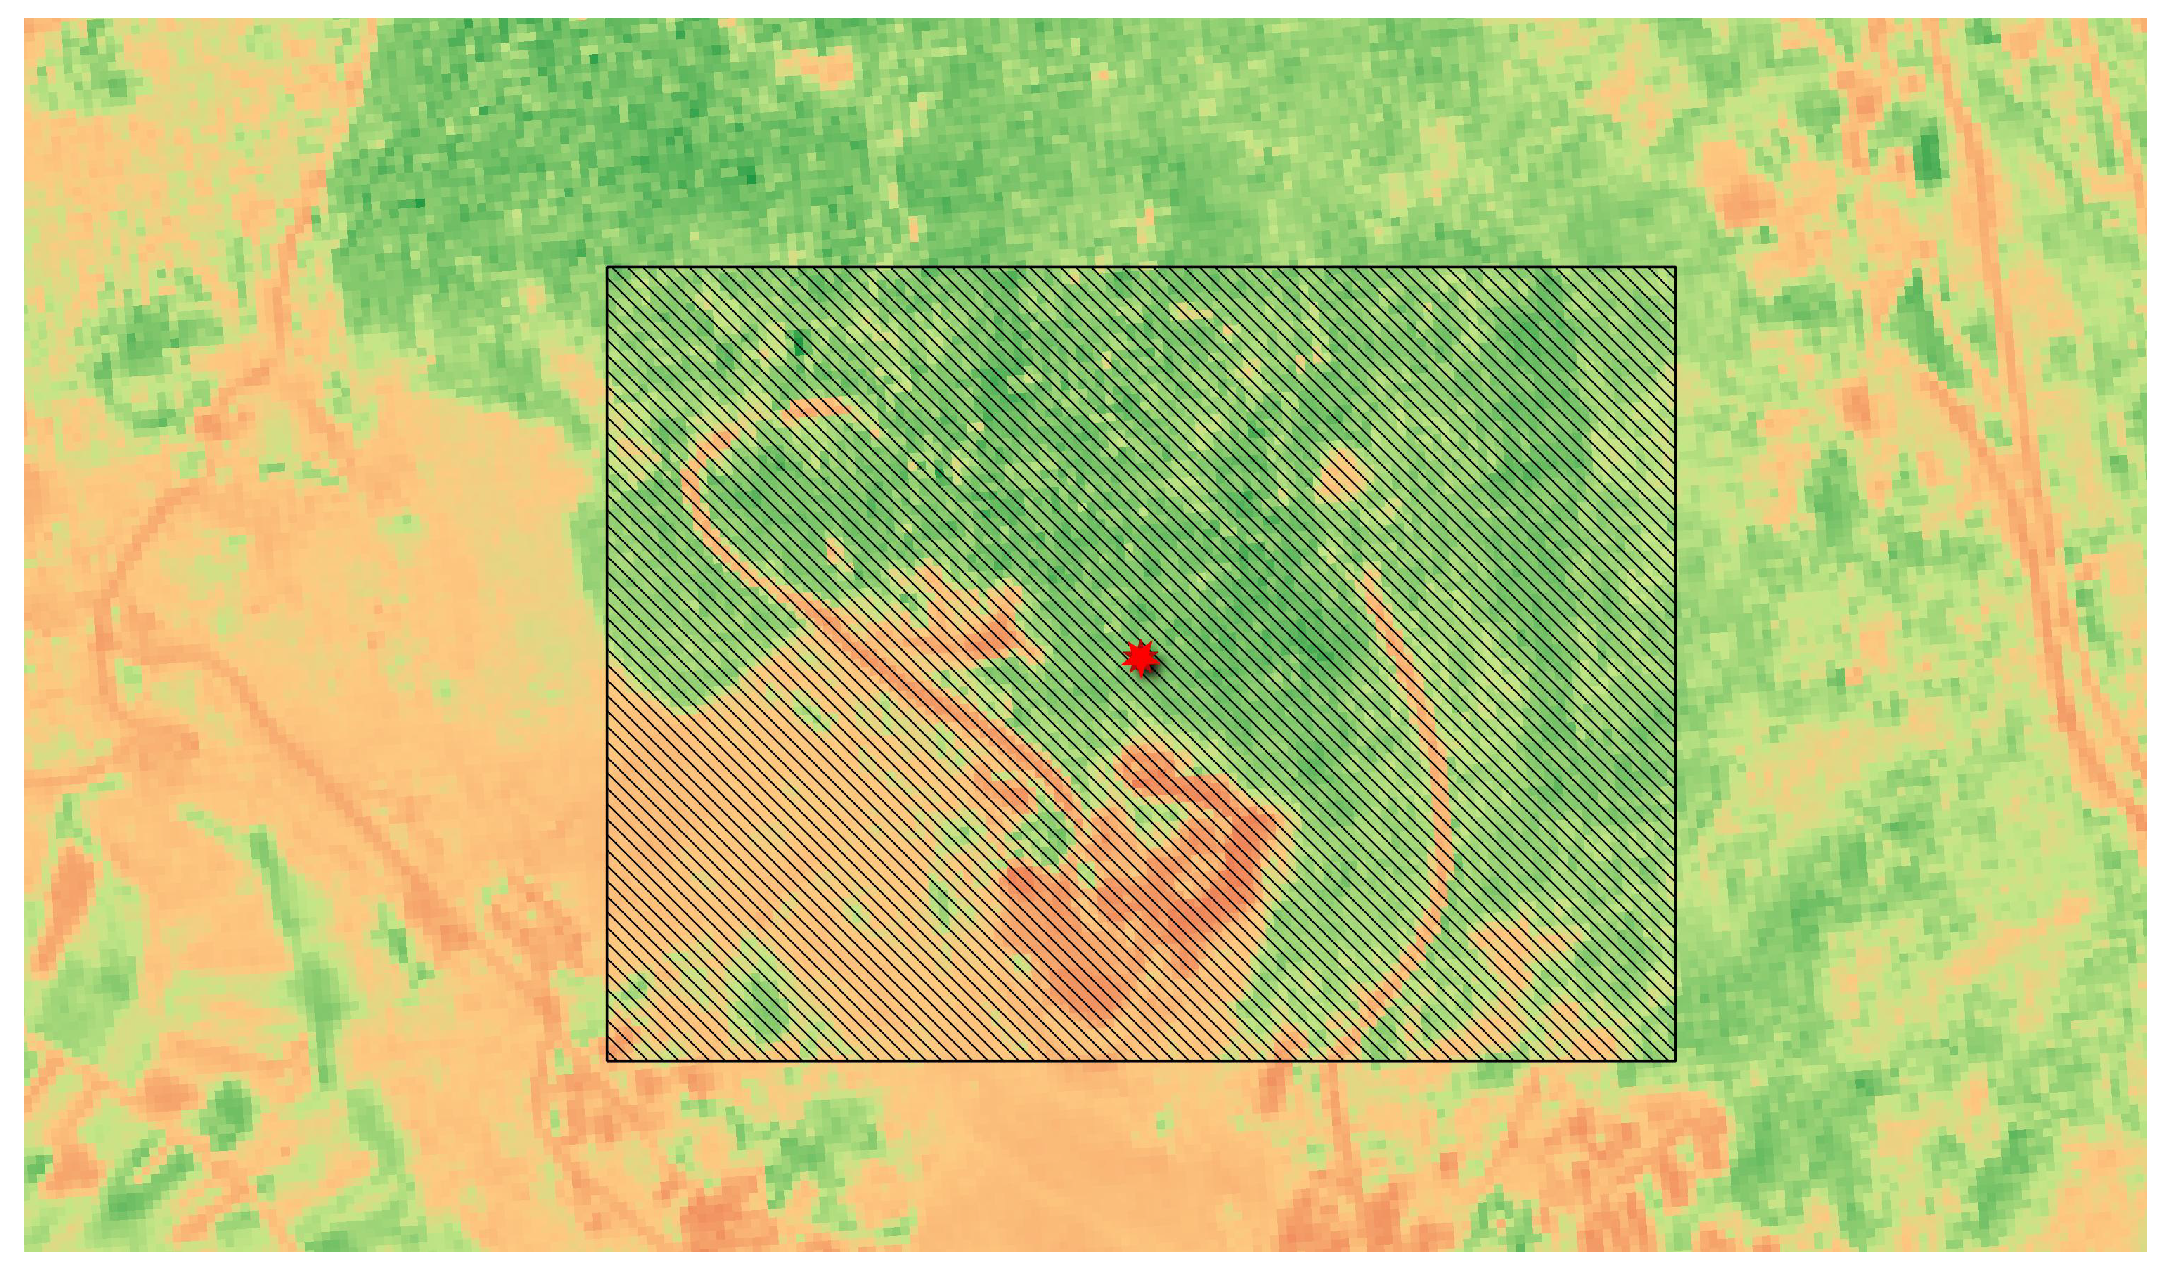
The environmental dynamical model that our system employs to estimate the short-term fire propagation is fed with relevant satellite imaging data. In particular, we will utilize information regarding the vegetation structure, its health status, and stress level, combined with information regarding ground elevation/structure and weather data. Figure 2 reports a satellite image of the test area that will be used in the rest of the paper.
The most widely used index to assess such vegetation aspects is the Normalized Difference Vegetation Index (NDVI) [27], as it allows a fairly immediate evaluation of the plant vigor, hydration, and health. Remote measurements, such as the NDVI, are of fundamental importance in industries, such as precision agriculture [28,29], forestry [30,31], and crop [32] monitoring, where a feedback-based and predictive evaluation of which actions or corrective measures are the most effective allows for significantly better performances.
For a given area, the NDVI is defined as the ratio between the difference and the sum of the radiations reflected in the near infrared and in the red wavebands:
NDVI = NIR RED NIR + RED ,
where NIR and RED are the spectral reflectances measured in the near infrared and in the visible (red) wavebands, corresponding, respectively, to a central wavelengths of acquisition of 832.8 nm and 664.6 nm [33].
Several different satellite data sources are available to compute the NDVI, such as the Landsat 8 and Landsat 7 satellites. In this study, we employ data from the more recent Sentinel-2 constellation, due to its greater resolution ( 10 × 10 meters per pixel compared to the 30 × 30 meters per pixel archived by Landsat 8) and faster revisit time (5 days instead of the 16 days required by Landsat satellites [34]). In general, the NDVI index can assume values in the set [ 1 , 1 ] and allows for creation of a pixel-wise heat map of the vegetation status in the monitored area.
For our tests, the satellite data was obtained from the public source for Sentinel 2 data [35]. This data was then elaborated in the QGIS software [36], obtaining the NDVI image that is reported in Figure 3, for the area shown in Figure 2 (Pineta di Roio, in the Italian region of Abruzzo).
Other than the NDVI, our system will conduct its analysis also on a Digital Elevation Model (DEM) of the area, that we retrieved from reference [37], with the same resolution of the NDVI data.

4.2. Fire Dynamics

An accurate simulation of fire dynamics enables pro-active patrolling, monitoring, and intervention. Once a fire start is detected, the system will be able to predict its spread and better manage the available fire-response resources.
The dynamic model we consider for the proposed system is derived from the discrete Cellular Automata (CA) system originally proposed in reference [38]. CAs are a very popular tool used for the modeling of terrestrial areas, as they offer an efficient yet flexible solution to capture events, such as wildfires. The first usages of CA related to wildfires date back to the 1990s [39,40], with newer and more refined models commonly employed in recent years [38,41].
The CA model is constituted of the combination of a finite number of identical elements, referred to as cells, each one having an individual shape and state. The state of every cell was modeled so that it can assume values in a discrete set of integers, and their discrete dynamics is dictated by a local transition law that depends on the cell state and on the states of its neighboring cells. The concept of cell neighborhood is a fundamental element of a CA, as it can be derived from an arbitrary definition of distance among two cells, and, for this reason, it is one of the elements that impact the entire modeling process.
The dependency obtained with this interdependence is what constitutes the overall dynamical system that will be used to capture the fire propagation over time.
We mention that, typically, CA systems assume cells to have a regular shape (e.g., square or hexagonal) obtained from an a priori partition that leads to a so-called regular CA system. However, in principle, generalized CA does not assume any regular or common shape among the various cells, which consequently may have different numbers of neighbors.
In order to formally define a CA model, we need to define its following characteristics: cell state, cell neighborhood, and the local transition function.

4.2.1. Cell State

As mentioned, each cell can assume a finite number of states that can be encoded with an integer index. In our model, we let the state of the system cells assume values in the set { 1 , 2 , 3 , 4 } , corresponding to the states:
  • 1: not burnable cell,
  • 2: burnable cell,
  • 3: burning cell, and
  • 4: burned cell.
The monitored area is divided as a grid formed by 10 m × 10 m cells, in line with the satellite data resolution. The initial state assignment is then conducted on the basis of the NDVI data, identifying the appropriate state value for each cell in the grid. In detail, a state equal to 1 is associated with cells whose area has an NDVI value of less than an user-defined threshold, that can be defined depending on the geographic area characteristics and vegetation type, and the value 2 is given to the other cells. In our test area, we observed that a threshold of 0.52 almost perfectly recognized as non-burnable cells the ones with roads or buildings. Note that, in the initial state definition, we assumed that no cells were burning or were recently burned, but, in principle, the model allows the presence of such cells in its initial conditions, and their identification may be carried out by exploiting data from terrestrial measurements.
We can associate with each burnable cell (i.e., cell whose state is equal to 2) the following (static) properties:
  • an index that captures how likely the area is to catch fire due to the type of vegetation present in the cell, denoted by p v e g ( i ) ;
  • an index that captures the impact of the vegetation density on the burn likelihood, denoted by p d e n ( i ) ; and
  • the (average) cell altitude from the DEM, which we obtained from reference [37].
In principle, the values of p v e g ( i ) and p d e n ( i ) can be derived from several data sources, with the satellite ones being among the most effective (e.g., other than NDVI one could use the Normalized Difference Water Index (NDWI), the Enhanced vegetation index (EVI), the Land Surface Temperature (LST) [42], or even an arbitrary combination of multiple factors), or empirically from the analysis of past wildfires, as done in reference [38]. Without loss of generality, in our study, we utilize the same values for p v e g ( i ) proposed in reference [38], employing the NDVI in place of an identification of the vegetation type (recalling that higher values of NDVI are associated with lower probabilities of catching fires) and assuming a constant vegetation density. More refined criteria (e.g., reference [43]) can be seamlessly integrated for both factors in the presented formulation and in the open-source simulator.
The two additional properties, p v e g ( i ) and p d e n ( i ) , that have been associated with the various cells will play a fundamental role in estimating the short-term fire propagation. Their role will be clarified when describing the transition function that governs the system dynamics.

4.2.2. Cell Neighborhood

As mentioned, the neighborhood definition is one of the most important definitions of the entire CA system. In our case, where the natural choice for the distance metric is the Euclidean distance between the cells, two possible neighborhood definitions can be considered: the von Neumann and the Moore neighborhoods. According to the first definition, each cell is assigned four neighbors that correspond to the elements adjacent to the cell sides. In the Moore neighborhood definition, each cell is considered to have eight neighbors, therefore also considering the elements that are connected diagonally to one of the vertices of the cell. The two approaches are depicted in Figure 4. In our study, we considered Moore’s definition, as fire can spread in any direction, and we denote with N i the set of neighbors of the cell i.

4.2.3. Local Transition Function

The local transition function is the core of a CA system because it relates each cell state with the states of its neighbors, hence interconnecting the atomic elements of the overall system. In principle, it is possible to define either a deterministic or a probabilistic transition function. Due to the stochastic nature of fire evolution, our model implements a discrete-time function of the latter class.
In line with reference [38], we assume the fire propagation to occur between two neighboring burnable cells i , j with a given probability p b u r n ( i , j ) . Furthermore, the state of non-burnable cells remains fixed to 1, while burning cells become burned after 1 time step has passed, and it remains so thereafter. Taking a generic cell i, and letting c e l l i ( τ ) be its state a time time τ , N i be its set of neighboring cells, and T be the sampling time, we can write the aforementioned conditions as:
c e l l i ( τ ) = 1 c e l l i ( τ + T ) = 1 ,
i.e., a not-burnable cell remains so for all following time steps;
c e l l i ( τ ) = 4 c e l l i ( τ + T ) = 4 ,
i.e., a burned cell remains so for all following time steps;
c e l l i ( τ ) = 3 c e l l i ( τ + T ) = 4 ,
i.e., a burning cell becomes burned at the following time step;
c e l l i ( τ ) = 3 c e l l j ( τ + T ) = 3
with probability p b u r n ( i , j ) j N i ,
i.e., fire spreads from the cell i towards any neighboring cell j with a probability p b u r n ( i , j ) that depends on the characteristics of both cells.
The crucial aspect that impacts the most the fire behavior prediction is the identification of an adequate p b u r n ( i , j ) parameter. In order to define a proper value for such critical parameter, one should include relevant environmental factors, such as wind and terrain, but also factors strictly related to the vegetation, such as the NDVI. Following the same structure of reference [38], we can write:
p b u r n ( i , j ) = p h ( j ) ( 1 + p v e g ( j ) ) ( 1 + p d e n ( j ) ) p w ( i , j ) p s ( i , j ) ,
where the probability-like scaling values p v e g ( j ) , p d e n ( j ) , p w ( i , j ) and p s ( i , j ) capture the probability of fire propagation occurring depending, respectively, on the vegetation type/ health, its density, the wind speed, and the terrain slope. The factor p h ( j ) is a constant value that represents the probability that a burnable cell starts to burn if some of its neighborhoods is burning, neglecting the influence of the other environmental factors. Before detailing each parameter, we mention that, for our testing, we assumed their empirical components to have the same values that were identified in reference [38]. Additionally, we can define the overall fire risk level associated with each cell as
p b u r n ( j ) = i N j p b u r n ( i , j ) ,
which captures the risk of fire propagating to cell j from any of its neighbors.
Several methods exist to estimate the vegetation density (e.g., starting from NDVI/ satellite data or from low altitude imaging [44]). Starting from this estimation, appropriate values can be given to the p d e n ( j ) parameter for the various cells, depending also on the type of vegetation that is found in the specific cell.
To include the effects of ground elevation into our model, we have to determine p s ( i , j ) . To do so, we follow the approach originally proposed in reference [45], conducting a terrain analysis based on DEM data retrieved from reference [37]. In both reference [38,45], p s ( i , j ) is assumed to have an exponential behavior of the form:
p s ( i , j ) = e a Θ ( i , j ) ,
where a is a tuning parameter that can be empirically determined, and Θ ( i , j ) is the slope between the cells i and j.
An similar form is assumed by p w :
p w ( i , j ) = e α 1 V + α 2 V c o s ( θ ( i , j ) 1 ) ,
where α 1 and α 2 are constant empirical values, θ is the angle between the fire spread direction (i.e., the vector that connects the two cells i and j) and the wind, and V represents the wind velocity. Note that p w ( i , j ) is a dynamical variable, as the wind direction and speed vary over time, making p b u r n ( j ) a time-dependent quantity.
As shown by the simulations in Section 6, by using the parameters computed in (6)–(9) in the time-difference relations (2)–(5), the proposed system is able to reasonably predict the short-term fire propagation in order to dynamically adapt the drone patrolling schedule to better monitor the wildfire.

5. Voronoi Tessellation Based Dynamic Drone Patrolling

To properly manage the drone patrolling schedule, we need to define some control points, or waypoints, inside the monitored area. Since the waypoints will be visited in a certain order by the drones during their monitoring, their position should be optimized to offer maximum coverage of the most important areas. To accomplish our objective, we propose to build a Voronoi partition [46] of the monitored area starting from its NDVI measurements and burn probability index- p b u r n ( i ) -analysis. With adequate design choices that will be detailed in the following, the centroids of our tessellation will be the points that offer a better coverage of the areas (cells) more likely to catch fire, making them the ideal positions to station the drone fleet. The following section reports some background on the concept of Voronoi tessellations, whereas Section 5.2 details the solution designed for the fire management system.

5.1. Background on Voronoi Tessellation

The Voronoi tessellation is, in general, a partition of a given area, that divides the plane in distinct regions whose boundaries are based on a relation that typically captures a distance measure of some form. The most common Voronoi diagram is the Centroidal Voronoi Tessellation (CVT) [46], in which each region is determined starting from a set of given points known as centroids.
Assuming to have a set of n 2 points C = { c 1 , c 2 c n } in a two-dimensional space S and a distance function of interest between two points (e.g., Euclidean and Manhattan distances are commonly used also in their weighted forms, but custom distances can also be defined), denoted by d ( s , k ) , with s , k S , it is possible to obtain a Voronoi tessellation of the considered space following the steps:
  • compute the distance d ( s , c i ) with respect to all centroids c i C , s S \ C ;
  • assign each point s to the centroid c i C from which it has the shortest distance, s S \ C ; and
  • the points s C which are equidistant from two or more centroids are the edge points of the regions; for practical purposes, these points can be assigned arbitrarily to any of such centroids.
The resulting division of the plane is a tessellation of the form T = { C ( c 1 ) , C ( c 2 ) C ( c n ) } , where C ( c i ) is a region that encloses all points s for which the point c i is the closest centroid.
The regions C ( c i ) can then be characterized as:
C ( c i ) = { s : d ( s , c i ) d ( s , c j ) , c j C \ { c i } } .

5.2. Voronoi Tessellation for Forest Fires Monitoring

In the discussion reported so far, it was assumed that the set of centroids C was predetermined and given as an input to the system to obtain the Voronoi tessellation. The rationale behind the choice of the centroids is, hence, a crucial aspect to obtain an adequate partition of the monitored area. For our purposes, we identified the following system requirements:
  • the maximum distance between two centroids must be limited (e.g., by the range of observation of the drones), so that no area remain uncovered during the waypoint-based patrolling, independently from the path taken by the drone fleet when moving from one waypoint to the following one; and
  • the centroids shall be positioned so that they offer a good coverage of the most critical areas (e.g., their position shall be closer to areas associated with an higher fire risk probability) in order to assure faster early fire detection and better monitoring of the vegetation.
In order to satisfy the first requirement, a possible solution is to divide the monitored area into a grid of squares, or rectangles, of the same size (hereinafter referred to as macro-cells) and then impose that each macro-cell contains exactly one centroid. With this preliminary partition, the distance between two centroids is at most equal to two times the diagonal of the macro-cells. In this way, the distance can be arbitrarily set by adjusting the dimensions of the macro-cells.
Regarding the second requirement, a simple solution to set the centroid location within the macro-cells would be to pick the center of mass of the fire risk probability p b u r n ( i ) (i.e., the mean point of the fire risk distribution), evaluated over the cells that fall within the macro-cell area. In practice, one may desire to monitor even more closely the areas subject to a higher fire risk, and, to do so, the center of mass could be computed with respect to other quantities that give to such areas more relative focus (e.g., p b u r n ( i ) 2 ).
In our test system, we decided to compute the center of mass with respect to the following quantity:
p b u r n * ( i ) = 1 if p b u r n ( i ) P b u r n m i n 0 otherwise ,
where P b u r n m i n is an arbitrary threshold value that let the computation of the center of mass be performed considering only the cells with an arbitrarily high risk of catching fire.
We mention that refined approaches, involving a constrained optimization problem, can also be implemented to determine the number and the positioning of the centroids, at the expense of a more demanding and less scalable system. The proposed solution, despite being sub-optimal, can be seamlessly applied on arbitrarily large areas with limited solving times that are in line with an emergency management system.
Given the centroids, it is now possible to compute the Voronoi tessellation by following the procedure reported in Section 5.1 and considering the Euclidean distance, possibly weighting each cell by its associated p b u r n ( i ) value. To conclude, we associate each macro-cell m with its average fire propagation risk
p ¯ b u r n ( m ) = i m p b u r n ( i ) | m | ,
where | m | represents the number of cells i m .
Algorithm 1 summarizes the presented procedure, while Figure 5 depicts the NDVI values of the monitored area, paired with its p b u r n * distribution and the corresponding Voronoi partition.
Algorithm 1 Voronoi tessellation of the monitored area to identify drone patrolling waypoints.
1: Divide the monitored area into M macro-cells
2: for all macro-cells m do
3:  for all cell im do
4:    Evaluate p b u r n * ( i ) based on the given threshold P b u r n m i n
5:  end for
6:  Compute the center of mass cm of the macro-cell m with respect to p b u r n * ( i ) and add
  it to the centroid set C
7:  Associate to the macro-cell m its average burn probability p ¯ b u r n ( m )
8: end for
9: Determine the Voronoi tessellation of the given area determined by the centroids in C
 and the selected distance metric (e.g., weighted Euclidean distance)
Note that the proposed algorithm is not strictly related to the p b u r n ( i ) factors, and, in principle, it may consider other quantities for the determination of the centroid position, such as p v e g (i.e., the fire risk related to the cell vegetation type), or metrics that also consider information regarding the terrain altitude derived from the DEM.
We remark that being that p b u r n ( i ) is a time-varying quantity, as it is influenced both by offline data (NDVI, vegetation structure, …) and real-time measurements (wind speed and direction, on-going fire events, …) as depicted in Figure 1, the proposed Voronoi Partition can be periodically updated to better reflect changes in the p b u r n ( i ) distribution, for example, on a hourly basis during normal conditions or more frequently (every few minutes) during fire events with high wind variability. Note that, if the drones are equipped with NDVI cameras, one may update the satellite NDVI data with a more recent feedback on the vegetation health, obtaining a more precise Voronoi tessellation.
Figure 6 depicts how the centroids move (black lines) depending on the wind direction, that moves from 0 ° to 180 ° , paired with the initial and final Voronoi tessellations.

5.3. Dynamic Drone Patrolling

After the determination of the Voronoi tessellation, our system has identified the waypoint points (i.e., the centroids) on which the drone fleet should hover during its patrolling and the areas that it should monitor for each of the waypoints (i.e., the corresponding Voronoi region).
What is left is the definition of a logic to adapt the patrolling schedule (i.e., the waypoint visit order) in response to fire events or changes in the fire risk of certain areas (e.g., due to a change in the wind direction).
The role of the controller that governs the drone patrolling is then to:
  • periodically update the p b u r n ( i ) values of all the various cells, in order to adapt the Voronoi tessellation depending on factors, such as the wind or new NDVI measurements (coming either from satellite or UAV sources);
  • collect data from the drones and the ground sensors to monitor instant-by-instant the fire events inside the Voronoi regions and provide the overall system with adequate situational awareness; and
  • to guide the UAV fleet towards strategical monitoring points (i.e., the Voronoi centroids), depending on the ongoing situation.
During normal conditions, the patrolling controller may arbitrarily schedule the order of visit of the waypoints so that, periodically, all Voronoi regions are monitored. A reasonable prioritization order may be defined according to the average fire risk level of the region (i.e., p ¯ b u r n ( i ) ), so that areas with a higher risk are visited more frequently. Another solution could be to implement the visiting order corresponding to the shortest flying path, so that the monitoring is concluded in the minimum time possible.
In emergency situations, i.e., during a wildfire event, the system shall evaluate a short-term fire propagation prediction, relying on the fire dynamics model, starting from a first assessment of the burning cells (obtained, e.g., from ground sensors and human observations, possibly enhanced by the drones monitoring). By analyzing this prediction, the system is then able to sort the Voronoi regions according to, for example, the quantity (or percentage) of their cells that will be burning in the next few minutes. The controller then commands the drone fleet to cycle thought the waypoints whose regions are burning more than a user-defined threshold (e.g., considering under emergency only the regions in which more than 10 cells are currently burning). To better track the fire front and current spreading direction, the controller may also consider the temporal order in which the various regions exceed the given threshold, commanding the drones towards the centroids that will be interested first.
Note that, thanks to the definition of the Voronoi partition on the basis of p b u r n ( i ) , the centroids are in the mean positions of their region regarding the fire spread likelihood, meaning that (on average) the drones stationed over them will have the opportunity to observe for a prolonged period of time the front of the wildfire.
The control of the drone fleet is delegated to the flight controller, that employs a formation control logic. In our testing and simulator, we implemented a control law based on reference [47], so that the drones may form and maintain a triangle formation. Both simpler and more advanced control logics may be employed depending on the drones used (e.g., quad-copters, high/low altitude Remotely Piloted Aerial Systems, fixed wing and/or single rotor helicopters), and, for this reason, our simulator offers the possibility of seamlessly change both the flight dynamics and their related controllers.
Given the fact that the formation must fly over a non-flat environment, the formation control is enhanced with DEM information regarding the terrain altitude in order to avoid drone-ground collisions and allow the entire fleet to fly at the same height.

6. Case Study and Simulations

6.1. Case Study in Italy, City of L’aquila

All the above mentioned system parts are tested and simulated on a case study in Italy (see Figure 7), namely the “Pineta di Roio” (Monteluco). The selected area is a case study for the ESA Aries project [48,49] , that aims at providing preventive tool for wildfire management to the municipality of the city of L’Aquila. The area is situated in the region of Abruzzo, and its protection is considered to be critical due to its adjacency to the city of L’Aquila. The specific area selected, as highlighted in Figure 2, presents several types of vegetation (pines, ferns, and meadows) paired with human structures and roads, offering the possibility of testing the system on a highly heterogeneous territory.

6.2. Simulation Setup

In order to build the CA, we start with the geo-localization of the area of interest on the QGIS 3.16 software [36], that allows the extraction of the geographical data that is then processed on MATLAB to create a CA discrete-time dynamical system able to simulate the fire propagation.
In the second phase, after the import of the DEM provided by reference [37], whose ground resolution is exactly equal to the Sentinel-2 images ground resolution (i.e., 10 m) [35] from which we collect the NDVI data, the area of interest S is divided into a regular grid of 10 m × 10 m square cells, as described in Section 6. Each cell is then assigned its NDVI and DEM data (that are all the off-line factors needed to compute p b u r n ( i ) ).
The wind direction is then set in the simulation environment (as if it was measured by the real system), and p b u r n ( i ) and p b u r n ( i ) * are evaluated.
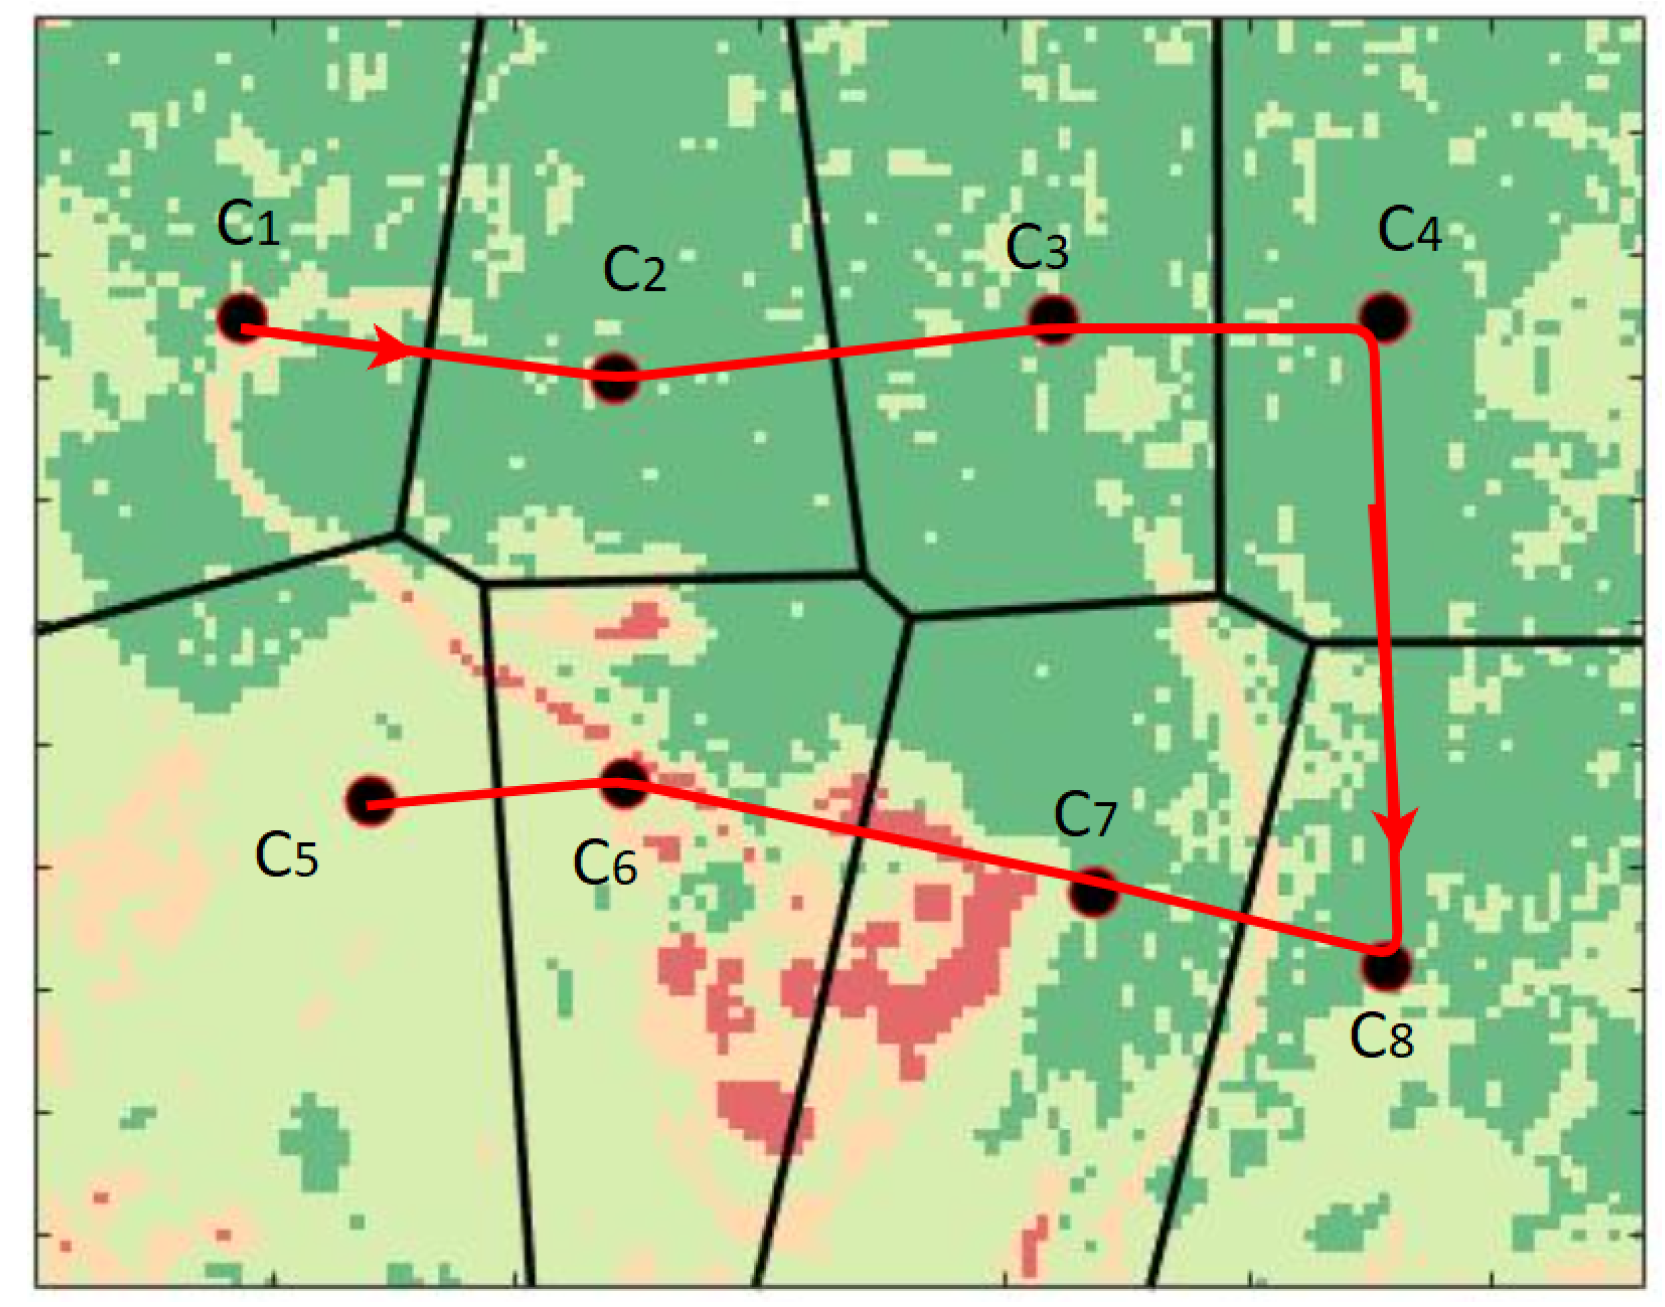
The entire area is then divided into eight regular macro-cells for the identification of the centroid locations, as described in Section 5.2, and Algorithm 1 is employed to obtain the Voronoi tessellation.
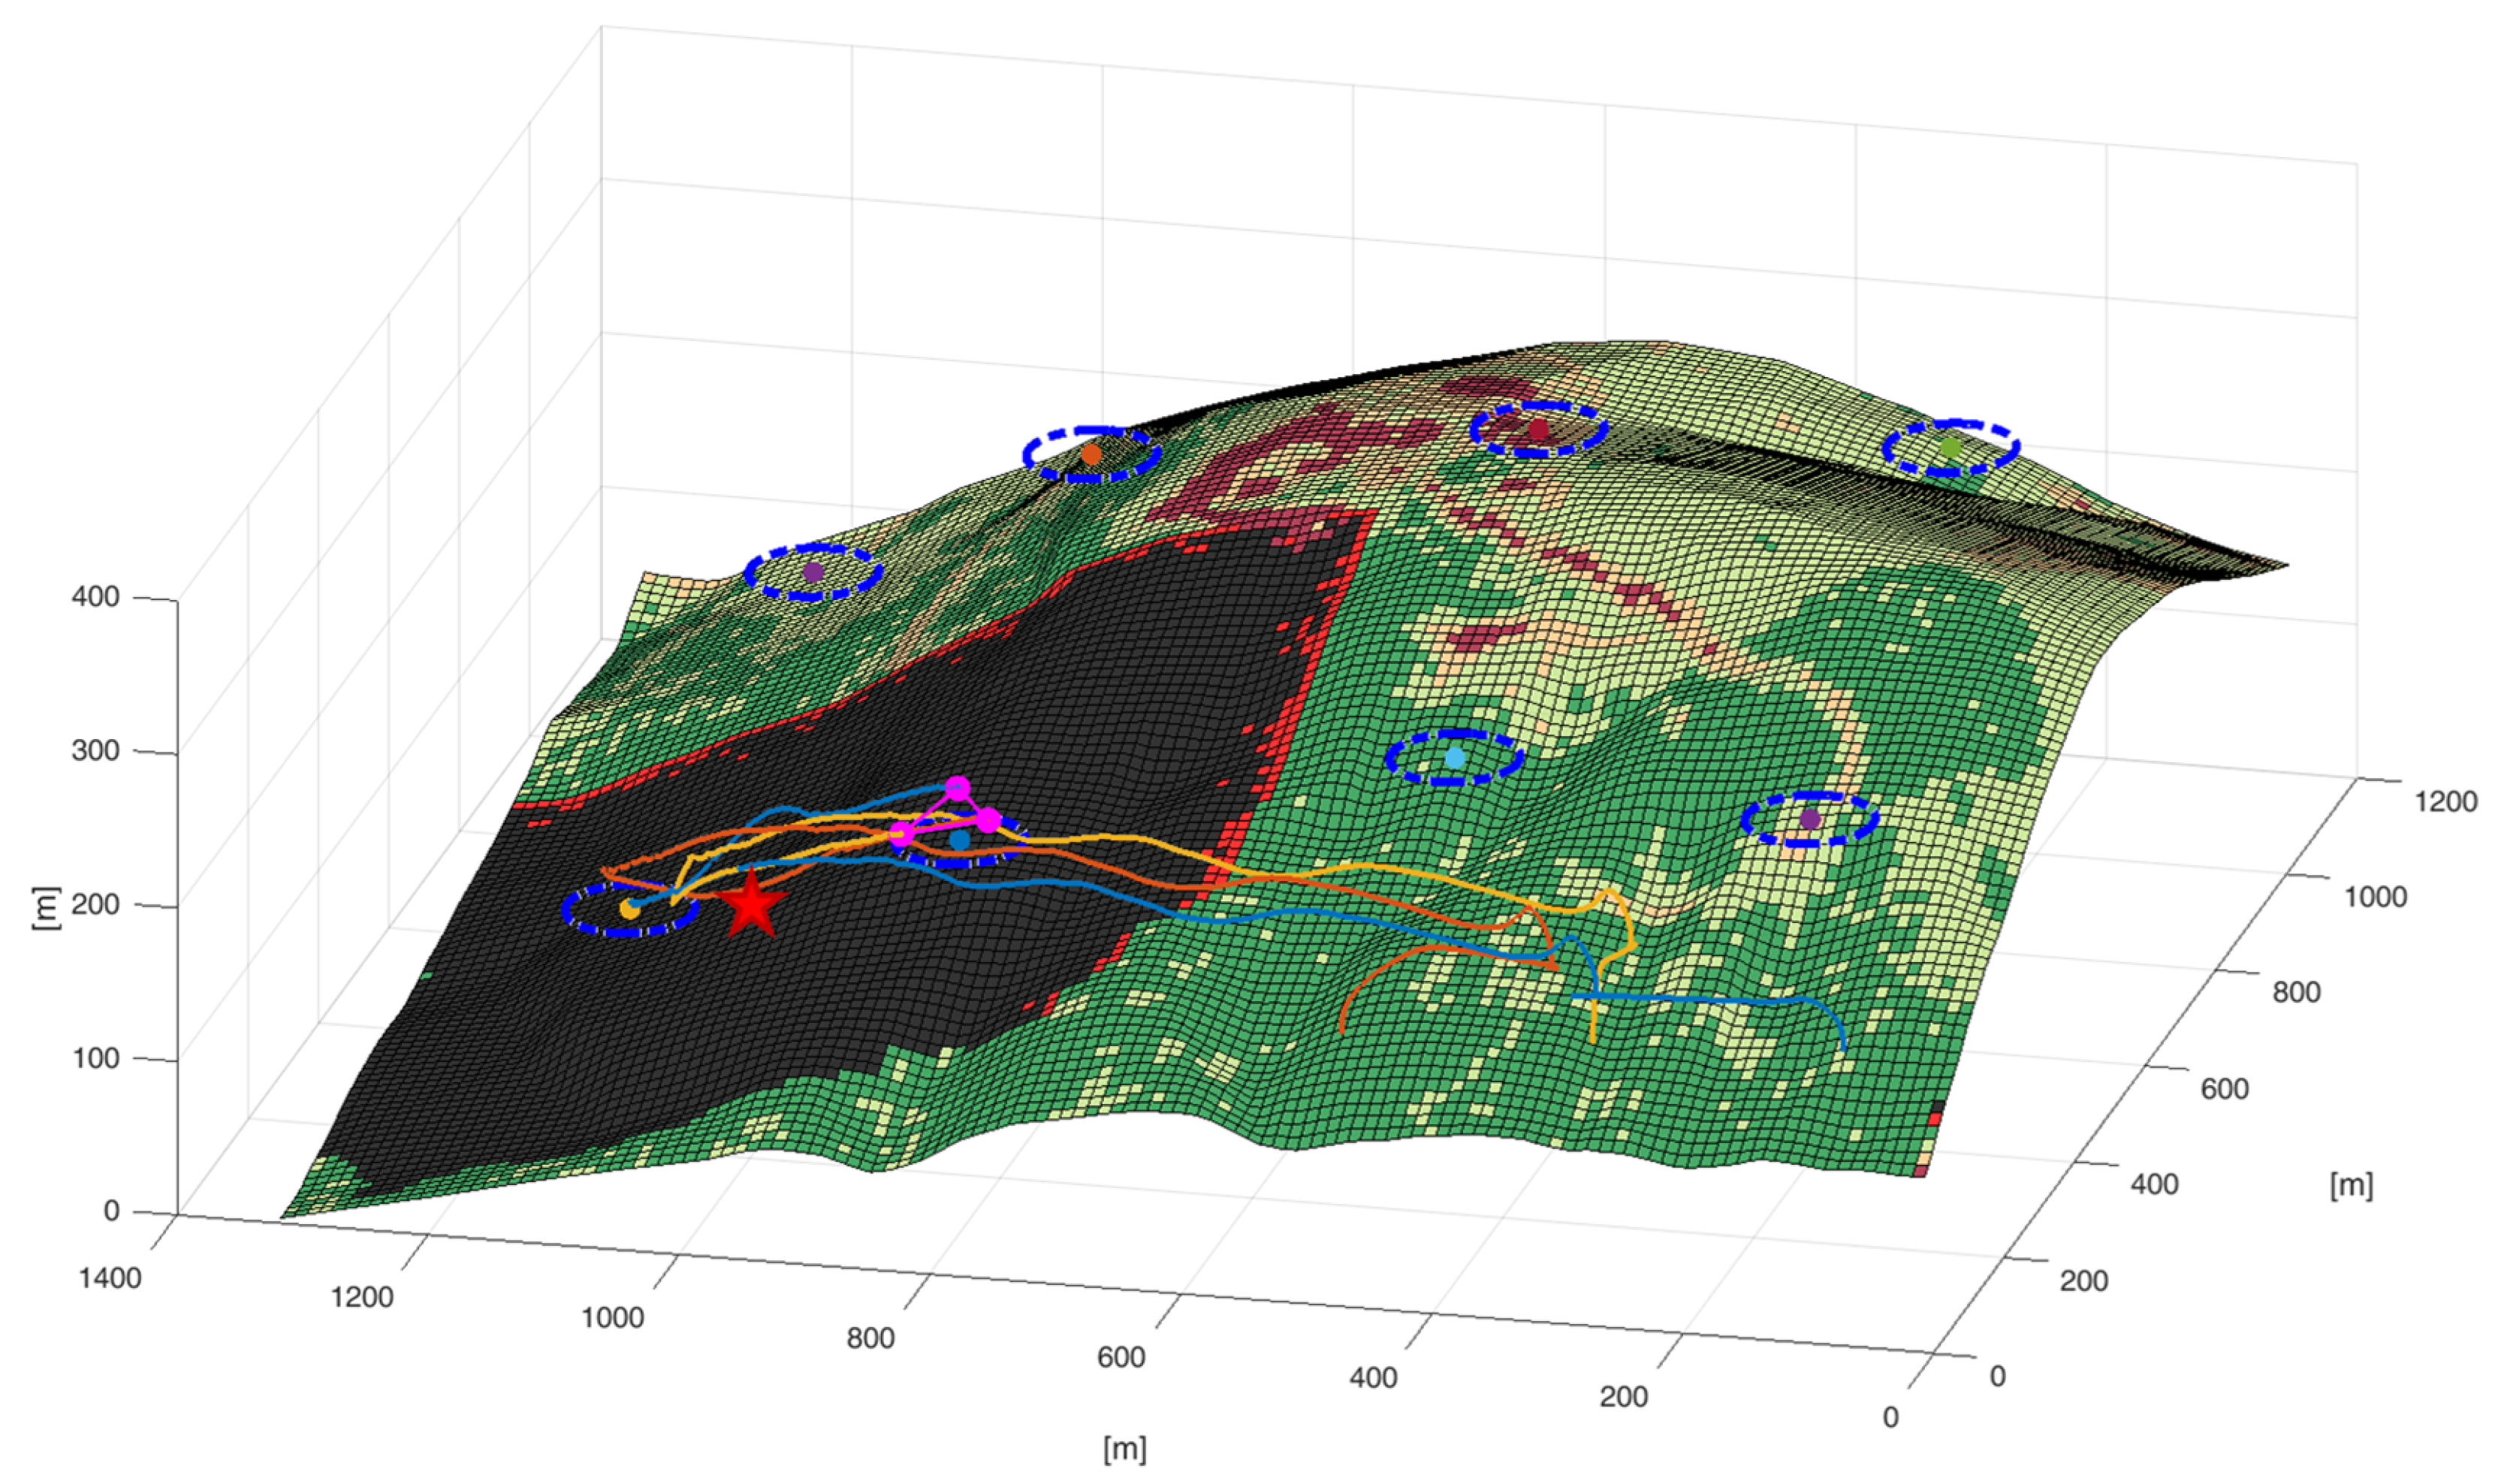
In our testings, we simulate a fleet composed by N = 3 quadcopters with their proper dynamics. The three drones were programmed to assume a V-shape formation when navigating from one waypoint to another, while also avoiding internal and ground collisions and flying at a constant altitude of 50 m from the ground. We mention that our simulator, that was open-sourced in reference [26], also offers the possibility of integrating drones with different flight dynamics (e.g., airship-like UAVs).

6.3. First Simulation: Normal Conditions-Drone Patrolling for Area Monitoring

This first simulation reports the functioning of the proposed system when no fire events are detected and the drones are employed only to monitor the area. In this situation, since there are no ongoing emergencies, the order in which the centroids are visited may be selected on a simple shortest path logic to preserve drone batteries and minimize travel times. Figure 8 reports an example of a possible trajectory for this setup. Thanks to the assured maximum distance between the centroids, at the end of the patrolling round, the entire area has been monitored, ensuring an adequate situational awareness to fire brigades.

6.4. Second Simulation: Single Ignition Point

In this test, the ignition point was inside the fourth Voronoi region of the first row in Figure 5 ( C ( c 4 ) ) (the exact location is reported in Figure 9 and Figure 10 with a red star), and, during the iterations, the fire spreads according to the the CA dynamics and the defined transition rules, with a sampling time T = 200 s. The same CA was used as the predictive model of our system to obtain a 15 min ahead prediction of the fire propagation.
For our testing, we considered a Voronoi region to be in critical state when more than 45 % of its cells are either burning or are burned down. The patrolling controller then set as the target waypoint for the drone fleet the latest region that became critical. If no region is critical, we let our drone hover independently and randomly over the area.
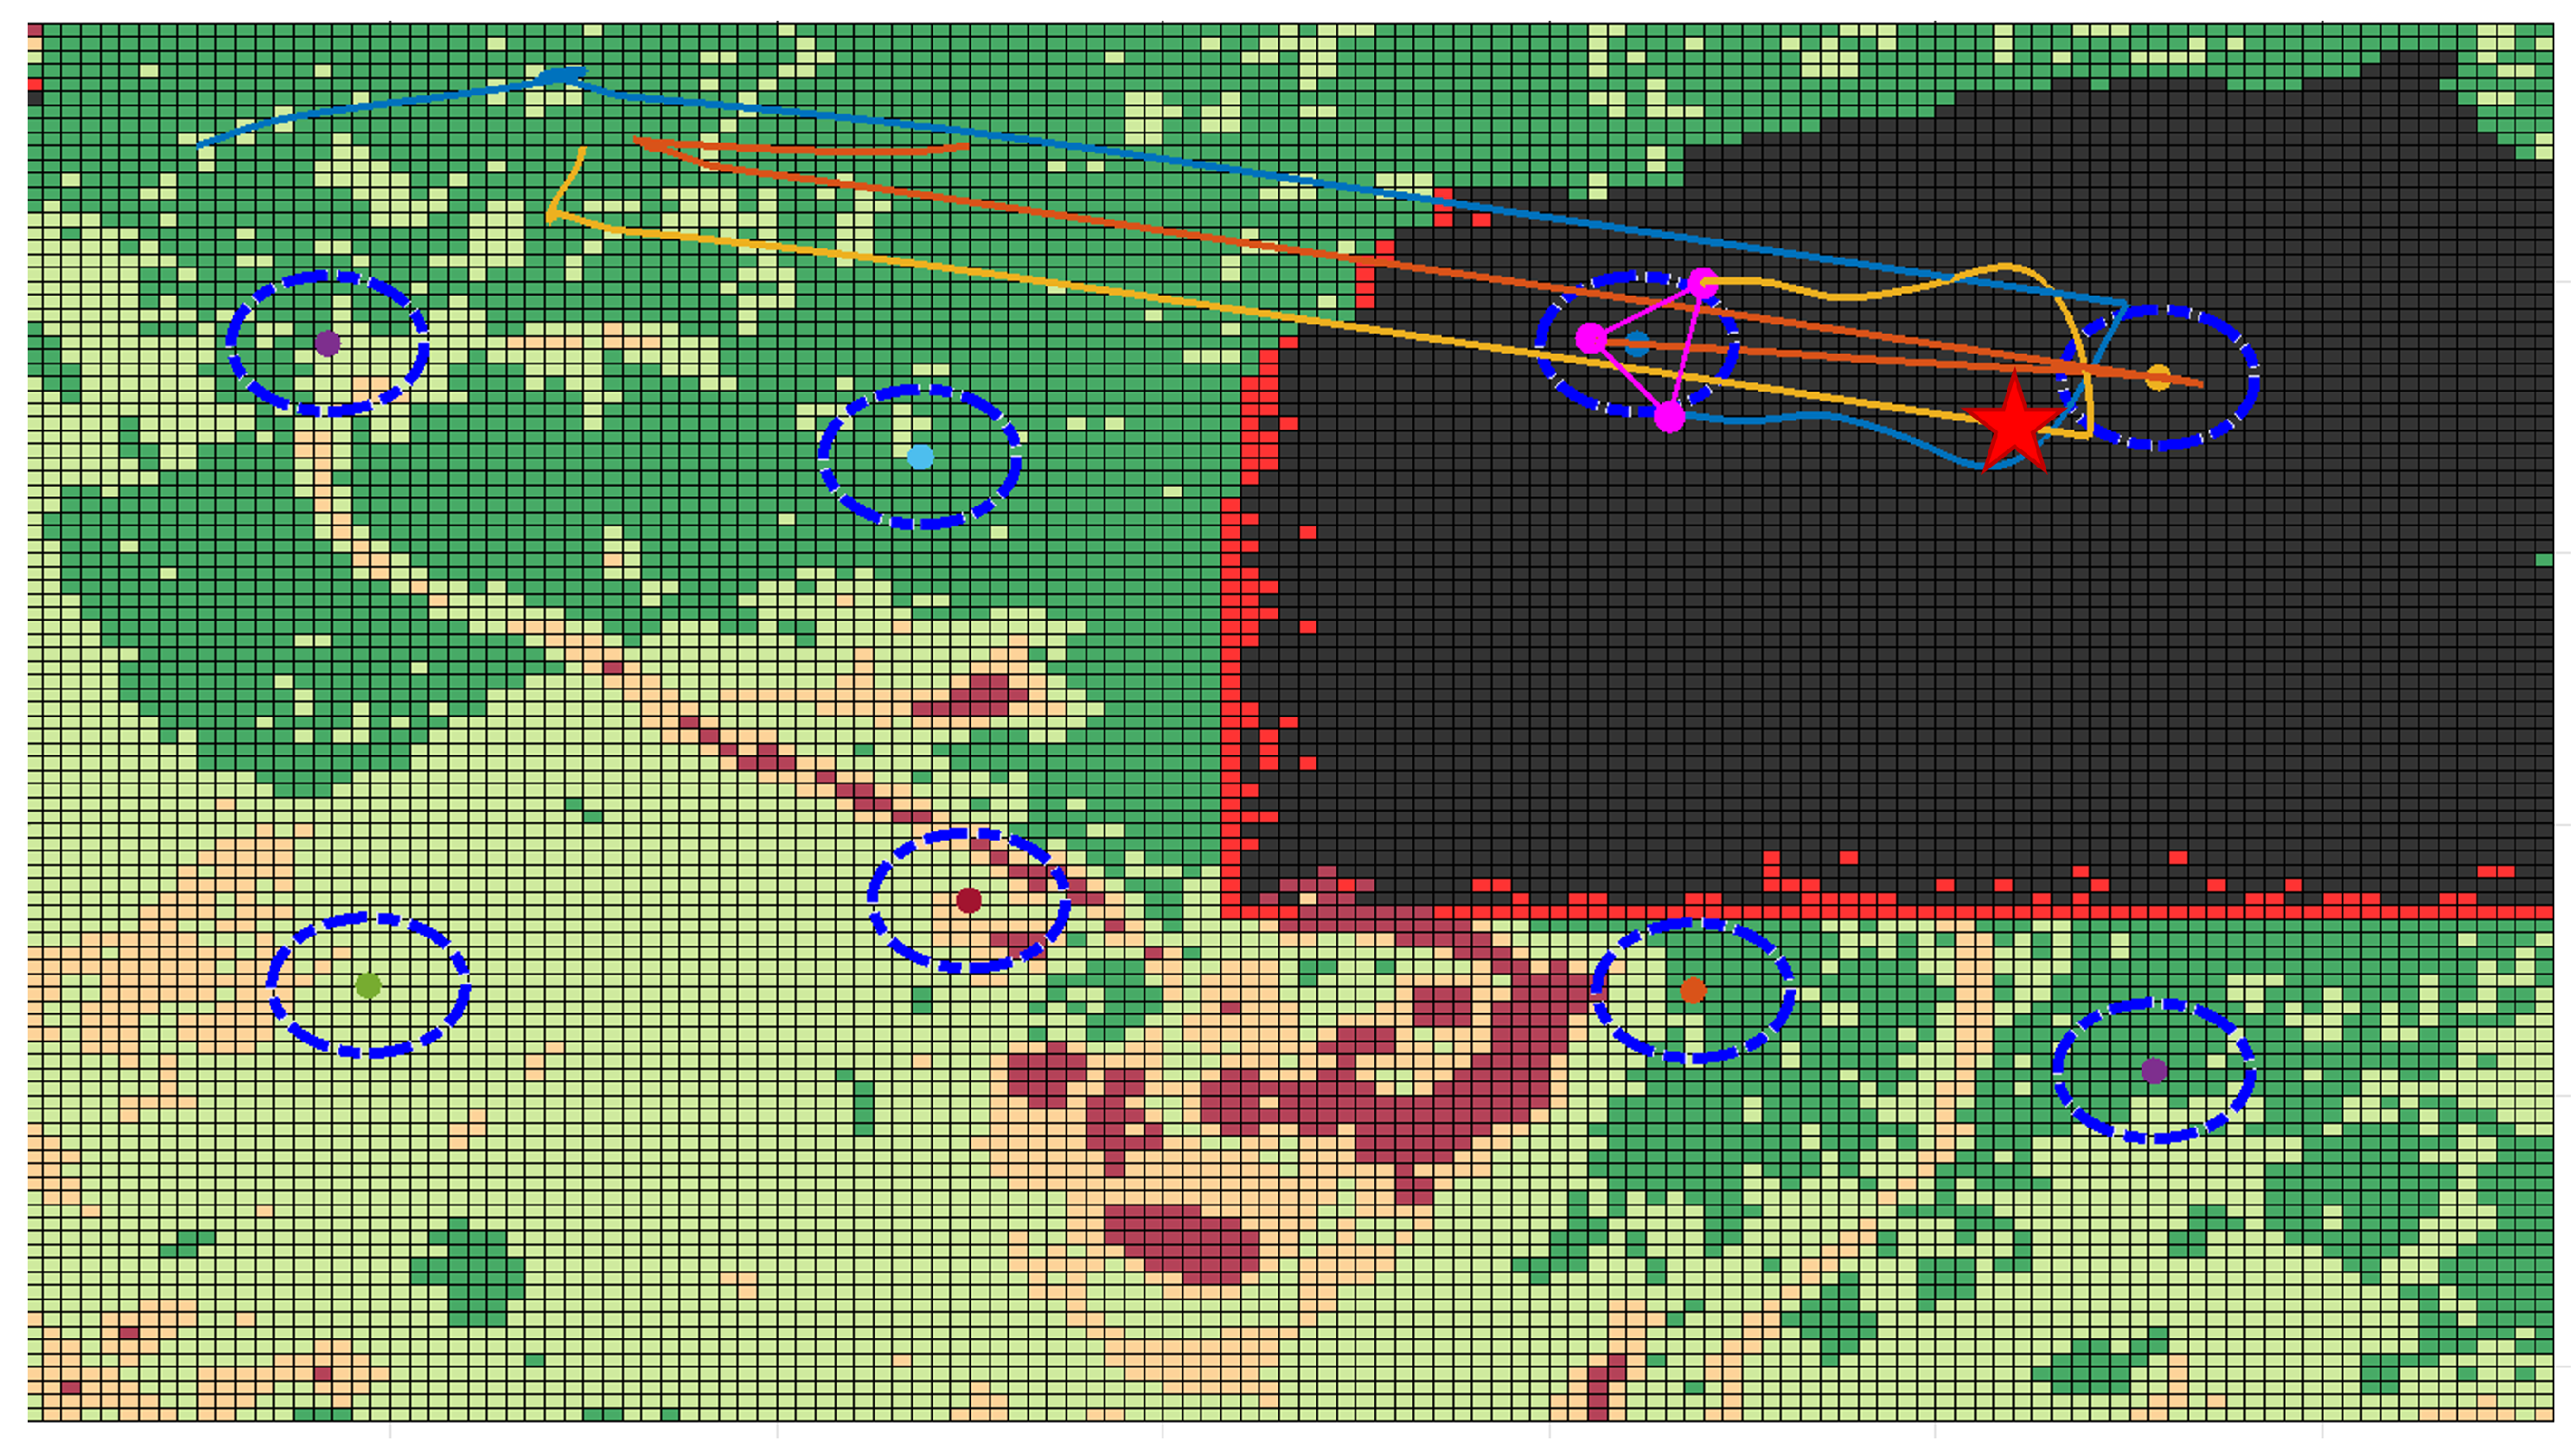
We can see from Figure 11a that the fire front shortly propagates into the other Voronoi regions, except the fifth and the first ones that remain unaffected due to the wind conditions and their geographical location. Unsurprisingly, C ( c 4 ) is the first region to surpass the threshold of 45 % , so the drones receive as their first command the order to station over c 4 , as depicted in Figure 11b. From the figure, we note how the target waypoint changes about 15 min before the actual surpassing of the threshold, since the monitoring system is basing its analysis on the predictive model. After a few minutes, we see how the target waypoint changes to c 3 as fire is spreading the the rest of the area. Figure 9 reports a 3D visualization of the monitored zone, with the drones’ trajectory, their formation, and the Voronoi centroids highlighted. Figure 10 reports the same scenario in 2D.

6.5. Third Simulation: Multiple Ignition Points

In this test, we want to analyze the response of the system against scenarios in which multiple ignition points are present at the same time. To this end, we consider two test cases:
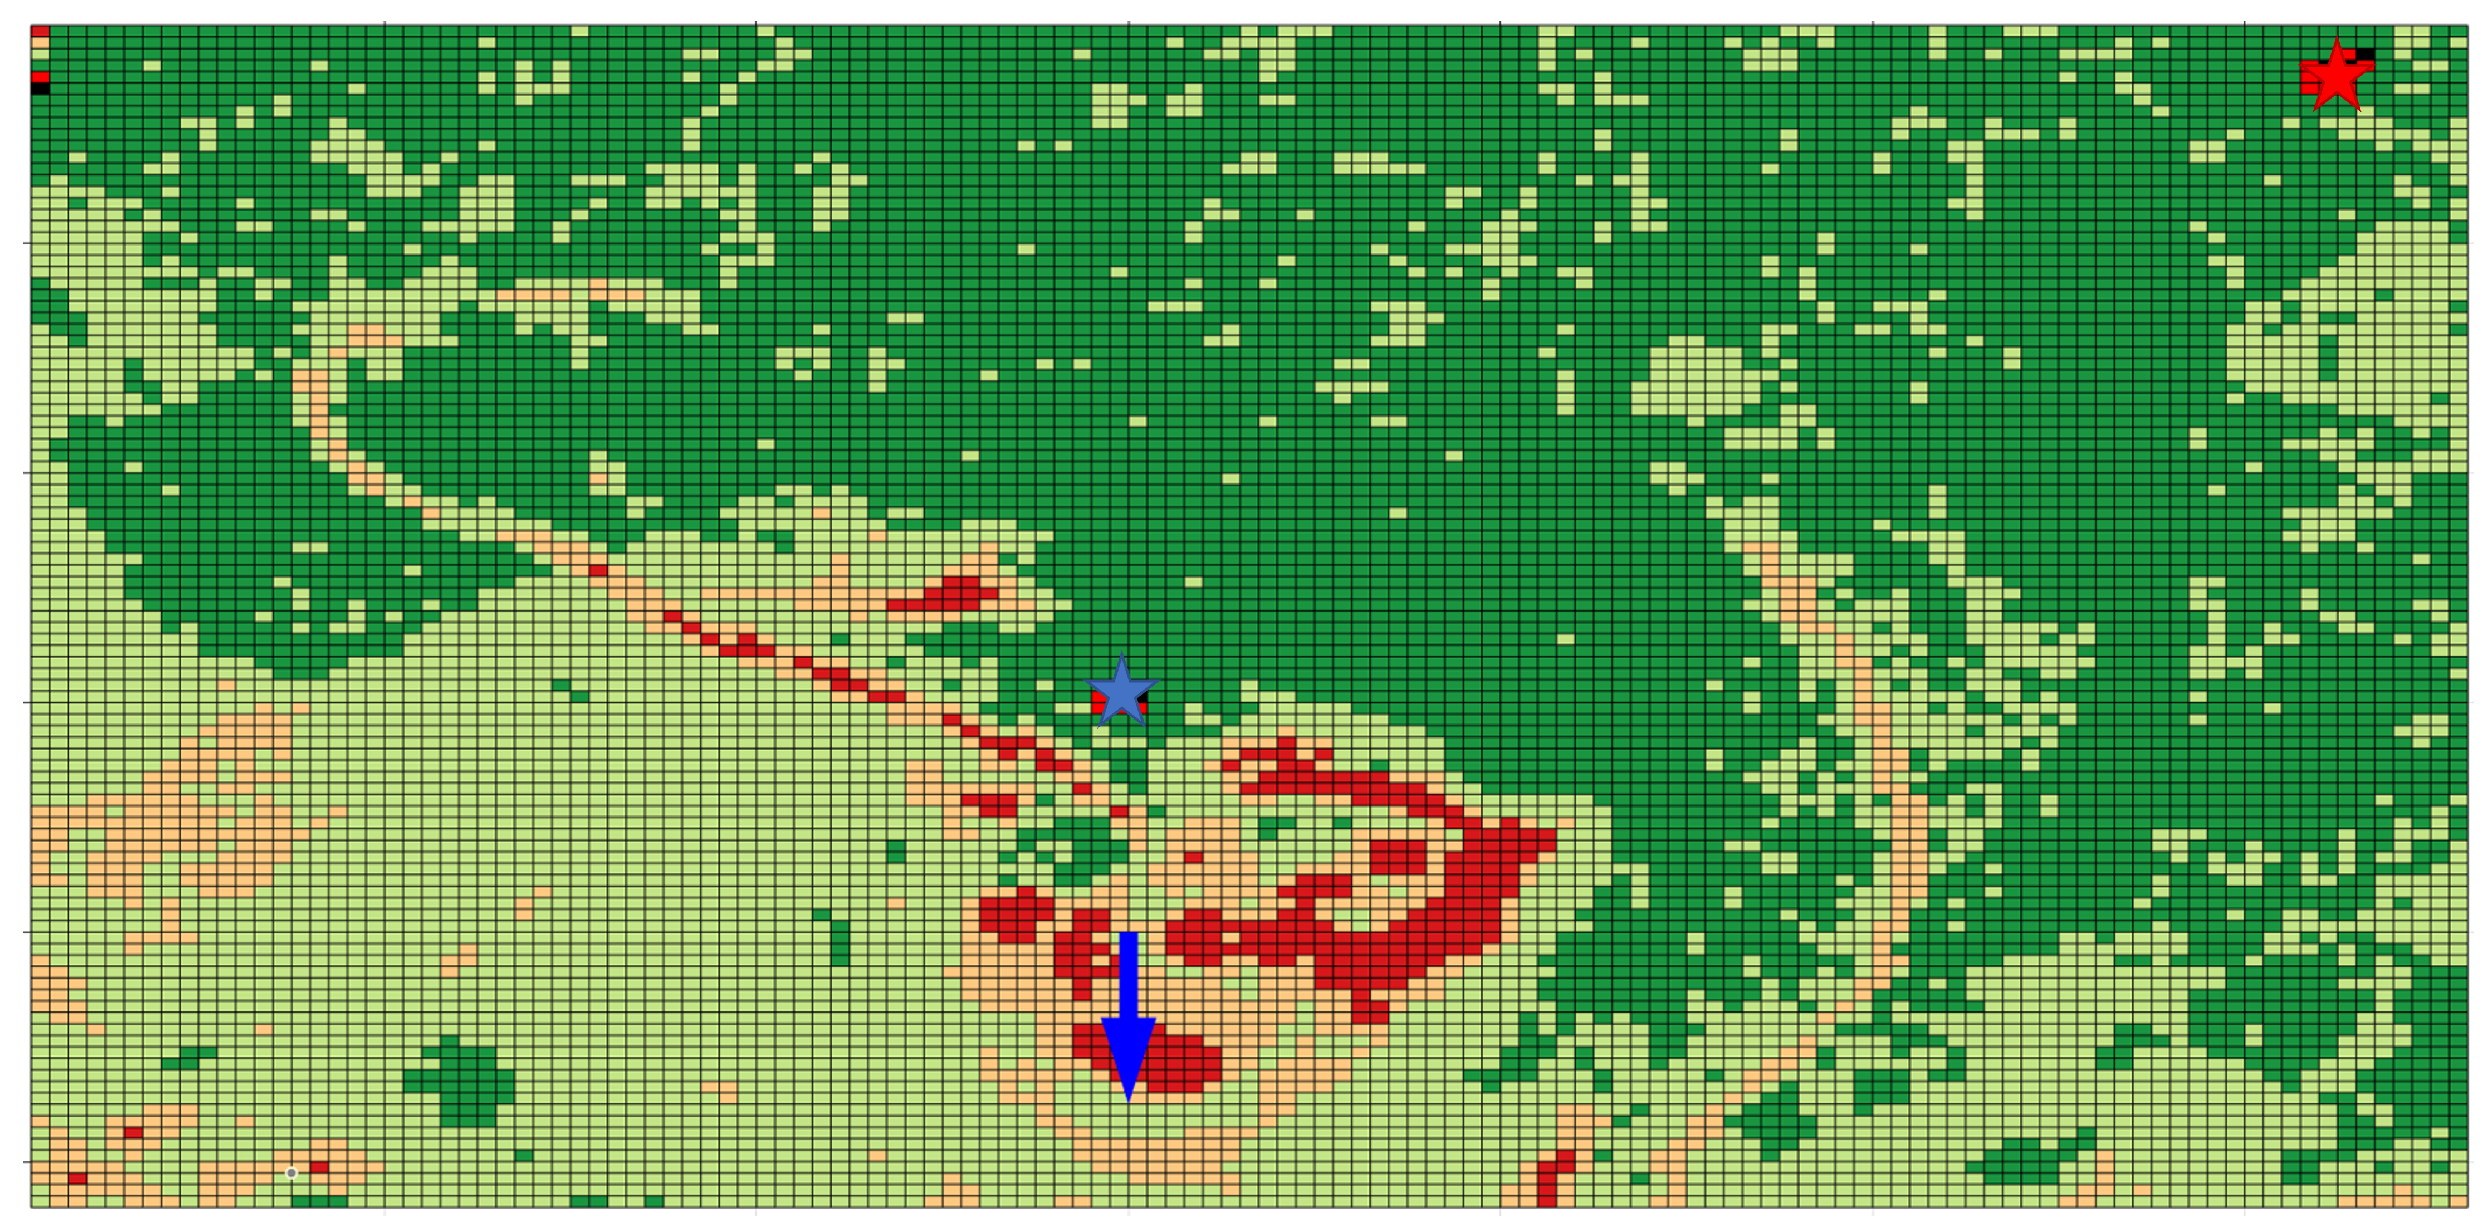
  • In the first scenario, a second fire starts during an on-going emergency, as depicted in Figure 12.
  • In the second scenario, two fires start at the same time, as depicted in Figure 13.
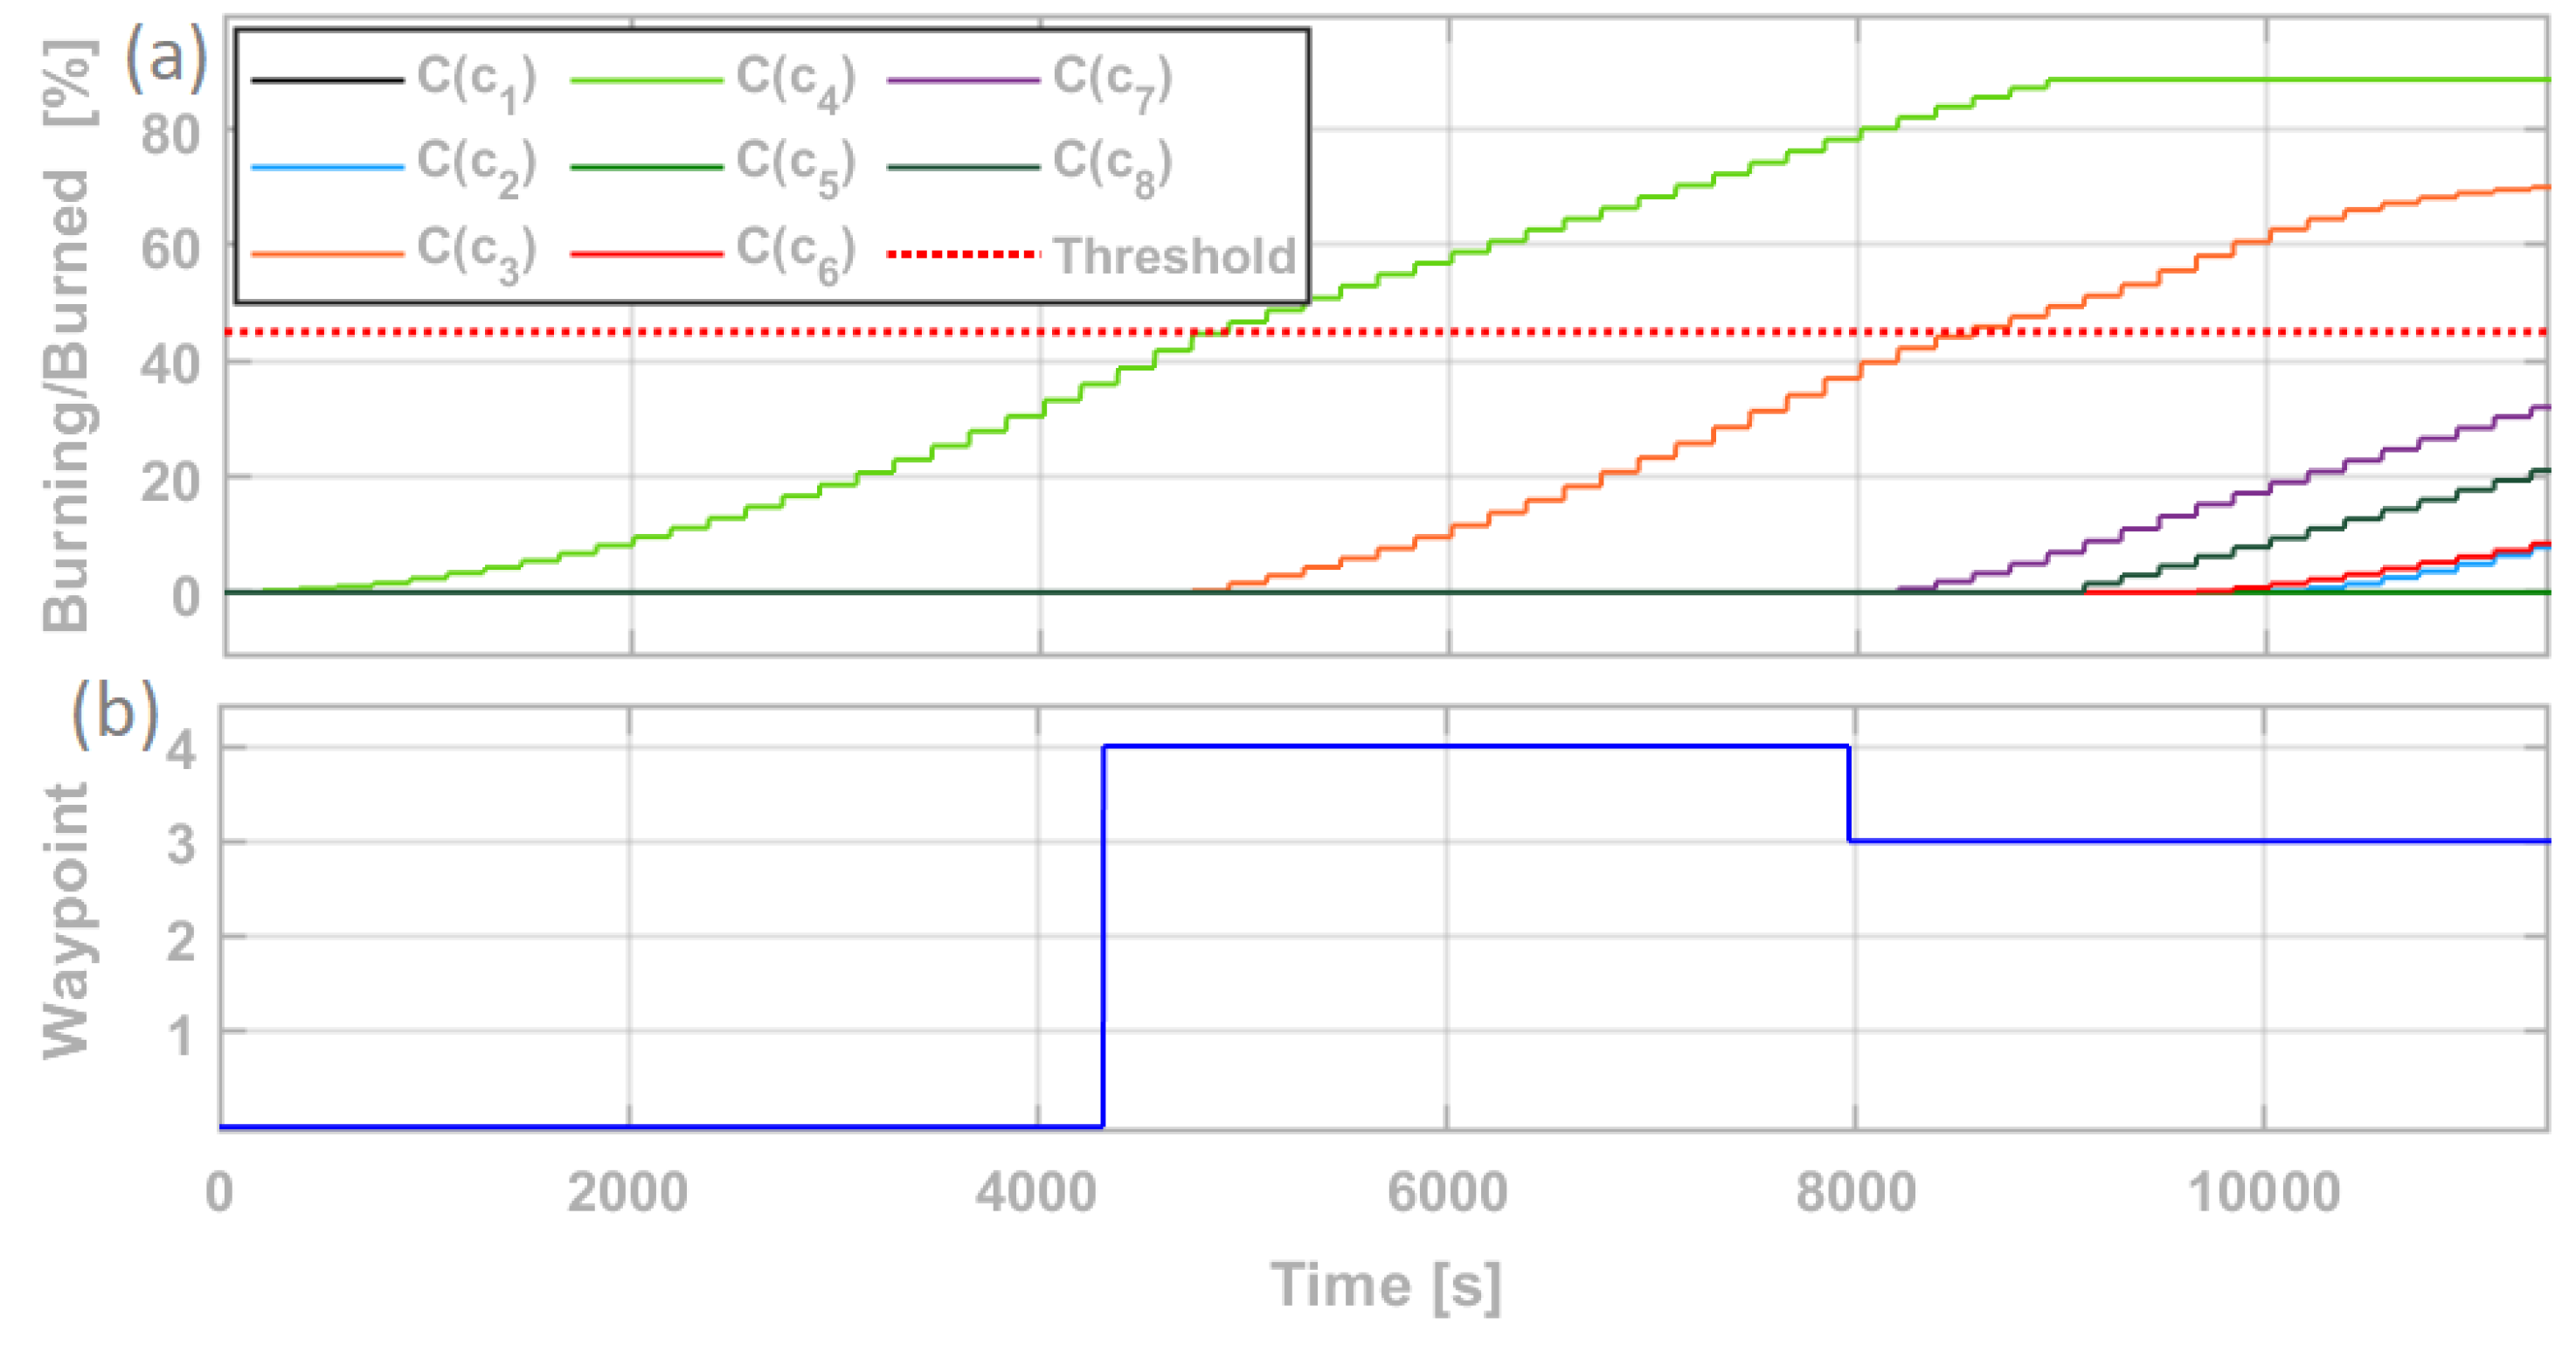
In the first setting, we expect the drone fleet to monitor initially the fourth waypoint (as the first fire started from it) and its neighbors (waypoints 3 and 8), to then switch to the area around waypoint 5 as the second fire grows. Figure 14 reports the expected behavior, highlighting also how after waypoint 5 the following waypoint is the sixth, mostly due to the wind direction.
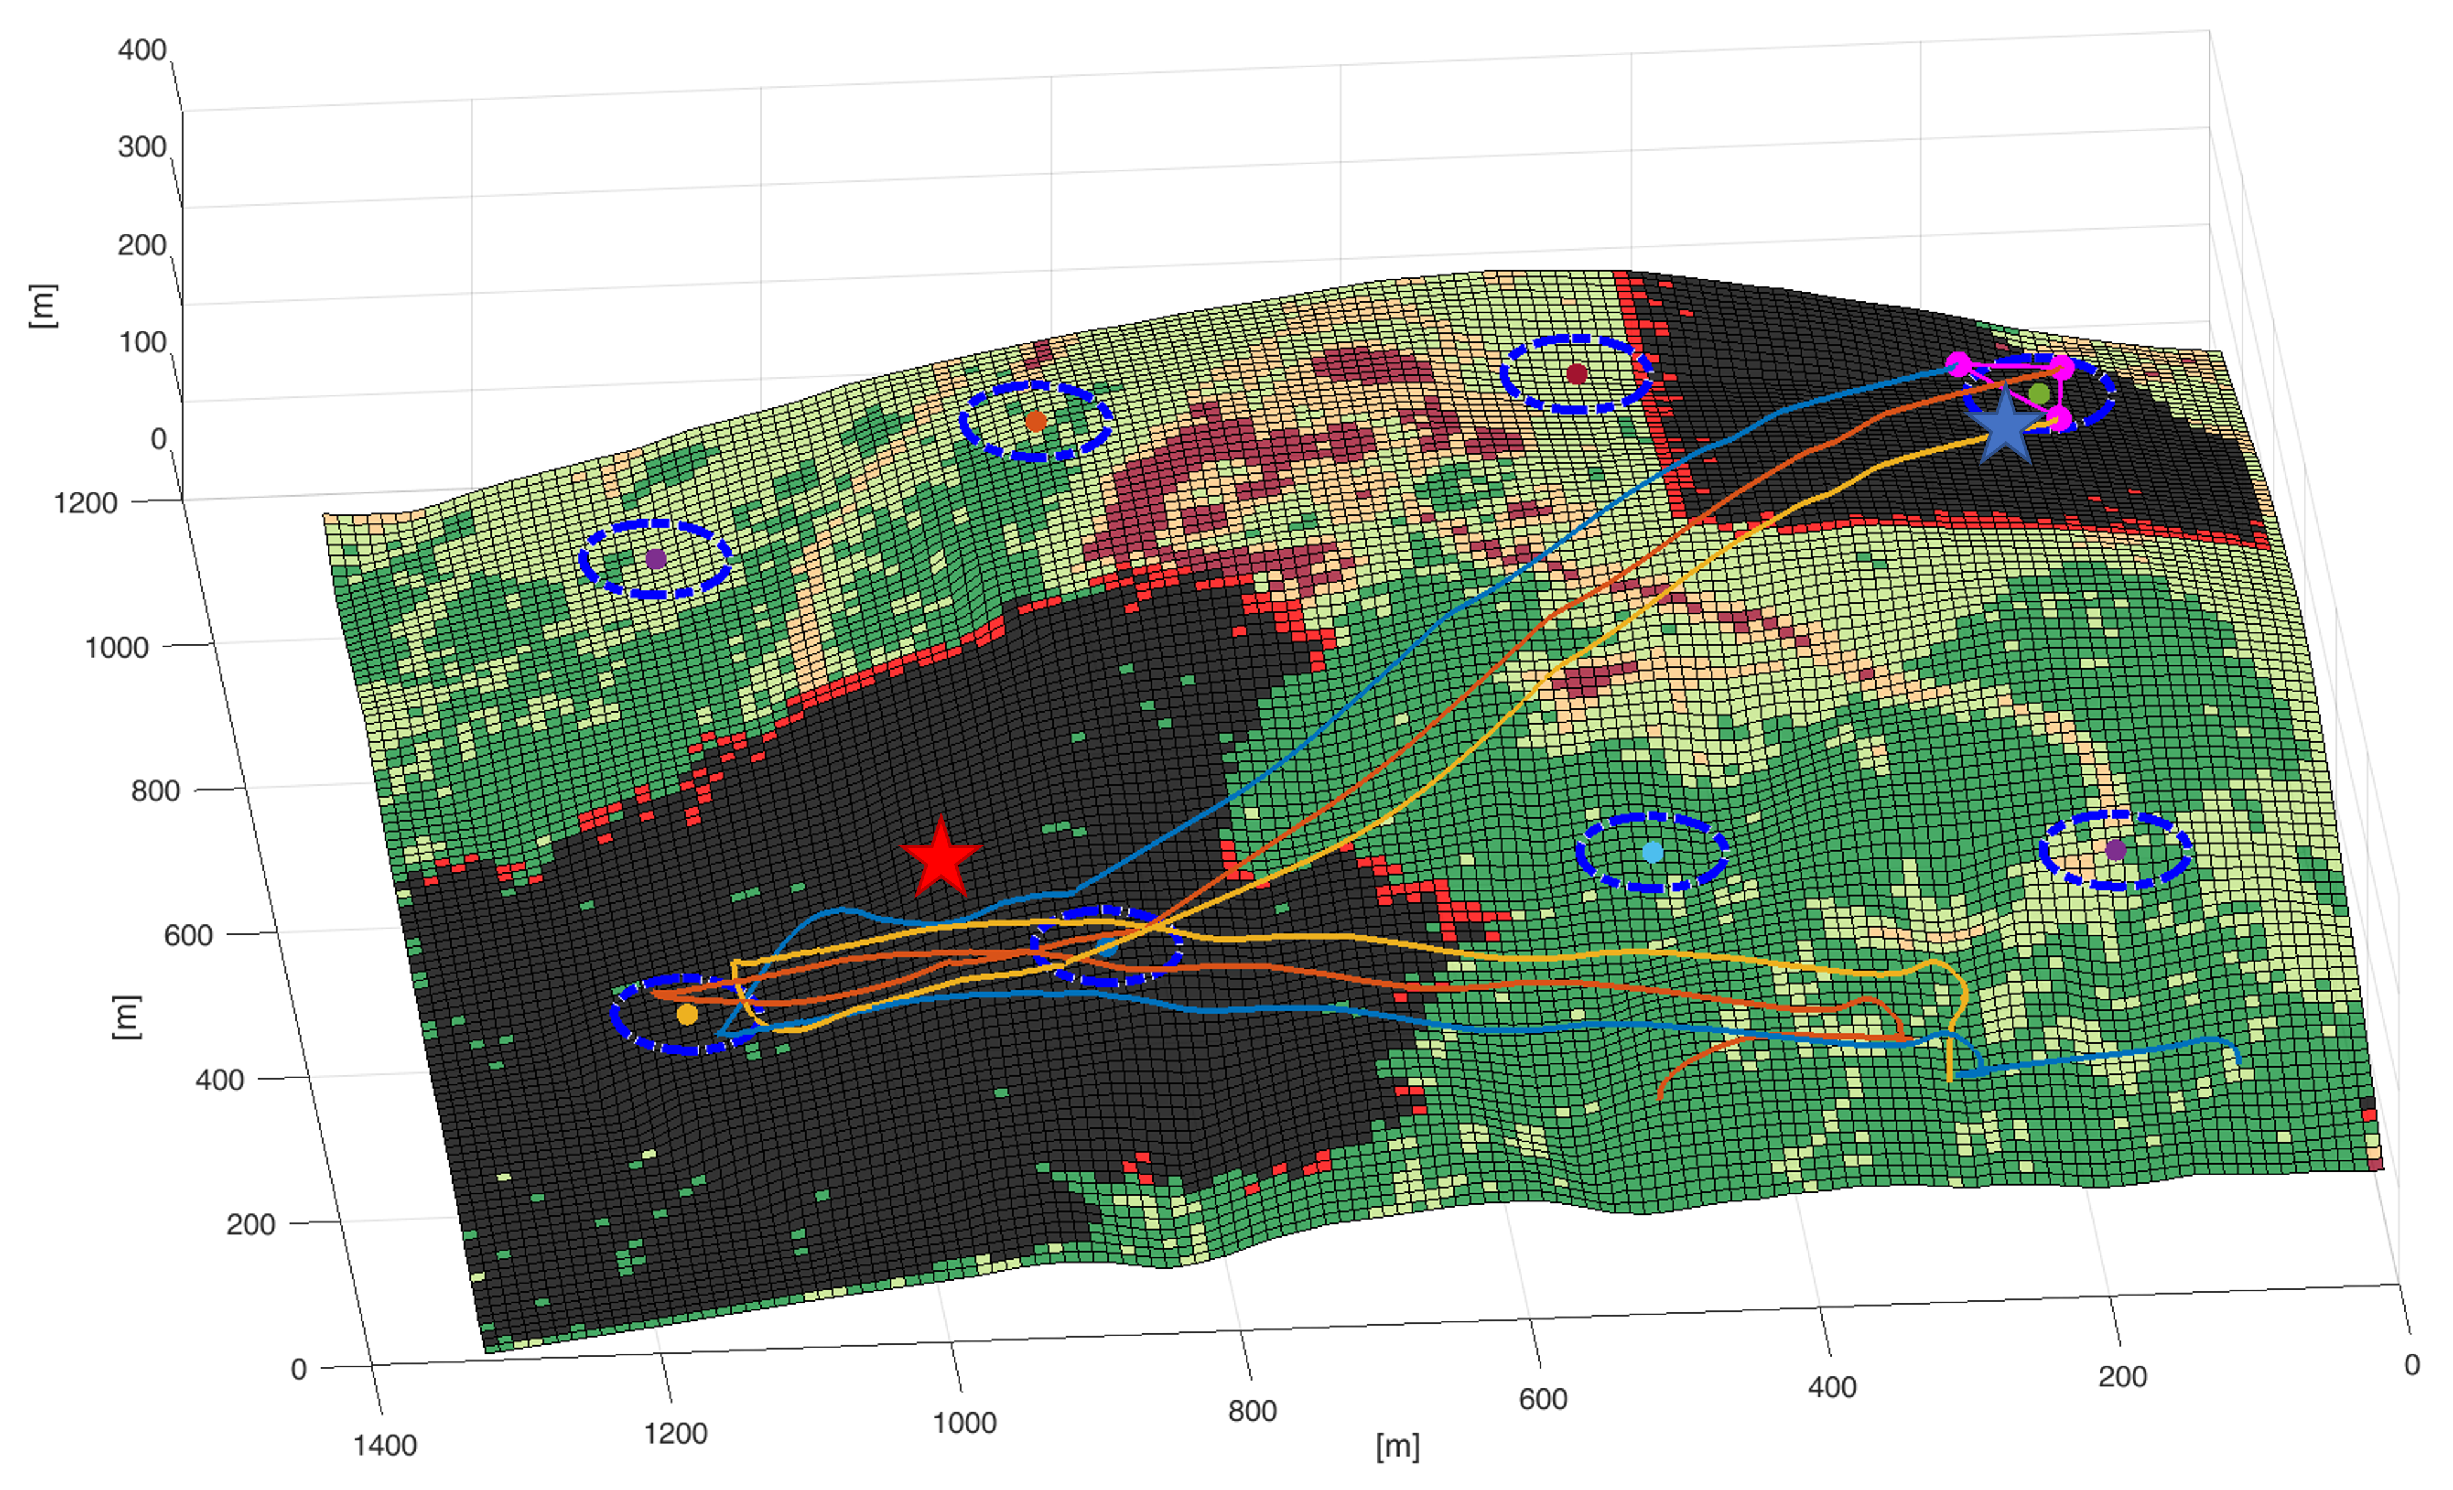
Figure 15 reports a 3D view of the simulation at time 6500, shortly after the drones have moved towards the third waypoint.
Regarding the second scenario, in which the two fires start at the same time, we observe in Figure 16 how the drones alternate between waypoints closer to one or the other ignition points. Figure 17 depicts the same simulation.

7. Conclusions and Future Works

This paper presented a system for dynamically adapt the patrolling/flight planning of a fleet of drones for fire monitoring purposes.
The proposed controller combines satellite data sources (NDVI and DEM) with terrestrial data (wind speed and direction) to build a predictive fire spread model. The internal functioning of the tool is based around a dynamic fire risk-aware Voronoi partition of the monitored area, that allows the identification of a set of waypoints that may be used to schedule the path of a group of drones to efficiently monitor the area.
During fire events, the system employs its internal model to generate predictions on its propagation. Such predictions are then used to determine which area (i.e., waypoint) is the most crucial to monitor at any given time.
The paper present three simulations of different fire events on a test area, identified by the ESA-funded project ARIES, located in Italy. The proposed control scheme demonstrated good performance in anticipating the fire spread and in dispatching, accordingly, the drones on the territory, both on simpler scenarios with one ignition point and in more complex fire events.
This work also presented our open-source simulator, that provides the flexibility of tailoring different metrics and criteria in its internal functioning (e.g., using different satellite data sources to determine another fire risk index) and includes flights dynamics and several different flight control logics.
Future works are aimed at improving the capabilities of our simulator, by including multiple drone fleets, battery charging/drone substitution logics, and more accurate fire prediction models.

Author Contributions

Conceptualization, A.G., R.G. and A.P.; methodology, A.G., R.G. and F.F.; software F.F., R.G.; validation, A.G. and F.D.P.; investigation, A.G., A.P. and F.D.P.; resources, A.P. and F.D.P.; writing—original draft preparation, A.G., A.P. and F.D.P.; writing—review and editing, R.G. and F.D.P.; supervision, F.D.P. and A.P.; project administration, A.P. and A.G.; funding acquisition, F.D.P. and A.P. All authors have read and agreed to the published version of the manuscript.

Funding

This work has been partially funded by the ESA Business Application and Space Solution under the 5G for L’ART program in the scope of the ARIES project (grant agreement No 4000133127).

Institutional Review Board Statement

Not applicable.

Informed Consent Statement

Not applicable.

Data Availability Statement

The satellite data used in this study is available at (https://scihub.copernicus.eu) and (doi:10.13127/TINITALY/1.0). The simulator used in this study was open-sourced at (https://github.com/FedericoFi/ARIES-FireSimulator).

Conflicts of Interest

The authors declare no conflict of interest.

References

  1. Bond, W.; Keeley, J. Fire as a global ‘herbivore’: The ecology and evolution of flammable ecosystems. Trends Ecol. Evol. 2005, 20, 387–394. [Google Scholar] [CrossRef]
  2. de Rigo, D.; Libertà, G.; Houston Durrant, T.; Artés Vivancos, T.; San-Miguel-Ayanz, J. Forest Fire Danger Extremes in Europe under Climate Change: Variability and Uncertainty; Publications Office of the European Union: Luxembourg, 2017. [Google Scholar] [CrossRef]
  3. Celermajer, D.; Lyster, R.; Wardle, G.M.; Walmsley, R.; Couzens, E. The Australian bushfire disaster: How to avoid repeating this catastrophe for biodiversity. WIREs Clim. Chang. 2021, 12, e704. [Google Scholar] [CrossRef]
  4. Ward, M.; Tulloch, A.I.T.; Radford, J.Q.; Williams, B.A.; Reside, A.E.; Macdonald, S.L.; Mayfield, H.J.; Maron, M.; Possingham, H.P.; Vine, S.J.; et al. Impact of 2019–2020 mega-fires on Australian fauna habitat. Nat. Ecol. Evol. 2020, 4, 1321–1326. [Google Scholar] [CrossRef]
  5. Khaykin, S.; Legras, B.; Bucci, S.; Sellitto, P.; Isaksen, L.; Tencé, F.; Bekki, S.; Bourassa, A.; Rieger, L.; Zawada, D.; et al. The 2019/20 Australian wildfires generated a persistent smoke-charged vortex rising up to 35 km altitude. Commun. Earth Environ. 2020, 1, 22. [Google Scholar] [CrossRef]
  6. Biddle, N.; Bryant, C.; Gray, M.; Marasinghe, D. Measuring the Economic Impact of Early Bushfire Detection; Centre for Social Research and Methods (ANU): Canberra, Australia, 2020. [Google Scholar]
  7. Restas, A. Drone Applications for Supporting Disaster Management. World J. Eng. Technol. 2015, 3, 316–321. [Google Scholar] [CrossRef] [Green Version]
  8. Moulianitis, V.C.; Thanellas, G.; Xanthopoulos, N.; Aspragathos, N.A. Evaluation of UAV Based Schemes for Forest Fire Monitoring. In Advances in Service and Industrial Robotics; Springer International Publishing: New York, NY, USA, 2018; pp. 143–150. [Google Scholar] [CrossRef]
  9. Skorput, P.; Mandzuka, S.; Vojvodic, H. The use of Unmanned Aerial Vehicles for forest fire monitoring. In Proceedings of the 2016 International Symposium ELMAR, Zadar, Croatia, 12–14 September 2016. [Google Scholar] [CrossRef]
  10. Khabarov, N.; Moltchanova, E.; Obersteiner, M. Valuing Weather Observation Systems for Forest Fire Management. IEEE Syst. J. 2008, 2, 349–357. [Google Scholar] [CrossRef]
  11. Casbeer, D.W.; Kingston, D.B.; Beard, R.W.; McLain, T.W. Cooperative forest fire surveillance using a team of small unmanned air vehicles. Int. J. Syst. Sci. 2006, 37, 351–360. [Google Scholar] [CrossRef]
  12. Onderka, M.; Melicherčik, I. Fire-prone areas delineated from a combination of the Nesterov Fire-risk Rating Index with multispectral satellite data. Appl. Geomat. 2009, 2, 1–7. [Google Scholar] [CrossRef] [Green Version]
  13. Giitsidis, T.; Karakasis, E.; Gasteratos, A.; Sirakoulis, G.C. Human and Fire Detection from High Altitude UAV Images. In Proceedings of the 2015 23rd Euromicro International Conference on Parallel, Distributed, and Network-Based Processing, Turku, Finland, 4–6 March 2015. [Google Scholar] [CrossRef]
  14. Alexis, K.; Nikolakopoulos, G.; Tzes, A.; Dritsas, L. Coordination of Helicopter UAVs for Aerial Forest-Fire Surveillance. In Applications of Intelligent Control to Engineering Systems; Springer: Dordrecht, The Netherlands, 2009; pp. 169–193. [Google Scholar] [CrossRef]
  15. Ollero, A.; de Dios, J.M.; Merino, L. Unmanned aerial vehicles as tools for forest-fire fighting. For. Ecol. Manag. 2006, 234, S263. [Google Scholar] [CrossRef]
  16. Hristov, G.; Raychev, J.; Kinaneva, D.; Zahariev, P. Emerging Methods for Early Detection of Forest Fires Using Unmanned Aerial Vehicles and Lorawan Sensor Networks. In Proceedings of the 2018 28th EAEEIE Annual Conference (EAEEIE), Hafnarfjordur, Iceland, 26–28 September 2018. [Google Scholar] [CrossRef]
  17. Kinaneva, D.; Hristov, G.; Raychev, J.; Zahariev, P. Early Forest Fire Detection Using Drones and Artificial Intelligence. In Proceedings of the 2019 42nd International Convention on Information and Communication Technology, Electronics and Microelectronics (MIPRO), Opatija, Croatia, 20–24 May 2019. [Google Scholar] [CrossRef]
  18. Afghah, F.; Razi, A.; Chakareski, J.; Ashdown, J.D. Wildfire Monitoring in Remote Areas Using Autonomous Unmanned Aerial Vehicles. CoRR 2019, abs/1905.00492. Available online: http://xxx.lanl.gov/abs/1905.00492 (accessed on 1 October 2021).
  19. Kaur, H.; Sood, S.K. Energy-Efficient IoT-Fog-Cloud Architectural Paradigm for Real-Time Wildfire Prediction and Forecasting. IEEE Syst. J. 2020, 14, 2003–2011. [Google Scholar] [CrossRef]
  20. Mao, S.; He, S.; Wu, J. Joint UAV Position Optimization and Resource Scheduling in Space-Air-Ground Integrated Networks With Mixed Cloud-Edge Computing. IEEE Syst. J. 2020, 1–11. [Google Scholar] [CrossRef]
  21. Simoes, D.; Rodrigues, A.; Reis, A.B.; Sargento, S. Forest Fire Monitoring Through a Network of Aerial Drones and Sensors. In Proceedings of the 2020 IEEE International Conference on Pervasive Computing and Communications Workshops (PerCom Workshops), Austin, TX, USA, 23–27 March 2020. [Google Scholar] [CrossRef]
  22. Papadopoulos, G.D.; Pavlidou, F.N. A Comparative Review on Wildfire Simulators. IEEE Syst. J. 2011, 5, 233–243. [Google Scholar] [CrossRef]
  23. Muzy, A.; Innocenti, E.; Aiello, A.; Santucci, J.F.; Marcelli, T.; Santoni, P.A. Discrete-event modelling of fire spreading. Int. J. Syst. Sci. 2008, 39, 193–206. [Google Scholar] [CrossRef]
  24. Séro-Guillaume, O.; Ramezani, S.; Margerit, J.; Calogine, D. On large scale forest fires propagation models. Int. J. Therm. Sci. 2008, 47, 680–694. [Google Scholar] [CrossRef]
  25. Preisler, H.K.; Ager, A.A. Forest-Fire Models. In Encyclopedia of Environmetrics; John Wiley & Sons, Ltd: Hoboken, NJ, USA, 2014. [Google Scholar] [CrossRef]
  26. Consortium for the Research in Automation and Telecommunication (CRAT). Fire Simulator for the ARIES Project. Available online: https://github.com/FedericoFi/ARIES-FireSimulator (accessed on 1 October 2021).
  27. Carlson, T.N.; Ripley, D.A. On the relation between NDVI, fractional vegetation cover, and leaf area index. Remote Sens. Environ. 1997, 62, 241–252. [Google Scholar] [CrossRef]
  28. Lima, M.C.F.; Krus, A.; Valero, C.; Barrientos, A.; del Cerro, J.; Roldán-Gómez, J.J. Monitoring Plant Status and Fertilization Strategy through Multispectral Images. Sensors 2020, 20, 435. [Google Scholar] [CrossRef] [PubMed] [Green Version]
  29. del Cerro, J.; Ulloa, C.C.; Barrientos, A.; de León Rivas, J. Unmanned Aerial Vehicles in Agriculture: A Survey. Agronomy 2021, 11, 203. [Google Scholar] [CrossRef]
  30. Krause, S.; Sanders, T.G.; Mund, J.P.; Greve, K. UAV-Based Photogrammetric Tree Height Measurement for Intensive Forest Monitoring. Remote Sens. 2019, 11, 758. [Google Scholar] [CrossRef] [Green Version]
  31. Torresan, C.; Berton, A.; Carotenuto, F.; Gennaro, S.F.D.; Gioli, B.; Matese, A.; Miglietta, F.; Vagnoli, C.; Zaldei, A.; Wallace, L. Forestry applications of UAVs in Europe: A review. Int. J. Remote Sens. 2016, 38, 2427–2447. [Google Scholar] [CrossRef]
  32. Roldán, J.; Joossen, G.; Sanz, D.; del Cerro, J.; Barrientos, A. Mini-UAV Based Sensory System for Measuring Environmental Variables in Greenhouses. Sensors 2015, 15, 3334–3350. [Google Scholar] [CrossRef] [PubMed] [Green Version]
  33. European Space Agency. Radiometric Resolution. Available online: https://sentinels.copernicus.eu/web/sentinel/user-guides/sentinel-2-msi/resolutions/radiometric (accessed on 1 October 2021).
  34. USGS. What Are the Acquisition Schedules for the Landsat Satellites? Available online: https://www.usgs.gov/faq/mapping-remote-sensing-and-geospatial-data (accessed on 1 October 2021).
  35. European Space Agency. Copernicus Open Access Hub. 2021. Available online: https://scihub.copernicus.eu (accessed on 1 October 2021).
  36. QGIS Development Team. QGIS Geographic Information System; QGIS Association: Berne, Switzerland, 2021. [Google Scholar]
  37. Tarquini, S.; Isola, I.; Favalli, M.; Battistini, A. TINITALY, a Digital Elevation Model of Italy with a 10 Meters Cell Size; Istituto Nazionale di Geofisica e Vulcanologia (INGV): Bologna, Italy, 2007. [Google Scholar] [CrossRef]
  38. Alexandridis, A.; Vakalis, D.; Siettos, C.; Bafas, G. A cellular automata model for forest fire spread prediction: The case of the wildfire that swept through Spetses Island in 1990. Appl. Math. Comput. 2008, 204, 191–201. [Google Scholar] [CrossRef]
  39. Mutthulakshmi, K.; Wee, M.R.E.; Wong, Y.C.K.; Lai, J.W.; Koh, J.M.; Acharya, U.R.; Cheong, K.H. Simulating forest fire spread and fire-fighting using cellular automata. Chin. J. Phys. 2020, 65, 642–650. [Google Scholar] [CrossRef]
  40. Karafyllidis, I.; Thanailakis, A. A model for predicting forest fire spreading using cellular automata. Ecol. Model. 1997, 99, 87–97. [Google Scholar] [CrossRef]
  41. Gharakhanlou, N.M.; Hooshangi, N. Dynamic simulation of fire propagation in forests and rangelands using a GIS-based cellular automata model. Int. J. Wildland Fire 2021, 30, 652. [Google Scholar] [CrossRef]
  42. Wan, Z.; Hook, S.; Hulley, G. MOD11A2 MODIS/Terra land surface temperature/emissivity 8-day L3 global 1km SIN grid V006. NASA EOSDIS Land Processes DAAC; LP DAAC: Sioux Falls, SD, USA, 2015; Volume 10. [Google Scholar]
  43. Jaiswal, R.K.; Mukherjee, S.; Raju, K.D.; Saxena, R. Forest fire risk zone mapping from satellite imagery and GIS. Int. J. Appl. Earth Obs. Geoinf. 2002, 4, 1–10. [Google Scholar] [CrossRef]
  44. Zhou, Q.; Robson, M. Automated rangeland vegetation cover and density estimation using ground digital images and a spectral-contextual classifier. Int. J. Remote Sens. 2001, 22, 3457–3470. [Google Scholar] [CrossRef]
  45. Weise, D.R.; Biging, G.S. Effects of wind velocity and slope on flame properties. Can. J. For. Res. 1996, 26, 1849–1858. [Google Scholar] [CrossRef]
  46. Du, Q.; Faber, V.; Gunzburger, M. Centroidal Voronoi tessellations: Applications and algorithms. SIAM Rev. 1999, 41, 637–676. [Google Scholar] [CrossRef] [Green Version]
  47. Toksoz, M.A.; Oguz, S.; Gazi, V. Decentralized Formation Control of a Swarm of Quadrotor Helicopters. In Proceedings of the 2019 IEEE 15th International Conference on Control and Automation (ICCA), Edinburgh, UK, 16–19 July 2019. [Google Scholar] [CrossRef]
  48. Santopaolo, A.; Saif, S.S.; Pietrabissa, A.; Giuseppi, A. Forest Fire Risk Prediction from Satellite Data with Convolutional Neural Networks. In Proceedings of the 2021 29th Mediterranean Conference on Control and Automation (MED), Puglia, Italy, 22–25 June 2021; pp. 360–367. [Google Scholar] [CrossRef]
  49. ARIES Project Website. Available online: https://business.esa.int/projects/aries (accessed on 1 October 2021).
Figure 1. Functional architecture of the system.
Drones 05 00130 g001
Figure 2. Satellite image of the test area—‘Pineta di Roio’ (Monteluco), Abruzzo, Italy. Red star: center of the area.
Drones 05 00130 g002
Figure 3. NDVI image of the test area obtained from Sentinel-2 data.
Drones 05 00130 g003
Figure 4. von Neumann (left) and Moore’s definitions of neighborhoods.
Drones 05 00130 g004
Figure 5. NDVI image of the monitored area (left); threshold evaluation of p b u r n * ( i ) (1: yellow, 0: blue) with macro-cells and centroids (center) obtained according to Algorithm 1 (line 4); resulting Voronoi tesselation (right).
Drones 05 00130 g005
Figure 6. Effect of wind direction on the position of the centroids and the Voronoi tesselation. The wind direction varies from 0 ° (black dots) to 180 ° (red dots). The black lines show how the centroids vary for intermediate angles.
Drones 05 00130 g006
Figure 7. Images the case study area—Pineta di Roio (Monteluco), L’Aquila.
Drones 05 00130 g007
Figure 8. Example of patrolling of the area: the red arrow represents how the drone(s) should navigate to cover the identified centroids in the selected order. The figure also reports the labeling of the centroids that will be used in the following figures.
Drones 05 00130 g008
Figure 9. Evolution of the fire spreading and formation monitoring on the modeled area. Base colors (green, orange, yellow, and red): NDVI levels, as in Figure 3; vivid red: burning cells; black: burned cells. Drones trajectories are reported with orange, yellow, and blue lines; the drone fleet is depicted in purple; the eight centroids are reported in different colors and highlighted by blue dashed circles around them.
Drones 05 00130 g009
Figure 10. Aerial view of Figure 9.
Drones 05 00130 g010
Figure 11. (a) Percentage of burining or burned cells in the various Voronoi regions over time; (b) target waypoint for the drone fleet.
Drones 05 00130 g011
Figure 12. The second ignition point (blue start) becomes active after the first fire event (red star) has compromised a significant area in the north east. The blue arrow in the center represents the wind direction.
Drones 05 00130 g012
Figure 13. Two fires start at the same time (red and blue stars). The blue arrow represents the wind direction.
Drones 05 00130 g013
Figure 14. First scenario: target waypoint given to the drone fleet over time.
Drones 05 00130 g014
Figure 15. First scenario: 3D visualization of the drone patrolling at time 6500 s.
Drones 05 00130 g015
Figure 16. Second scenario: target waypoint given to the drone fleet over time.
Drones 05 00130 g016
Figure 17. Second scenario: aerial view of the drone patrolling schedule at time 3250 s.
Drones 05 00130 g017
Publisher’s Note: MDPI stays neutral with regard to jurisdictional claims in published maps and institutional affiliations.