Abstract
Adequate design of energy dissipation structures is essential for effective flood control. The effect of aeration on water flow has been one of most analyzed phenomena during the last decades due to its influence on hydraulic structures. The purpose of this study is to characterize the influence of aeration on the boundary friction in supercritical and fully turbulent flows. Our analysis is based on a physical model to reproduce these phenomena and consists of a spillway chute 6.5 m high, followed by a 10 m length and 2 m high still basin. Water and air are supplied by a pump and compressors, and is controlled at the entrance by several valves and flowmeters, while the channel is monitored to measure the velocity profile and air concentration in the intake flow to the still basin. Velocity results included in this paper show the relation between air concentration and energy dissipation by friction. To determine this relation, Manning roughness numbers have been obtained for all scenarios. It has been found that greater air entrainment implies acceleration of the flow, since friction is the main energy dissipation mechanism in open channels flow.
PACS:
J0101
1. Introduction
The social and economic impact of floods represents a very important issue due to the enormous amounts of losses involved. In this context, dams play a crucial role to match the requirements for hydrological regulation against flooding phenomena, especially in basins with extreme hydrological regimes. This is the reason why hydraulic and dam operation requirements need to cope with increasing safety standards, and future dam technical regulation should include the need for higher levels of dam operation control and safety devices, as well as higher discharge capacities. In this context, the need to review the hydraulic capacity of current dams (including weirs, spillways, and sluices) is clear, considering all the effects of the flow over the dam structure. In this sense, one structural element that strongly affects the discharge capacities in weir gravity dams is the stilling basin, which is clearly a hydraulic device for energy dissipation structure with a high cost, limited design boundaries, and operation conditions. Currently, the stilling basin design depends on hydraulic variables of intake flow. Our research includes the influence of aeration in the energy-dissipation ratio in this analysis. The Hydraulic Laboratory of CEDEX (Spain) is carrying out an experimental study of the aeration influence over chutes and stilling basins in the framework of the EMULSIONA project, a research funded by the Spanish Ministry of Economy. Our analysis is based on a 1:1 scale physical model designed to reproduce different scenarios with water and air flow rates. The experimental works are organized into two stages. First, the analysis is focused on the effects of aeration over the supercritical flow in the channel and how the velocity field is modified according to different air concentrations. The second part is currently being carried out and is aimed at characterizing the evolution of the hydraulic jump determined by spillway channel conditions.
The aim of this paper, reporting the first stage of the research, is to analyze the effects of aeration over the flow, and to characterize its influence over the boundary friction.
2. Results
Results obtained during the experimental phase involve a total of 12 scenarios of air (Qa) and water (Qw) flow (Table 1). Air flow is supplied by a compressor and is controlled by a valve and a flowmeter before the mixing air-water device. Table 1 shows also the average velocity (VIn) and air concentration (CIn) in the physical model test entrance, with a section width of 0.5 m and height of 0.08 m.

Table 1.
Experimental scenarios with average velocity and air concentration at the intake channel.
The main goal of the experimental work is to measure velocity and air concentration profiles in the final section of the spillway channel, just upstream of the stilling basin. These results are necessary to characterize the hydraulic jump inflow and energy dissipation in the channel by boundary friction, evaluating at the same time the aeration influence on energy dissipation processes. To reproduce a real condition of fully turbulent flow, the channel is covered at the top by a metallic mesh to increase turbulence along the channel. This element is flexible and does not hinder the free flow. On the other hand, a flexible plastic cover was set over the channel to reduce the air exchange between flow and atmosphere (Figure 1).
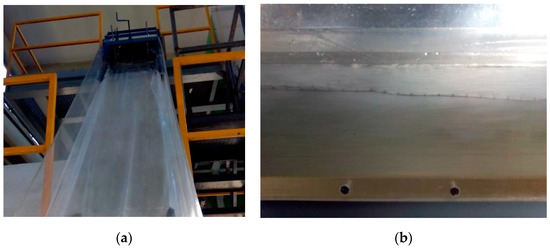
Figure 1.
(a) Border conditions over the flow surface during the experimental analysis; (b) Effects of the metallic mesh and plastic cover over the flow in test.
Figure 2 and Table 2 show the relation between velocity (VOut) and air concentration profiles (COut) in the channel exit section. Moreover, results includes the depth of the experiments when a concentration of 90% is reached (H90 Out), a value usually considered in the related scientific literature.
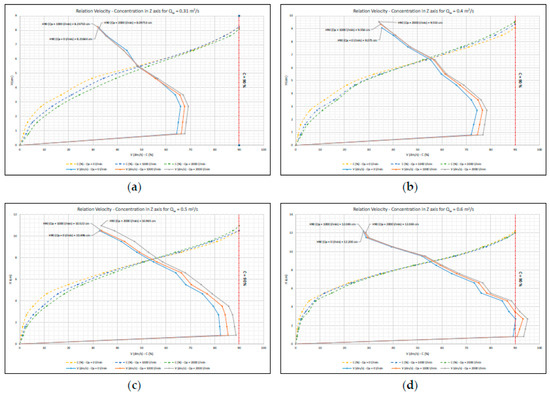
Figure 2.
Relation between velocity and concentration profiles: (a) Scenario 1 (Qw = 0.31 m2/s); (b) Scenario 2 (Qw = 0.4 m2/s); (c) Scenario 3 (Qw = 0.5 m2/s); (d) Scenario 4 (Qw = 0.6 m2/s).
Table 2.
Average velocity, concentration and H90 value at the channel exit.
3. Discussion
Results obtained during the experimental phase show that, in a constant water flow, there is a velocity increase with aeration growth. There are different energy dissipation mechanisms in spillways, but the most important factor in open channel flow is contour friction. Considering all the methods to evaluate this effect, Manning [1] formulation has been chosen because it is well known and widely used in the hydraulic engineering area to determine the friction slope (If) based on a roughness coefficient n (1), where V represents the average velocity and Rh the hydraulic radius.
The aeration affects the energy dissipation mechanisms in different ways. Hinze [2] considers that aeration increases the viscous turbulent dissipation, but this formulation is theoretical and without empirical support. Other authors consider the division and reunification of bubbles as the main factor over energy losses [3,4,5]. In this case, shear stress between flow layers breaks the bubbles to regroup each other’s in collision areas later. This process has to exceed the surface tension of the air particles and generates energy dissipation by heat. Both methods are opposed to the Manning formulation because they consider the turbulence as a main effect of dissipation instead of roughness. In our experimental case, we used the first option (Manning) to analyze energy dissipation due to contour friction, which is prevailing in supercritical flows with low water depth and high velocity. The application of other formulations would be interesting during the analysis of the hydraulic jump, where turbulence effects are more important over the flow. Using the velocity and air concentration profiles in the initial and final sections of the channel, it is possible to calculate the average values that characterize the spillway flow (VM, CM, H90 M) and also the friction slope of our test stretch. Including these data in the Manning Equation (1), a representative Manning roughness coefficient (n) is obtained for each scenario (Table 3). Moreover, this table also includes the reduction rate in % (∆n) of the Manning coefficient with respect to the roughness without aeration. Figure 3 relates the Manning roughness coefficient (n) with each concentration (CM) and demonstrates a roughness reduction with an air concentration increase.
Table 3.
Average velocity, concentration, H90 and n value at the middle section of channel.
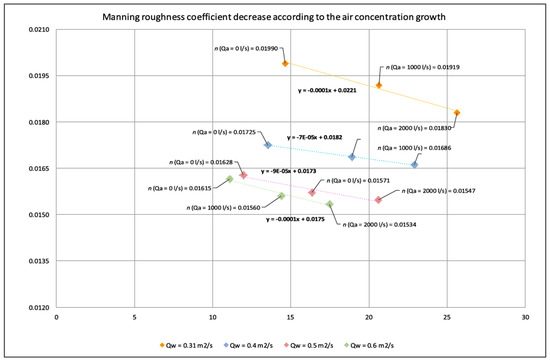
Figure 3.
Relation between Manning roughness coefficient (n) and average air concentration (CM) for all scenarios.
4. Materials and Methods
4.1. Physical Model
The experimental device consists of a spillway chute 6.5 m high, 0.5 m wide and slope of 75%, followed by a 10 m length and 2 m high stilling basin where the hydraulic jump is confined. Water and air are supplied by a pump and compressors and controlled at the entrance by several valves and flowmeters.
The maximum flow rates are 0.6 m2/s of water and 2000 l/min of air. Under these conditions, tested velocity ranges vary between 5 and 7 m/s with Froude number between 5 and 6.5. Figure 4 shows a general scheme of the installation and a general view picture of the physical model.
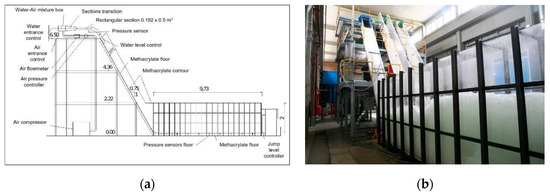
Figure 4.
Scheme of the physical model: (a) Section of the experimental structure with supply machines and contour materials; (b) Frontal view of the spillway channel and stilling basin.
4.2. Data Collections Methods
The two flow variables measured during the tests were the velocity and concentration profiles in the exit section of the channel. The flow velocity was collected by means of a Pitot probe with a pressure sensor, and connected to a data acquisition program developed in CEDEX with LabVIEW. The acquisition frequency is 100 data/s, and the recording time reaches 100 s.
The second method was focused on collecting the concentration data. In this case, the instrument used was an Air Concentration Meter (ACM) developed by the Hydraulic Engineering Department of the Universidad Politécnica de Cartagena (UPCT). This probe is based on a prototype developed in 1997 by U.S. Department of the Interior Bureau of Reclamation [6], and is designed to measure the percentage of air entrained in flowing water. This methodology detects the air bubbles passing through the water by changes in conductivity that take place when a bubble impinges on the probe tip. Figure 5 shows the Pitot (a) and conductivity (b) probes during the measurement process in the physical model.
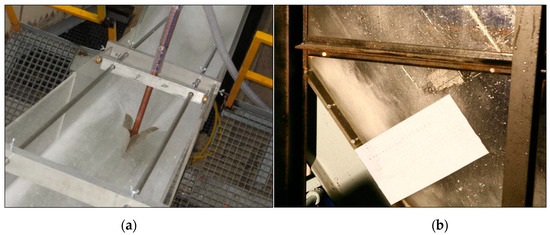
Figure 5.
(a) Pitot probe during the velocity measurement process. (b) ACM during the concentration measurement process.
5. Conclusions
Results obtained during the testing show that aeration plays a main role in energy dissipation in open channel flows with supercritical and fully turbulent conditions. With the same water rate, higher air concentration involves lower friction head losses. This reduction has been quantified by means of the Manning roughness coefficient
Acknowledgments
We would like to thanks the economical supporting of the Spanish Ministry of Economy in EMULSIONA Project (2011-2014) and the technical help of the Department of Hydraulic Engineering of UPCT (José María Carrillo, Paqui Marco and Luis Castillo) during the air concentration measurements.
References
- Manning, R. On the flow of water in open channels and pipes. Inst. Civ. Eng. Ir. 1891, 20, 161–207. [Google Scholar]
- Hinze, J.O.; Milborn, H. Atomization of liquids by means of a rotating cup. J. Appl. Mech. 1950, 17, 145–153. [Google Scholar] [CrossRef]
- Mateos, C. Aireación y cavitación en obras de desagüe. Curso sobre comportamiento hidráulico de las estructuras de desagües de presa; CEDEX: Madrid, Spain, 1991. [Google Scholar]
- Wood, I.R. Free surface air entrainment on spillways. In Air Entrainment in Free-Surface Flows, 1st ed.; Design Manual Nº 4; IAHR: Rotterdam, The Netherlands, 1991; pp. 55–84. [Google Scholar]
- Chanson, H. Air entrainment in chutes and spillways. In Research Report Nº CE 133; Department of Civil Engineering of Queensland: Brisbane, Australia, 1992. [Google Scholar]
- Jacobs, M.L. Air concentration meter electronics package manual. In Project Notes 8450-98-01; U.S. Department of the Interior Bureau of Reclamation: Denver, CO, USA, 1997. [Google Scholar]
© 2018 by the authors. Licensee MDPI, Basel, Switzerland. This article is an open access article distributed under the terms and conditions of the Creative Commons Attribution (CC BY) license (https://creativecommons.org/licenses/by/4.0/).