Copula Bias Correction for Extreme Precipitation in Reanalysis Data over a Greek Catchment †

 ,
, 

Abstract
:1. Introduction
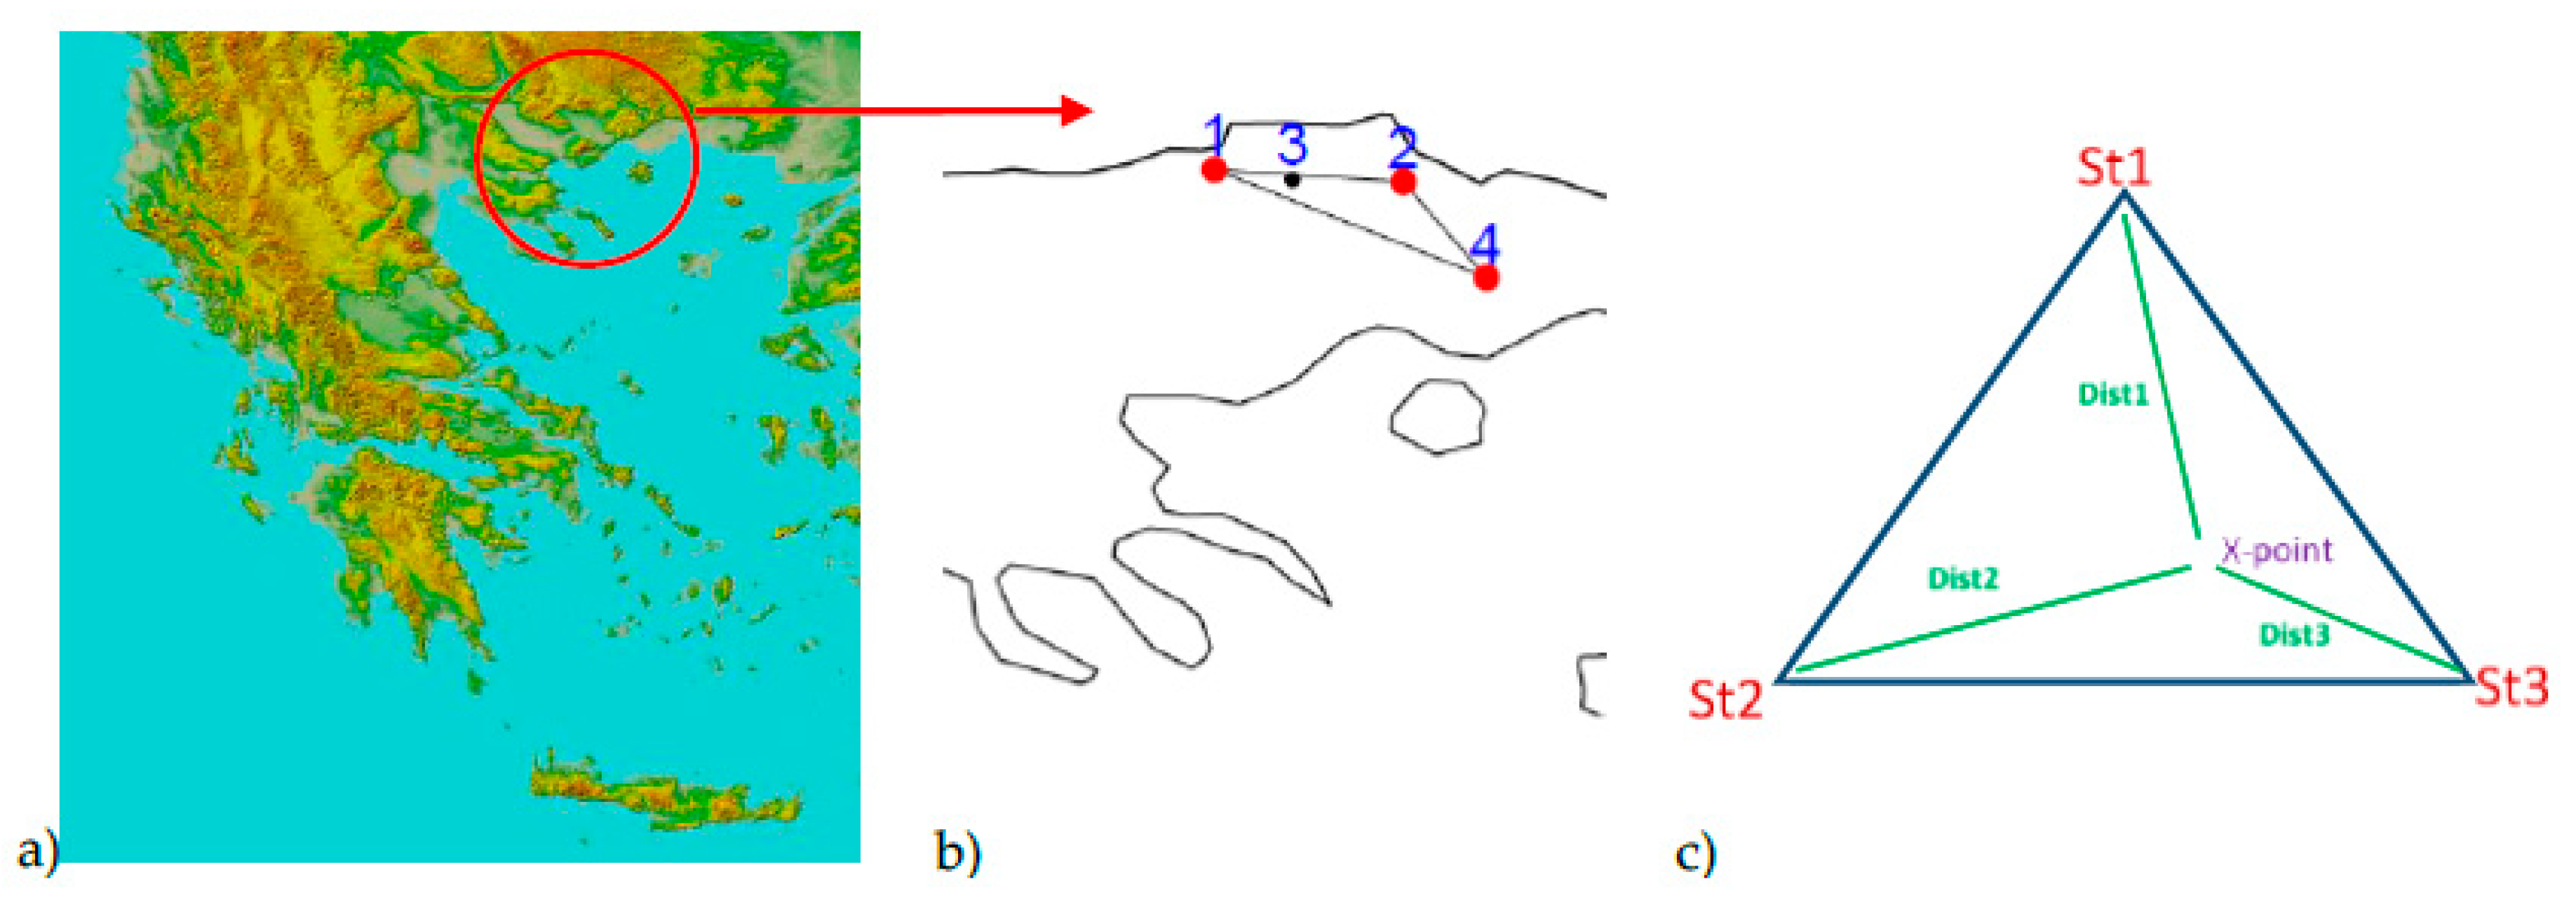
2. Materials and Methods
2.1. Data
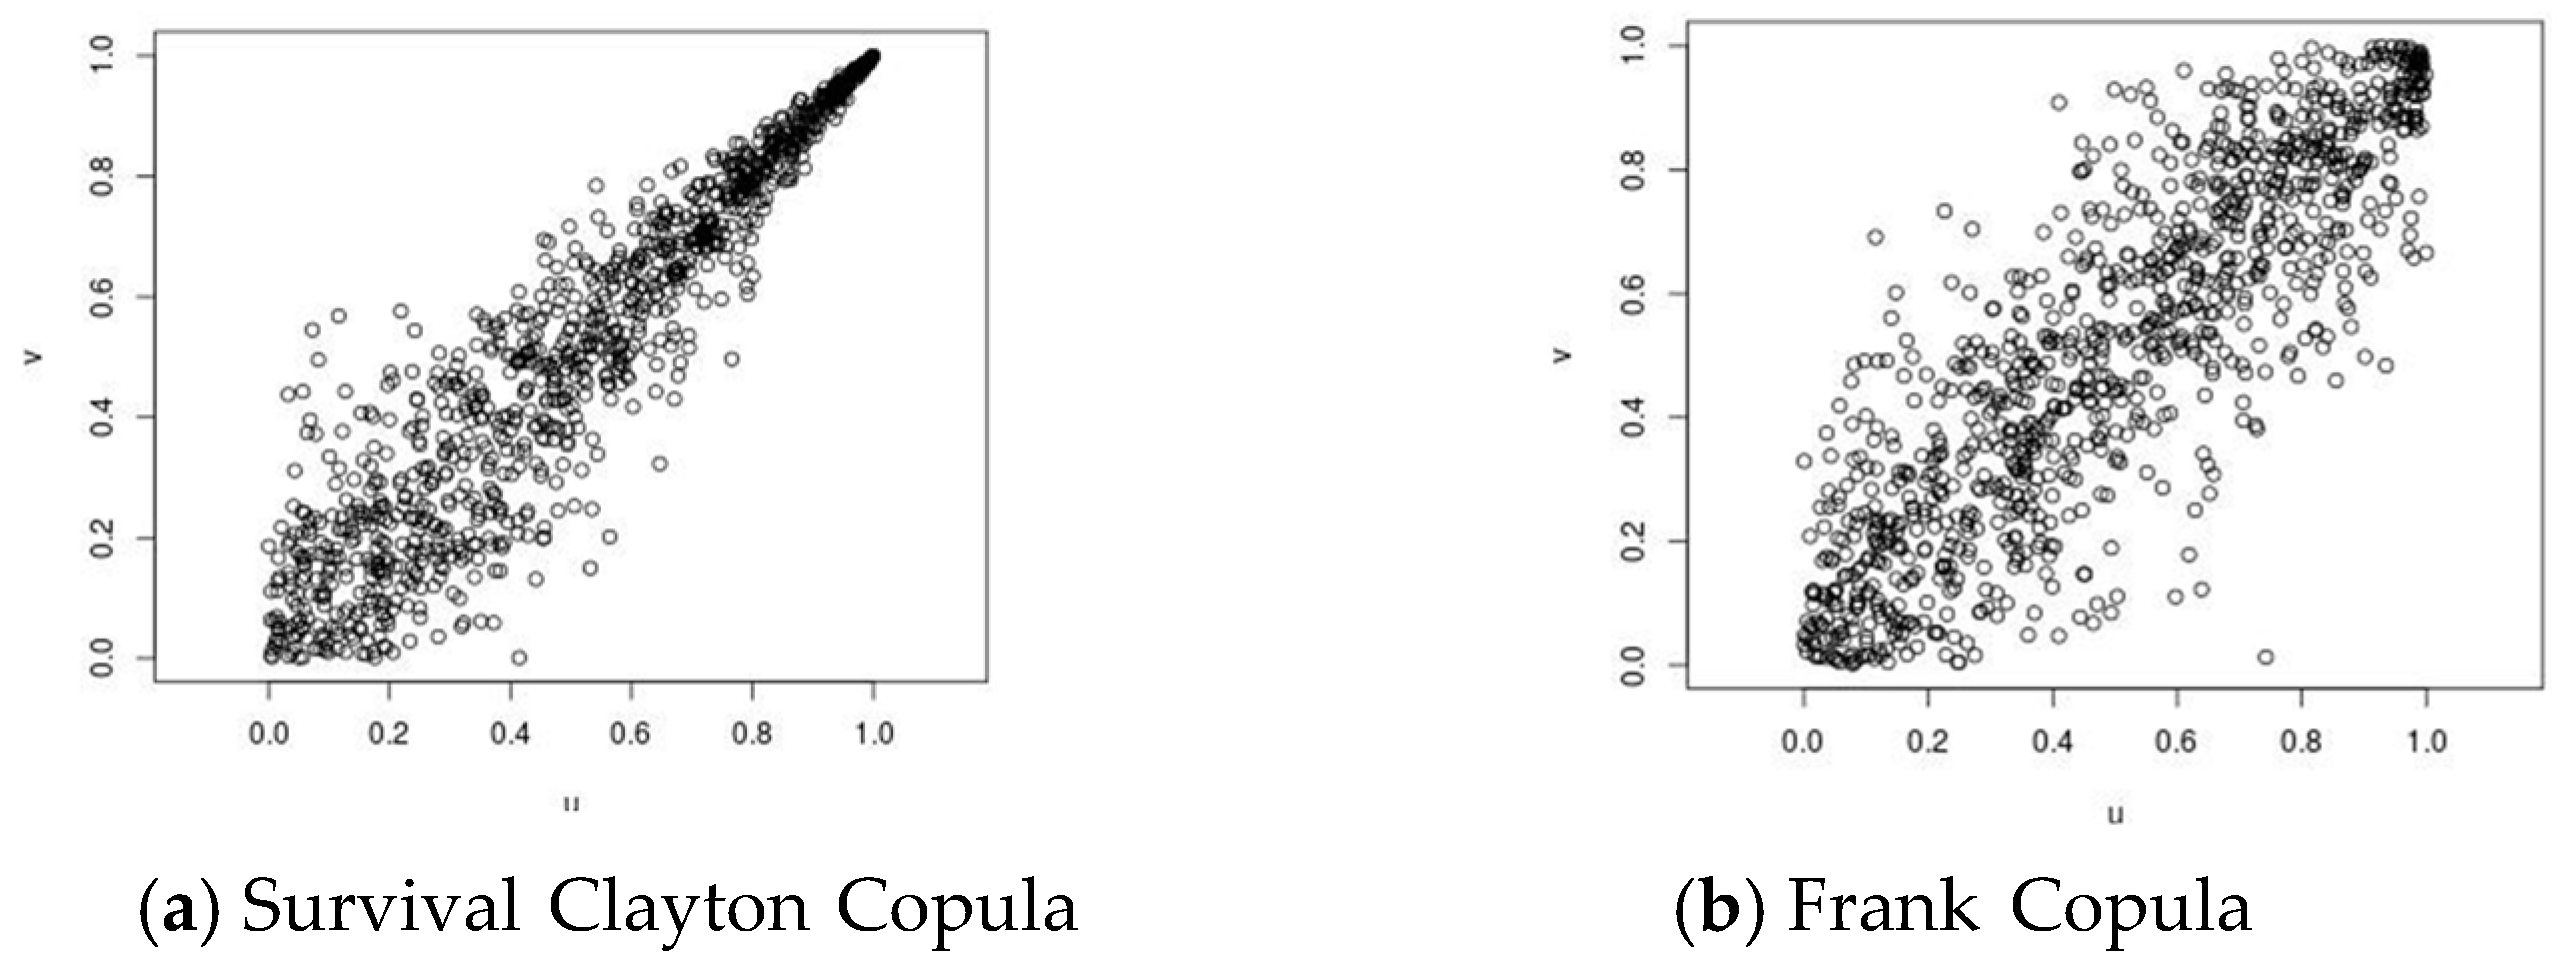
2.2. Methodology
3. Results
3.1. Total and Extreme Precipitation Analysis
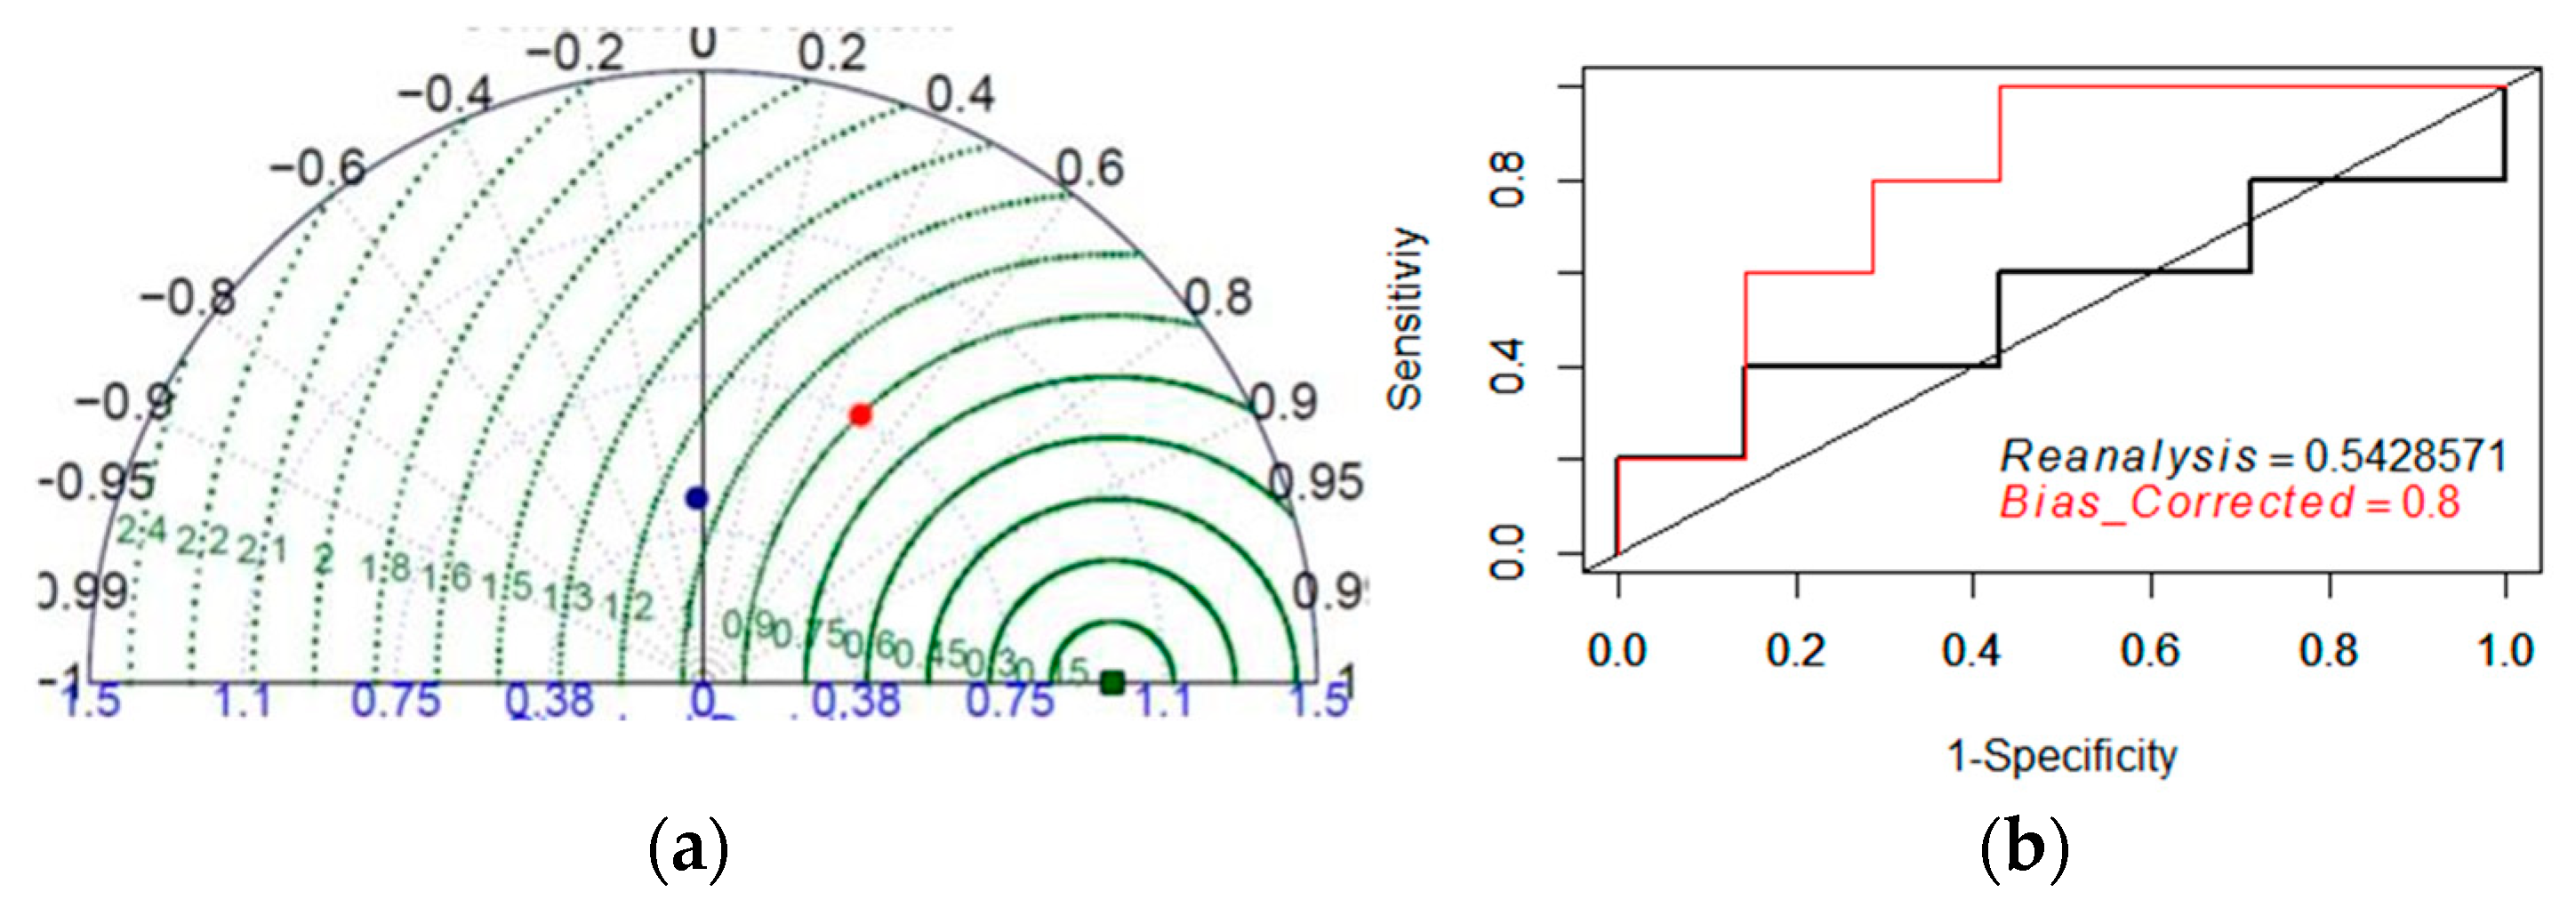
3.2. Bias Correction Results
4. Discussion—Conclusions
Author Contributions
Acknowledgments
Conflicts of Interest
Abbreviations
| ROC | Relative Operating Characteristics curves |
References
- Pachauri, R.K.; Allen, M.R.; Barros, V.R.; Broome, J.; Cramer, W.; Christ, R.; Dubash, N.K. Climate Change 2014: Synthesis Report; Contribution of Working Groups I, II and III to the Fifth Assessment Report of the Intergovernmental Panel on Climate Change (IPCC), Ed.; IPCC: Geneva, Switzerland, 2014. [Google Scholar]
- Mao, G.; Vogl, S.; Laux, P.; Wagner, S.; Kunstmann, H. Stochastic bias correction of dynamically downscaled precipitation fields for Germany through Copula-based integration of gridded observation data. Hydrol. Earth Syst. Sci. 2015, 19, 1787–1806. [Google Scholar] [CrossRef]
- Bastola, S.; Misra, V. Evaluation of dynamically downscaled reanalysis precipitation data for hydrological application. Hydrol. Process. 2014, 28, 1989–2002. [Google Scholar] [CrossRef]
- Gehne, M.; Hamill, T.M.; Kiladis, G.N.; Trenberth, K.E. Comparison of Global Precipitation Estimates across a Range of Temporal and Spatial Scales. J. Clim. 2016, 29, 7773–7795. [Google Scholar] [CrossRef]
- Giacomini, E. Risk Management with Copula. Master’s Thesis, Hulmboldt University, Berlin, Germany, 2005. [Google Scholar]
- Malevergne, Y.; Sornette, D. Testing the Gaussian copula hypothesis for financial assets dependences. Quant. Financ. 2003, 3, 231–250. [Google Scholar] [CrossRef]
- Zhang, L.; Singh, V.P. Bivariate rainfall frequency distributions using Archimedean copulas. J. Hydrol. 2007, 332, 93–109. [Google Scholar] [CrossRef]
- Canela, M.A.; Collazo, E.P. Modelling dependence in Latin American markets using copula functions. J. Emerg. Mark. Financ. 2012, 11, 231–270. [Google Scholar] [CrossRef]
- Shiau, J.T. Fitting drought duration and severity with two-dimensional copulas. Water Resour. Manag. 2006, 20, 795–815. [Google Scholar] [CrossRef]
- Yusof, F.; Hui-Mean, F.; Suhaila, J.; Yusof, Z. Characterisation of drought properties with bivariate copula analysis. Water Resour. Manag. 2013, 27, 4183–4207. [Google Scholar] [CrossRef]
- Mirabbasi, R.; Fakheri-Fard, A.; Dinpashoh, Y. Bivariate drought frequency analysis using the copula method. Theor. Appl. Climatol. 2012, 108, 191–206. [Google Scholar] [CrossRef]
- Fan, L.; Wang, H.; Wang, C.; Lai, W.; Zhao, Y. Exploration of Use of Copulas in Analysing the Relationship between Precipitation and Meteorological Drought in Beijing, China. Adv. Meteorol. 2017. [Google Scholar] [CrossRef]
- Golian, S.; Saghafian, B.; Farokhnia, A. Copula-based interpretation of continuous rainfall–runoff simulations of a watershed in northern Iran. Can. J. Earth Sci. 2012, 49, 681–691. [Google Scholar] [CrossRef]
- Perera, K.; Sumathipala, P.L.N.S.; Wikramanayake, P.N. Interdependence between the Water Levels of Kotte Canal and Kelani River using Copulas. Sri Lankan J. Appl. Stat. 2015, 16, 146. [Google Scholar] [CrossRef]
- Lee, D.T.; Schachter, B.J. Two algorithms for constructing a Delaunay triangulation. Int. J. Comput. Inf. Sci. 1980, 9, 219–242. [Google Scholar] [CrossRef]
- Metz, C.E. ROC methodology in radiologic imaging. Investig. Radiol. 1986, 21, 720–733. [Google Scholar] [CrossRef]
- Nelsen, R.B. An Introduction to Copulas; Springer: New York, NY, USA, 1999. [Google Scholar]
- Sklar, A. Fonctions de Répartition À N Dimensions Et Leurs Marge; Publications de l’Institut de Statistique de L’Universit de Paris: Paris, France, 1959; Volume 8, pp. 229–231. [Google Scholar]
- Akaike, H. Information theory and an extension of the maximum likelihood principle. In Second International Symposium on Information Theory; Springer: New York, NY, USA, 1973; pp. 267–281. [Google Scholar]
- WMO. Available online: https://www.wmo.int/pages/prog/wcp/ccl/opace/opace2/documents/DraftversionoftheGuidelineso ntheDefinitionandMonitoringofExtremeWeatherandClimateEvents.pdf (accessed on 4 April 2016).
- Hanley, J.A.; McNeil, B.J. The meaning and use of the area under a receiver operating characteristic (ROC) curve. Radiology 1982, 143, 29–36. [Google Scholar] [CrossRef]
- Lafon, T.; Dadson, S.; Buys, G.; Prudhomme, C. Bias correction of daily precipi-tation simulated by a regional climate model: A comparison of methods. Int. J. Climatol. 2013, 33, 1367–1381. [Google Scholar] [CrossRef]
- Teutschbein, C.; Seibert, J. Bias correction of regional climate model simulations for hydrological climate-change impact studies: Review and evaluation of different meth-ods. J. Hydrol. 2012, 456–457, 12–29. [Google Scholar] [CrossRef]
- Hay, L.E.; Wilby, R.L.; Leavesley, G.H. A Comparison of Delta Change and Downscaled GCM Scenarios for Three Mountainous Basins in the United States. J. Am. Water Resour. Assoc. 2000, 36, 387–397. [Google Scholar] [CrossRef]
- Schmidli, J.; Frei, C.; Vidale, P.L. Downscaling from GCM precipitation: A bench- mark for dynamical and statistical downscaling methods. Int. J. Climatol. 2006, 26, 679–689. [Google Scholar] [CrossRef]
- Yang, W.; Andréasson, J.; Phil Graham, L.; Olsson, J.; Rosberg, J.; Wetterhall, F. Distribution-based scaling to improve usability of regional climate model projections for hydrological climate change impacts studies. Hydrol. Res. 2010, 41, 211. [Google Scholar] [CrossRef]
- Berg, A.A.; Famiglietti, J.S.; Walker, J.P.; Houser, P.R. Impact of bias correction to reanalysis products on simulations of North American soil moisture and hydrological fluxes. J. Geophys. Res. Atmos. 2003, 108, 4490. [Google Scholar] [CrossRef]
- Piani, C.; Haerter, J.O. Two dimensional bias correction of temperature and precipitation copulas in climate models. Geophys. Res. Lett. 2012, 39. [Google Scholar] [CrossRef]
- Pierce, D.W.; Cayan, D.R.; Maurer, E.P.; Abatzoglou, J.T.; Hegewisch, K.C. Improved Bias Correction Techniques for Hydrological Simulations of Climate Change. J. Hydrometeorol. 2015, 16, 2421–2442. [Google Scholar] [CrossRef]


| 90% | 95% | 99% | |
|---|---|---|---|
| Observations | 32.5 | 48 | 67 |
| Reanalysis | 26.3 | 31.5 | 37.4 |
| Bias Corrected | 36.3 | 42.5 | 49 |
© 2018 by the authors. Licensee MDPI, Basel, Switzerland. This article is an open access article distributed under the terms and conditions of the Creative Commons Attribution (CC BY) license (https://creativecommons.org/licenses/by/4.0/).
Share and Cite
Lazoglou, G.; Anagnostopoulou, C.; Skoulikaris, C.; Tolika, K. Copula Bias Correction for Extreme Precipitation in Reanalysis Data over a Greek Catchment. Proceedings 2019, 7, 4. https://doi.org/10.3390/ECWS-3-05817
Lazoglou G, Anagnostopoulou C, Skoulikaris C, Tolika K. Copula Bias Correction for Extreme Precipitation in Reanalysis Data over a Greek Catchment. Proceedings. 2019; 7(1):4. https://doi.org/10.3390/ECWS-3-05817
Chicago/Turabian StyleLazoglou, Georgia, Christina Anagnostopoulou, Charalampos Skoulikaris, and Konstantia Tolika. 2019. "Copula Bias Correction for Extreme Precipitation in Reanalysis Data over a Greek Catchment" Proceedings 7, no. 1: 4. https://doi.org/10.3390/ECWS-3-05817
APA StyleLazoglou, G., Anagnostopoulou, C., Skoulikaris, C., & Tolika, K. (2019). Copula Bias Correction for Extreme Precipitation in Reanalysis Data over a Greek Catchment. Proceedings, 7(1), 4. https://doi.org/10.3390/ECWS-3-05817