Abstract
The Fifth Assessment Report (AR5) of the Intergovernmental Panel on Climate Change (IPCC) of the United Nations mentions that extreme rainfalls might increase their intensity and frequency in most mid-latitude locations and tropical regions by the end of this century, as a consequence of the rise of the average global surface temperature. Human action has given way to global warming wich manifests with an increase in extreme rainfall. If these climatic conditions are added to the waterproofing that cities have been experiencing as a result of urban development, a scenario of growing concern for the managers of drainage systems is generated. The objective of drainage networks is preventing the accumulation of rainwater on the surface. Under the new conditions of climate change, these need to be modified and adapted to provide cities with the security they demand.The following article describes a method for flood control by using a rehabilitation model that connects the SWMM 5 model with a genetic algorithm to find the best solutions to the flood problem.. The final analysis is performed using the Pareto efficiency criteria. The innovation of this method is the inclusion of a local head loss in the drainage network, allowing the upstream flow to be retained by decreasing the downstream concentration time. These elements called hydraulic controls improve system performance and are installed in the initial part of some pipes coming out of storm tanks. As a case study, the developed method has been applied in a section of the drainage network of the city of Bogotá.
PACS:
J0101
1. Introduction
In recent years, extreme rains have increased their frequency. As a result, the drainage system experiences a hydraulic overload that can generate flooding. The effective intervention in these networks is important to give security to the cities. This is a task that researchers must consider.
Runoff control at source to prevent flooding is a field of study of great interest in urban hydraulics. One of the first investigations to retain runoff was carried out by Curtis and McCuen [1] who proposed a method to design retention basins emphasizing the importance of their location, the particle size distributions of sediments, the depth of the basin, the initial storage, and orifice diameter. Following this line of research, Goulter and Morgan [2] developed an optimization model based on dynamic programming to determine the minimum size and the best location of retention basins. In a later work, Bennett and Mays [3] propose a new optimization model that determines the minimum cost of a detention basin and the drainage channel system for a basin.
On the other hand, the use of storm tanks (ST) in an urban areas to reduce the risk of flooding has been studied and proven as one of the most efficient methods to reduce surface runoff [4,5,6,7,8]. Cunha et al. [9] presented a method for the location and dimensions of STs and the outlet orifice. Using simulated anneling in their work, these authors mentioned the importance of a good dimensioning of the orifice, because this reduces the outflow of the storage unit that regulates the descending flows, allows a control of flow and a reduction of floods in all the network. Dziopak [10] proposes the use of the sewerage network as a storage unit as an economic alternative to the installation of STs taking advantage of all its components to temporarily store the water. For this purpose designs a retention channel with interior partitions in the form of cameras with an opening at the bottom of the channel, transforming the network into a retention channel. Leitão et al. [11] presented a model that uses an algorithm for the location of flow control devices in the drainage network, in order to maximize storage inside the network. The model also considers the potential failure impact of the flow control device. They conclude that the storage capacity in the networks can be considerable. They mention that, if local flow control devices are installed correctly, the volume of water can be mobilized and become an interesting solution to mitigate flooding.
Ngamalieu-Nengoue et al. [12] conclude that the combined action of installing ST and the renewal of pipes is more effective than the separate intervention of these two techniques. In the results of their study in which they use a pseudo genetic algorithm; they obtain an optimized diameter smaller than the original in certain pipes just downstream of the storage units. So they point out the need to include a gate or orifice as a hydraulic control to introduce a head loss in the system. These results determine that hydraulic controls are presented as a technique to improve the efficiency of the system by allowing the accumulation of water at certain points in the network, which decreases the concentration time downstream and, therefore, floods. To continue with this line of research, the methodology proposed in this work includes the use of hydraulic control in the optimization of drainage networks. The focus of this study is to reduce the cost of rehabilitation of drainage networks and provide resilience to cities in climate change scenarios. Under these parameters it is necessary to define two cost functions: one associated with the investment cost to improve the network (tank installation, pipe replacement) and on the other hand the cost of the damage that flooding can cause. To solve this problem, the optimization model considers using a multi-objective algorithm NSGA-II [13] connected to the SWMM hydraulic simulation model using a toolkit [14]. These results have the purpose of helping to the network managers make decisions to face the serious flood problem. As a case study, this methodology is applied in a sector of the drainage network of the city of Bogotá.
2. Methodology
The main objective of this work is to present a methodology to find the best solutions to adapt the drainage networks of cities to the conditions of climate change. Through a multi-objective algorithm as an optimization engine and the SWMM model as a hydraulic analysis tool. In this way, the following hypotheses are contemplated for their solution:
- The design storm is considered static for the entire network.
- The mathematical simulation model SWMM [15] is used as a network analysis tool. Dynamic wave analysis using the complete Saint-Venant equations is used.
- The mathematical model of the network must be calibrated and simplified without this decreasing the reliability in the results.
- The actions that will be taken are the renewal of pipes with others of greater diameter, the installation of STs and the installation of hydraulic controls. Changes in the morphology of the network are out of this work.
- The STs are considered installed on-line. The invert elevation is also considered the same of the existing manhole.
- The optimization problem is analyzed in terms of costs. The cost function must be established based on the hydraulic variables and includes the cost of pipe renewal, the cost of installation of ST and the cost of damage caused by flooding.
- The flood damage cost function does not consider intangible damage.
2.1. Decision Variables
The optimization problem of a drainage network considers three types of decision variables (DV). On the one hand, the optimization model seeks the best combination of network diameters of the pipes to minimize flooding in the network. This decision variable can vary from a value of 0 (the pipe is not replaced) to a maximum set value. The value 0 implies that the capacity of the pipe is enough to transport the analyzed flow rate while a different value indicates the need to increase the capacity of the pipe.
Another type of decision variables is the storage capacity of the nodes. The optimization model search the best location of STs in the network and the lowest volume of STs to reduce flooding. When considering the problem in an urban areas, the excavation is limited to the current invert elevation of the manhole, defining the cross section of the ST as DV. The DV can take values of 0 (ST is not required in the node) up to a maximum value previously defined depending on the available area. Since a heuristic optimization model is used, a discretization of the area is necessary. For this reason, a value is defined that divides the maximum area available for each node into a number of equal parts. The SWMM model [15] defines the cross section of an ST by the following expression (1):
where AS, BS and CS are adjustment coefficients of the tank section and z is the maximum water level of the node. For tanks of constant section, the coefficient A represents the cross section while the coefficients B and C are null.
Finally, another type of DV is the head loss coefficient introduced in certain network pipes. The use of hydraulic controls has been mentioned in previous works as a tool to limit the flow of water [10,11,12,16,17] retaining the upstream flow, which causes the water concentration time below to be smaller, reducing flooding. In this work the inclusion of a minor head loss that is installed in the initial part of the pipes that come out of STs will be used as hydraulic control. A minor head loss is caused by a rapid change in magnitude or direction of velocity, which may appear in curves, contractions or extensions in the geometry of the pipe.
Local losses are represented as the product of a local loss coefficient and speed head, by the expression (2):
The orifices are elements that are used as hydraulic control. The head losses can be determined by the expression (3):
where Cd is a dimensionaless orifice discharge coefficient and Do is the orifice diameter. The proposed optimization model locates pipes that require hydraulic control to retain water and prevent flooding. This objective is achieved when the ST and the hydraulic control work together so that the location of the latter will be in the outlet pipe of certain STs. These DVs can take values from 0 (no hydraulic control is required) to a previously defined maximum value.
2.2. Objective Function
The objective function to be optimized is established in monetary units, it consists of three functions, as defined by Iglesias et al. [18] is by the expression (4):
where the first term in the equation represents the cost of pipeline renovation, the second term represents the cost of ST installation and the third term represents the cost of damage caused by flooding. The terms are affected by a coefficient λi in case it is required to prioritize or minimize a term with respect to the others.
2.2.1. Pipe Replacement Cost Functions
This function, presented in the expression (5), represents the cost of changing pipes for others of greater capacity. The function is a polynomial of the second degree and is expressed as a function of the diameter. To establish this function, the market price of the pipes has been related to the corresponding diameter. The α and β coefficients are specific adjustment coefficients for each project.
2.2.2. Storm Tank Installation Cost Functions
This function represents the cost of installing ST on the network. The expression has been set based on storage volume. The first term of the function represents a minimum cost established for the ST while the second term is variable based on the required storage volume affected by a constant V and an exponent C. The function is presented by the expression (6):
2.2.3. Flood Damage Cost functions
This function represents the cost of damage caused by the flood. Iglesias et al. [18] based on previous studies [19] express this cost based on the depth that water reaches in a flood event. The expression is determined by a vulnerability curve that establishes the percentage of damage based on the level of water reached. The authors crossed this curve with the costs of flooding per square meter for different land uses. The equation shows the maximum cost Cmax when the flood level ymax previously defined is reached. Coefficients λ and b are adjustment coefficients. The function is presented by the expression (7):
3. Case Study
The methodology was applied to a sector of the drainage network of the city of Bogotá, Colombia (Figure 1). This network called E-Chico consists of 35 hydrological sub-basins that cover an area of 51 hectares, 35 conduits and 35 connection nodes. All pipes are circular with diameters ranging from 300 mm to 1400 mm, and they cover a length of approximately 5000 m. The network is completely gravity operated with a difference between the highest point and the lowest point of 39 m.
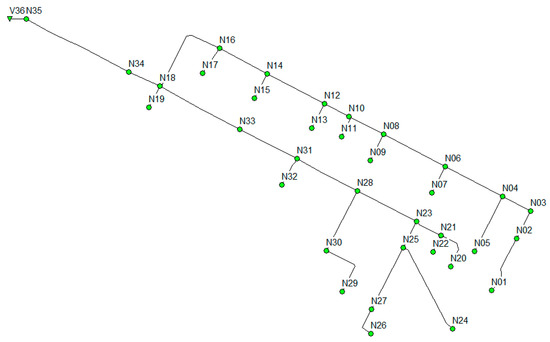
Figure 1.
Representation of E-Chico drainage network.
For the analysis, a design storm was used based on an Intensity-Duration-Frequency curve previously defined by Ngamalieu-Nengoue et al. [12] calculated using the alternate block method with 5 min intervals (Figure 2). The design storm was calculated under a climate change scenario [20].
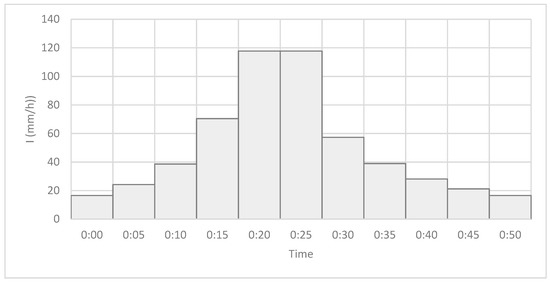
Figure 2.
Design storm in the case study.
The cost functions used in this work have been defined by Ngamalieu-Nengoue et al. [12]. The pipe replacement cost function is defined based on the actual prices of pipes in Colombia. The coefficients α and β of Equation (5) are established with the following values α = 40.69 and β = 208.06. Therefore, the function is defined by the expression (8):
The coefficients A, B and C of storm tank installation cost functions are determined based on the cost of materials and construction cost of the area under study. According to this, the function is defined by the expression (9):
For this work, the maximum flood level is set at 1.4 m. The coefficients λ and b were determined in previous studies and the values that best fit the analysis were λ = 4.89 and b = 2. While the maximum cost per square meter is the average for different types of land uses that establish this value at 1268 [12]. The function of flood damage is defined by the expression (10):
As a first step in the optimization process, it is required to know the current state of the drainage network. The hydraulic analysis in the SWMM model delivers the results shown in Table 1. These results show that the network does not offer the guarantees of operation to give security to the city, so it must be rehabilitated. For the present work, a scenario has been considered where the following decision variables are included: 35C + 35ST + 35HC. In other words, the 35 nodes can be considered to install STs (35ST), the 35 conduits can be changed (35C), and hydraulic controls can be installed at the exit of the 35 ST (35HC).

Table 1.
Data of flooded nodes in the current state.
4. Results
In previous work [12] the optimization of E-chico drainage network was made with a pseudo genetic algorithm considering the replacement of pipes and the installation of STs. The authors considered 5 different scenarios. Scenario 5 offers the best solution and considers the installation of 3 STs and the change of 3 pipes. For this solution, the objective function has a value of 213,981 €. Table 2 shows the results obtained. For this work, series of 50 simulations were performed to different combinations of parameters. The analysis was also performed using a pseudo genetic algorithm. Figure 3 represents the results of the best solution found. The installation of 3 STs on nodes N4, N10 and N23 is required. The renewal of the T02 and T03 pipes is also required, The renewal of pipes 2 and 3 are necessary, with an increase in diameters from 0.40 m to 0.45 m in both cases. Finally, the installation of hydraulic controls on the T04 and T10 pipes is required. The hydraulic controls must generate head losses with a value of 170.
Table 2.
Result summary of the E Chico Optimization Process.
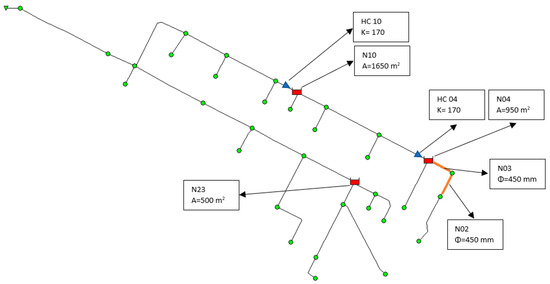
Figure 3.
Representation of STs and HC installed and pipes to replace according to results of the optimization model.
Table 2 shows the results obtained in economic terms. The cost of implementing STs is 188,957.79 €, the cost of pipe renovation is 11,130.70 € while the cost of damage caused by flooding is 9061.91 €. The value of the objective function is set at 209,150.40 €. The results show an improvement in the objective function with respect to the best solution obtained in previous studies.
Moreover, Figure 4 show a Pareto front that represents the results of multi-objective optimization obtained by Ngamalieu-Nengoue et al. [17] and the results obtained in a multi-objetive optimization using a NSGA-II with hydraulic controls. It is observed that the Pareto front improves significantly compared to previous studies, even when the flood is removed from the system. It should be noted that for the zero investment costs, the hydraulic control allow to reducing the flooding costs almost to the half (from 5,236,200€ to 2,701,858€). This demonstrates the convenience of including hydraulic controls in the optimization model.
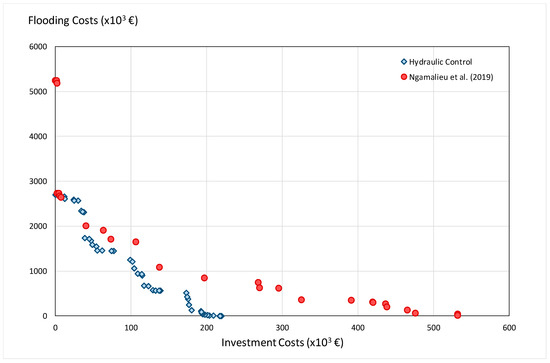
Figure 4.
Pareto front representation of previous results and results with the inclusion of hydraulic controls.
5. Conclusions
After presenting the methodology and applying it to a specific case study, you can draw the following conclusions:
- The combined use of replacement pipes, the installation of pipes and hydraulic controls is an appropriate methodology for optimizing drainage networks that require rehabilitation. The use of multi-objective evolutionary algorithms proves to be valid for this type of analysis.
- The main conclusion of this work is that the use of CH significantly decreases the cost of the intervention in the drainage network because it retains the water upstream using the volume of the network to momentarily store the water, making the system more efficient and avoiding accumulation downstream, avoiding flooding.
In short, this study shows that the inclusion of hydraulic controls improves the efficiency of the rehabilitation model of drainage networks.
Author Contributions
All authors contributed extensively to the work presented in this paper. All authors have read and agreed to the published version of the manuscript.
Conflicts of Interest
The authors declare no conflict of interest.
Abbreviations
The following abbreviations are used in this manuscript:
| MDPI | Multidisciplinary Digital Publishing Institute |
| DOAJ | Directory of open access journals |
| AR5 | Fifth Assessment Report |
| ICCP | Intergovernmental Panel on Climate Change |
| ST | Storm Tank |
| DV | Decision variable |
| HC | Hydraulic control |
| IDF | Intensity, Duration, Frequency |
| NSGA | Non-dominated sorting genetic algorithm |
| SWMM | Storm Water Management Model |
References
- Curtis, D.C.; McCuen, R.H. Design efficiencies of stormwater detention basins. J. Water Resour. Plan. Manag. Div ASCE 1977, 103, 125–140. [Google Scholar] [CrossRef]
- Goulter, I.C.; Morgan, D.R. Model for optimal size and location of detention. J. Water Resour. Plan. Manag. 1984, 110, 119–122. [Google Scholar] [CrossRef]
- Bennett, M.S.; Mays, L.W. Optimal design of detention and drainage channel systems. J. Water Resour. Plan. Manag. 1995, 111, 99–112. [Google Scholar] [CrossRef]
- Kessler, A.; Diskin, M.H. The efficiency function of detention reservoirs in urban drainage systems. Water Resour. Res. 1991, 27, 253–258. [Google Scholar] [CrossRef]
- Woods, B.B.; Kellagher, R.; Martin, P.; Jefferies, C.; Bray, R.; Shaffer, P. The SUDS Manual (C697); CIRIA: London, UK, 2007; p. 600. [Google Scholar]
- Todeschini, S.; Papiri, S.; Ciaponi, C. Performance of stormwater detention tanks for urban drainage systems in northern Italy. J. Environ. Manag. 2012, 101, 33–45. [Google Scholar] [CrossRef] [PubMed]
- Andrés-Doménech, I.; Montanari, A.; Marco, J.B. Efficiency of storm detention tanks for urban drainage systems under climate variability. J. Water Resour. Plan. Manag. 2012, 138, 36–46. [Google Scholar] [CrossRef]
- Wang, M.; Sun, Y.; Sweetapple, C. Optimization of storage tank locations in an urban stormwater drainage system using a two-stage approach. J. Environ. Manag. 2017, 204, 31–38. [Google Scholar] [CrossRef] [PubMed]
- Cunha, M.C.; Zeferino, J.A.; Simões, N.E.; Santos, G.L.; Saldarriaga, J.G. A decision support model for the optimal siting and sizing of storage units in stormwater drainage systems. Int. J. Sustain. Dev. Plan. 2017, 12, 122–132. [Google Scholar] [CrossRef]
- Dziopak, J. A wastewater retention canal as a sewage network and accumulation reservoir. In Proceedings of the E3S Web of Conferences, Polanica-Zdrój, Poland, 16–18 April 2018; Volume 45, p. 00016. [Google Scholar]
- Leitão, J.P.; Carbajal, J.P.; Rieckermann, J.; Simões, N.E.; Marques, A.S.; de Sousa, L.M. Identifying the best locations to install flow control devices in sewer networks to enable in-sewer storage. J. Hydrol. 2018, 556, 371–383. [Google Scholar] [CrossRef]
- Ngamalieu-Nengoue, U.A.; Iglesias-Rey, P.L.; Martínez-Solano, F.J.; Mora-Meliá, D.; Valderrama, J.G.S. Urban drainage network rehabilitation considering storm tank installation and pipe substitution. Water (Switzerland) 2019, 11, 515. [Google Scholar] [CrossRef]
- Deb, K.; Pratap, A.; Agarwal, S.; Meyarivan, T. A fast and elitist multiobjective genetic algorithm: NSGA-II. IEEE Trans. Evol. Comput. 2002, 6, 182–197. [Google Scholar] [CrossRef]
- Martínez-Solano, F.J.; Iglesias-Rey, P.L.; Saldarriaga, J.G.; Vallejo, D. Creation of an SWMM toolkit for its application in urban drainage networks optimization. Water (Switzerland) 2016, 8, 259. [Google Scholar] [CrossRef]
- Rossman, L.A. “Storm Water Management Model User’s Manual.” Version 5.0; Cincinnati: National Risk Management Research Laboratory, Office of Research and Development, US Environmental Protection Agency: Cincinnati, OH, USA, 2010. [Google Scholar]
- Cunha, M.C.; Zeferino, J.A.; Simões, N.E.; Saldarriaga, J.G. Optimal location and sizing of storage units in a drainage system. Environ. Model. Softw. 2016, 83, 155–166. [Google Scholar] [CrossRef]
- Ngamalieu-Nengoue, U.A.; Martínez-Solano, F.J.; Iglesias-Rey, P.L.; Mora-Meliá, D. Multi-objective optimization for urban drainage or sewer networks rehabilitation through pipes substitution and storage tanks installation. Water (Switzerland) 2019, 11, 935. [Google Scholar] [CrossRef]
- Iglesias-Rey, P.L.; Martínez-Solano, F.J.; Saldarriaga, J.G.; Navarro-Planas, V.R. Pseudo-genetic Model Optimization for Rehabilitation of Urban Storm-water Drainage Networks. Procedia Eng. 2017, 186, 617–625. [Google Scholar] [CrossRef]
- Lee, E.H.; Kim, J.H. Development of resilience index based on flooding damage in urban areas. Water (Switzerland) 2017, 9, 69. [Google Scholar] [CrossRef]
- Gulizia, C.; Camilloni, I. Comparative analysis of the ability of a set of CMIP3 and CMIP5 global climate models to represent precipitation in South America. Int. J. Climatol. 2015, 35, 583–595. [Google Scholar] [CrossRef]
Publisher’s Note: MDPI stays neutral with regard to jurisdictional claims in published maps and institutional affiliations. |
© 2019 by the authors. Licensee MDPI, Basel, Switzerland. This article is an open access article distributed under the terms and conditions of the Creative Commons Attribution (CC BY) license (https://creativecommons.org/licenses/by/4.0/).