Abstract
In this work we demonstrate that the 805M1 single axis analogue output accelerometer can be used to monitor honey bee activity and requires only a low-cost microcontroller with an audio shield to log the data. We present accelerometer output signals demonstrating the ability to capture individual honey bee ‘whooping’ signals as well as long-term amplitude monitoring, indicating the brood cycle, using this affordable measurement system.
1. Introduction
There is currently concern over the decline in honey bee colonies as they provide a significant proportion of the pollination required for many food crops [1,2,3]. The use of sensor technology for monitoring managed honey bee colonies is growing in popularity and it is of interest to develop new methods which can more accurately and less invasively assess honey bee colony status [4]. The use of accelerometers to obtain information on the state of honeybee colonies has several advantages over sound recorded by microphones, in that: (1) accelerometers can reside in a honeybee hive for several years with a negligible effect of propolis coating; (2) they are particularly good at monitoring the low-frequency signals which form a large part of the honeybee communication processes; and (3) they sense a physical property, the vibration, that is probably far more relevant to them than sounds. One example of accelerometers allowing the observation of specific vibrational communication signals has been reported for the ‘whooping signal’ [5]. The vibrational amplitude is also dependent on the local environment/substrate and this has been demonstrated to be a strong indicator of an active queen [6]. Accelerometer data has also shown promise for the prediction of swarming [7]. These previous reports have used ultra-high performance accelerometers (Brüel and Kjær, 4507) which also require separate signal conditioning electronics before the vibrational data can be logged; this represents a very expensive arrangement that precludes wide deployment. In this work we demonstrate that the 805M1 single axis analogue output accelerometer, which incorporates a piezo-ceramic crystal with low power electronics in a shielded housing, can be used to monitor honey bee activity and requires only a low-cost microcontroller with an audio shield to log the data. We present high quality accelerometer output signals for both individual bee pulses and long-term amplitude monitoring using this affordable measurement system.
2. Materials and Methods
The 805M1 is a single axis analogue output accelerometer that incorporates a piezo-ceramic crystal with low power electronics in a shielded housing that is suitable for embedded applications [8]. The model used was the 805M1-0020 which operates over ±20 g range, with a ±1 dB bandwidth from 1 to 8000 Hz, and typically produces an output voltage of 100 mV/g. Typically they draw less than 0.8 mA in a simple 3 wire system of ground, excitation voltage (3.0 V to 5.5 V dc) and signal output. The hermetically sealed enclosure allows for an operating temperature range of −40 °C to +100 °C and for quantities of 10 or more the cost is around UK£65. These were embedded in the wax of the central combs of three bee hives and covered with a little melted wax. The wire trailed out of the brood box into the waterproof enclosure on the side of the hive containing the data logger as shown in Figure 1. All three systems were powered from a single leisure battery connected to a solar panel and associated controller.
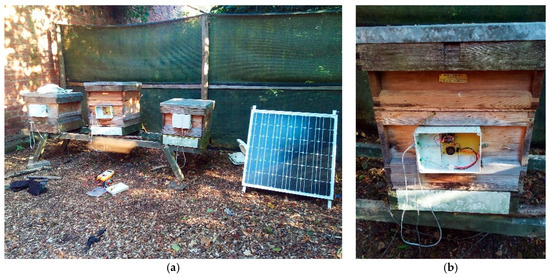
Figure 1.
(a) Three hives monitored at the Nottinghamshire Beekeepers Association teaching apiary showing the solar panel (leisure battery behind). (b) Teensy based data logger installed on the side of one of the hives with the cable to the 805M1 accelerometer passing into the brood box.
The data logger, shown in Figure 2, was based on the Teensy 3.2 microcontroller [9] using the associated audio shield [10]. The audio data format was 16 bit mono sampled at 44.1 kHz and saved as a .raw file. Code for this aspect was generated by the Teensy audio system design tool [11]. Using the command “sgtl5000_1.lineInLevel” (15), the sensitivity to the line input was set to 15 which represents the most sensitive range of 0.24 Vpp. The system recorded five minutes of audio data, twice a day, to the microSD card on the audio shield using the “Alarm.alarmRepeat” function and created a file name based on the EPOCH time. Note that this is a ten-digit number, but the first two digits will remain the same for several years so these were left off the file name to leave an eight- character file name that identified the day and time of the recording. The typical current draw for the Teensy and audio shield was, on average, less than 100 mA. No attempt was made to optimize the code for minimal power consumption.
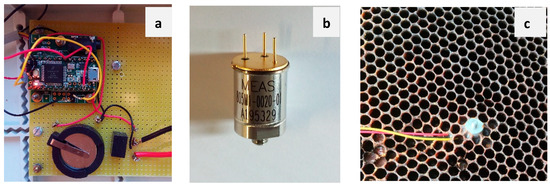
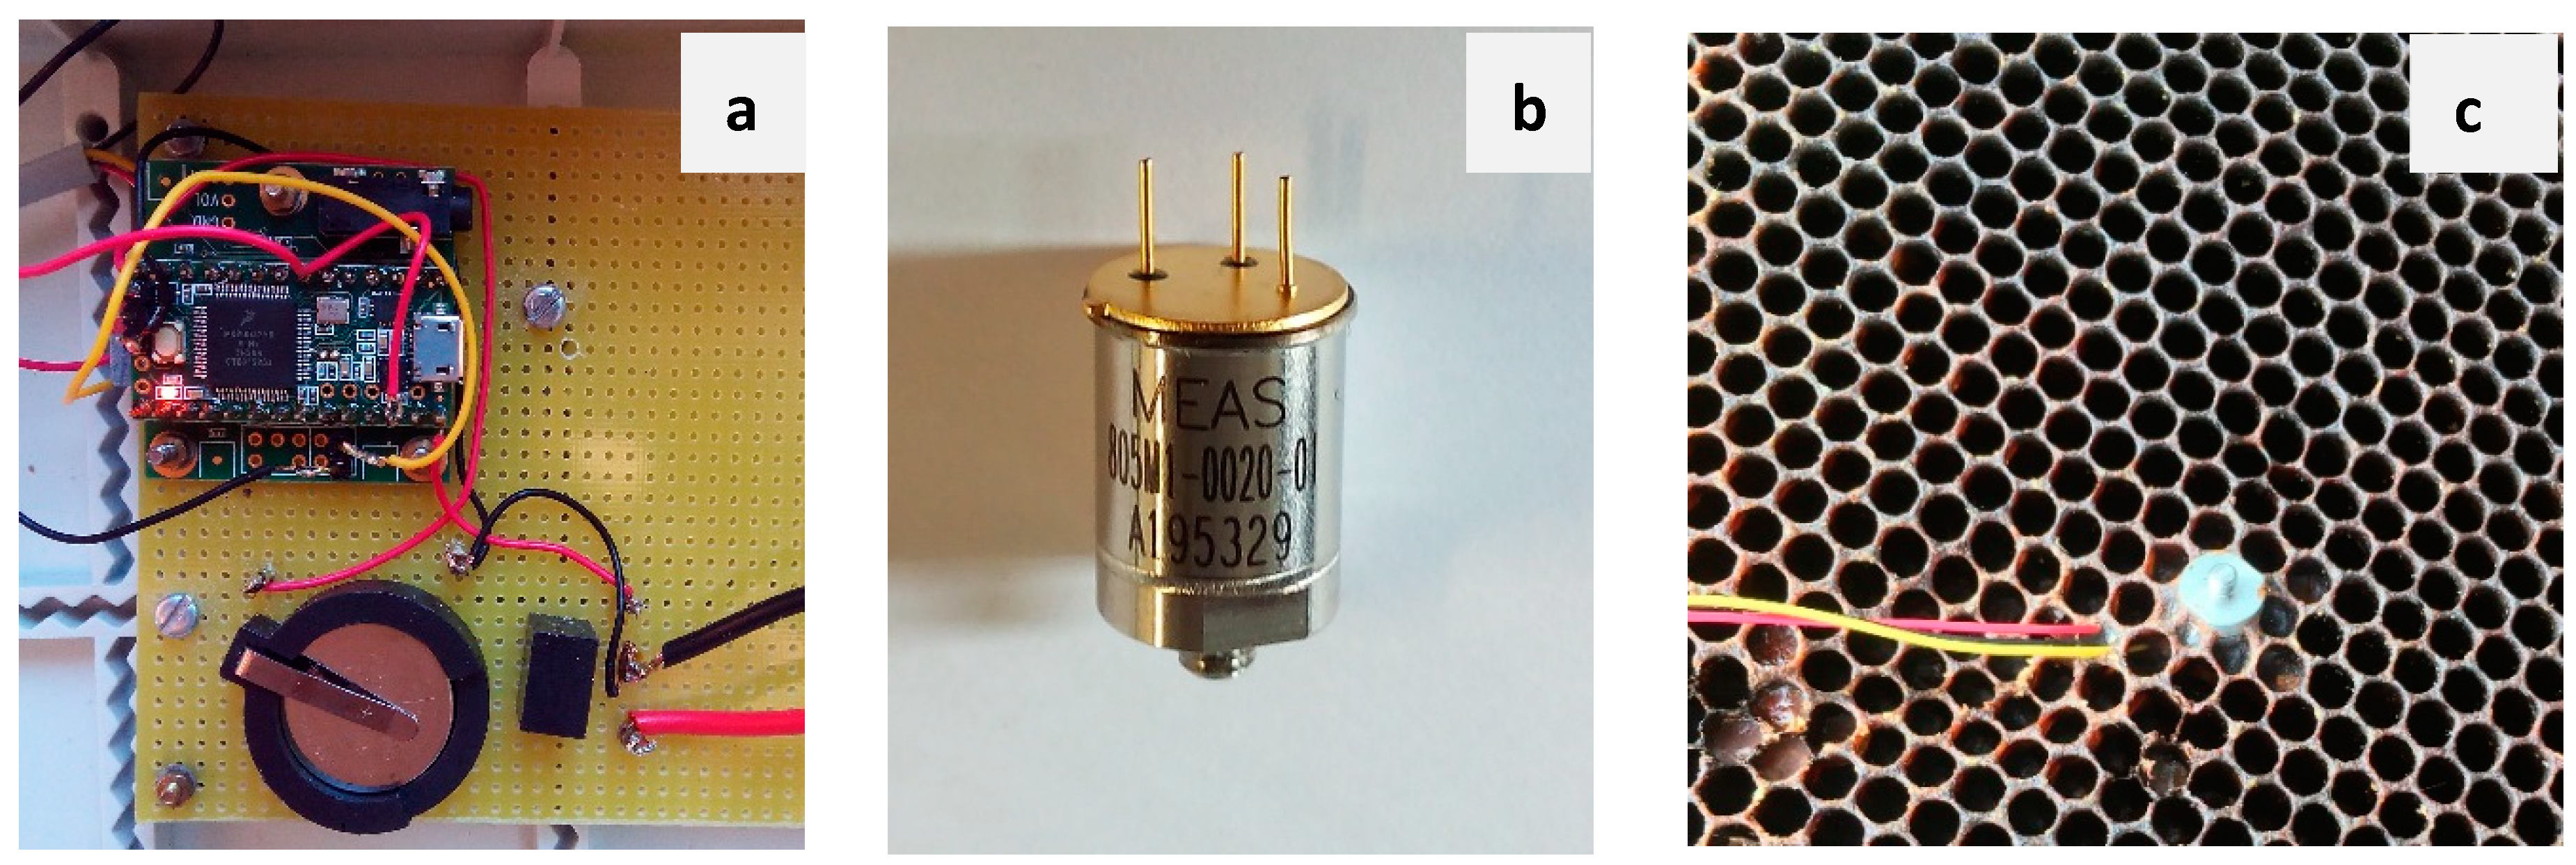
Figure 2.
(a) The Teensy audio shield with the Teensy 3.2 mounted on top, below are the real time clock battery and voltage regulator; (b) 805M1-0020-01 accelerometer as installed in the central frame of the brood box; (c) An 805M1 accelerometer 12 months after installation.
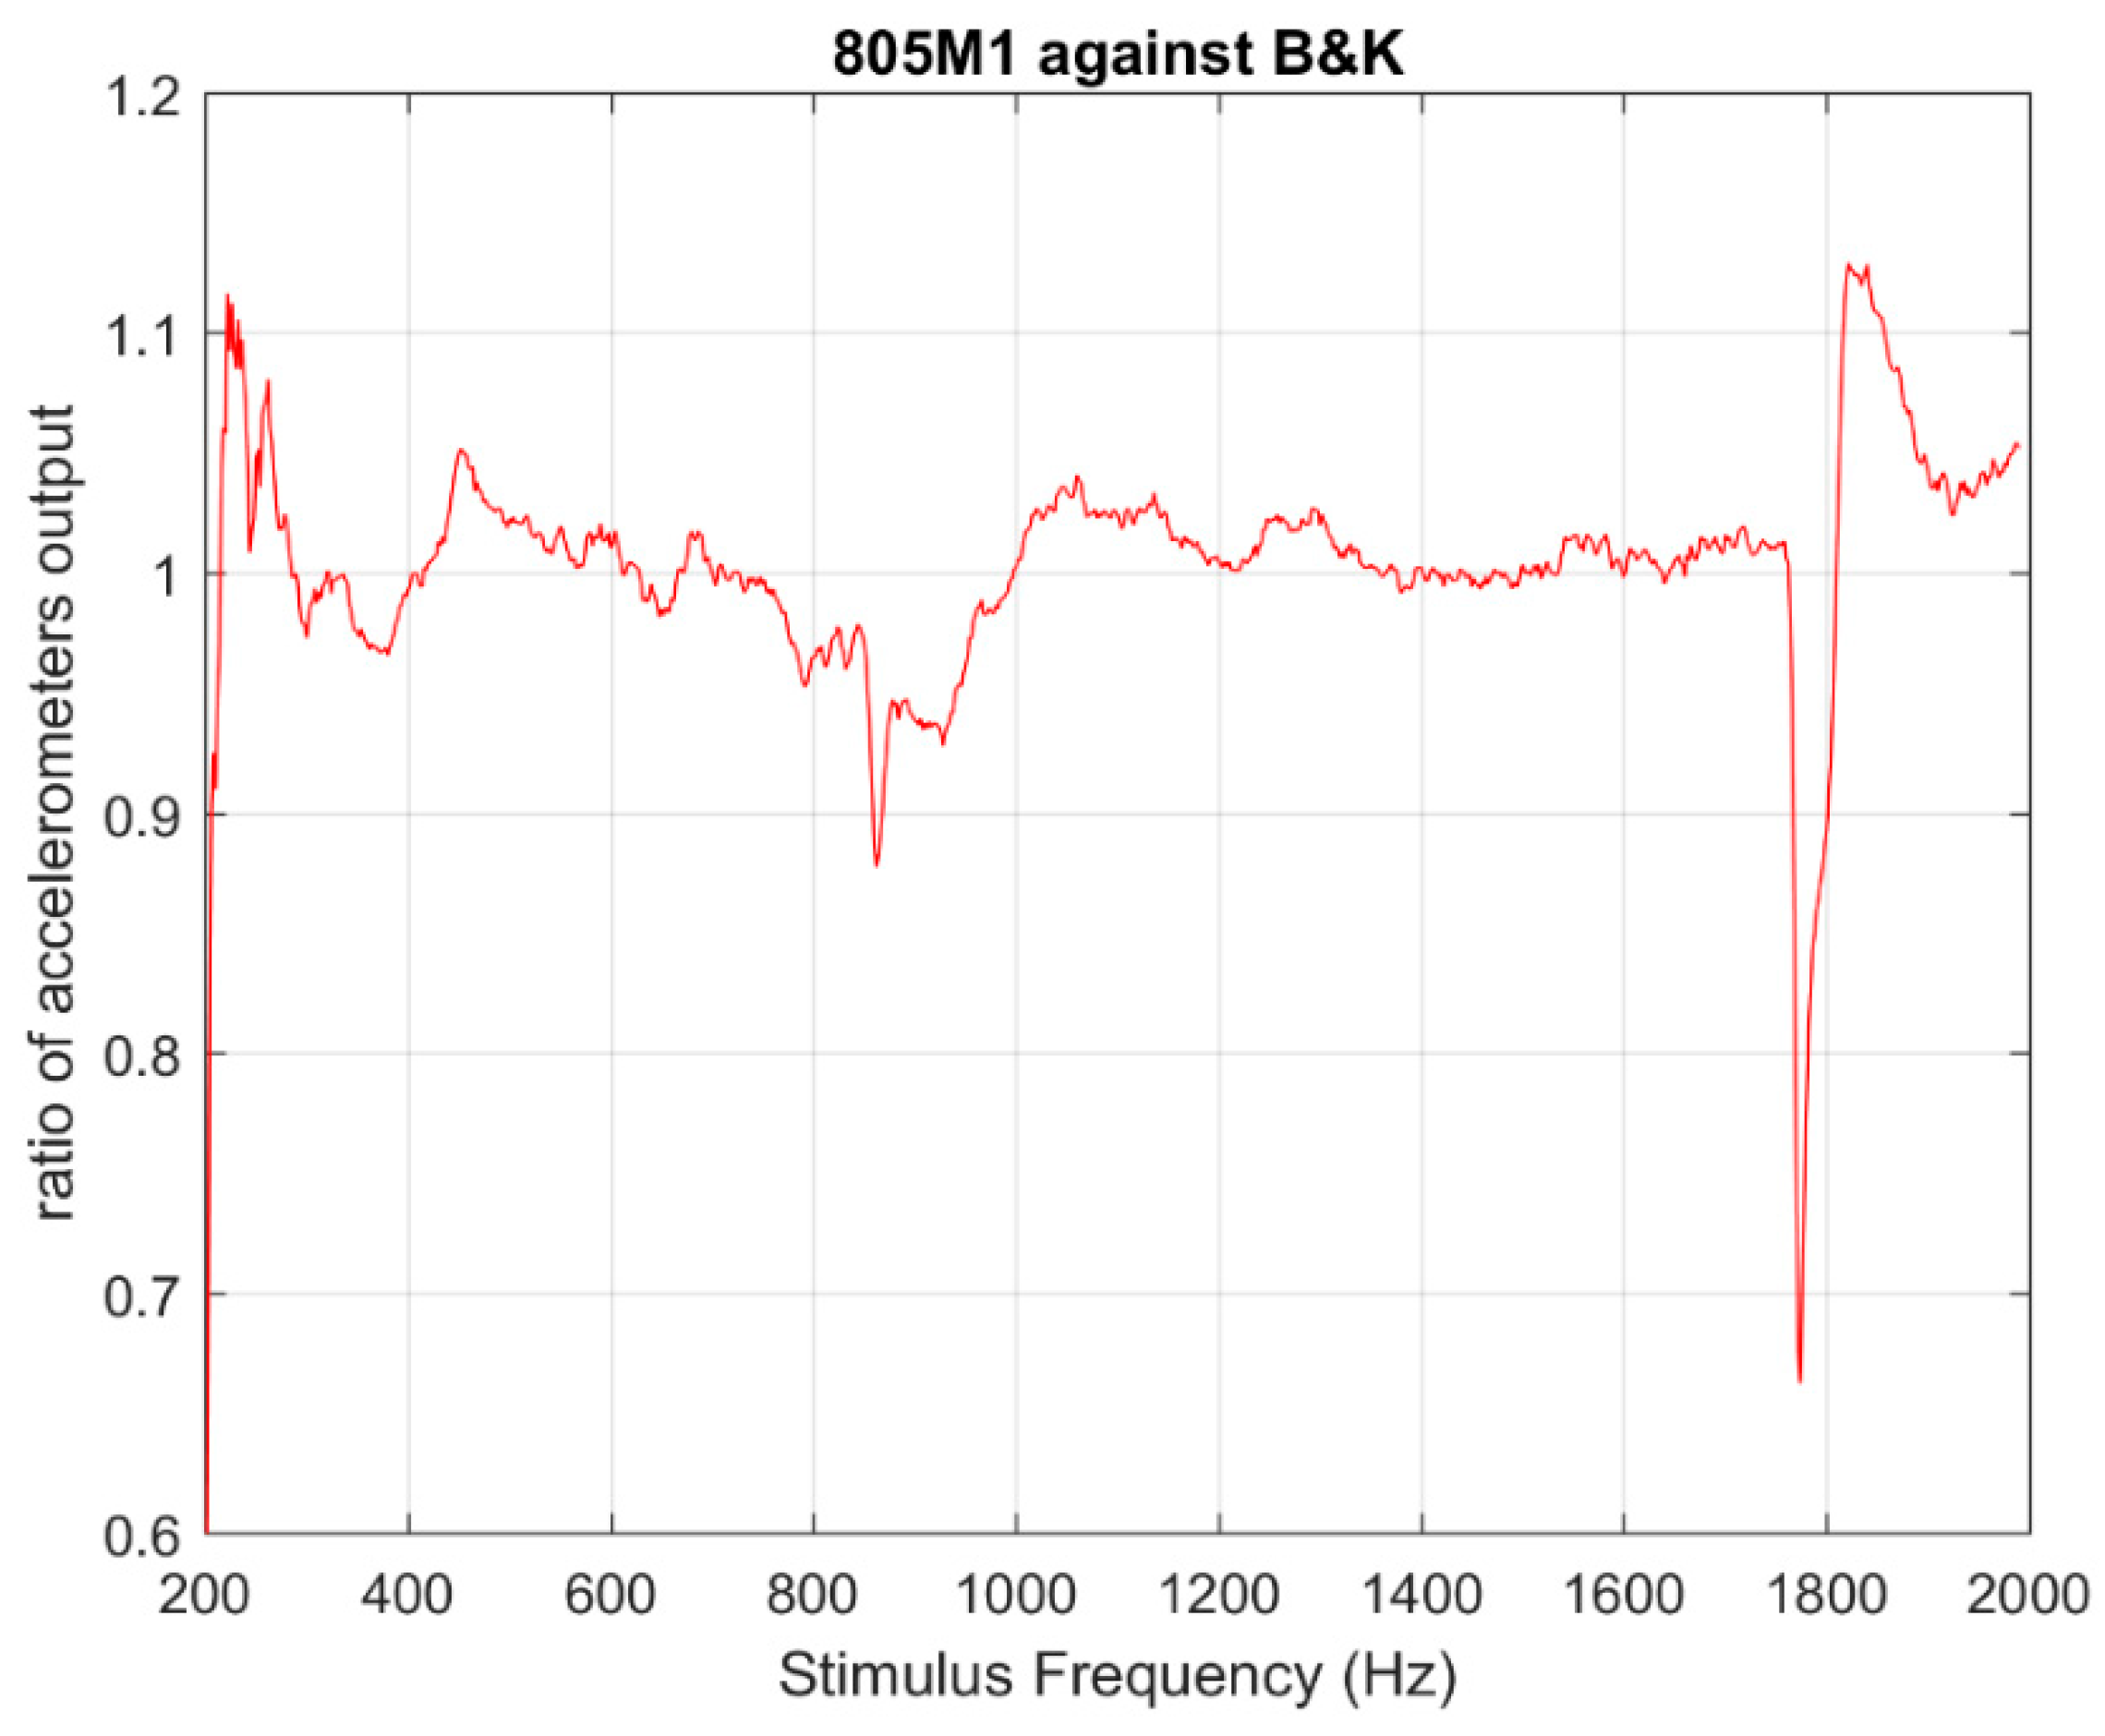
In Figure 2c we show the external appearance of an 805M1 accelerometer a year after its installation in the honeycomb with only the tip visible, the main body and wiring have been embedded into the honeycomb by the bees themselves. Cells in its immediate vicinity are used just as any other cell. In a separate experiment, an electromagnetic shaker was secured to a bee hive outer wall, with a Brüel and Kjær 4507 [12] accelerometer secured on another wall of the same hive, with a 805M1 glued directly onto it. The shaker was stimulated with a frequency sweep from 0 to 2 kHz, within a two minute long experiment. The output of both accelerometers was recorded with a stereo sound card, and the output voltage at the frequency of the stimulus was extracted by Fourier analysis of successive, one second long excerpts of the signal. The 805M1 voltage output was scaled to accommodate for the sensitivity difference (1000 versus 100 mV/g) and the ratio of the two outputs was then calculated to benchmark one accelerometer against the other.
3. Results
Of the three hives, only two provided reliable data as a fault developed in the accelerometer wiring of the third hive during installation that was not obvious until the data were analyzed. The other two hives provided 47 days of data with five minutes of recording around midnight and midday. The raw files were combined to produce night time and day time spectrograms which allowed both the frequency components and amplitudes to be analyzed.
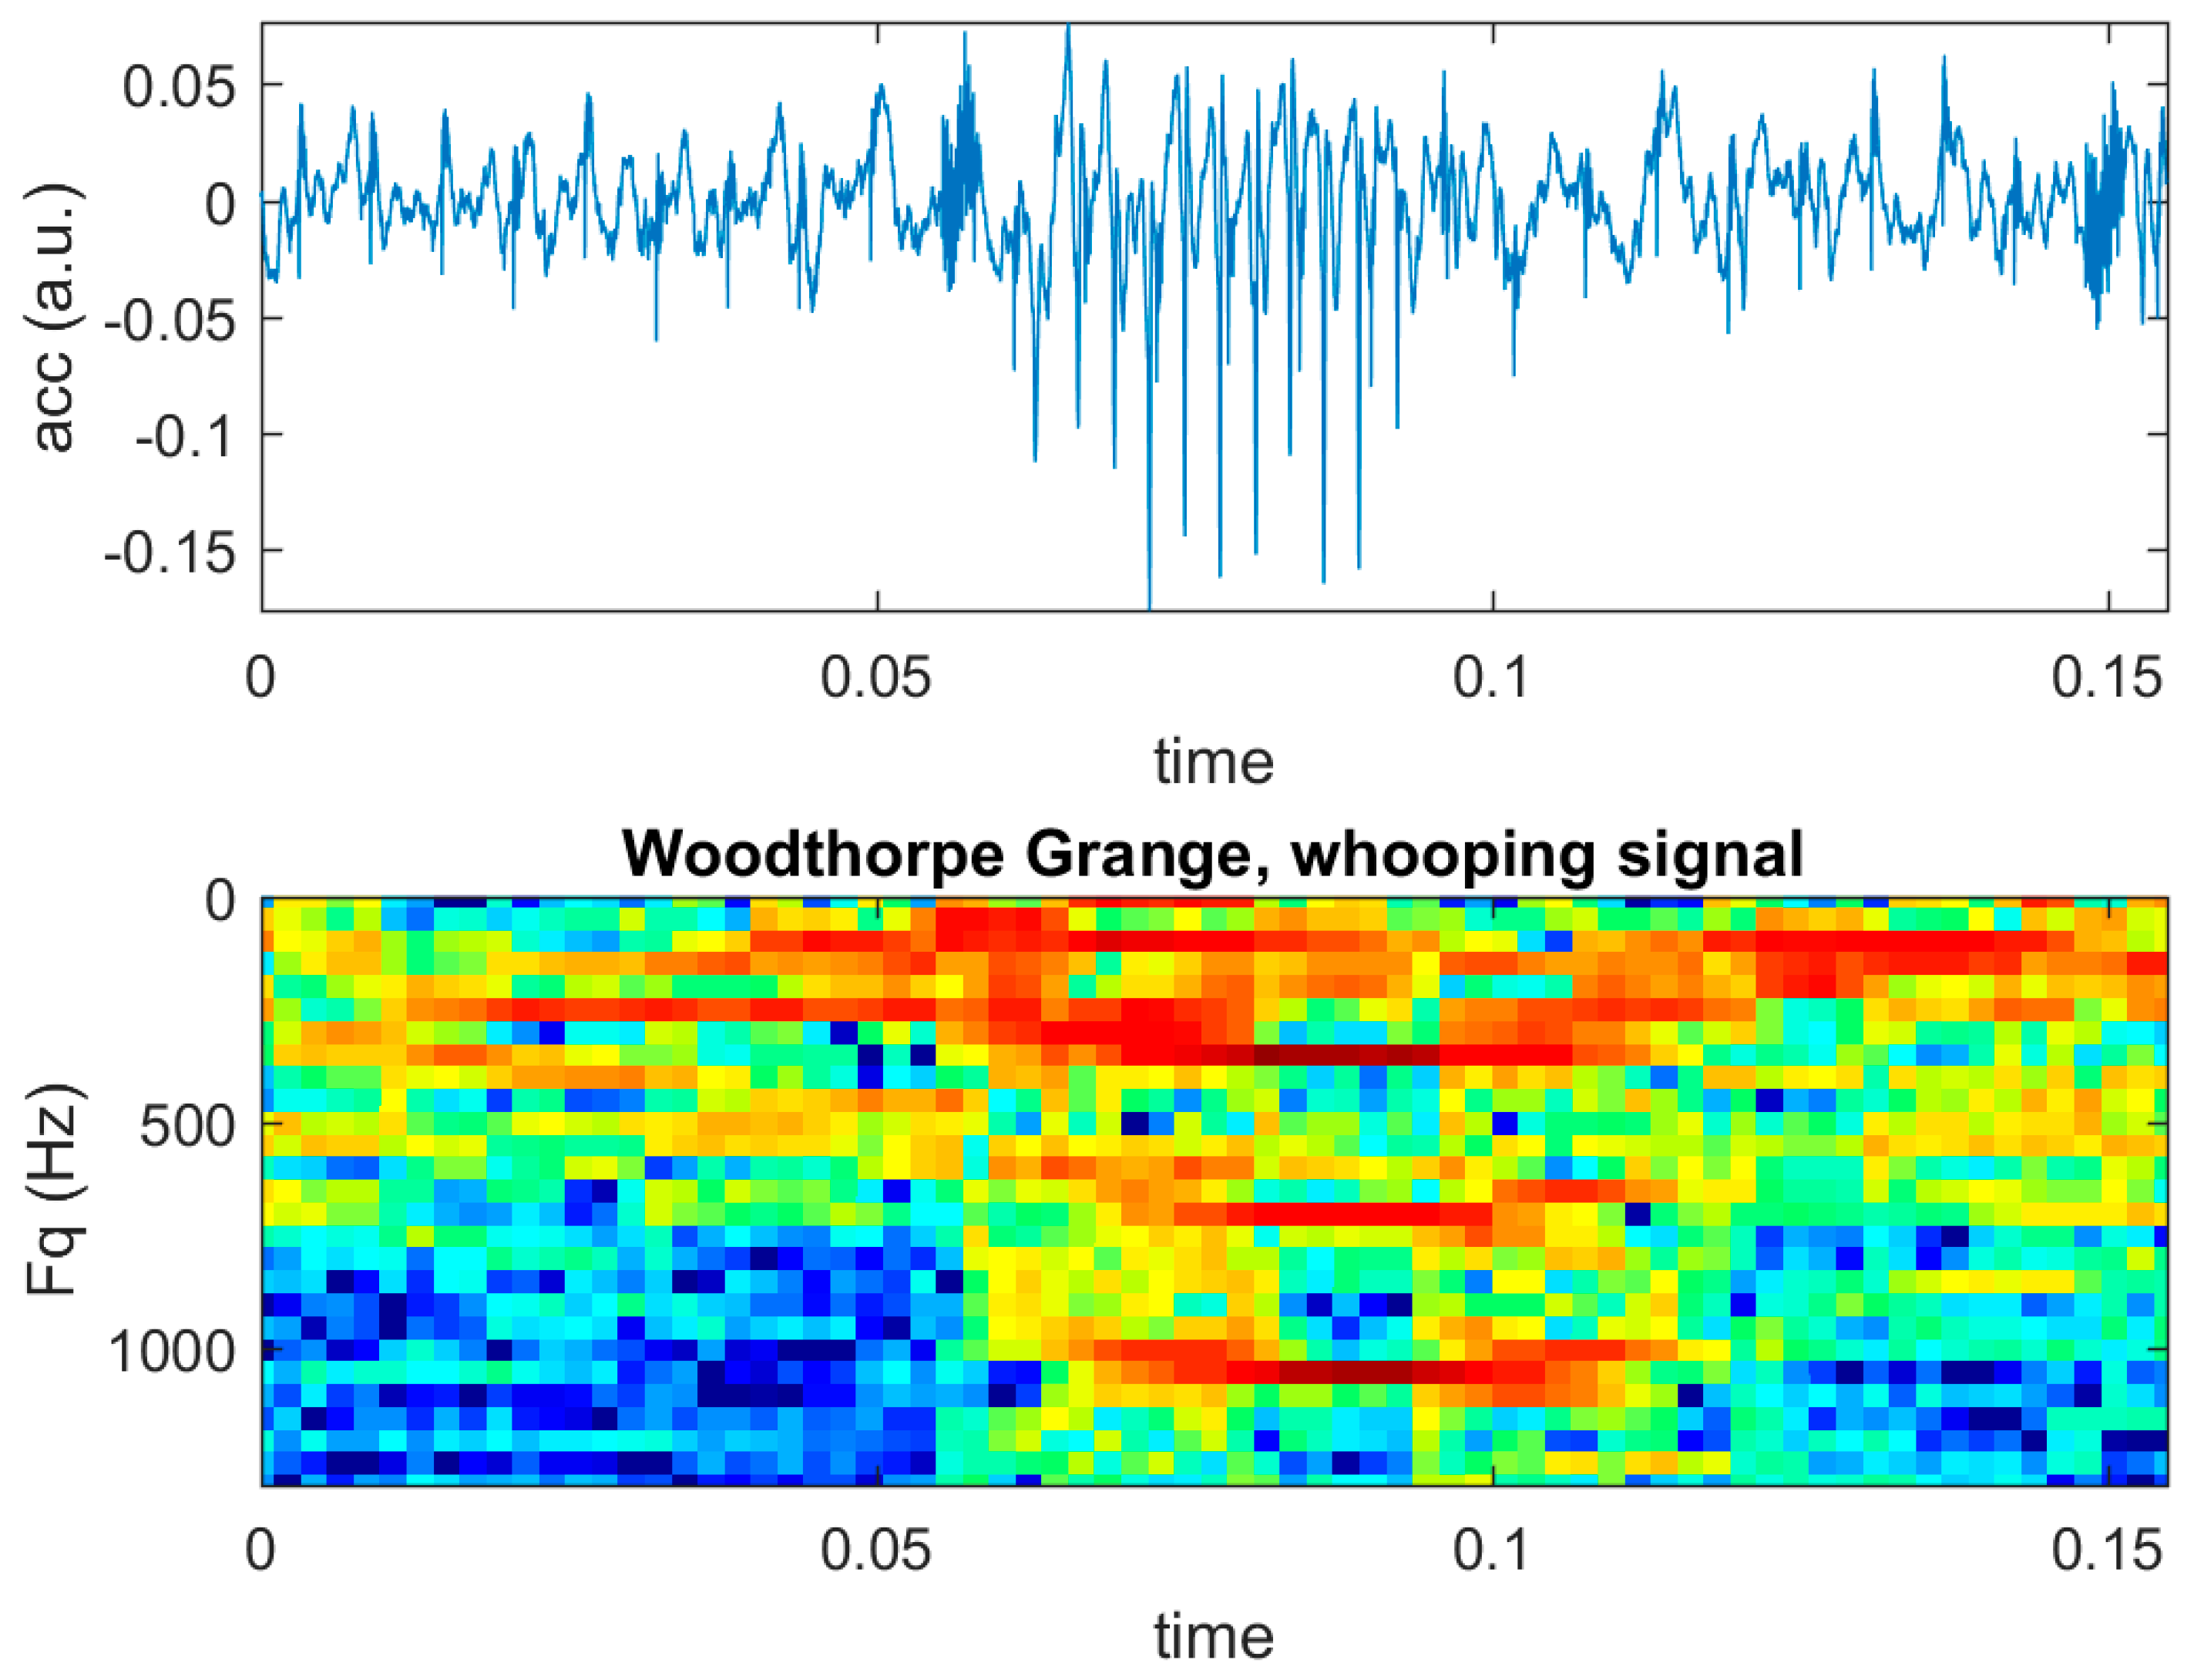
In the top of Figure 3 we show the accelerometer output voltage as a function of time for a typical ‘whooping’ signal measured by the 805M1. This type of signal is characterized by two well pronounced upper harmonics at twice and three times the value (in this case, around 380 Hz) of the fundamental frequency [5] which can be clearly seen in the spectrogram of these data shown in the bottom of Figure 3.

Figure 3.
The time course and corresponding spectrogram of a typical honeybee whooping signal measured by the 805M1 accelerometer. The color intensity of the spectrogram denotes the logarithm of the amplitude of the measured acceleration, with red being the highest acceleration and dark blue being the lowest.
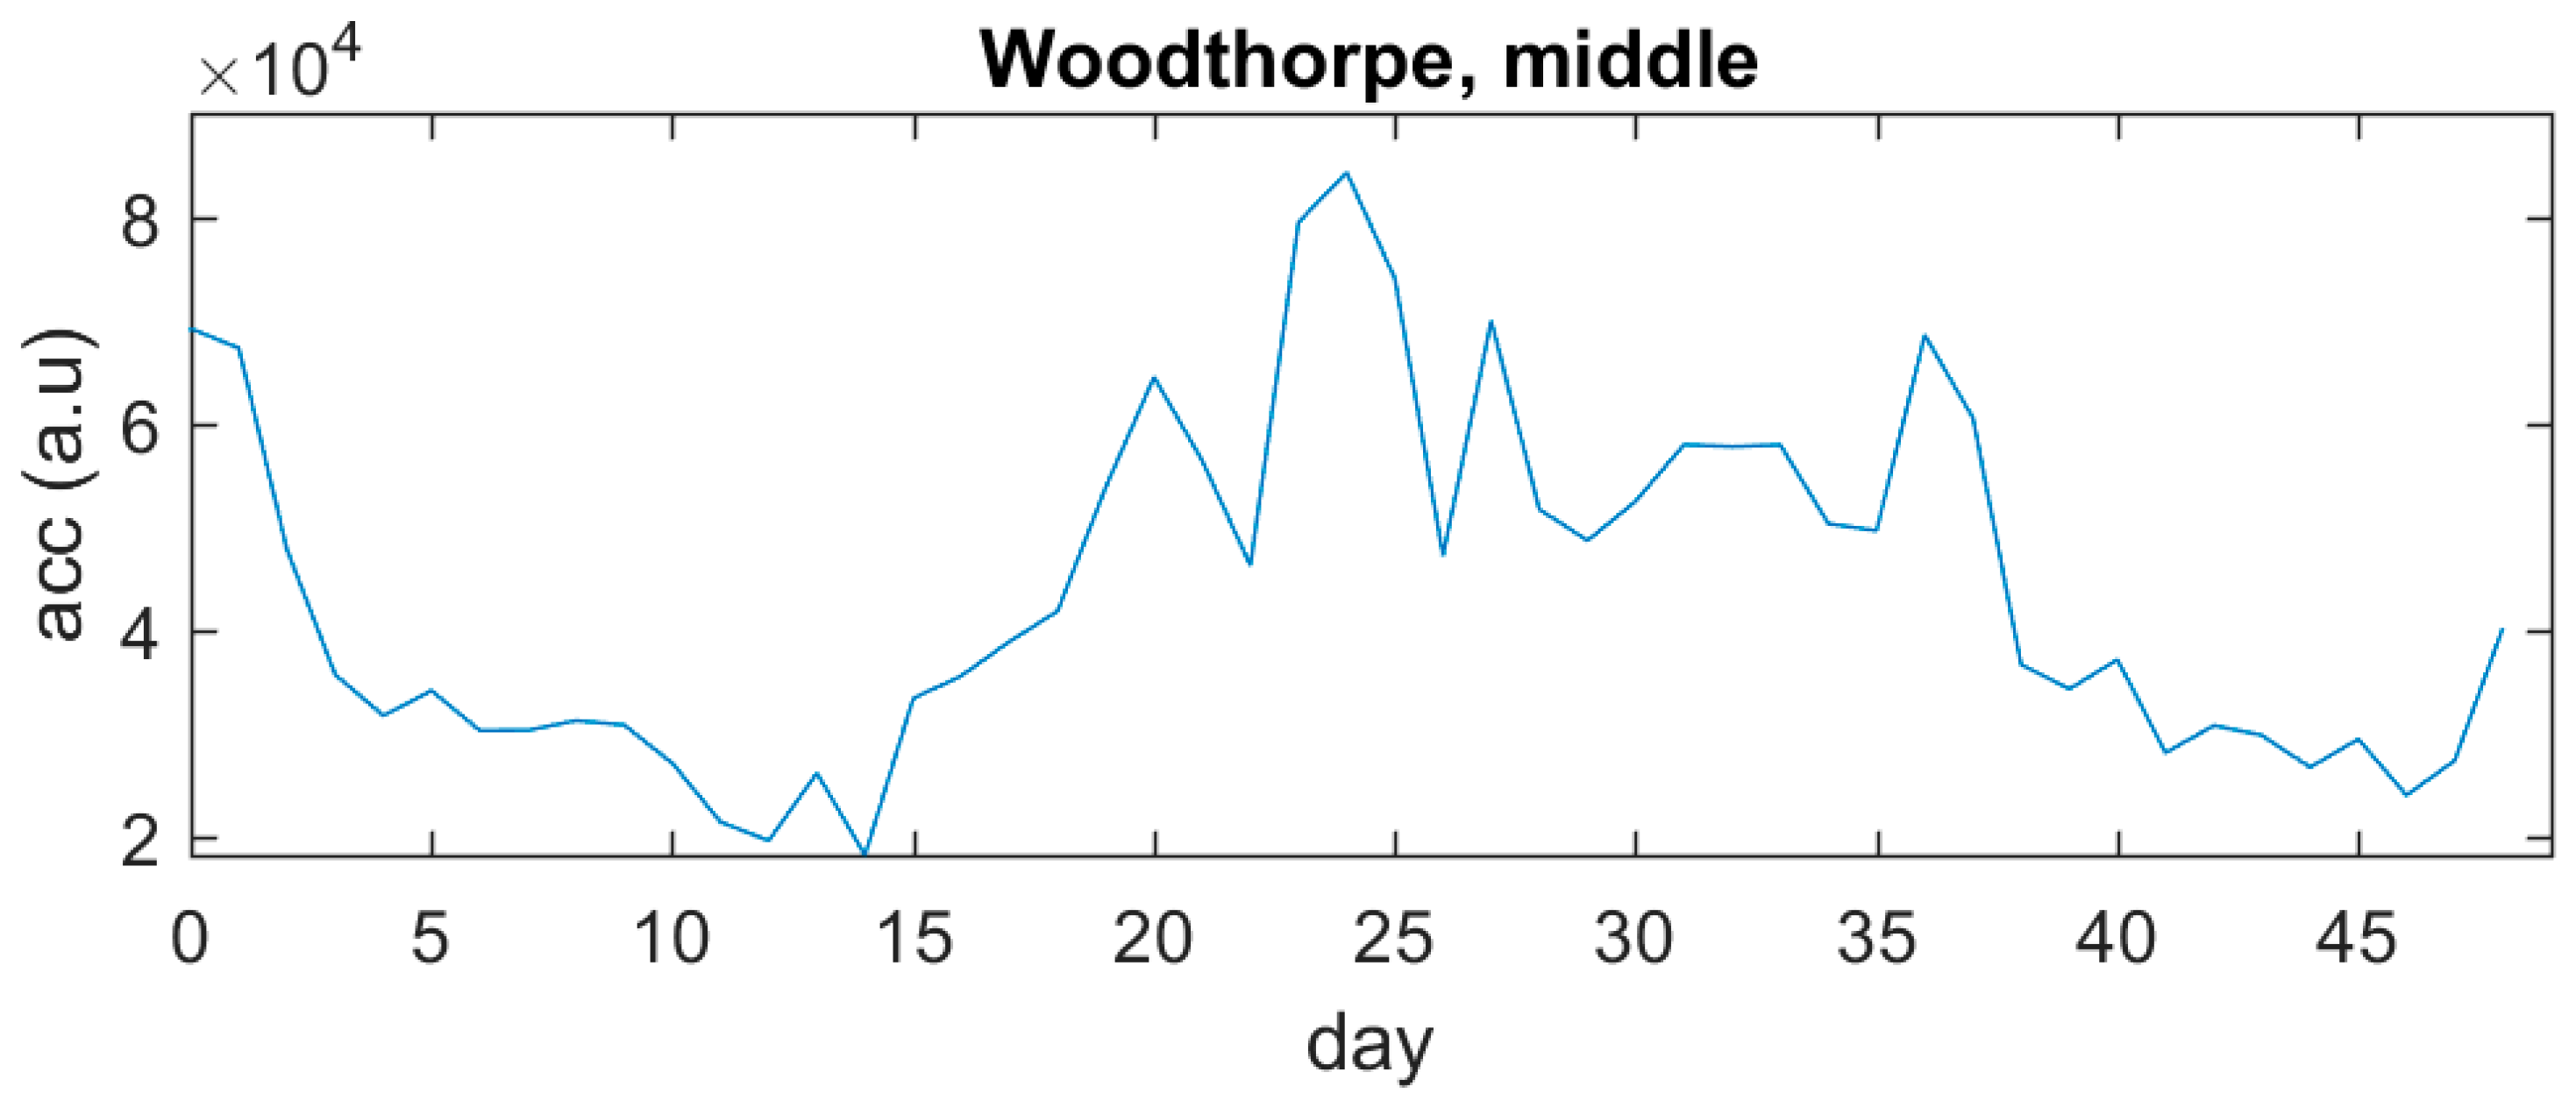
In Figure 4 we show the average accelerometer amplitude from 200 Hz to 320 Hz for the full measurement period. In Figure 5 we show the frequency response of the ratio of the outputs of a Brüel and Kjær 4507 and a 805M1 accelerometer, each subjected to the same vibration. Over the bandwidth measured, which is the one relevant to the majority of honey bee vibrational signals, both transducers performed similarly.
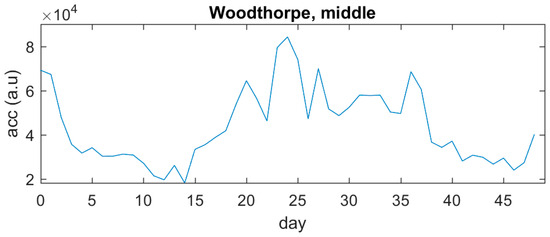
Figure 4.
The average accelerometer amplitude from 200 Hz to 320 Hz for the measurement period.
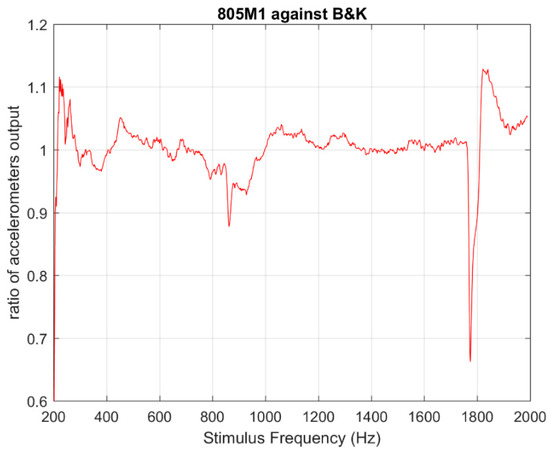
Figure 5.
The frequency response of the ratio of the outputs of a Brüel and Kjær 4507 and a 805M1 accelerometer, subjected to the same vibration.
4. Discussion
The data shown in Figure 4, whilst being somewhat noisy due to having only 5 min of recorded data per day, has a minima at around day 14 and again at day 46. The change in amplitude is expected due to the queen laying in an empty cell which is fed by nursing bees. The brood then grows in the cell and matures before being capped, later leading to the birth of the worker bee. Although the observed period was longer than the expected 21 days of a typical brood cycle, honeybees are known to take some time to maintain a cell immediately after the birth of a worker bee and before the queen would lay a fresh egg in the same cell. In addition, the queen may be busy laying on another frame which would extend the measured period of oscillation in the amplitude. The regular change in amplitude, however, is all that is required to indicate the repeated laying of the queen in the hive, which is a critical parameter in monitoring colony health. The quality of the individual whooping signal shown in Figure 3 is similar to that produced from the more expensive accelerometers [5] suggesting that the 805M1 is indeed a suitable accelerometer for honey bee vibration monitoring.
Author Contributions
Conceptualization, Writing-review & editing, M.I.N. and M.B.; Measurement hardware and software, M.I.N.; Data analysis, M.B.
Funding
This research received no external funding.
Acknowledgments
The authors thank the Nottinghamshire Beekeepers Association (www.nottsbees.org.uk) for allowing them to install the measuring equipment described in this article in their teaching apiary.
Conflicts of Interest
The authors declare no conflict of interest
References
- Potts, S.G.; Roberts, S.P.; Dean, R.; Marris, G.; Brown, M.A.; Jones, R.; Neumann, P.; Settele, J. Declines of managed honeybees and beekeepers in Europe. J. Apic. Res. 2010, 49, 15–22. [Google Scholar] [CrossRef]
- Ellis, J.D.; Evans, J.D.; Pettis, J.S. Colony losses, managed colony population decline and Colony Collapse Disorder in the United States. J. Apic. Res. 2010, 49, 134–136. [Google Scholar] [CrossRef]
- Klein, A.M.; Vaissiere, B.E.; Cane, J.H.; Steffan-Dewenter, I.; Cunningham, S.A.; Kremen, C.; Tscharntke, T. Importance of pollinators in changing landscapes for world crops. Proc. R. Soc. Lond. B. Biol. Sci. 2007, 274, 303–313. [Google Scholar] [CrossRef] [PubMed]
- Zacepins, A.; Brusbardis, V.; Meitalovs, J.; Stalidzans, E. Challenges in the development of Precision Beekeeping. Biosyst. Eng. 2015, 130, 60–71. [Google Scholar] [CrossRef]
- Ramsey, M.-T.; Bencsik, M.; Newton, M.I. Long-Term Trends in the Honeybee ‘Whooping Signal’ Revealed by Automated Detection. PLoS ONE 2017, 12, e0171162. [Google Scholar] [CrossRef]
- Bencsik, M.; Le Conte, Y.; Reyes, M.; Pioz, M.; Whittaker, D.; Crauser, D.; Newton, M.I. Honeybee colony vibrational measurements to highlight the brood cycle. PLoS ONE 2015, 10, e0141926. [Google Scholar] [CrossRef] [PubMed]
- Bencsik, M.; Bencsik, J.; Baxter, M.; Lucian, A.; Romieu, J.; Millet, M. Identification of the honeybee swarming. process by analysing the time course of hive vibrations. Comput. Electron. Agric. 2011, 76, 44–50. [Google Scholar] [CrossRef]
- Teensy USB Development Board. Available online: www.pjrc.com/store/teensy32.html (accessed on 10 July 2018).
- Audio Adaptor Board for Teensy 3.0—3.6. Available online: www.pjrc.com/store/teensy3_audio.html (accessed on 10 July 2018).
- Teensy Audio Design Tool. Available online: https://www.pjrc.com/teensy/gui/ (accessed on 10 July 2018).
- TO-5 3-Wire Voltage Output Accelerometer. http://www.te.com/usa-en/product-CAT-EAC0009.html (accessed on 10 July 2018).
- Brüel and Kjær 4507 Accelerometer. Available online: https://www.bksv.com/en/products/transducers/vibration/Vibration-transducers/accelerometers/4507 (accessed on 18 September 2018).

© 2019 by the authors. Licensee MDPI, Basel, Switzerland. This article is an open access article distributed under the terms and conditions of the Creative Commons Attribution (CC BY) license (https://creativecommons.org/licenses/by/4.0/).