Abstract
The paper analyzes the influence of different magnetic resonance (MR) scan sequence parameters (echo time, repetition time, orientation of scan slices, sequence type, mass of a tested object) on the energy of the produced noise and vibration. The measured sound pressure levels, together with the recorded noise and vibration signals, were stored in a database and then processed using similar methods to speech signal analysis because the main frequencies of the acoustic noise and vibration lie in the standard audio frequency range. In the signal processing phase, four types of parameters describing the signal energy were determined and statistically analyzed, and the obtained results were visually and numerically compared.
1. Introduction
The magnetic resonance imaging (MRI) tomograph is a huge intelligent sensor used for non-invasive scanning of various parts of a human body [1] without being a burden to it, as in the case of X-ray equipment. The MRI method is successfully used for health monitoring of therapy progress after vocal fold cancer surgery, monitoring of implanted cartilage in legs or arms, monitoring the process of renovation/degradation of the Achilles tendon, etc. In the case of the open-air MRI device, a weak magnetic field (up to 0.2 Tesla) is usually generated by a pair of permanent magnets [2]. Slices of a tested object are selected in 3-dimensional (3-D) coordinates by a gradient system consisting of planar coils parallel to the magnets. A radio frequency (RF) receiving/transmitting coil with a tested object/subject is placed between them. A rapidly changing current flowing through the gradient coils produces significant mechanical vibration, thus causing image blurring of thin layer samples and an acoustic noise that significantly degrades the simultaneously recorded speech signal during MR scanning of the human vocal tract [3]. The acoustic noise has always had negative physiological and psychical effects on the exposed person, depending on the noise intensity and time duration of noise exposure. In order to minimize these negative factors, this work is focused on the mapping of the energy relationship between vibration and noise signals measured in the MRI scanning area and its vicinity, with the final aim to choose the proper scan sequence and its parameters—repetition time (TR), echo time (TE), orientation of scan slices, etc. Apart from the real-time recording of the vibration and noise signals, the sound pressure level (SPL) was measured by a sound level meter using frequency weighting to match human perception of the noise. The measured data and recorded signals were further processed off-line—the determined energetic features were statistically analyzed, and the results were compared visually and numerically.
2. Subject and Methods
As mentioned above, the primary use of the open-air MRI device is in medical diagnostics, so designation of three planes formed by x, y, and z axes follows medical terminology used for human body planes [4]. The plane dividing the body vertically into ventral (anterior) and dorsal (posterior) parts is called a coronal (frontal) plane. The second vertical plane dividing the body to left and right sides is a sagittal plane. The horizontal plane that divides the human body into superior (upper) and inferior (lower) parts is called a transverse (cross-sectional) plane. Different orientation of scans during execution of the scan sequence needs activation of different gradient coils having impact on their vibration and consequent acoustic noise. Two basic types of sequences called spin echo (SE) and gradient echo (GE) arising from MRI physical principles [5] are preferred in this MRI device type. In the experimental practice, it is often necessary to change the basic parameter setting of the used scan sequence as well as other scan parameters—field of view, number of slices, slice thickness, etc.—depending on the currently tested sample. The volume size of the tested object/subject is another important factor that has an influence on the intensity of the produced vibration and noise in the scanning area of the MRI device. A tested person/sample/phantom as a part of the whole vibrating mechanical system changes the overall mass, stiffness, and damping by loading the lower gradient coil structure in the patient’s bed.
To preserve maximum quality of MR images without any artefacts, the vibration sensors placed in the static magnetic field of the MRI scanner cannot contain any part made from a ferromagnetic material. For this reason, the measuring microphone and the sound meter must be located outside of the static magnetic field influence at an adequate distance from the noise source. The recording microphone must have high sensitivity and an appropriate directional pattern for suppression of additional background noises. The C-weighting filter was used in the sound pressure level (SPL) measurement to be more consistent with human hearing of loud sounds. The filter frequency response in s-domain is given by the equation
where ω = 2πf, f1 = 20.6 Hz, f2 = 12194 Hz, and 20 log G = 0.062 dB. Using the bilinear transform with frequency warping, the transfer function of the filter can be transformed to the z-domain for digital infinite impulse response (IIR) weighting filter design [6].
Several methods can be used to determine the energy of the periodical signal. For our purpose, two of the basic principles are applied:
- Taking a signal x(n) in a defined region of interest (ROI) with the length of M samples, the standard root mean square (RMS) is computed or the energy is calculated as the absolute value of the mean of the Teager–Kaiser energy operator [7]
- Processing the signal x(n) in frames, using NFFT-point fast Fourier transform (FFT) to compute the magnitude of its power spectrum |S(k)|2, and estimating the frame energy by the first cepstral coefficient c0 or using the autocorrelation coefficient r0 as
3. Experiments and Results
The performed experiments were focused on the analysis of vibration and noise conditions in the scanning area and in the neighborhood of the open-air MRI equipment E-scan Opera by Esaote S.p.A., Genoa, Italy [2]. Practical measurement comprised real-time recording of the output voltage signals of the piezoelectric sensor located inside the scanning area of the investigated MRI device and of the microphone in its close neighborhood, as well as SPL noise measurement. The stored records were next processed for evaluation and comparison of the signal properties. Basic measurement of the acoustic noise SPL distribution in the MRI device vicinity was carried out using the multi-function environment meter Lafayette DT 8820 placed at the distance DX = 60 cm from the central point of the scanning area at a height of 75 cm from the floor (level of the bottom gradient coils) and at 30 degrees from the left corner near the temperature stabilizer. First, SPL noise was mapped in detail at distances DX = <45~90> cm. In all cases, the phantom was a plastic sphere of 140 mm diameter filled with doped water [2] and placed inside the knee RF coil; see the arrangement photo in Figure 1a. The SB-1 sensor [8,9] was used for picking up the vibration signals from the solid surface inside the scanning area of the MRI Opera device. Position P0 of the sensing disc on the surface of the plastic holder of the bottom gradient coils can also be seen in Figure 1a. At the same time, the acoustic noise signal was recorded by the 1” Behringer dual diaphragm condenser microphone B-2 PRO, which was placed on a stand with shock mounting beside the sound level meter. Noise and vibration signals were recorded with the help of the Behringer Podcast Studio equipment. The signals of duration of about 15 s sampled at 32 kHz were next processed in the sound editor program Sound Forge 9.0a.
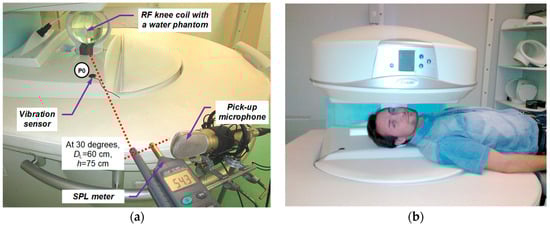
Figure 1.
Arrangement photo of sound pressure level (SPL) noise measurement and parallel recoding of noise and vibration signals of the open-air magnetic resonance imaging (MRI) device Opera: (a) using the testing phantom, (b) with the lying person.
In our main measurement experiments, the effect of MR scan parameters on the recorded noise and vibration was analyzed: Used scan sequences are found in Table 1, along with the orientation of scan slices TORIENT = {Coronal, Sagittal, Transversal}, times TTE = {18, 22, 26} ms, and TTR = {60, 100, 200, 300, 400, 500} ms. Finally, the influence of the mass of the object inserted in the MRI device scanning area was evaluated. Practical realization of this task consisted of placing the testing phantom or a head and a neck of a lying person in the RF scan coil between the upper and lower gradient coils of the MRI device. The total weight of the testing phantom was 0.75 kg. Test persons lying on the patient bed of the MRI device (see the photo in Figure 1b) were one male and one female weighing approximately 75 and 55 kg. The baseline measurement and recording of the vibration and noise signals were carried out during the execution of MR scan sequences typical for 3-D imaging of the human vocal tract. The TE and TR parameters were set manually according to Table 1 to perform measurement and comparison in the range enabled by the current sequence.

Table 1.
Basic description and scan parameters settings of used MR sequences.
4. Results and Discussion
Results of detailed measurements of the acoustic noise intensity at different distances from the central point of the scanning area for SE and GE high-resolution (Hi-Res) sequences are presented in Figure 2. The minimum DX = 45 cm was set to eliminate interaction of metal parts of the SPL meter with the static magnetic field of the MRI device. If the SPL meter is placed near the center, the field homogeneity starts to be disrupted, a warning message is displayed on the MRI control console, and scanning is prohibited by the control software until the fault is fixed – it is an automatic protection of the system against the MRI device damage [2]. The maximum distance DX = 90 cm was chosen with respect to the fact that measured levels at this position are close to the background noise SPL0 originated from the temperature stabilizer. Therefore, the working distance of 60 cm was used for all further measurements.
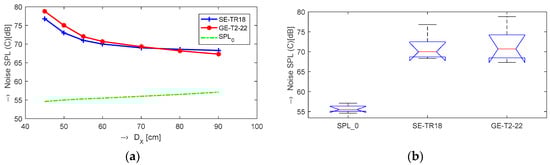
Figure 2.
Mapping of acoustic noise SPL at different distance DX = {45, 50, 55, 60, 70, 80, and 90} cm from the middle of scanning area of the MRI device for spin echo (SE)/gradient echo (GE) sequences: (a) SPL values together with the background ones (SPL0), (b) box-plot of their basic statistical parameters.
The first investigation was aimed at the influence of the choice of slice orientation on the energy of the produced vibration as well as noise signals. This effect is large—the maximum can be found in the sagittal plane and the minimum in the transversal plane—see the graphs in Figure 3. Therefore, the remaining experiments used only the sagittal orientation. In correspondence with our previous research [8,9], the current experiments confirm influence of TR and TE times on the vibration and acoustic noise properties. The TR parameter determines the fundamental frequency FV0, and the TE time stretching causes a fall of the final signal energy, but higher frequencies are affected, as documented by a comparison of the first two dominant frequencies FV1,2 in Figure 4. However, as seen in Figure 5 the influence of the TR on the signal energy is not negligible, especially for TR = 400 and 500 ms. Next, a comparison of energetic relations of vibration and noise signals for different sequence types shows small differences; only the 3-D SE sequence produced the noise with minimal intensity, as documented by the graphs in Figure 6. As seen in Table 2, the obtained vibration signal energy was higher for the water phantom than for the lying person—in the latter case, the effective weight of the person pressing on the bottom plastic holder of the gradient coils attenuated the vibration pulses partially. On the other hand, the energy of the secondarily produced acoustic noise was roughly inversely proportional to the volume of the testing object/subject. It is caused by superposition, with the noise originating from the upper gradient coils that are not affected by the weight of the testing object/subject.
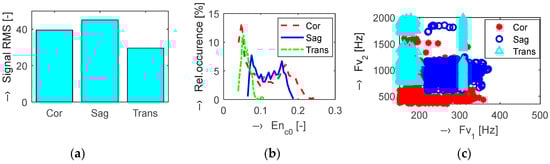
Figure 3.
Visualization of vibration signal features for different slice orientations: {Coronal, Sagittal, Transversal}; (a) bar-graph of signal root mean square (RMS) values; (b) histograms of Enc0; (c) mutual Fv1/Fv2 positions for high-resolution SE scan sequences with TE = 18 ms and TR = 500 ms.
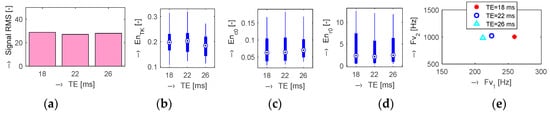
Figure 4.
Visualization of vibration signal features for different TE time: {18, 22, 26} ms; (a) bar-graphs of signal RMS values and basic statistical parameters: (b) EnTK; (c) Enc0; (d) Enr0; (e) mean mutual Fv1/Fv2 positions for high-resolution SE-HF sequences (TR = 500 ms, sagittal orientation).
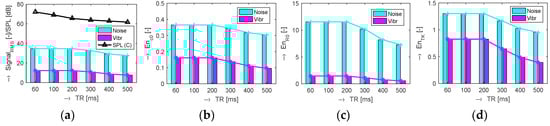
Figure 5.
Visualization of energetic relations of vibration and noise signals for different TR times; {60, 100, 200, 300, 400, 500} ms; (a) signal RMS together with noise SPL values; (b) mean Enc0; (c) mean Enr0; (d) mean EnTK; used high-resolution GE-T2 sequences with TE = 22 ms, and sagittal orientation.
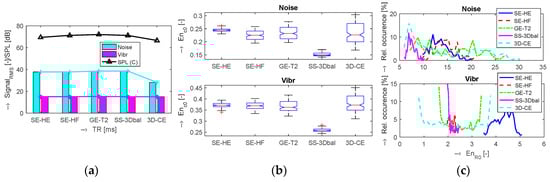
Figure 6.
Comparison of energetic relations of vibration and noise signals for different sequence types - high-resolution {SE-HE, SE-HF, GE-T2} and 3-D {SS-3Dbal, 3D-CE}; (a) signal RMS together with SPL values; (b) bar-graphs of basic statistical parameters of Enc0 values; (c) corresponding histograms for Enc0 parameter. In all cases a sagittal slice orientation was used.
Table 2.
Comparison of mean energy values of vibration and noise signals for different objects placed in the scanning area of the MRI device.
5. Conclusions
Following the presented measurements of the acoustic noise SPL in the vicinity of the investigated open-air MRI device, a maximum sound pressure level of about 78 dB(C) was achieved at a distance of 45 cm from the central point of the MRI scanning area for the GE scan sequence with short TE and TR times and sagittal slices orientation. This means that no special hearing protection aids (ear plugs or ear muffs) are necessary. For examination of other parts of the human body (leg, arm, etc.), the head is not inserted directly between upper and lower gradient coils, so the noise is much lower—as documented for different distances in Figure 2. Finally, the scanning times for the 3-D and Hi-res sequences are in general less than 15 min (typically about 3–5 min, depending on the chosen number and thickness of the slices)—exposition of the human organism and its ear by the noise and vibration is not great.
The results of the performed measurements are useful for precise description of the process of mechanical vibration excitation and the acoustic noise radiation in the scanning area and vicinity of the MRI device. The measurement results and comparisons taken from a similar low field MRI tomograph can be useful for optimization of acoustic noise suppression in parallel with speech recording applied to 3-D modeling of the human vocal tract [3].
Author Contributions
Conception and design of the study (J.P., A.P., I.F.), measurement (J.P., A.P.), data collection and processing (J.P.), writing (J.P., A.P.), English correction (A.P.), paper review and advice (I.F.).
Funding
This work was funded by the Slovak Scientific Grant Agency project VEGA 2/0001/17, the Ministry of Education, Science, Research, and Sports of the Slovak Republic VEGA 1/0905/17, and the Slovak Research and Development Agency, project no. APVV-15-0029.
Conflicts of Interest
The authors declare no conflict of interest.
References
- Wellard, R.M.; Ravasio, J.P.; Guesne, S.; Bell, C.; Oloyede, A.; Tevelen, G.; Pope, J.M.; Momot, K.I. Simultaneous magnetic resonance imaging and consolidation measurement of articular cartilage. Sensors 2014, 14, 7940–7958. [Google Scholar] [CrossRef] [PubMed]
- Esaote, S.p.A. E-Scan Opera. User’s Manual. Revision A, Genoa, 2008.
- Mainka, A.; Platzek, I.; Mattheus, W.; Fleischer, M.; Müller, A.S. Three-dimensional vocal tract morphology based on multiple magnetic resonance images is highly reproducible during sustained phonation. J. Voice 2017, 31, 504.e11–504.e20. [Google Scholar] [CrossRef] [PubMed]
- Diedrichsen, J.; Balsters, J.H.; Flavell, J.; Cussans, E.; Ramnani, R.A. probabilistic MR atlas of the human cerebellum. NeuroImage 2009, 46, 39–46. [Google Scholar] [CrossRef] [PubMed]
- Liang, Z.P.; Lauterbur, P.C. Principles of Magnetic Resonance Imaging: A Signal Processing Perspective; Wiley-IEEE Press: New York, NY, USA, 1999; ISBN 978-0-780-34723-6. [Google Scholar]
- Rimell, A.N.; Mansfield, N.J.; Paddan, G.S. Design of digital filters for frequency weightings (A and C) required for risk assessments of workers exposed to noise. Ind. Health 2015, 53, 21–27. [Google Scholar] [CrossRef] [PubMed]
- Boudraaa, A.-O.; Fabien Salzenstein, F. Teager–Kaiser energy methods for signal and image analysis: A review. Digit. Signal Process. 2018, 78, 338–375. [Google Scholar] [CrossRef]
- Přibil, J.; Přibilová, A.; Frollo, I. Mapping and spectral analysis of acoustic vibration in the scanning area of the weak field magnetic resonance imager. J. Vib. Acoust. 2014, 136, 51005. [Google Scholar] [CrossRef]
- Přibil, J.; Přibilová, A.; Frollo, I. Comparison of mechanical vibration and acoustic noise in the open-air MRI. Appl. Acoust. 2016, 105, 13–23. [Google Scholar] [CrossRef]
Publisher’s Note: MDPI stays neutral with regard to jurisdictional claims in published maps and institutional affiliations. |
© 2018 by the authors. Licensee MDPI, Basel, Switzerland. This article is an open access article distributed under the terms and conditions of the Creative Commons Attribution (CC BY) license (https://creativecommons.org/licenses/by/4.0/).