Determination of Micropollutants in Water Samples from Swimming Pool Systems †


Abstract
:1. Introduction
2. Materials and Methods
3. Results and Discussion
- the oven temperature program: 80 °C (6 min), 5 °C/min to 260 °C, 20 °C/min to 300 °C,
- the support phase: helium with a flow of 1.1 mL/min,
- injector: 250 °C,
- ion source: 230 °C,
- ion trap: 150 °C,
- ion recording mode: 50–700 m/s.
4. Conclusions
- The presented analytical procedure enables the quantification of caffeine, carbamazepine and benzophenone-3 with satisfactory repeatability and accuracy.
- The obtained recovery values ensure the possibility of full quantitative control of the tested micropollutants in samples collected from swimming pool waster systems.
- The developed methodology can be used for analytical control of swimming pool water treatment processes from selected Pharmaceuticals and Personal Care Products.
- The different physicochemical composition of water affect on LOQ. The values of LOQ obtained for swimming pool water were lower than for deionized and tap water.
Author Contributions
Acknowledgments
Conflicts of Interest
References
- WHO. Guidelines for Safe Recreational Water Environments. Volume 2: Swimming Pools and Similar Environments. 2006. Available online: www.who.int/water_sanitation_health/water-quality/recreational/en/ (accessed on 25 September 2017).
- Standards DIN 19643 1-4:2012-11. Aufbereitung von Schwimm und Badebeckenwasser (Water Treatment for Swimming and Bathing Pools); Beuth-Verlag: Berlin, Germany, 2012. [Google Scholar]
- Chowdhury, S.; Alhooshani, K.; Karanfil, T. Disinfection by-products in swimming pool: Occurrences, implications and future needs. Water Res. 2014, 53, 68–109. [Google Scholar] [CrossRef] [PubMed]
- Kanan, A.; Karanfil, T. Formation of disinfection by-products in indoor swimming pool water: The contribution from filling water natural organic matter and swimmer body fluids. Water Res. 2011, 45, 926–932. [Google Scholar] [CrossRef] [PubMed]
- Lee, J.; Jun, M.J.; Lee, M.H.; Eom, S.W.; Zoh, K.D. Production of various disinfection byproducts in indoor swimming pool waters treated with different disinfection methods. Int. J. Hyg. Environ. Health 2010, 213, 465–474. [Google Scholar] [CrossRef] [PubMed]
- Wyczarska-Kokot, J. Comparison of chloramine concentration in swimming pool water depending on swimming pool intended use. Ecol. Chem. Eng. A 2015, 22, 27–37. [Google Scholar] [CrossRef]
- Terasaki, M.; Makino, M. Determination of chlorinated by-products of parabens in swimming pool water. Int. J. Environ. Anal. Chem. 2008, 88, 911–922. [Google Scholar] [CrossRef]
- Teo, T.L.L.; Coleman, H.M.; Khan, S.J. Chemical contaminants in swimming pools: Occurrence, implications and control. Environ. Int. 2015, 76, 16–31. [Google Scholar] [CrossRef] [PubMed]
- Bottoni, P.; Bonadonna, L.; Chirico, M.; Caroli, S.; Záray, G. Emerging issues on degradation by-products deriving from personal care products and pharmaceuticals during disinfection processes of water used in swimming pools. Microchem. J. 2014, 112, 13–16. [Google Scholar] [CrossRef]
- Koutsouba, V.; Heberer, T.; Fuhrmann, B.; Schmidt-Baumler, K.; Tsipi, D.; Hiskia, A. Determination of polar pharmaceuticals in sewage water of Greece by gas chromatography-mass spectrometry. Chemosphere 2003, 51, 69–75. [Google Scholar] [CrossRef]
- Benotti, M.J.; Trenholm, R.A.; Vanderford, B.J.; Holady, J.C.; Stanford, B.D.; Snyder, S.A. Pharmaceuticals and endocrine disrupting compounds in U.S. drinking water. Environ. Sci. Technol. 2009, 43, 597–603. [Google Scholar] [CrossRef] [PubMed]
- Kim, S.D.; Cho, J.; Kim, I.S.; Vanderford, B.J.; Snyder, S.A. Occurrence and removal of pharmaceuticals and endocrine disruptors in South Korean surface, drinking, and waste waters. Water Res. 2007, 41, 1013–1021. [Google Scholar] [CrossRef] [PubMed]
- Vanderford, B.J.; Pearson, R.A.; Rexing, D.J.; Snyder, S.A. Analysis of endocrine disruptors, pharmaceuticals, and personal care products in water using liquid chromatography/tandem mass spectrometry. Anal. Chem. 2003, 75, 6265–6274. [Google Scholar] [CrossRef] [PubMed]
- Ollers, S.; Singer, H.P.; Fässler, P.; Müller, S.R. Simultaneous quantification of neutral and acidic pharmaceuticals and pesticides at the low-ng/l level in surface and waste water. J. Chromatogr. A 2001, 911, 225–234. [Google Scholar] [CrossRef]
- Lee, H.B.; Peart, T.E.; Svoboda, M.L. Determination of endocrine-disrupting phenols, acidic pharmaceuticals, and personal-care products in sewage by solid-phase extraction and gas chromatography-mass spectrometry. J. Chromatogr. A 2005, 1094, 122–129. [Google Scholar] [CrossRef] [PubMed]
- Hao, C.; Zhao, X.; Yang, P. GC-MS and HPLC-MS analysis of bioactive pharmaceuticals and personal care products in environmental matrices. Trends Anal. Chem. 2007, 26, 569–580. [Google Scholar] [CrossRef]
- Mottaleb, M.A.; Bellamy, M.K.; Mottaleb, M.A.; Islam, M.R. Use of LC-MS and GC-MS methods to measure emerging contaminants Pharmaceutical and Personal care Products (PPCPs) in Fish. J. Chromatogr. Sep. Tech. 2015, 6, 267. [Google Scholar] [CrossRef]
- Rezaee, M.; Assadia, Y.; Milani Hosseini, M.R.; Aghaeea, A.; Ahmadia, F.; Berijania, S. Determination of organic compounds in water using dispersive liquid–liquid microextraction. J. Chromatogr. A 2006, 1116, 1–9. [Google Scholar] [CrossRef] [PubMed]
- MacDougall, D.; Crummett, W.B. Guidelines for data acquisition and data quality evaluation in environmental chemistry. Anal. Chem. 1980, 52, 2242–2249. [Google Scholar] [CrossRef]


| Standard | Structural Formula | Molecular Formula | Molar Mass (g/mol) | CAS Number | Purity |
|---|---|---|---|---|---|
| Caffeine (CAF) | 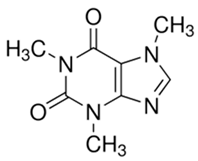 | C8H10N4O2 | 194.19 | 58-08-2 | >99% |
| Benzophenone-3 (BP-3) | 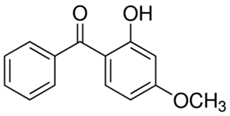 | C14H12O3 | 228.24 | 131-57-7 | 98% |
| Carbamazepine (CBZ) |  | C16H12N2O | 236.27 | 298-46-4 | >99% |
| Tube Type | Bed Weight (g) | Tube Volume (mL) | Carbon Loading (%) | Bed Type |
|---|---|---|---|---|
| ENVI-8 | 1 | 6 | 14 | C8 (octyl) |
| ENVI-18 | 1 | 6 | 17 | C18 (octadecyl) |
| LC-8 | 0.5 | 6 | 7 | C8 (octyl) |
| LC-18 | 1 | 6 | 11.5 | C18 (octadecyl) |
| LC-CN | 0.5 | 6 | 7 | Cyano |
| LC-Ph | 0.5 | 3 | 5.5 | Phenyl |
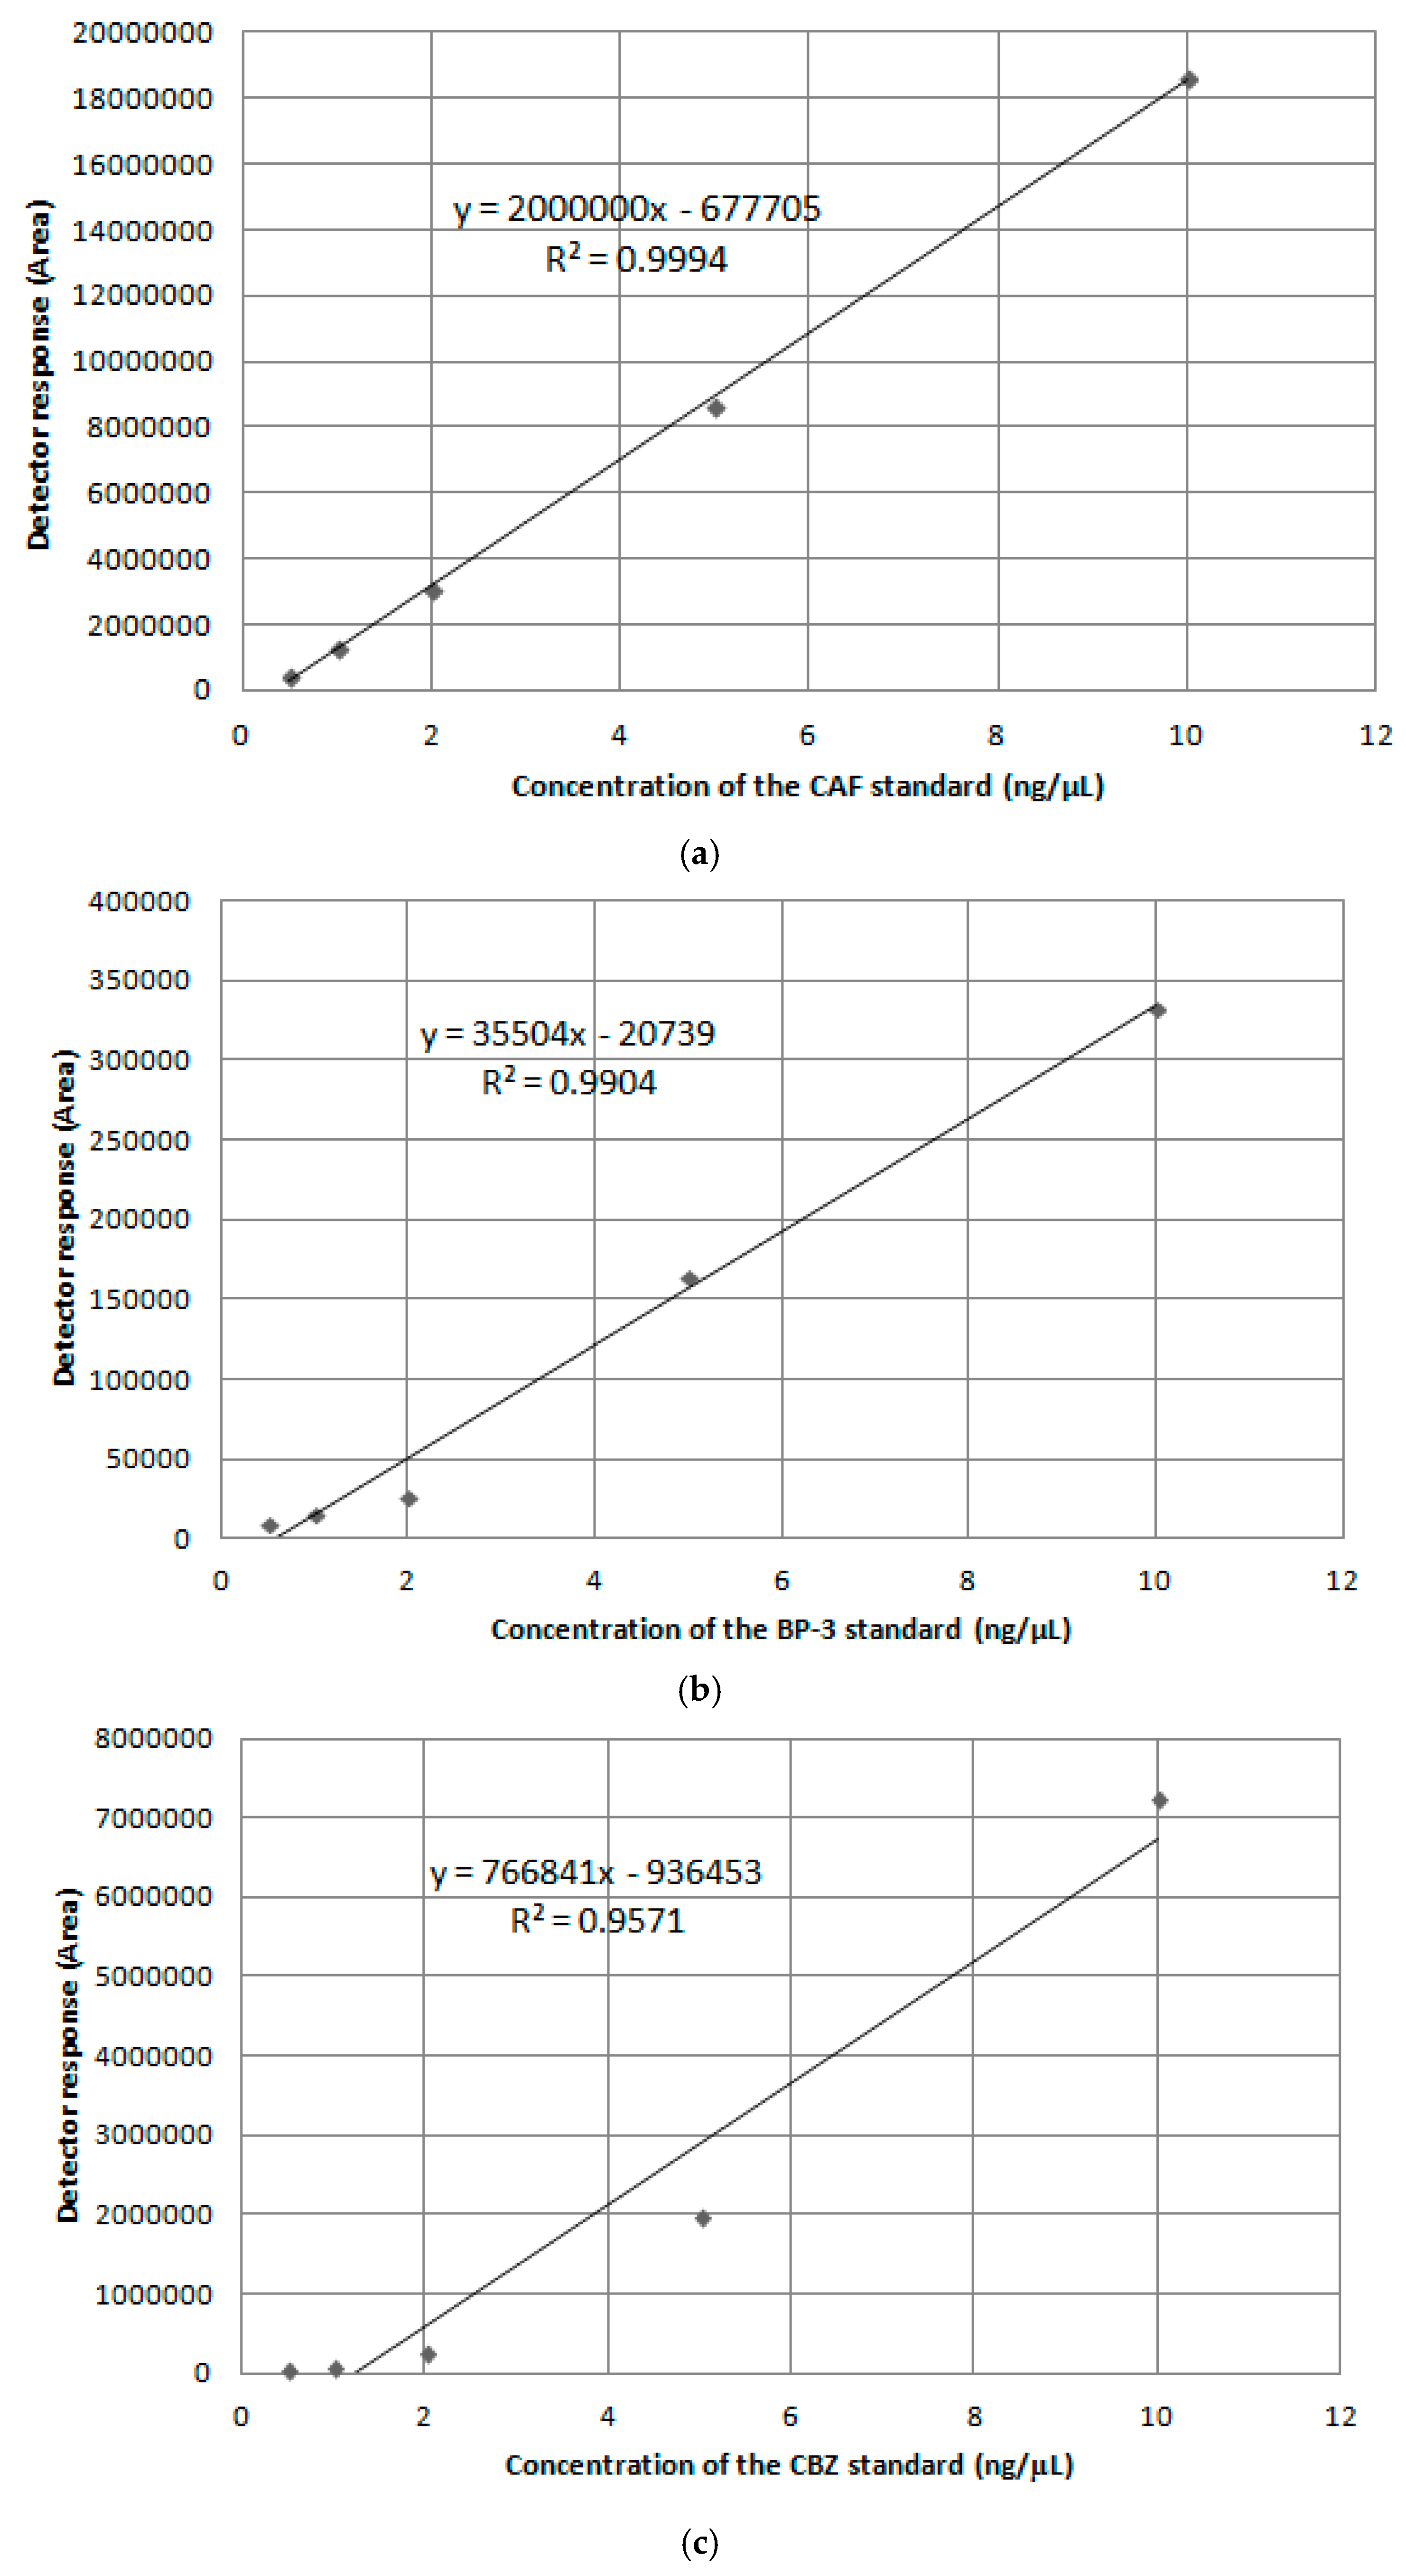
| Standard | tR ± SD | R2 | a | Sa | b | Sb |
|---|---|---|---|---|---|---|
| CAF | 19.37 ± 0.01 | 0.99 | 2,000,000 | 316,802 | −677,705 | 459,921 |
| BP-3 | 22.46 ± 0.02 | 0.99 | 35,504 | 2019 | −20,739 | 2931 |
| CBZ | 24.19 ± 0.02 | 0.95 | 766,841 | 295,337 | 936,453 | 428,759 |
| Standard | CV (%) | LOD (ng/L) | ||||
|---|---|---|---|---|---|---|
| 0.5 ng/μL | 1.0 ng/μL | 2.0 ng/μL | 5.0 ng/μL | 10.0 ng/μL | ||
| CAF | 0.66 | 1.39 | 1.81 | 1.67 | 2.25 | 0.02 |
| BP-3 | 1.32 | 1.41 | 2.28 | 2.08 | 0.95 | 0.02 |
| CBZ | 2.81 | 2.89 | 2.68 | 1.59 | 1.66 | 0.10 |
| Solvents | SPE Tube Type | Parameter | CAF | BP-3 | CBZ |
|---|---|---|---|---|---|
| Methanol | ENVI-8 | Recovery (%) | 88.6 | 100 | 100 |
| LOQ (ng/L) | 0.63 | 2.78 | 1.51 | ||
| ENVI-18 | Recovery (%) | 100 | 100 | 100 | |
| LOQ (ng/L) | 0.57 | 2.07 | 1.18 | ||
| LC-8 | Recovery (%) | 79.8 | 83.5 | 66.2 | |
| LOQ (ng/L) | 0.66 | 2.40 | 1.77 | ||
| LC-18 | Recovery (%) | 95.4 | 75.3 | 100 | |
| LOQ (ng/L) | 0.91 | 4.07 | 2.08 | ||
| LC-CN | Recovery (%) | 40.6 | 100 | 100 | |
| LOQ (ng/L) | 3.23 | 3.39 | 1.69 | ||
| LC-Ph | Recovery (%) | 100 | 100 | 72 | |
| LOQ (ng/L) | 0.81 | 2.56 | 2.03 | ||
| Acetonitrile | ENVI-8 | Recovery (%) | 82.7 | 100 | 93 |
| LOQ (ng/L) | 0.37 | 1.82 | 1.26 | ||
| ENVI-18 | Recovery (%) | 85.1 | 82.2 | 100 | |
| LOQ (ng/L) | 0.43 | 2.31 | 1.18 | ||
| LC-8 | Recovery (%) | 100 | 100 | 94.2 | |
| LOQ (ng/L) | 1.27 | 7.19 | 4.29 | ||
| LC-18 | Recovery (%) | 99.3 | 78.6 | 100 | |
| LOQ (ng/L) | 1.12 | 8.06 | 3.62 | ||
| LC-CN | Recovery (%) | 27.6 | 100 | 82.5 | |
| LOQ (ng/L) | 1.14 | 1.52 | 1.06 | ||
| LC-Ph | Recovery (%) | 100 | 73.7 | 92.5 | |
| LOQ (ng/L) | 0.25 | 2.04 | 1.04 | ||
| Methanol + Acetonitrile | ENVI-8 | Recovery (%) | 97 | 100 | 85 |
| LOQ (ng/L) | 2.40 | 3.68 | 3.31 | ||
| ENVI-18 | Recovery (%) | 100 | 100 | 100 | |
| LOQ (ng/L) | 0.84 | 0.95 | 0.87 | ||
| LC-8 | Recovery (%) | 86.2 | 100 | 90 | |
| LOQ (ng/L) | 0.77 | 1.10 | 1.24 | ||
| LC-18 | Recovery (%) | 100 | 100 | 100 | |
| LOQ (ng/L) | 0.82 | 2.62 | 2.51 | ||
| LC-CN | Recovery (%) | 36.7 | 85.7 | 77.7 | |
| LOQ (ng/L) | 7.58 | 9.52 | 10.64 | ||
| LC-Ph | Recovery (%) | 100 | 100 | 100 | |
| LOQ (ng/L) | 2.92 | 7.35 | 9.52 |
| Matrix | Recovery ± SD (%) | ||
|---|---|---|---|
| CAF | BP-3 | CBZ | |
| Deionized water | 100 ± 2.4 | 100 ± 9.9 | 100 ± 10.0 |
| Tap water | 92.5 ± 2.8 | 95.7 ± 1.2 | 98.4 ± 8.2 |
| Swimming pool water | 100 ± 2.2 | 100 ± 5.9 | 100 ± 5.4 |
| Matrix | LOQ (ng/L) | ||
|---|---|---|---|
| CAF | BP-3 | CBZ | |
| Deionized water | 0.84 | 0.95 | 0.87 |
| Tap water | 0.78 | 0.88 | 0.83 |
| Swimming pool water | 0.69 | 0.75 | 0.71 |
Publisher’s Note: MDPI stays neutral with regard to jurisdictional claims in published maps and institutional affiliations. |
© 2018 by the authors. Licensee MDPI, Basel, Switzerland. This article is an open access article distributed under the terms and conditions of the Creative Commons Attribution (CC BY) license (https://creativecommons.org/licenses/by/4.0/).
Share and Cite
Lempart, A.; Kudlek, E.; Dudziak, M. Determination of Micropollutants in Water Samples from Swimming Pool Systems. Proceedings 2018, 2, 177. https://doi.org/10.3390/ecws-2-04946
Lempart A, Kudlek E, Dudziak M. Determination of Micropollutants in Water Samples from Swimming Pool Systems. Proceedings. 2018; 2(5):177. https://doi.org/10.3390/ecws-2-04946
Chicago/Turabian StyleLempart, Anna, Edyta Kudlek, and Mariusz Dudziak. 2018. "Determination of Micropollutants in Water Samples from Swimming Pool Systems" Proceedings 2, no. 5: 177. https://doi.org/10.3390/ecws-2-04946
APA StyleLempart, A., Kudlek, E., & Dudziak, M. (2018). Determination of Micropollutants in Water Samples from Swimming Pool Systems. Proceedings, 2(5), 177. https://doi.org/10.3390/ecws-2-04946