Abstract
Miniaturization of devices for analysis of chemical composition is being still developed. In this article we present a portable device with a microplasma excitation source. The microdischarge is ignited inside a ceramic structure between a solid anode and a liquid cathode. As a result of cathode sputtering of the solution, it is possible to determine its chemical specimens by analysis of emission spectra of the microdischarge. We fabricated cathodes with a microfluidic compartment and two types of anodes. Devices were tested experimentally. Spectroscopic properties of the microdischarge and its analytical performance depended on the used ceramic structure, the surface area of the cathode aperture and the flow rate of the solution.
1. Introduction
One of the most efficient excitation source for optical emission spectrometry (OES) analysis is atmospheric pressure plasma. However, typically used bulky inductively coupled plasma (ICP) requires to be cooled and commonly consumes a lot of power and gases. One of the alternatives is atmospheric pressure glow discharge (APGD). However, there is a problem with destructive impact of high temperature of such discharge on metallic electrodes. Therefore one or both of them could be covered by analyzed liquids [1]. Microplasma can be generated in reactors made in different micromechanical technologies. One of them is low temperature cofired ceramics (LTCC). Materials achieved with this technology exhibit very good performance in harsh environments, especially high temperatures and high voltages [2]. Nevertheless, microplasma can still degrade the surface of LTCC structures and included electrodes.
In this work we present modular devices with LTCC parts. DuPont 951 ceramic was used. The idea of operation of the microdischarge device is given in Figure 1. Microplasma is formed between the solid anode and the liquid cathode, which is the analyzed solution containing analytes (Zn, Cd). Atoms of analytes are transported to the microdischarge phase and excited therein. Their emitted radiation at specific wavelengths is acquired by a spectrometer. For easier operation and proper alignment of the microdischarge, ceramic structures are put inside a polymeric housing (Figure 2).
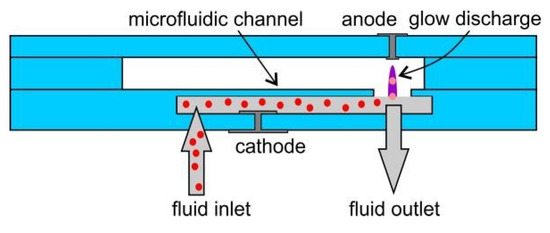
Figure 1.
Principles of chip operation.
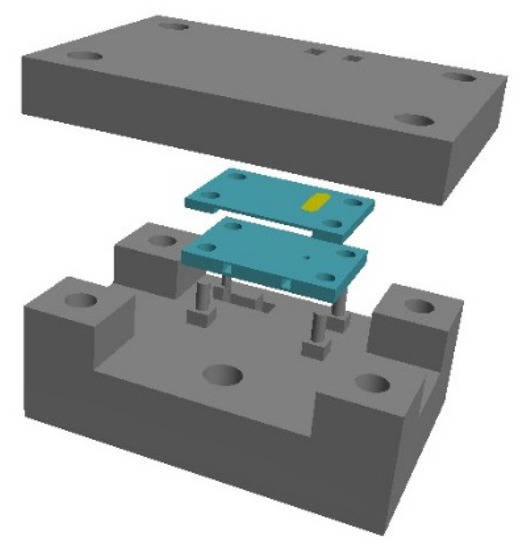
Figure 2.
Exploded view of the device.
2. Materials and Methods
Consecutive layers of the cathode and both anodes are given in Figure 3. The cathode consisted of 9 layers. The external gold electrode was placed at the bottom of the layer no. 1. It was connected with the internal cathode made of platinum. In layers nos. 4–7, microfluidic channel was placed. The structure was covered by two additional layers with an cathode aperture, where plasma had contact with the analyzed sample. One type of anodes consisted of two layers with internal and external electrodes (type 1, see Figure 4). In the second type, the electrode was made of tungsten wire placed inside the ceramic structure (Figure 5). Both structures were made in the standard LTCC process. Only lamination was modified to avoid sagging of the microfluidic channels. Ceramic structures were placed in a polymeric housing made in 3D printing technology (Zortrax M200 3D printer).
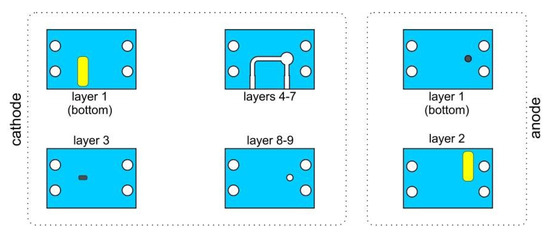
Figure 3.
Consecutive layers of ceramic cathode and anode.
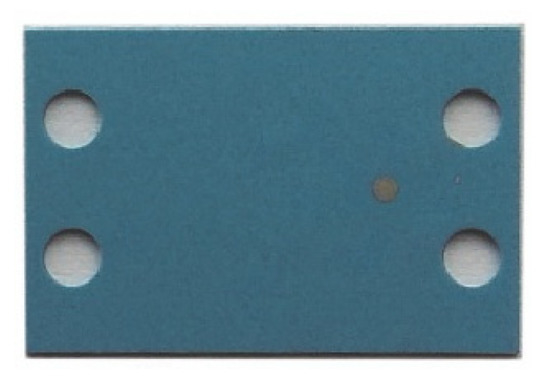
Figure 4.
Anode with screen-printed electrodes (type 1).
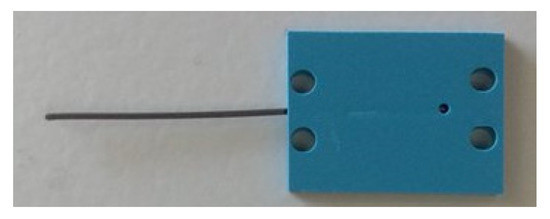
Figure 5.
Anode with solid tungsten electrode (type 2).
Performance of the device was examined experimentally. The measurement setup consisted of a Reglo Ismatec ICC peristaltic pump, a working gas container with a rotameter, high voltage direct or alternating current suppliers and a spectrometer (Shamrock 500i) with a CCD detector (Newton DU-920-OE). The spectrometer had two diffraction gratings: 1800 lines/mm for the UV range and 1200 lines/mm for the Vis range. The analyzed sample was a 0.1 M HNO3 solution with 10 mg/L of Zn and Cd. Both DC- and AC-driven microdischarges could be operated in fabricated ceramic structures. However, the AC-driven microdischarge was more stable, therefore, it was used in the next experiments.
3. Results
In the device with the anode type no. 1, the microdischarge was unstable and both electrodes degraded very fast. The device with the anode type no. 2 was operated without any significant deteriorations. Emission spectra of this system were acquired in different conditions. Atomic emission lines of Zn and Cd at 213.9 and 228.8, respectively, were identified (Figure 6). We checked the effect of different flow rates of the analyzed solution (from 1 to 4 mL/min) and diameter of the cathode aperture (1.0 and 1.5 mm) on values of detection limits (DLs) of Zn and Cd. The results are given in the Table 1.
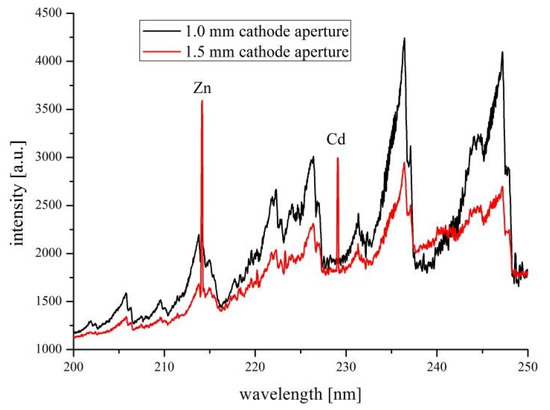
Figure 6.
Emission spectra of APGD operated in the ceramic structure with the anode type no. 2—the effect of the cathode aperture diameter.

Table 1.
Comparison of detection limits (DLs) obtained in the device operated in different conditions.
4. Discussion
As might be observed, lower values of DLs of Zn and Cd can be achieved when the flow rate of the analyzed solution decreases. In these conditions, higher amounts of analytes are sputtered into the microdischarge phase and higher sensitivities of atomic emission lines of Zn and Cd could be obtained. Since for a narrow cathode aperture (1.0 mm), higher power density was achieved, molecular bands observed in the range 200–250 nm were more intense. It was in general deteriorating for detectability of Zn, which analytical line interferes with the NO molecular band in this spectral range. It was not the case of Cd, which line was not interfered by the molecular spectra, hence, both apertures could be used for measurements of this metal. In Table 2 we present comparison of obtained DLs in our devices and ones from the literature.

Table 2.
Comparison of DLs presented in the literature and obtained in the device.
5. Summary
We presented the portable device for determination of selected metals (e.g., Zn, Cd) in solutions. The device was based on microAPGD and acquisition of its emitted radiation by OES. The microdischarge was ignited between the solid anode and the flowing liquid cathode. Anodes and the microfluidic compartment within the cathode were made in LTCC technology. The ceramic structures were placed in a polymeric housing made in 3D printing technology. The AC-driven microAPGD system appeared to be the most stable. When a solution of 0.1 M HNO3 with 10 mg/L of Zn and Cd were introduced to the system, it was possible to quantitatively measure both metals using their analytical lines at 214 and 229 nm, respectively. At the optimal experimental conditions, values of DLs of Zn and Cd were 0.14 and 0.053 mg/L, respectively, which was comparable or better than DLs reported by other researchers. During all experiments, cathodes exhibited satisfying reliability. Screen-printed anodes were etched by the microplasma, but the solid tungsten anode exhibited better reliability.
Author Contributions
T.M., J.M. and L.G. designed ceramic structures and planned all experiments. Analyzed samples were prepared by T.M. The article was written by T.M. and J.M. P.J. and K.S. made spectroscopic measurements and took part in the discussion. P.P. discussed spectroscopic properties of the microdischarge.
Funding
This research was funded by the National Science Centre (grant no. 2016/21/N/ST7/01618) and by the Wroclaw University of Science and Technology (statutory activity).
Conflicts of Interest
The authors declare no conflict of interest.
References
- Webb, M.R.; Andrade, F.J.; Gamez, G.; Crindle, R.M.; Hieftje, G.M. Spectroscopic and electrical studies of a solution-cathode glow discharge. J. Anal. At. Spectrom. 2005, 20, 1218–1225. [Google Scholar] [CrossRef]
- Kita, J.; Engelbrecht, A.; Schubert, F.; Groß, A.; Rettig, F.; Moos, R. Some practical points to consider with respect to thermal conductivity and electrical resistivity of ceramic substrates for high-temperature gas sensors. Sens. Actuator B-Chem. 2015, 213, 541–546. [Google Scholar] [CrossRef]
- Jamroz, P.; Greda, K.; Pohl, P. Development of direct-current, atmospheric-pressure, glow discharges generated in contact with flowing electrolyte solutions for elemental analysis by optical emission spectrometry. Trends Anal. Chem. 2012, 41, 105–121. [Google Scholar] [CrossRef]
- Schwartz, A.J.; Ray, S.J.; Chan, G.C.Y.; Hieftje, G.M. Spatially resolved measurements to improve analytical performance of solution-cathode glow discharge optical-emission spectrometry. Spectrochim. Acta B 2016, 125, 168–176. [Google Scholar] [CrossRef]
- Kim, H.J.; Lee, J.H.; Kim, M.Y.; Cserfalvi, T.; Mezei, P. Development of open-air type electrolyte-as-cathode glow discharge-atomic emission spectrometry for determination of trace metals in water. Spectrochim. Acta B 2000, 55, 823–831. [Google Scholar] [CrossRef]
- Cserfalvi, T.; Mezei, P. Direct solution analysis by glow discharge: Electrolyte cathode discharge spectrometry. J. Anal. At. Spectrom. 1994, 9, 345–349. [Google Scholar] [CrossRef]
Publisher’s Note: MDPI stays neutral with regard to jurisdictional claims in published maps and institutional affiliations. |
© 2018 by the authors. Licensee MDPI, Basel, Switzerland. This article is an open access article distributed under the terms and conditions of the Creative Commons Attribution (CC BY) license (https://creativecommons.org/licenses/by/4.0/).