Abstract
Water use efficiency is a crucial issue in drinking water utilities as it is connected to environmental and economic consequences. WATenERgy CYCLE project aims at developing a methodological approach towards efficient and effective transnational water and energy resources management in the Balkan–Mediterranean area. The paper presents the results of performance evaluation of the water supply systems of the water utilities involved in the project, both at local and national level. The methodology used in the water balance and performance indicators as well as data on the operational status of the water supply systems. The results showed that Non-Revenue Water is one of the major problems addressed.
1. Introduction
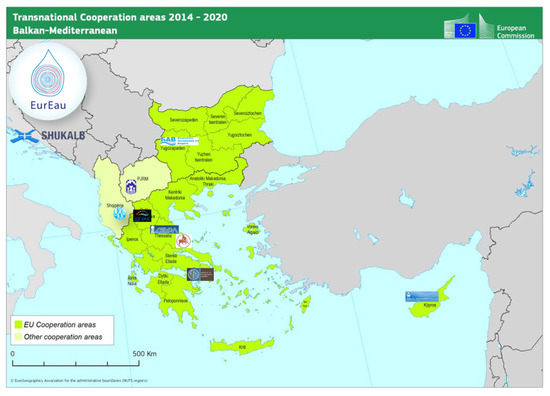
The concept of water as a public good is one of the integrated water resources management key pillars: to ensure fresh water for all uses, an integrated approach to managing and equitably sharing the world’s limited water resources is necessary. Water Framework Directive (WFD) 2000/60/EC requires that all water resources in the EU territory will be in good status. As the second cycle of the WFD implementation has already started since 2015, it is interesting to assess the current status of water resources used for drinking purposes in the Balkan Mediterranean area. Managing water resources for drinking purposes is a complex issue, requiring the adoption of immediate measures, in order to address the high level of vulnerability under climate change conditions (long term under-investment, aging infrastructure/facilities in the water supply cycle) [1,2,3]. WATenERgy CYCLE project (“Urban water full cycle: from its source to its end-users and back to the environment”) aims at developing a common methodological approach towards efficient and effective transnational water and energy resources management. The project’s common challenge is to increase the current low level of innovative technologies use along the water supply chain, from the water’s source to its end-users and back to the environment along with the increase in climate change resilience. WATenERgy CYCLE is a valuable and unique joint-tool for the design, preparation and implementation of an integrated multi-level approach in the urban (short term), rural and industrial (midterm) environment, promoting a Europe of worth living solidarity. The project’s approach is a synergy of three (3) EU member states and two (2) Instrument for Pre-Accession Assistance (IPA) countries, due to common river basin management, WFD implementation strategy and climate change vulnerability, promoting a holistic approach, raising a number of shared technical challenges. Eight partners from five countries (Greece; Bulgaria; Cyprus; Republic of Albania and the former Yugoslav Republic of Macedonia) are involved in the project, namely: the Municipal Enterprise for water supply and sewerage of Larissa (DEYAL); the Special Secretariat for Water (Ministry of Environment and Energy–SSW); the municipal enterprise of water supply and sewerage of Kozani (DEYAK); the University of Thessaly (dept. of Civil Engineering); the Joint Stock Company Water Supply and Sewerage Korce (UKKO); the Water Board of Nicosia (WBN); the Bulgarian Water Association (BWA); and the Public Communal Enterprise Water supply and Sewerage-Prilep (JKP ViK Prilep) (Figure 1). Additionally, two more partners are involved as observers, EurEau (European Association of National Associations of Water Utilities) at EU level and SHUKALB (Albania’s association of Water Supply & Sewerage Utilities) at IPA level.

Figure 1.
WATenERgy CYCLE partners within the context of Balkan Med programme.
2. The WATenERgy CYCLE Project
WATenERgy project started in September 2017 and will be concluded in August 2019. Its main activities can be summarized as follows: management and coordination of the project; communication and dissemination activities; transnational current situation analysis; development of common methodology and tools; pilot actions implementation; and development of transnational strategy, policy recommendation and sustainability. Transnational current situation analysis (national and local level) includes climate change impacts assessment presenting transnational climate characteristics and climate change scenarios and also impacts of climate change on water and energy resources efficiency. The same activity also includes the assessment of the current status of the water supply systems (WSSs) regarding water and energy efficiency. The assessment of WSSs current status also includes the identification of full water cost (FWC) recovery rates. The common methodological framework is evolved in the next activity. All partners will be involved in the development a joint water pricing under FWC recovery methodology. The same activity also includes the development/adaptation of a methodology for water use efficiency (reduction of water volumes entering the network, revenue water increase, Non-Revenue water (NRW) decrease, water consumers conservative use). Within this activity an energy recovery methodology and best practices are included, as energy efficiency along the entire water supply chain, from the water resource to the end users and to its disposal, is one of the main concerns of water utilities. All water utilities will implement pilot actions. The ex-ante evaluation of each pilot case will identify specific problems and measure the related parameters. The pilot actions include water or energy efficiency measures such as the installation of an energy recovery system for the central pumping station, the installation of an automated meter reading system (AMRs, mobile reading systems, software); the supply of a leak detection car and equipment, the installation of pressure reduction valves (PRVs) and smart water meters. To disseminate the pilot activities and their results, technical visits will take place. Finally, the last activity includes the development of a transnational strategy, policy recommendation and sustainability action plan regarding water pricing and efficiency and energy recovery across the water supply chain.
The first technical phase of the project refers to the transnational current situation analysis and assessment regarding climate change, water and energy efficiency and implementation of water pricing policies. The phase of current situation analysis was implemented during the first six months of the project and this paper aims at presenting the results regarding water efficiency assessment.
3. Water Use Efficiency
The assessment of the current situation analysis regarding water use efficiency was performed both at national and regional/local level. All partners were involved in this activity. The partners had to provide specific data regarding their national and regional/local water supply systems, depending on their role (national or local organizations).
At national level general data were gathered regarding the population, area covered and population density of each country, the gross national product (GDP), water demand in total and per water use. To evaluate WSSs operational status, data regarding NRW level and benchmarking initiatives were gathered. Also, the existence and use of SCADA (supervisory control and data acquisition) systems, hydraulic simulation models, GIS (geographic information systems) tools, formation of pressure zones and district metered areas (DMAs) were also investigated at national level.
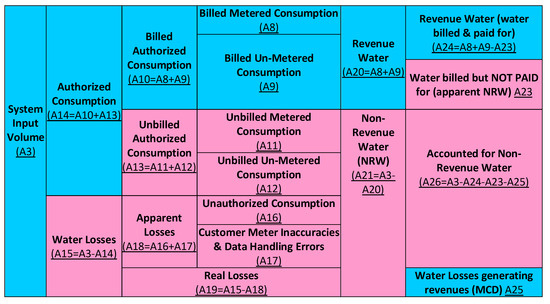
At regional/local level the networks’ current (operation, control and monitoring) status was initially assessed identifying the use of SCADA systems, pressure zones, hydraulic simulation models and maintenance policies. The partners were asked to identify the major problems of their networks and the actions taken to confront with these problems. Then the partners were asked to estimate the Water Balance for their WSSs. In particular, the second modified water balance was suggested (Figure 2) [4] and the WB/PI Calc-UTH water audit tool was provided to them. Selected performance indicators were also estimated and reported.

Figure 2.
Second modified WB [4].
The second modified WB is based on the IWA International Standard WB introduced by Lambert et al. [5] and incorporates the first proposed modification by McKenzie et al. [6]. It also introduces “Minimum Charge Difference” (Figure 2) which is water losses generating revenues, showing that water utilities consider that NRW values are lower than the actual ones (Accounted for NRW compared to NRW). This concept is based on the fixed charge the water utilities charge to their consumers regardless their water consumption [7]. Several performance indicators were also estimated by the partners involved. The IWA performance indicators are taken into consideration [8,9].
4. Results and Discussion
4.1. National Level
Five countries are involved through the participation of the related partners in WATenERgy CYCLE project: Greece, Cyprus, Bulgaria, Republic of Albania and the former Yugoslav Republic of Macedonia (FYROM). General data about the countries are given from the partners reports and can be summarized in Table 1. In Greece and FYROM the major water user is agriculture, while in Bulgaria industry is the major consumer and in Rep. of Albania households.

Table 1.
Data of the countries involved in WATenERgy CYCLE project.
4.1.1. WSS Evaluation Performance Assessment at National Level
Trying to investigate the current situation of WSSs in terms of water losses, the partners were asked to provide data for their countries, at national level. Albania and Bulgaria are the only countries where a benchmarking process regarding NRW and water losses takes place. In Albania, Water Regulatory Authority (WRA) performs benchmarking activities every six months, asking water utilities to estimate their WB. However, the achieved results are questioned for their reliability. NRW level in Albania range from 27% to 79% of System Input Volume (SIV) in utilities with more than 15,000 connections. In average NRW is almost stable to 67% of SIV since 2013. The main cause for high NRW levels is administrative losses caused by illegal connections and meter inaccuracies (58% of NRW in 2016), while real losses account for 42% (of NRW). Only 56% of the amount of water produced is measured, and most companies do not have water meters in production. Thus, the assessment of water losses cannot be realistic and the necessity of installing reliable water meters especially in production is urgent.
In Bulgaria, the Regulatory benchmarking report for 2009–2016 from Energy and Water Regulation Commission (EWRC) has estimated the level of NRW and water losses at national level. NRW at national level has been estimated to 60.76% for 2016. The distribution networks are in poor conditions and there is a lack of sources for their rehabilitation. Very few of the water supply operators apply an integrated approach to assets management and good international practices for the management of the WSSs and reduction of NRW. Most of the funds are used for the rehabilitation of the distribution networks. Indicatively, two of the greatest water utilities in the country reported NRW levels of 49.8% and 41.9% (Sofiyska voda and Vik Russe respectively).
In Greece there are no available national data on NRW levels. Lately, Special Secretariat for Water (SSW) has established an internet database (http://wsm.ypeka.gr/login.html) where all water utilities have to report specific indicators, apart from cost and cost recovery indicators. There is not a national benchmarking tool for performance indicators so far.
In FYROM there is not a benchmarking process for NRW estimation and PIs. The only PIs estimated at national level are the water supply provision, consumer satisfaction and affordability of tariffs.
4.1.2. WSS Operational Status Assessment at National Level
Regarding the operational status of the WSSs at national level, in all countries there are utilities with SCADA systems. Also, many utilities divide their networks to pressure zones. In Albanian water utilities there are no DMAs formed, while in Greek and Bulgarian water utilities there are. Hydraulic simulation models are used in Greek and Bulgarian water utilities. There are not enough data for FYROM.
In Greece, a research of the Hellenic Association of Municipal Water and Sewerage Companies (EDEYA) revealed that 61.2% of water utilities have SCADA systems, 23.9% have GIS, and 13.4% of them use hydraulic simulation models.
4.2. Regional/Local Level
At regional/local level, the current performance and the operational status of the WSSs involved in the project are assessed. The results refer to five (5) water utilities from 4 countries (Greece, Albania, FYROM and Cyprus). General data of the water utilities studied are presented in Table 2.

Table 2.
General information for the Water Utilities studied.
The water utility serving most people is WBN (Nicosia, Cyprus), followed by DEYAL (Larisa, Greece) and UKKO (Korca, Albania). DEYAL has the longest pipe network (1078 Km of pipes). The average operating pressure ranges from 1.7 (WBN) to 6.0 atm (UKKO). The billing period differs from utility to utility from one month (JKP Vik Prilep and UKKO) to 4 months (DEYAK). In general, the water utilities involved have different characteristics.
4.2.1. Network’s Current (Operation, Control and Monitoring) Status
The current status of the operation, control and monitoring of the water utilities is assessed. The water utilities provided information about the existence of pressure zones, DMAs, SCADA system, simulation model and maintenance policy. They also provided information about the major problems they are facing, and the actions taken to improve their operational performance.
From the data gathered, in all water utilities the distribution network is divided in pressure zones. Only UKKO’s network is not divided in DMAs. In DEYAL there is one DMA formed, in DEYAK also there is one DMA formed but the water utility has performed a study to divide its network to DMAs. The division to DMAs in DEYAK has started and will be concluded in the future. The water distribution network of WBN is divided in 26 DMAs and 70 subzones. All water utilities have SCADA systems, monitoring pressure and flow at external aqueduct and within the water distribution system. All water utilities have developed simulation models, but it is not operational in JKP Vik Prilep. The main problems identified include high NRW due to high pressure or due to leaks and breaks in mains and service connections. Old water meters are also identified as a problem in some cases. The water managers in these water utilities have taken some measures such as replacement of old water meters; PRVs installation and pressure management; replacement of service connections; speed and quality of repairs; and monitoring and detection of leaks.
4.2.2. Water Balance and PIs Assessment for the Water Distribution Network
The assessment of Water Balance is done in all water utilities. Most of them used the 2nd modified WB while UKKO used the Standard IWA WB. The WB assessment results are shown in Table 3.

Table 3.
Water Balance components in water utilities.
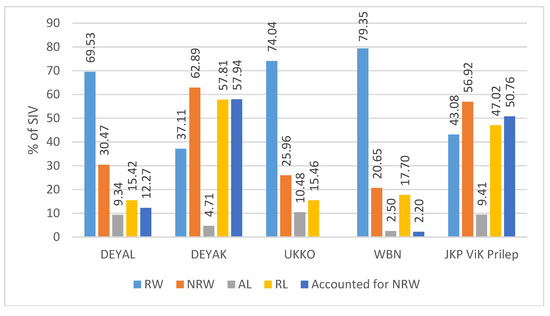
The results showed that NRW levels range from 20.65% of SIV in WBN to 62.89% of SIV in DEYAK (Figure 3). Apparent Losses per SIV range from 2.50% in WBN to 10.48 in UKKO (Figure 3). However, it must be stressed that apparent losses are estimated using hypotheses [10]. Real Losses are the major part of NRW, ranging from 50.6% of NRW (DEYAL) to 91.9% (DEYAK). The use of the 2nd modified WB revealed that although NRW values are high (20.65–62.89%), due to the fixed charge existing in water bills, accounted-for-NRW levels range from 2.20% of SIV (WBN) to 57.94% (DEYAK). Such results can be misunderstood by the water operators, claiming that the NRW levels are lower than the actual ones [7].

Figure 3.
WB components estimated for all water utilities in % of SIV.
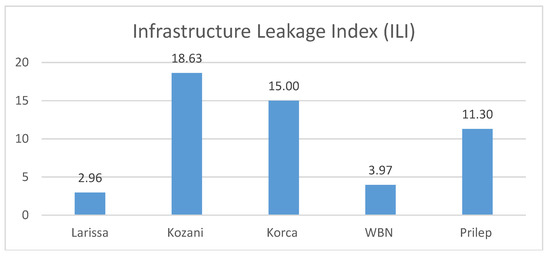
Performance indicators have been also estimated in all water utilities (Table 4). The results showed that real losses per connection range from 22.47 L/connection/day (UKKO) to 472.72 (DEYAK) while real losses per mains length range from 4.21 m3/km/day (UKKO) to 46.97 (DEYAK). ILI values range from 2.96 (DEYAL) to 18.63 (DEYAK) (Figure 4).

Table 4.
PIs in water utilities involved.

Figure 4.
ILI values for all water utilities.
5. Conclusions
WATenERgy CYCLE project aims at developing a common methodological approach towards efficient and effective transnational water and energy resources management. The water–energy nexus is a well-known concept, existing within the water cycle. Water brings quite an important amount of energy as it has been pumped and pressurized to circulate within the WSSs. Also, energy is lost due water leaks and friction losses within the WSSs. The first part of the project is to assess the current status of the water supply systems involved not only at local level but at national level as well. Through WATenERgy CYCLE data for four countries are gathered (Greece; Bulgaria; Albania and FYROM) regarding WSSs performance in terms of water losses and NRW and their operational status. Almost the same operational status exists in all countries. In terms of their WSSs performance evaluation only some of them use benchmarking schemes to gather data at national level. In general, NRW levels are high and in some countries the infrastructure is old causing many problems to the water utilities operation. The analysis and assessment at local level was done gathering data from the five water utilities involved in the project, representing all five countries. More or less, the operational status of the WSSs studied is the same in terms of use of SCADA systems, simulation models, division of the network to DMAs, etc. All of them identified high NRW levels as a major problem with different causes depending on the WSS (e.g., high pressure, old water meters, frequent leaks, etc.). The WB analysis verified that NRW levels are high and showed that real losses are its major part. However, all water utilities agreed that more reliable data need to be used.
Acknowledgments
This work is elaborated through a project co-funded by the European Union and National funds of the participating countries of the “Balkan-Mediterranean 2014–2020” programme (project acronym WATenERgy CYCLE, BMP1/2.2/2181/2017).
Conflicts of Interest
The authors declare no conflict of interest.
References
- Kanakoudis, V.; Tsitsifli, S.; Papadopoulou, A.; Cencur Curk, B.; Karleusa, B. Estimating the Water Resources Vulnerability Index in the Adriatic Sea Region. Procedia Eng. 2016, 162C, 476–485. [Google Scholar] [CrossRef]
- Kanakoudis, V.; Tsitsifli, S.; Papadopoulou, A.; Cencur Curk, B.; Karleusa, B. Water Resources Vulnerability Assessment in Adriatic Sea region: The case of Corfu Island. Environ. Sci. Pollut. Res. 2017, 24, 20173–20186. [Google Scholar] [CrossRef]
- Kanakoudis, V.; Papadopoulou, A.; Tsitsifli, S.; Altran, E.; Cencur Κurk, B.; Karleusa, B.; Matic, B.; Banovec, P. Policy recommendation for drinking water supply cross-border networking in the Adriatic region. J. Water Supply Res. Technol. AQUA 2017, 66, 489–508. [Google Scholar] [CrossRef]
- Kanakoudis, V.; Tsitsifli, S. Water volume vs. revenues oriented water balance calculation for urban water networks: The “Minimum Charge Difference” component makes a difference! In Proceedings of the IWA International Conference ‘WaterLoss2010’, Sao Paolo, Brazil, 6–9 June 2010. [Google Scholar]
- Lambert, A.; Brown, T.; Takizawa, M.; Weimer, D. Review of Performance Indicators for Real Losses from Water Supply Systems. J. Water Supply Res. Technol. AQUA 1999, 48, 227–237. [Google Scholar] [CrossRef]
- McKenzie, R.; Seago, C.; Liemberger, R. Benchmarking of Losses from potable water reticulation systems-Results from IWA Task Team. In Proceedings of the IWA International Conference ‘WaterLoss2007’, Bucharest, Romania, 23–26 September 2007; pp. 161–175. [Google Scholar]
- Kanakoudis, V.; Tsitsifli, S.; Kouziakis, C.; Lappos, S. Defining the level of the Non-Revenue Water in the city of Kozani, Greece: Is it a typical case? Desalin. Water Treat. 2015, 54, 2170–2180. [Google Scholar] [CrossRef]
- Alegre, H.; Baptista, J.M.; Cabrera, E., Jr.; Cubillo, F.; Duarte, P.; Hirner, W.; Merkel, W.; Parena, R. Performance Indicators for Water Supply Services, 3rd ed.; IWA Publishing: London, UK, 2006. [Google Scholar]
- Farley, M.; Trow, S. Losses in Water Distribution Networks, 1st ed.; IWA Publishing: London, UK, 2003. [Google Scholar]
- Xin, K.; Tao, T.; Lu, Y.; Xiong, X.; Li, F. Apparent losses analysis in district metered areas of water distribution systems. Water Resour. Manag. 2014, 28, 683–696. [Google Scholar] [CrossRef]
Publisher’s Note: MDPI stays neutral with regard to jurisdictional claims in published maps and institutional affiliations. |
© 2018 by the authors. Licensee MDPI, Basel, Switzerland. This article is an open access article distributed under the terms and conditions of the Creative Commons Attribution (CC BY) license (https://creativecommons.org/licenses/by/4.0/).