
Nitrogen Cycling in Widgeongrass and Eelgrass Beds in the Lower Chesapeake Bay


Abstract
1. Introduction
2. Methods
3. Results
4. Discussion
5. Conclusions
Author Contributions
Funding
Data Availability Statement
Acknowledgments
Conflicts of Interest
References
- Poloczanska, E.S.; Burrows, M.T.; Brown, C.J.; García Molinos, J.C.; Halpern, B.S.; Ehoegh-Guldberg, O.; Kappel, C.V.; Moore, P.J.; Richardson, A.J.; Schoeman, D.S.; et al. Responses of Marine Organisms to Climate Change across Oceans. Front. Mar. Sci. 2016, 3, 62. [Google Scholar] [CrossRef]
- Pinsky, M.L.; Selden, R.L.; Kitchel, Z.J. Climate-Driven Shifts in Marine Species Ranges: Scaling from Organisms to Communities. Annu. Rev. Mar. Sci. 2019, 12, 153–179. [Google Scholar] [CrossRef] [PubMed]
- Moore, K.A.; Jarvis, J.C. Estuarine Seagrass and Climate Change. In Climate Change and Estuaries; Kennish, H., Paerl, J.C., Eds.; CRC Press: Boca Raton, Fl, USA, 2024; pp. 401–430. [Google Scholar]
- Vergés, A.; Steinberg, P.D.; Hay, M.E.; Poore, A.G.B.; Campbell, A.H.; Ballesteros, E.; Heck, K.L.; Booth, D.J.; Coleman, M.A.; Feary, D.A.; et al. The Tropicalization of Temperate Marine Ecosystems: Climate-Mediated Changes in Herbivory and Community Phase Shifts. Proc. R. Soc. B Biol. Sci. 2014, 281, 20140846. [Google Scholar] [CrossRef] [PubMed]
- Wernberg, T.; Bennett, S.; Babcock, R.C.; de Bettignies, T.; Cure, K.; Depczynski, M.; Dufois, F.; Fromont, J.; Fulton, C.J.; Hovey, R.K.; et al. Climate-driven regime shift of a temperate marine ecosystem. Science 2016, 353, 169–172. [Google Scholar] [CrossRef] [PubMed]
- Thomson, J.A.; Burkholder, D.A.; Heithaus, M.R.; Fourqurean, J.W.; Fraser, M.W.; Statton, J.; Kendrick, G.A. Extreme temperatures, foundation species, and abrupt ecosystem change: An example from an iconic seagrass ecosystem. Glob. Chang. Biol. 2015, 21, 1463–1474. [Google Scholar] [CrossRef] [PubMed]
- Hyndes, G.A.; Heck, K.L.; Vergés, A.; Harvey, E.S.; Kendrick, G.A.; Lavery, P.S.; McMahon, K.; Orth, R.J.; Pearce, A.; Vanderklift, M.; et al. Accelerating Tropicalization and the Transformation of Temperate Seagrass Meadows. BioScience 2016, 66, 938–948. [Google Scholar] [CrossRef] [PubMed]
- Waycott, M.; Duarte, C.M.; Carruthers, T.J.B.; Orth, R.J.; Dennison, W.C.; Olyarnik, S.; Calladine, A.; Fourqurean, J.W.; Heck, K.L., Jr.; Hughes, A.R.; et al. Accelerating loss of seagrasses across the globe threatens coastal ecosystems. Proc. Natl. Acad. Sci. USA 2009, 106, 12377–12381. [Google Scholar] [CrossRef]
- Hensel, M.J.S.; Patrick, C.J.; Orth, R.J.; Wilcox, D.J.; Dennison, W.C.; Gurbisz, C.; Hannam, M.P.; Landry, J.B.; Moore, K.A.; Murphy, R.R.; et al. Rise of Ruppia in Chesapeake Bay: Climate Change–Driven Turnover of Foundation Species Creates New Threats and Management Opportunities. Proc. Natl. Acad. Sci. USA 2023, 120, e2220678120. [Google Scholar] [CrossRef] [PubMed]
- Lefcheck, J.S.; Wilcox, D.J.; Murphy, R.R.; Marion, S.R.; Orth, R.J. Multiple stressors threaten the imperiled coastal foundation species eelgrass (Zostera marina) in Chesapeake Bay, USA. Glob. Chang. Biol. 2017, 23, 3474–3483. [Google Scholar] [CrossRef]
- Short, F.; Carruthers, T.; Dennison, W.; Waycott, M. Global seagrass distribution and diversity: A bioregional model. J. Exp. Mar. Biol. Ecol. 2007, 350, 3–20. [Google Scholar] [CrossRef]
- Kilminster, K.; McMahon, K.; Waycott, M.; Kendrick, G.A.; Scanes, P.; McKenzie, L.; O’Brien, K.R.; Lyons, M.; Ferguson, A.; Maxwell, P.; et al. Unravelling complexity in seagrass systems for management: Australia as a microcosm. Sci. Total Environ. 2015, 534, 97–109. [Google Scholar] [CrossRef] [PubMed]
- French, E.; Moore, K. Canopy Functions of R. maritima and Z. marina in the Chesapeake Bay. Front. Mar. Sci. 2018, 5, 97–409. [Google Scholar] [CrossRef]
- Bijak, A.L.; Reynolds, L.K.; Smyth, A.R. Seagrass meadow stability and composition influence carbon storage. Landsc. Ecol. 2023, 38, 4419–4437. [Google Scholar] [CrossRef]
- Moore, A.; Duffy, J. Foundation species identity and trophic complexity affect experimental seagrass communities. Mar. Ecol. Prog. Ser. 2016, 556, 105–121. [Google Scholar] [CrossRef]
- Aoki, L.R.; McGlathery, K.J.; Oreska, M.P.J. Seagrass restoration reestablishes the coastal nitrogen filter through enhanced burial. Limnol. Oceanogr. 2019, 33, 1–12. [Google Scholar] [CrossRef]
- Orth, R.J.; Heck, K.L. Structural Components of Eelgrass (Zostera marina) Meadows in the Lower Chesapeake Bay: Fishes. Estuaries 1980, 3, 278–288. [Google Scholar] [CrossRef]
- Moore, K.A.; Shields, E.C.; Parrish, D.B. Impacts of Varying Estuarine Temperature and Light Conditions on Zostera marina (Eelgrass) and its Interactions with Ruppia maritima (Widgeongrass). Estuaries Coasts 2013, 37, 20–30. [Google Scholar] [CrossRef]
- Bologna, P.A.; Gibbons-Ohr, S.; Downes-Gastrich, M. Recovery of eelgrass (Zostera marina) after a major disturbance event in Little Egg Harbor, New Jersey, USA. Bull. N.J. Acad. Sci. 2007, 1, 1–6. [Google Scholar]
- Richardson, J.; Lefcheck, J.; Orth, R. Warming temperatures alter the relative abundance and distribution of two co-occurring foundational seagrasses in Chesapeake Bay, USA. Mar. Ecol. Prog. Ser. 2018, 599, 65–74. [Google Scholar] [CrossRef]
- Shields, E.C.; Parrish, D.; Moore, K. Short-Term Temperature Stress Results in Seagrass Community Shift in a Temperate Estuary. Estuaries Coasts 2019, 42, 755–764. [Google Scholar] [CrossRef]
- Evans, A.S.; Webb, K.L.; Penhale, P.A. Photosynthetic temperature acclimation in two coexisting seagrasses, Zostera marina L. and Ruppia maritima L. Aquat. Bot. 1986, 24, 185–197. [Google Scholar] [CrossRef]
- Short, F.T.; Burdick, D.M.; Kaldy, J.E.; Iii, J.E.K. Mesocosm experiments quantify the effects of eutrophication on eelgrass, Zostera marina. Limnol. Oceanogr. 1995, 40, 740–749. [Google Scholar] [CrossRef]
- Orth, R.J.; Moore, K.A. Distribution of Zostera marina L. and Ruppia maritima L. sensu lato along depth gradients in the lower Chesapeake Bay, U.S.A. Aquat. Bot. 1988, 32, 291–305. [Google Scholar] [CrossRef]
- Lopez-Calderon, J.; Riosmena-Rodríguez, R.; Rodríguez-Baron, J.M.; Carrión-Cortez, J.; Torre, J.; Meling-López, A.; Hinojosa-Arango, G.; Hernández-Carmona, G.; García-Hernández, J. Outstanding appearance of Ruppia maritima along Baja California Sur, México and its influence in trophic networks. Mar. Biodivers. 2010, 40, 293–300. [Google Scholar] [CrossRef]
- Eyre, B.D.; Maher, D.; Oakes, J.M.; Erler, D.V.; Glasby, T.M. Differences in benthic metabolism, nutrient fluxes, and denitrification in Caulerpa taxifolia communities compared to uninvaded bare sediment and seagrass (Zostera capricorni) habitats. Limnol. Oceanogr. 2011, 56, 1737–1750. [Google Scholar] [CrossRef]
- Smyth, A.R.; Thompson, S.P.; Siporin, K.N.; Gardner, W.S.; McCarthy, M.J.; Piehler, M.F. Assessing Nitrogen Dynamics Throughout the Estuarine Landscape. Estuaries Coasts 2012, 36, 44–55. [Google Scholar] [CrossRef]
- Aoki, L.R.; McGlathery, K.J. Restoration enhances denitrification and DNRA in subsurface sediments of Zostera marina seagrass meadows. Mar. Ecol. Prog. Ser. 2018, 602, 87–102. [Google Scholar] [CrossRef]
- Welsh, D.T.; Bartoli, M.; Nizzoli, D.; Castaldelli, G.; Riou, S.A.; Viaroli, P. Denitrification, nitrogen fixation, community primary productivity and inorganic-N and oxygen fluxes in an intertidal Zostera noltii meadow. Mar. Ecol. Prog. Ser. 2000, 208, 65–77. [Google Scholar] [CrossRef]
- Eyre, B.; Ferguson, A. Comparison of carbon production and decomposition, benthic nutrient fluxes and denitrification in seagrass, phytoplankton, benthic microalgae- and macroalgae-dominated warm-temperate Australian lagoons. Mar. Ecol. Prog. Ser. 2002, 229, 43–59. [Google Scholar] [CrossRef]
- Zarnoch, C.B.; Hoellein, T.J.; Furman, B.T.; Peterson, B.J. Eelgrass meadows, Zostera marina (L.), facilitate the ecosystem service of nitrogen removal during simulated nutrient pulses in Shinnecock Bay, New York, USA. Mar. Pollut. Bull. 2017, 124, 376–387. [Google Scholar] [CrossRef]
- Hoffman, D.K.; McCarthy, M.J.; Newell, S.E.; Gardner, W.S.; Niewinski, D.N.; Gao, J.; Mutchler, T.R. Relative Contributions of DNRA and Denitrification to Nitrate Reduction in Thalassia testudinum Seagrass Beds in Coastal Florida (USA). Estuaries Coasts 2019, 42, 1001–1014. [Google Scholar] [CrossRef]
- Eyre, B.D.; Maher, D.T.; Sanders, C. The contribution of denitrification and burial to the nitrogen budgets of three geo-morphically distinct Australian estuaries: Importance of seagrass habitats. Limnol. Oceanogr. 2016, 61, 1144–1156. [Google Scholar] [CrossRef]
- Eyre, B.D.; Maher, D.T.; Squire, P. Quantity and quality of organic matter (detritus) drives N2 effluxes (net denitrification) across seasons, benthic habitats, and estuaries. Glob. Biogeochem. Cycles 2013, 27, 1083–1095. [Google Scholar] [CrossRef]
- Garcias-Bonet, N.; Fusi, M.; Ali, M.; Shaw, D.R.; Saikaly, P.E.; Daffonchio, D.; Duarte, C.M. High denitrification and anaerobic ammonium oxidation contributes to net nitrogen loss in a seagrass ecosystem in the central Red Sea. Biogeosciences 2018, 15, 7333–7346. [Google Scholar] [CrossRef]
- Touchette, B.W.; Burkholder, J.M. Review of nitrogen and phosphorus metabolism in seagrasses. J. Exp. Mar. Biol. Ecol. 2000, 250, 133–167. [Google Scholar] [CrossRef]
- Romero, J.; Lee, K.-S.; Rez, M.P.; Mateo, M.A.; Alcoverro, T. Nutrient Dynamics in Seagrass Ecosystems in Seagrasses: Biology, Ecology and Conservation; Larkum, A.W.D., Orth, R.J., Duarte, C.M., Eds.; Springer: Dordrecht, The Netherlands, 2006; pp. 227–254. [Google Scholar]
- Moore, K.A. Influence of Seagrasses on Water Quality in Shallow Regions of the Lower Chesapeake Bay. J. Coast. Res. 2004, 10045, 162–178. [Google Scholar] [CrossRef]
- Thomsen, E.; Herbeck, L.S.; Viana, I.G.; Jennerjahn, T.C. Meadow trophic status regulates the nitrogen filter function of tropical seagrasses in seasonally eutrophic coastal waters. Limnol. Oceanogr. 2023, 68, 1906–1919. [Google Scholar] [CrossRef]
- Cole, L.; McGlathery, K. Nitrogen fixation in restored eelgrass meadows. Mar. Ecol. Prog. Ser. 2012, 448, 235–246. [Google Scholar] [CrossRef]
- Welsh, D.; Bourguès, S.; de Wit, R.; Auby, I. Effect of plant photosynthesis, carbon sources and ammonium availability on nitrogen fixation rates in the rhizosphere of Zostera noltii. Aquat. Microb. Ecol. 1997, 12, 285–290. [Google Scholar] [CrossRef]
- McGlathery, K.; Risgaard-Petersen, N.; Christensen, P. Temporal and spatial variation in nitrogen fixation activity in the eelgrass Zostera marina rhizosphere. Mar. Ecol. Prog. Ser. 1998, 168, 245–258. [Google Scholar] [CrossRef]
- Russell, B.D.; Connell, S.D.; Uthicke, S.; Muehllehner, N.; Fabricius, K.E.; Hall-Spencer, J.M. Future Seagrass Beds: Can Increased Productivity Lead to Increased Carbon Storage? Mar. Pollut. Bull. 2013, 73, 463–469. [Google Scholar] [CrossRef] [PubMed]
- Jovanovic, Z.; Pedersen, M.; Larsen, M.; Kristensen, E. Glud Rhizosphere O2 dynamics in young Zostera marina and Ruppia maritima. Mar. Ecol. Prog. Ser. 2015, 518, 95–105. [Google Scholar] [CrossRef]
- Nielsen, O.I.; Gribsholt, B.; Kristensen, E.; Revsbech, N.P. Microscale distribution of oxygen and nitrate in sediment in-habited by Nereis diversicolor: Spatial patterns and estimated reaction rates. Aquat. Microb. Ecol. 2004, 34, 23–32. [Google Scholar] [CrossRef]
- Eyre, B.D.; Rysgaard, S.; Dalsgaard, T.; Christensen, P.B. Comparison of isotope pairing and N2: Ar methods for measuring sediment-denitrification-assumptions, modifications, and implications. Estuaries 2002, 25, 1077–1087. [Google Scholar] [CrossRef]
- Kana, T.M.; Darkangelo, C.; Hunt, M.D.; Oldham, J.B. Membrane inlet mass spectrometer for rapid high-precision de-termination of N2, O2, and Ar in environmental water samples. Anal. Chem. 1994, 66, 4166–4170. [Google Scholar] [CrossRef]
- Erftemeijer, P.L.; Koch, E.W. Sediment geology methods for seagrass habitat. In Global seagrass research methods; Short, F.T., Coles, R.G., Eds.; Elsevier Science: Amsterdam, The Netherlands, 2001; pp. 345–367. [Google Scholar] [CrossRef]
- Macreadie, P.I.; Trevathan-Tackett, S.M.; Skilbeck, C.G.; Sanderman, J.; Curlevski, N.; Jacobsen, G.; Seymour, J.R. Losses and recovery of organic carbon from a seagrass ecosystem following disturbance. Proc. R. Soc. B Biol. Sci. 2015, 282, 20151537. [Google Scholar] [CrossRef]
- Lavrentyev, P.J.; Gardner, W.S.; Yang, L. Effects of the zebra mussel on nitrogen dynamics and the microbial community at the sediment-water interface. Aquat. Microb. Ecol. 2000, 21, 187–194. [Google Scholar] [CrossRef]
- Shieh, W.; Yang, J. Denitrification in the rhizosphere of the two seagrasses Thalassia hemprichii (Ehrenb.) Aschers and Halodule uninervis (Forsk.) Aschers. J. Exp. Mar. Biol. Ecol. 1997, 218, 229–241. [Google Scholar] [CrossRef]
- Hammer, K.; Borum, J.; Hasler-Sheetal, H.; Shields, E.; Sand-Jensen, K.; Moore, K. High Temperatures Cause Reduced Growth, Plant Death and Metabolic Changes in Eelgrass Zostera Marina. Mar. Ecol. Prog. Ser. 2018, 604, 121–132. [Google Scholar] [CrossRef]
- Greve, T.M.; Borum, J.; Pedersen, O. Meristematic oxygen variability in eelgrass (Zostera marina). Limnol. Oceanogr. 2003, 48, 210–216. [Google Scholar] [CrossRef]
- Dahl, M.; Asplund, M.E.; Deyanova, D.; Franco, J.N.; Koliji, A.; Infantes, E.; Perry, D.; Björk, M.; Gullström, M. High Seasonal Variability in Sediment Carbon Stocks of Cold-Temperate Seagrass Meadows. J. Geophys. Res. Biogeosciences 2020, 125. [Google Scholar] [CrossRef]
- Haviland, K.A.; Howarth, R.W.; Marino, R.; Hayn, M. Variation in sediment and seagrass characteristics reflect multiple stressors along a nitrogen-enrichment gradient in a New England lagoon. Limnol. Oceanogr. 2022, 67, 660–672. [Google Scholar] [CrossRef]
- Kennedy, H.; Beggins, J.; Duarte, C.M.; Fourqurean, J.W.; Holmer, M.; Marbà, N.; Middelburg, J.J. Seagrass sediments as a global carbon sink: Isotopic constraints. Glob. Biogeochem. Cycles 2010, 24, 6696–6705. [Google Scholar] [CrossRef]
- Delgado, M.; Cintra-Buenrostro, C.E.; Fierro-Cabo, A. Decomposition and nitrogen dynamics of turtle grass (Thalassia testudinum) in a subtropical estuarine system. Wetl. Ecol. Manag. 2017, 25, 667–681. [Google Scholar] [CrossRef]
- Ziegler, S.; Benner, R. Nutrient cycling in the water column of a subtropical seagrass meadow. Mar. Ecol. Prog. Ser. 1999, 188, 51–62. [Google Scholar] [CrossRef]
- Orth, R.J.; Moore, K.A. Seasonal and year-to-year variations in the growth of Zostera marina L. (eelgrass) in the lower Chesapeake Bay. Aquat. Bot. 1986, 24, 335–341. [Google Scholar] [CrossRef]
- Welsh, D.T. Nitrogen fixation in seagrass meadows: Regulation, plant-bacteria interactions and significance to primary productivity. Ecol. Lett. 2000, 3, 58–71. [Google Scholar] [CrossRef]
- Cook, P.; Evrard, V.; Woodland, R. Factors controlling nitrogen fixation in temperate seagrass beds. Mar. Ecol. Prog. Ser. 2015, 525, 41–51. [Google Scholar] [CrossRef]
- Holmer, M.; Nielsen, S. Sediment sulfur dynamics related to biomass- density patterns in Zostera marina (eelgrass) beds. Mar. Ecol. Prog. Ser. 1997, 146, 163–171. [Google Scholar] [CrossRef]
- Van Dam, B.R.; Zeller, M.A.; Lopes, C.; Smyth, A.R.; Böttcher, M.E.; Osburn, C.L.; Zimmerman, T.; Profrock, D.; Fourqurean, J.W.; Thomas, H. Calcification-driven CO2 emissions exceed “Blue Carbon” sequestration in a carbonate seagrass meadow. Sci. Adv. 2021, 7, eabj1372. [Google Scholar] [CrossRef]
- Cook, P.L.M.; Kessler, A.J.; Eyre, B.D. Does denitrification occur within porous carbonate sand grains? Biogeosciences 2017, 14, 4061–4069. [Google Scholar] [CrossRef]
- Russell, D.G.; Warry, F.Y.; Cook, P.L.M. The balance between nitrogen fixation and denitrification on vegetated and non-vegetated intertidal sediments. Limnol. Oceanogr. 2016, 61, 2058–2075. [Google Scholar] [CrossRef]
- Aoki, L.; McGlathery, K. High rates of N fixation in seagrass sediments measured via a direct 30N2 push-pull method. Mar. Ecol. Prog. Ser. 2019, 616, 1–11. [Google Scholar] [CrossRef]
- Kenworthy, W.; Thayer, G. Production and Decomposition of the Roots and Rhizomes of Seagrasses, Zostera Marina and Thalassia Testudinum, in Temperate and Subtropical Marine Ecosystems. Bull. Mar. Sci. 1984, 35, 364–379. [Google Scholar]
- Kenworthy, W.J.; Zieman, J.C.; Thayer, G.W. Evidence for the influence of seagrasses on the benthic nitrogen cycle in a coastal plain estuary near Beaufort, North Carolina (USA). Oecologia 1982, 54, 152–158. [Google Scholar] [CrossRef] [PubMed]
- Salk, K.R.; Erler, D.V.; Eyre, B.D.; Carlson-Perret, N.; Ostrom, N.E. Unexpectedly high degree of anammox and DNRA in seagrass sediments: Description and application of a revised isotope pairing technique. Geochim. Et Cosmochim. Acta 2017, 211, 64–78. [Google Scholar] [CrossRef]
- Orth, R.J.; Heck, K.L.; van Montfrans, J. Faunal communities in seagrass beds: A review of the influence of plant structure and prey characteristics on predator-prey relationships. Estuaries 1984, 7, 339–350. [Google Scholar] [CrossRef]
- Rysgaard, S.; Christensen, P.; Nielsen, L. Seasonal variation in nitrification and denitrification in estuarine sediment colonized by benthic microalgae and bioturbating infauna. Mar. Ecol. Prog. Ser. 1995, 126, 111–121. [Google Scholar] [CrossRef]

| Season | Date | Temp (°C) | Salinity | Dissolved O2 (mg/L) | NOx (μM) | NH4+ (μM) |
|---|---|---|---|---|---|---|
| Spring | 27 May 2014 | 26.5 | 15.8 | 7.3 ± 0.11 | 1.14 ± 0.02 | 01.8 ± 0.17 |
| Summer | 2 September 2014 | 27.1 | 19.3 | 7.15 ± 0.19 | 0.31 ± 0.02 | 0.70 ± 0.06 |
| Season | Habitat | n | AG Biomass (g DW/m2) | BG Biomass (g DW/m2) | Total Biomass | SOM (%) |
|---|---|---|---|---|---|---|
| Spring | Unvegetated | 3 | - | - | - | 0.98 ± 0.12 |
| Widgeongrass | 3 | 42.73 ± 4.60 | 34.0 ± 2.86 | 76.73 ± 6.71 | 1.75 ± 0.20 | |
| Eelgrass | 3 | 116.47 ± 31.18 | 141.89 ± 12.54 | 258.36 ± 39.42 | 3.17 ± 0.35 | |
| Summer | Unvegetated | 4 | - | - | - | 0.86 ± 0.02 |
| Widgeongrass | 4 | 53.94 ± 29.11 | 24.19 ± 4.70 | 78.13 ± 33.54 | 1.21 ± 0.10 | |
| Eelgrass | 4 | 77.95 ± 23.99 | 71.79 ± 17.76 | 149.74 ± 40.66 | 2.25 ± 0.10 |
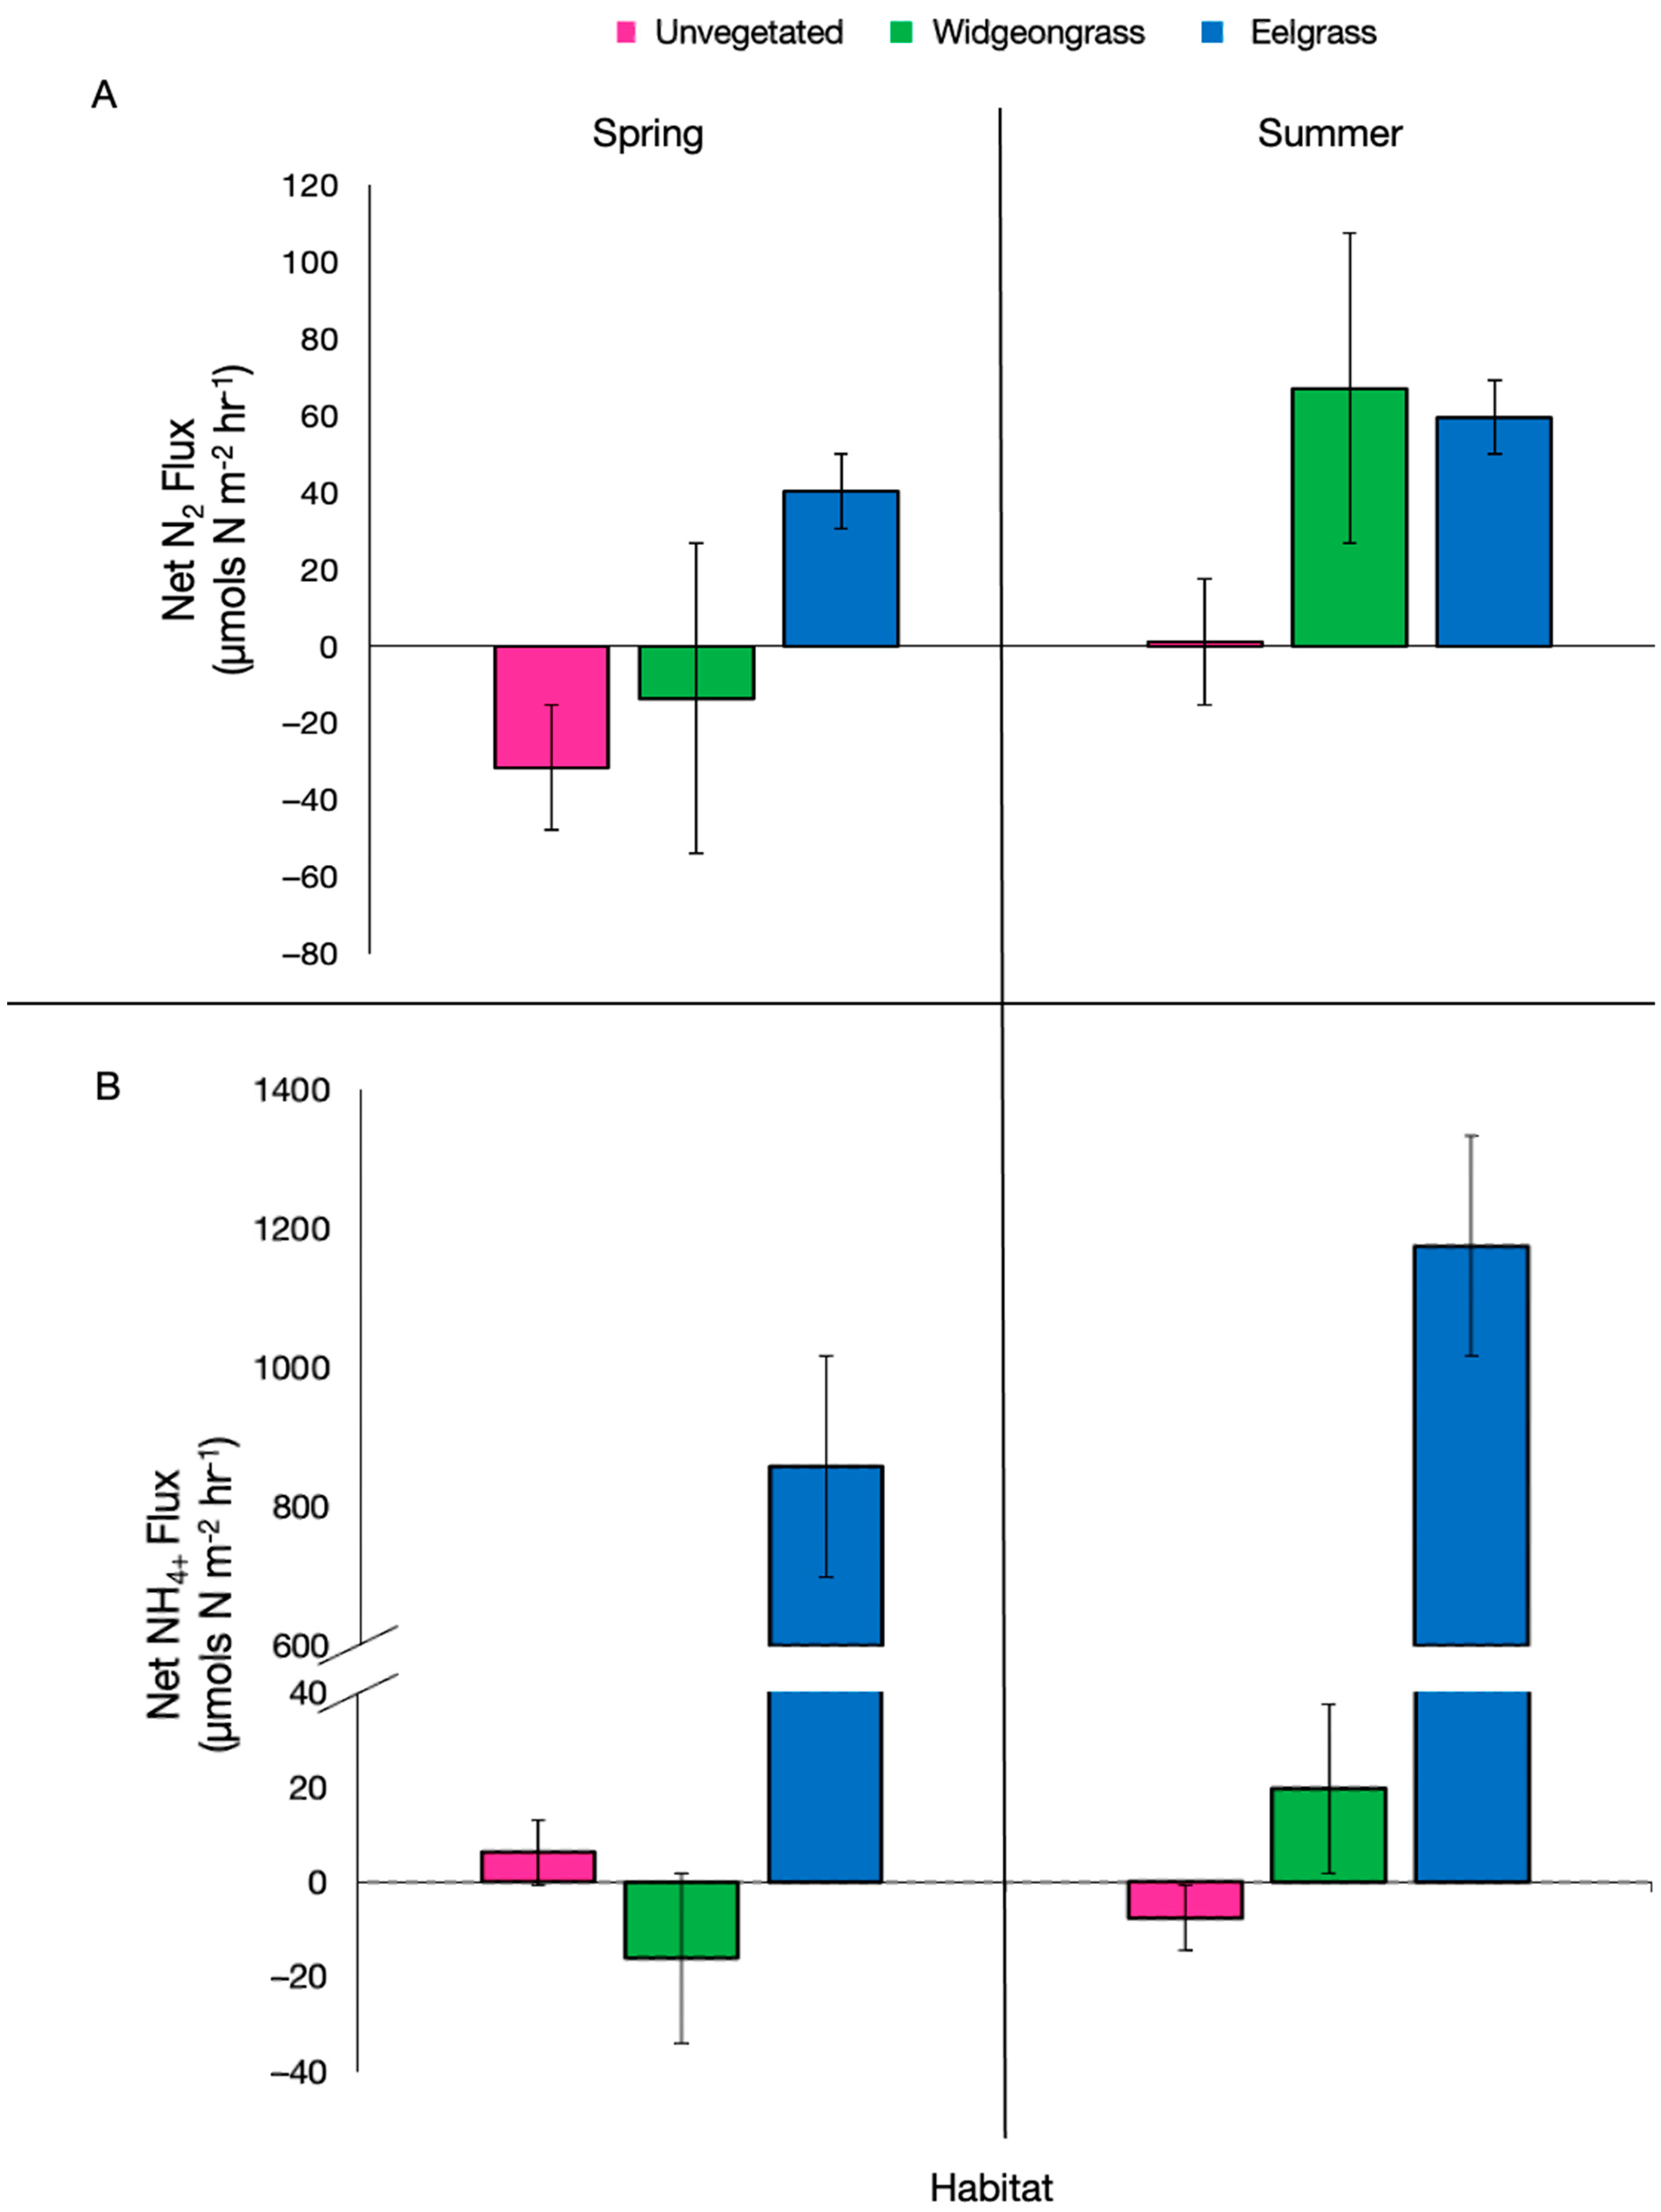
| Season | Habitat | n | NOx (µmol N-NOx m−2 h−1) | NH4+ (µmol N-NH4+ m−2 h−1) | SOD (µmol O2 m−2 h−1) |
|---|---|---|---|---|---|
| Spring | Unvegetated | 3 | −7.29 ± 2.29 | 6.23 ± 2.24 | 2994.49 ± 149.03 |
| Widgeongrass | 3 | −10.9 ± 1.96 | −16.06 ± 1.45 | 3306.22 ± 63.58 | |
| Eelgrass | 3 | 0.24 ± 7.33 | 857.82 ± 494.06 | 3538.84 ± 67.29 | |
| Summer | Unvegetated | 4 | −3.56 ± 0.44 | −7.55 ± 1.26 | 2147.39 ± 266.71 |
| Widgeongrass | 4 | −3.4 ± 0.51 | 19.75 ± 13.40 | 4348.78 ± 450.15 | |
| Eelgrass | 4 | −4.46 ± 0.29 | 1174.69 ± 830.02 | 5030.87 ± 44.80 |
Disclaimer/Publisher’s Note: The statements, opinions and data contained in all publications are solely those of the individual author(s) and contributor(s) and not of MDPI and/or the editor(s). MDPI and/or the editor(s) disclaim responsibility for any injury to people or property resulting from any ideas, methods, instructions or products referred to in the content. |
© 2024 by the authors. Licensee MDPI, Basel, Switzerland. This article is an open access article distributed under the terms and conditions of the Creative Commons Attribution (CC BY) license (https://creativecommons.org/licenses/by/4.0/).
Share and Cite
French, E.; Smyth, A.R.; Reynolds, L.K.; Moore, K.A. Nitrogen Cycling in Widgeongrass and Eelgrass Beds in the Lower Chesapeake Bay. Nitrogen 2024, 5, 315-328. https://doi.org/10.3390/nitrogen5020021
French E, Smyth AR, Reynolds LK, Moore KA. Nitrogen Cycling in Widgeongrass and Eelgrass Beds in the Lower Chesapeake Bay. Nitrogen. 2024; 5(2):315-328. https://doi.org/10.3390/nitrogen5020021
Chicago/Turabian StyleFrench, Emily, Ashley R. Smyth, Laura K. Reynolds, and Kenneth A. Moore. 2024. "Nitrogen Cycling in Widgeongrass and Eelgrass Beds in the Lower Chesapeake Bay" Nitrogen 5, no. 2: 315-328. https://doi.org/10.3390/nitrogen5020021
APA StyleFrench, E., Smyth, A. R., Reynolds, L. K., & Moore, K. A. (2024). Nitrogen Cycling in Widgeongrass and Eelgrass Beds in the Lower Chesapeake Bay. Nitrogen, 5(2), 315-328. https://doi.org/10.3390/nitrogen5020021