Abstract
To mitigate the adverse effects of particle agglomeration in alkali-activated coal gangue-based cementitious (AAM–CG) materials, ultrasonic treatment and fractal theory, combined with microscopic analysis techniques were employed to investigate the physical activity of coal gangue (CG) and the microscopic mechanisms of AAM–CG materials. The results indicate that ultrasonic treatment effectively enhances the mechanical properties of AAM–CG materials. With increasing ultrasonic duration, the compressive strength initially rises and then declines, whereas it shows a continuous upward trend with increasing ultrasonic power. The optimal dispersion of CG particles in AAM–CG materials was achieved under ultrasonic treatment at 840 W for 4 min, resulting in a peak compressive strength of 106 MPa. This represents a 28.8% enhancement compared to non-sonicated controls. Ultrasonic treatment effectively disperses agglomerated particles, fully activates CG reactivity, promotes the formation of cementitious phases, improves pore-filling effects, and optimizes the internal pore structure of the material. Compared to untreated samples, the fractal dimension of the pore structure increased after ultrasonic treatment, harmful pores decreased, and porosity was reduced by 32%. This study expands the application of ultrasonic technology in the preparation of alkali-activated geopolymers and provides an efficient activation method for the resource utilization of CG.
1. Introduction
Coal Gangue (CG) is a solid waste generated during coal mining and washing, accounting for approximately 10–15% of total coal production [1]. The accumulated stockpile of CG in China has reached 7 billion tons [2]. Due to its high production and low utilization rate, massive stockpiling has led to severe environmental pollution [3]. Although CG can be used as a green building materials, its low activity caused by a high crystalline phase content (e.g., quartz and kaolinite exceeding 70%) severely limits its effectiveness in cementitious materials [4]. Under the dual objectives of carbon peaking and carbon neutrality (“Dual Carbon” goals) and the promotion of solid waste resource utilization policies, breaking through the limitations of CG’s low reactivity through technological innovation and achieving its large-scale, high-efficiency application in cementitious systems has become a critical issue for both coal gangue-based solid waste disposal and the green building materials industry upgrade.
The main approaches to improving the activity of CG are chemical activation (acid and alkali activators) and physical activation (thermal activation, mechanical pulverization) [5]. Wang et al. [6] demonstrated that alkali activators can significantly influence the mechanical properties and microstructure of CG. Specifically, NaOH at a concentration of 14 mol/L was used to prepare the geopolymer to improve its mechanical strength [7]. Guo et al. [8] proposed that water plays a crucial role in geopolymerization by facilitating aluminosilicate dissolution and ion transfer during the reaction. However, excessive water content in geopolymers may inhibit the polymerization process, resulting in reduced compressive strength. These findings indicate that different alkali activators exert varying effects on mechanical performance. Meanwhile, acid-activated geopolymers have recently attracted attention, and their excellent properties have been demonstrated despite the limited relevant studies. Kaze et al. [9] showed that acid-activated geopolymers exhibit superior performance to alkali-activated geopolymers in terms of mechanical properties, fire resistance properties, and insulation characteristics. Fei et al. [10] evaluated the acid reactivity of CG formed at different calcination temperatures and assessed the potential for synthesizing acid-activated polymers, addressing knowledge gaps by investigating how calcination affects coal gangue’s structural characteristics and subsequent acid activation behavior. The addition of phosphates has been shown to promote the formation of new binder phases, resulting in a dense matrix with exceptionally low porosity [11]. Ding et al. [12] investigated the effects of specific surface area and chemical activators on the compressive strength of CG specimens. Their results demonstrate that mechanical grinding disrupts the original mineral structure of CG, accelerates the cleavage of Si–O bonds, thereby increasing the specific surface area and significantly enhancing CG’s reactivity. However, mechanical grinding has limitations; excessive grinding not only fails to improve the fundamental properties of cementitious materials but also increases energy consumption costs. In contrast, thermal activation is widely adopted due to its operational simplicity and high activation efficiency. For instance, kaolinite in CG can be converted into reactive metakaolin through high-temperature calcination (750–950 °C), which markedly improves its pozzolanic activity [13,14]. The calcination process also decomposes organic matter, removes impurities, and enhances reactivity [15,16]. Furthermore, calcined CG reacts with calcium hydroxide in aqueous environments to form cementitious compounds. This reaction facilitates material binding and hardening, ultimately improving both strength and overall durability of the resulting materials [17]. Incorporating calcined CG into cementitious materials establishes a new model of waste recycling and promotes the development of this model in a green and low-carbon direction [18]. Studies [19] indicate that when directly used as mineral admixtures, calcined coal gangue’s predominantly aluminosilicate composition results in lower concrete compressive strength compared to conventional concrete, primarily due to issues such as low calcium content and limited reaction products [20]. To address this, researchers [21] proposed incorporating calcium-rich components (e.g., blast furnace slag, BFS) to create composite systems that compensate for calcium deficiency. Calcium addition combined with coal gangue calcination further promotes the generation of reactive minerals like metakaolin. Ma [22] found that slag substitution optimizes reaction pathways in coal gangue systems, where enhanced Ca2+–Na+ exchange facilitates the transformation from low-calcium N–A–S–H gel to high-calcium C–S–H gel, significantly improving material strength. Kumar et al. [23] further confirmed that BFS addition enhances the reactivity of alkali-activated materials, establishing calcium sources as crucial for improving their strength. During the activation of CG, particle agglomeration frequently occurs. In mechanical grinding, as the CG particle size decreases, the specific surface area and particle surface energy increase, promoting agglomeration. For thermally activated CG, agglomeration may also occur during the cooling process due to surface adsorption and other interfacial interactions. In chemical activation, alkali activation can generate gel-like substances that coat CG particles, thereby inducing particle agglomeration. Particle agglomeration not only reduces the specific surface area of CG, hindering the activation of its reactive components, but also directly decreases the efficiency of the hydration reaction [24]. While most current research prioritizes bulk-scale dispersion of materials, achieving precise manipulation of individual particles at the nanoscale remains a significant challenge [25].
Ultrasonic treatment offers dual advantages derived from cavitation effects and mechanical fragmentation [26,27,28]. Specifically, it can effectively disperse agglomerated particles in solid–liquid systems and refine particle sizes at microscopic scales [29,30,31]. Furthermore, ultrasonic energy promotes the dissolution of Al–Si active phases, accelerates hydration reaction kinetics [32,33], and optimizes reaction pathways by enhancing overall reaction rates in diverse chemical processes [34]. Santos [35] observed more uniform particle size distribution in ultrasonically treated powders, with dispersion further enhanced when combined with mechanical stirring [36]. However, the influence of ultrasonic parameters (power, duration) varies significantly depending on the material’s intrinsic properties, such as particle size and chemical composition. Therefore, optimizing ultrasonic parameters is a critical prerequisite for effectively eliminating particle agglomeration and achieving a homogeneous size distribution. At present, research on the ultrasonic pretreatment of alkali-activated CG–BFS composite systems remains limited, with unclear mechanisms regarding how ultrasonic parameters (time, power) affect mechanical properties. Systematic analysis of particle dispersion behavior and hydration product evolution is notably lacking.
To address the strength degradation caused by coal gangue (CG) particle agglomeration in alkali-activated coal gangue-based cementitious (AAM–CG) materials, this study employs fractal theory [37] to quantitatively analyze the dispersion characteristics of CG under ultrasonic treatment with varying power levels and durations. The optimal ultrasonic parameters for enhancing the macroscopic mechanical properties of AAM–CG materials were obtained by including a compressive strength test. Advanced characterization techniques, including Nuclear Magnetic Resonance (NMR), X-ray Diffraction (XRD), Scanning Electron Microscopy-Energy Dispersive Spectroscopy (SEM-EDS), and Thermogravimetric Analysis (TGA), were utilized to investigate microstructural evolution of AAM–CG materials, which revealed the ultrasonic strengthening mechanisms in AAM–CG materials at the microscopic level, thereby providing a theoretical foundation for understanding and mitigating the detrimental effects of CG particle agglomeration on the mechanical performance of AAM–CG composites.
2. Materials and Tests
2.1. Test Materials
Calcined coal gangue powder (primary components: SiO2, Al2O3) was sourced from Huayao Mineral Processing Plant (Lingshou, China). S95-grade GGBFS micropowder, supplied by Tianrui Building Materials (Zhengzhou, China) and produced by Jinguang Group (Jincheng, China), was used; its chemical composition is given in Table 1.

Table 1.
Main chemical composition of calcined CG and slag powder (%).
The calcined CG particles undergo fusion due to high temperatures, resulting in a smooth surface and the formation of agglomerated structures. During the calcination process, the kaolinite phase in the coal gangue transforms into metakaolin, significantly enhancing its pozzolanic activity. The thermally activated particles expose more Si–O and Al–O broken bonds, enabling them to efficiently participate in secondary reactions within the hydration system, forming C–(A)–S–H gel and ettringite phases. The uncalcined coal gangue retains angular features after mechanical crushing, exhibiting sharp-edged particles with irregular polyhedral structures. After mechanical grinding, the slag particles exhibit irregular fragment shapes, with some fine particles adhering to the surface. The SEM images of calcined CG and slag are shown in Figure 1.
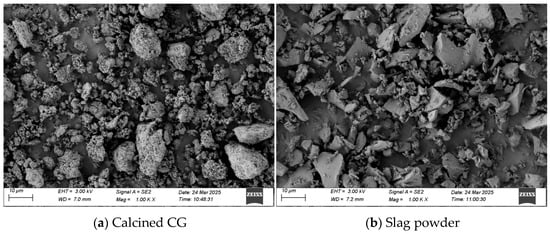
Figure 1.
SEM images.
The particle size distribution curves of calcined CG and slag powder are shown in Figure 2. From Figure 2a, it can be observed that the proportion of ultrafine particles is high (23.10% < 3 μm), which aligns with the particle refinement characteristics of calcined CG due to dehydration and decomposition. The main peak range is located at 3–32 μm, accounting for 71.04%, reflecting the medium-sized particle distribution after calcination, likely resulting from the transformation of quartz and clay minerals in the raw ore. The proportion of large particles (>32 μm) is 5.85%, attributed to calcination promoting particle homogenization and reducing coarse particle residues. The span (Span = 3.086) indicates a moderate distribution width, while Dv(90) = 26.7 μm suggests the presence of a small number of larger particles, consistent with the SEM observations.
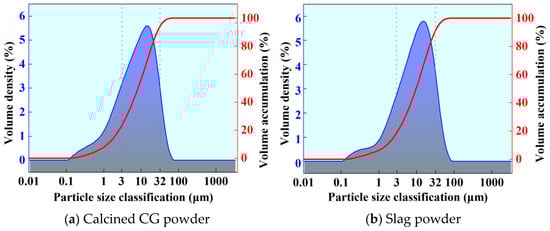
Figure 2.
Grain size distribution curve.
Analytical-grade flake NaOH (purity 98%) and sodium silicate solution with a modulus of 3.20 (SiO2-27.3%, Na2O-8.54%) were used as alkali activators. The two components were mixed in a designed ratio and dissolved in water to prepare an alkaline activator solution with a modulus of 1.2. The prepared alkaline activator solution was cooled at room temperature for 24 h before being used to fabricate test specimens.
2.2. Preparation and Maintenance of Test Specimens
The mass ratio of CG to slag was 4:6, with a liquid-to-solid ratio of 0.34. The alkali activator dosage was 20% of the total solid mass, and the activator modulus (SiO2/Na2O molar ratio) was 1.2.
The procedure was as follows:
- The prepared alkaline activator was mixed with water using a magnetic stirrer to ensure homogeneity.
- CG powder was added at the predetermined ratio, and stirring continued until a stable vortex formed. An ultrasonic probe was submerged below the paste surface, and the ultrasonic disperser was activated.
- The treated slurry was combined with pre-weighed slag powder in the cement paste mixer (NJ-160, Wuxi Xinjian Instrument Technology Co., Ltd., Wuxi, China). The mixture was stirred at a constant speed of 260 ± 10 rpm for 3 min to ensure thorough blending, completing the geopolymer mixture preparation.
- The slurry was slowly poured into 40 mm × 40 mm × 40 mm molds. After filling to 1/3 height, the molds were placed on a vibrating table to remove air bubbles. The remaining mixture was added, and the surface was leveled. Following full filling, the molds were vibrated for an additional minute to enhance compaction.
- The molds and specimens were sealed with plastic wrap to prevent moisture loss and contamination. The sealed specimens were demolded after curing for 24 h in a room with a relative humidity of 95% and a temperature of 20 ± 1 °C, and continued curing until the designated testing age.
2.3. Test Equipment and Methods
2.3.1. Particle Dispersion
The ultrasonic equipment used is a probe type ultrasonic dispersion instrument (WM-1200T, Shanghai Weimi Technology Co., Ltd., Shanghai, China). Its frequency and power are 25 kHz and 0–1200 W respectively. The diameter of the probe is 6 mm. The irradiation method is continuous. The dispersion of the CG paste is done together with the ultrasonic equipment and the magnetic stirrer (MS3, Qunan Experimental Instrument Co., Ltd., Huzhou, China).
The CG was mixed with water at a specified ratio in a container and stirred using a magnetic stirrer. Simultaneously, an ultrasonic probe was immersed in the container to determine the optimal combination of ultrasonic power and treatment time by varying these parameters. A total of 25 slurry samples were prepared with different ultrasonic power and time combinations, as listed in Table 2. An additional control group without ultrasonic treatment was also prepared. The samples were labeled following the S-P-T naming convention (where P = power and T = time). For example, S-600-3 denotes ultrasonic treatment at 600 W for 3 min.
Table 2.
Design of ultrasonic power-time parameters.
The prepared paste was transferred using a pipette, with 1 g of the slurry introduced into 5 g of anhydrous ethanol. After shaking for 30 s, the mixture was dropped onto a glass slide. Following ethanol evaporation, observations were conducted under an optical microscope. Fractal theory was employed to quantitatively characterize the particle dispersion degree, while statistical analysis was performed to identify and assess the dispersion state of CG paste particles under different ultrasonic treatments.
2.3.2. Compressive Strength and Microscopic Test
To determine the influence of ultrasonic treatment with varying power levels and durations on the compressive strength of specimens, Beijing Letry Technology Instrument Co., Ltd., Cangzhou, China Microcomputer-controlled Electro-hydraulic Servo Universal Testing Machine (DYE-300S), Maximum Capacity: 300 kN was employed to measure the compressive strength of geopolymer samples at a loading rate of 2.4 kN/s. The average strength value from three specimens was used to determine the compressive strength for each mix proportion.
Simultaneously, a MesoMR12-060H-I (MR) nuclear magnetic resonance equipment produced by Suzhou Neway Analytical Instrument Co., Ltd. (Suzhou, China), nuclear magnetic resonance (NMR) device was utilized to examine changes in porosity and pore size distribution before and after ultrasonic treatment.
After compressive strength testing, the specimens were ground into 10 mm × 10 mm × 5 mm samples and immersed in anhydrous ethanol for 48 h to halt hydration. Scanning electron microscopy (SEM; Sigma 300, Zeiss, Oberkochen, Baden-Württemberg, Germany) was conducted to reveal morphological characteristics, with selected well-reacted central or edge regions subjected to energy-dispersive X-ray spectroscopy (EDS) for qualitative and semi-quantitative elemental composition analysis. Additionally, X-ray diffraction (XRD; Rigaku Corporation, Tokyo, Japan) and thermogravimetric analysis (TGA; Netzsch STA 449 F3, Selb, Germany) were performed to identify phase composition and quantify temperature-mass change relationships, thereby clarifying microstructural compositional changes in the material.
3. Determination of Ultrasonic Parameters
3.1. Effect of Ultrasonic with Different Parameters on Compressive Strength
Figure 3 shows the compressive strength of AAM–CG materials under different ultrasonic parameters. As seen in Figure 3, the specimens without ultrasonic treatment achieved compressive strengths of 64.6 MPa and 82.7 MPa at 7 and 28 days, respectively. The compressive strength exhibited an increasing trend with higher ultrasonic power. The maximum compressive strengths were obtained under 840 W-4 min ultrasonic treatment, reaching 84.1 MPa (7d) and 106.5 MPa (28d), representing increases of 30.2% and 28.8%, respectively, compared to the non-ultrasonic group. This demonstrates that ultrasonic power can enhance the compressive strength of AAM–CG materials, showing a positive correlation between ultrasonic power and specimen strength. With extended ultrasonic duration, the compressive strength initially increased but then decreased, indicating that treatment time also affects strength development. This phenomenon arises from ultrasonic cavitation effects, where collapsing bubbles generate high-speed micro-jets that disrupt the flocculated structure of CG particles. This process enhances material homogeneity and accelerates activation reactions. Consequently, 840 W for 4 min was selected as the optimal ultrasonic parameter for subsequent research.
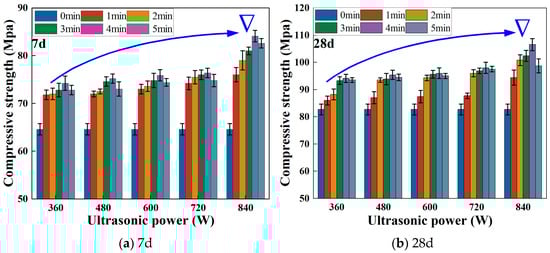
Figure 3.
Compressive strength of AAM–CG materials under different ultrasonic parameters.
3.2. Fractal Features Based on Microscope Images
Mechanical mixing can only achieve uniform distribution at the macro level. At the microscopic scale, the strong agglomeration behavior between particles creates barriers, preventing water molecules from continuously reacting with unhydrated CG particles. Under the influence of interparticle forces, fine CG particles tend to aggregate around larger particles as nuclei, forming agglomerates. This clustered state not only hinders sufficient contact between CG particles and water, inhibiting the hydration process, but also significantly reduces the overall homogeneity of the material. As a result, the internal reactivity of the material cannot be fully activated, ultimately compromising its performance.
To further elucidate the effect of ultrasonic treatment on the cementitious material, optical microscopy was employed to analyze the particle distribution of CG after ultrasonic treatment, based on the compressive strength results under different ultrasonic parameters. Figure 4 illustrates the particle distribution under 840 W ultrasonic power with varying durations, while Figure 5 shows the distribution under different ultrasonic powers at a fixed 4 min duration. As seen in Figure 4a, without ultrasonic treatment, CG particles exhibit significant large-scale agglomeration. After ultrasonic application (Figure 4b), large agglomerates begin to break down, reducing in size. With prolonged treatment time, the disaggregation effect becomes more pronounced, and particles gradually disperse uniformly in the slurry. At 4 min of ultrasonic treatment (Figure 4e), large agglomerates nearly disappear, and CG particles are uniformly dispersed. However, excessive ultrasonic duration leads to re-agglomeration (Figure 4f). As a mechanical wave, ultrasound transmits vibrational energy to particles upon propagation. The vibrational energy, directly related to power, increases with higher power, effectively disrupting particle agglomeration and improving distribution uniformity. As shown in Figure 5, higher ultrasonic power significantly breaks down large agglomerates, enhancing dispersion.
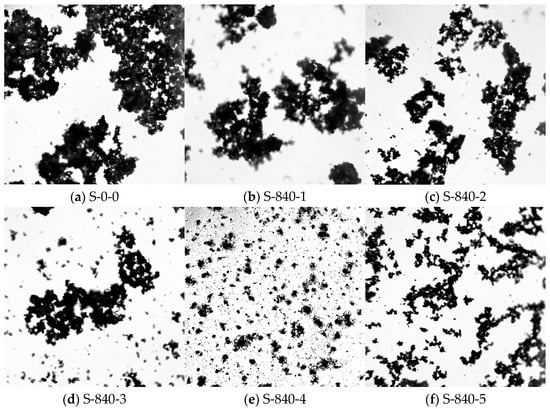
Figure 4.
Dispersion of particles by ultrasonic treatment at 840 W for 0–5 min.
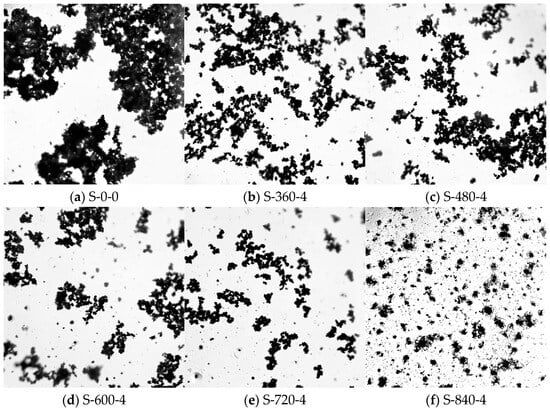
Figure 5.
Dispersion of particles with different ultrasonic power for 4 min.
To quantitatively analyze the dispersion characteristics of CG particles under ultrasound, image processing software was used to extract particle contours and uniformity parameters. The fractal dimension was calculated using the box-counting method. Boxes of edge length δ were used to cover the pore space in binary images. The number of grids N(δ) required to fully cover the pore structure was recorded. The box size δ was automatically selected based on image dimensions, with 10 data points systematically sampled. According to Equation (1), a log–log plot was generated with ln(δ) as the abscissa and ln N(δ) as the ordinate. Least-squares linear regression was then applied to fit the data points, where the slope corresponds to the sample’s fractal dimension, with results shown in Figure 6 and Figure 7. From Figure 6, at 840 W ultrasonic power, the fractal dimension of CG particles ranges from 1.53 to 1.86 with varying durations. The fractal dimension first decreases and then increases with prolonged treatment, where a lower fractal dimension indicates better dispersion. Figure 7 shows that at a fixed 4 min duration, higher ultrasonic power reduces the fractal dimension, improving dispersion uniformity. The correlation coefficient exceeds 0.98, confirming the reliability of fractal dimension in evaluating dispersion.
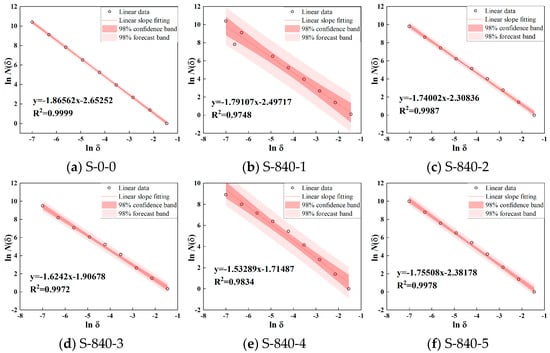
Figure 6.
Power 840 W ultrasonic treatment 0–5 min fractal dimension of particle distribution.
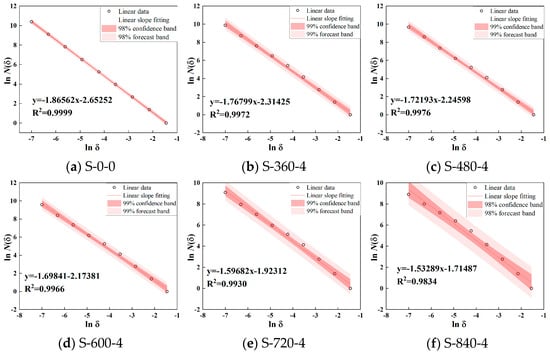
Figure 7.
Different power ultrasonic treatment 4 min particle size distribution fractal dimension.
In conclusion, ultrasonic treatment effectively promotes particle collisions, ensuring uniform distribution and creating favorable conditions for CG particles to fully contribute to the material system. Based on compressive strength and dispersion analysis, the optimal ultrasonic parameters are 840 W for 4 min, achieving the best particle dispersion.
4. The Effect of Ultrasonic Treatment on the Microstructure of AAM–CG Materials
4.1. Nuclear Magnetic Resonance Analysis
4.1.1. Pore Characteristics
NMR technology can analyze the pore distribution of material without causing damage. The relaxation time curve obtained from NMR tests effectively reflects the internal pore characteristics, peak area, and corresponding pore diameter. Using low-field NMR technology, the relaxation time spectra of alkali-activated coal gangue–slag cementitious materials before and after ultrasonic treatment at curing ages of 7 and 28 days were obtained, as shown in Figure 8. From Figure 8, the relaxation time T2 distributions of the specimens before and after ultrasonic treatment exhibits a typical three-peak pattern, with the first peak (left peak) being dominant. Based on pore classification standards [38], the pores in AAM–CG materials can be roughly divided into three categories: harmless pores (r < 0.02 μm), less harmful pores (0.02 μm ≤ r < 0.05 μm), more harmful pores (r ≥ 0.05 μm). Among them, there are more harmless pores and fewer smaller harmful pores, which corresponds to the three-peak feature of the T2 curve. After ultrasonic treatment, the peaks shift leftward overall, indicating a reduction in total porosity. Additionally, compared to the T2 spectra of specimens with 7-day curing age, the three peaks of spectra in the 28-day shift downward and to the right, with a decrease in total area. Figure 9 shows the proportion of different pore sizes in AAM–CG materials before and after ultrasonic treatment. It can be seen that after ultrasonic treatment, the proportions of less harmful and more harmful pores decrease significantly at the same curing age, leading to a reduction in total porosity. Specifically, the porosity of specimens at day 7 and day 28 decreased by 11% and 32%, respectively. The reason is that ultrasonic treatment enhances CG reaction-generated gelatinous substances, modifying the original pore distribution. As the curing age increases, hydration continues, and newly formed C–S–H gels preferentially fill harmful pores, reducing the total pore volume. The mechanical vibration and cavitation effects of ultrasound accelerate material reactions, leading to a notable increase in C–S–H gels and calcite. These nanoscale gels preferentially occupy harmful pores, directly reducing total porosity through a “space-occupying” mechanism, while their continuous growth reconstructs the pore structure. With prolonged curing, these cementitious products accumulate inside the material, making the overall structure more compact and compressing pore space. Additionally, localized temperature increases induced by ultrasonic vibration enhance the secondary hydration of C–S–H gels on pore walls, driving the reaction toward the formation of denser products. This not only reduces the total pore volume but also effectively decreases the number of harmful pores within the material.
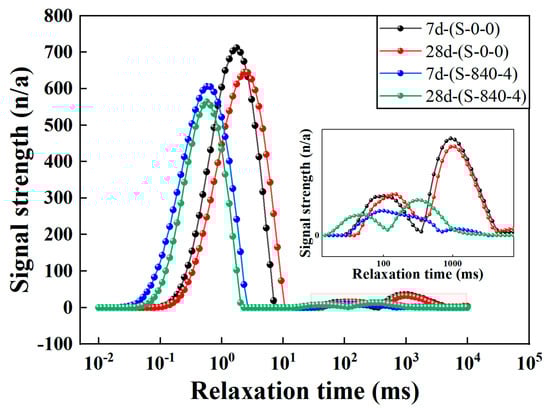
Figure 8.
T2 curves at different curing ages under different conditions.
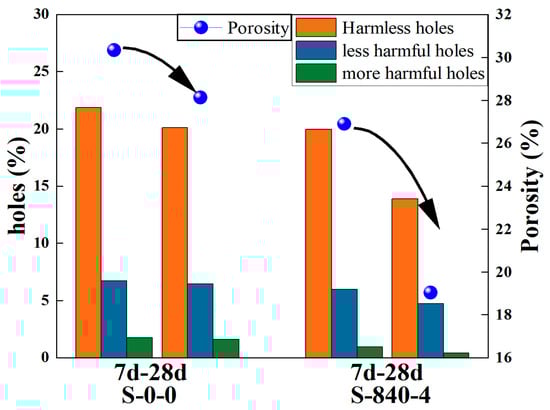
Figure 9.
Percentage of pore size at different curing ages under different conditions.
4.1.2. Fractal Dimension Based on NMR Technology
Due to the complex pore structure of GG materials, conventional geometric methods struggle to accurately characterize their pore structural features. Fractal dimension, as a key parameter in fractal theory for quantifying material pore architecture and surface roughness, overcomes this limitation by translating structural complexity into a measurable fractal dimension value. Specifically, an increase in fractal dimension typically signifies greater heterogeneity in pore spatial distribution and enhanced surface irregularity of particle morphology [39]. Studies have demonstrated that there exists a specific mathematical correlation between fractal dimension and pore volume:
where Sv represents the ratio of the cumulative pore volume to the total pore volume when the lateral relaxation duration is less than T2, Dv denotes the pore volume fractal dimension, T2 is the relaxation time variable, and T2max denotes the maximum relaxation time variable.
According to the different pore sizes, the curves were divided into harmless pore fractal region (lgT2 ≤ 0.12 nm), less harmful pore fractal region (0.12 nm < lgT2 ≤ 0.52 nm), and harmful pore fractal region (lgT2 > 0.52 nm), and each region was independently fitted with segmented linear regression, and the fractal dimensions of the pore structure of the specimens before and after ultrasonic treatment were obtained as shown in Table 3. The relationship between lgT2 and lgSv of the specimen under different conditions is shown in Figure 10. As can be seen from Figure 10, the slope of the lgT2~lgSv relationship curve is steeper in the non-harmful pore fractal region, with a value of 3.2784, while the slope tends to flatten in the less harmful and more harmful pore fractal regions. This is because, in the harmless pore region, the pore size and pore volume are small and sensitive to the applied magnetic field, the relaxation time is short and the response is rapid; with the increase of the pore size and volume, the water content in the pore increases, and the response to the applied magnetic field is gradually sluggish, resulting in the slope of the curves gradually slowing down from the steepness of the curve. D1, D2, and D3 represent the fractal dimensions of the harmless, less-harmful, and more-harmful pores, and the results of the calculations are shown in Table 3. In three-dimensional Euclidean space, the fractal dimension of pore structure ranges between 2 and 3. The overall slope of the fractal region of the harmless pores is large, resulting in the average value of D1 being less than 0, which does not conform to the definition of fractal dimension and therefore is not of practical significance [40]. As shown in Table 3, the other two fractal regions have obvious fractal characteristics. The fractal dimension value showed an upward trend after ultrasonication, indicating that the pore structure tends to be complex, and the percentage of harmful pores is the lowest. The reason is that the inhomogeneity of pore distribution and the variability of pore morphology inside the specimen lead to different fractal characteristics of its pore structure.
Table 3.
Results of fractal dimension of hole structure under different conditions.
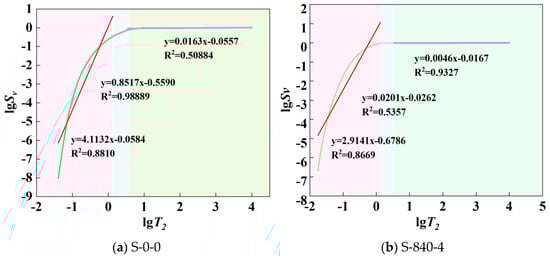
Figure 10.
Relationship between lgT2 and lgSv under different conditions.
4.2. Scanning Electron Microscope Analysis
In order to study the ultrasonic enhancement mechanism on AAM–CG materials, scanning electron microscopy was used to observe its micro-morphology, as shown in Figure 11. As evidenced in Figure 11a, under non-ultrasonic conditions, the generation of gelling material demonstrates quantitatively limited production. The material exhibits an inherent network of primary cracks and micropores, where crack formation is primarily attributed to the gelling substance predominantly encapsulating agglomerate exteriors without penetrating their internal matrix. This incomplete reaction within agglomerates results in insufficient gelling material synthesis, thereby inducing segregation cracks between particulate clusters. Concurrently, micropores originate from either entrapped gas evolution or incomplete hydration reactions. These cracks and micropores disrupt the percolation network and structural continuity of the cementitious matrix, significantly degrading material densification. When subjected to mechanical loading, localized stress concentration preferentially develops at these defects, progressively compromising the material’s mechanical integrity. Furthermore, Ca(OH)2 crystals are observed on the material surface, presenting in flaky forms, indicating that some Ca(OH)2 did not fully participate in the reaction but merely accumulated without effectively transforming into hydration products beneficial to material strength.
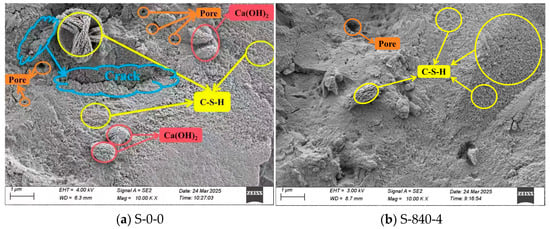
Figure 11.
SEM images under different conditions.
The internal microscopic morphology of the specimen after ultrasonic treatment is shown in Figure 11b. It shows that the amount of gelling material generated inside the material has increased significantly, and the distribution is homogeneous and dense, with only a small number of micropores present. Under the ultrasonic treatment, the agglomerates of CG particles were dispersed, the specific surface area increased, and the activity increased, while no obvious Ca(OH)2 crystals appeared, suggesting more complete hydration reactions that promote substantial cementitious product formation. These products are uniformly dispersed and tightly interwoven, effectively filling internal pores and gaps, thereby greatly enhancing material density. It is worth noting that after ultrasonic treatment, the distribution of granular C–S–H gels is denser and tighter. C–S–H gel is the key hydration product determining the strength of AAM–CG materials; the close and uniform arrangement of C–S–H gels indicates strong interfacial bonding within the material. Ultrasonic treatment improves the overall microstructural integrity and connectivity, strengthening interactions between components. This facilitates more effective stress transfer under loading, preventing localized stress concentration and subsequent failure, ultimately leading to improved compressive strength.
4.3. Energy Dispersive Spectroscopy Analysis
In order to reveal the influence of ultrasonic treatment on the hydration process of AAM–CG materials, the specimens before and after the ultrasonic treatment were characterized by nodal element distribution through EDS spectroscopy, as shown in Figure 12. Figure 12 denotes this in the Ca/Si value after ultrasonic treatment was obviously reduced. The percentages of different elemental contents are shown in Table 4. The contents of Al and Si elements exhibited an increasing trend after ultrasonic treatment, while the Ca content decreased. This phenomenon can be attributed to the fact that ultrasonic treatment effectively enhanced the spatial distribution homogeneity of reactive components (Al, Si, and Ca) within the material. The originally agglomerated or unevenly distributed active components became more uniformly dispersed throughout the system under ultrasonic action. Consequently, a greater amount of Ca(OH)2 could participate in secondary reactions, leading to increased formation of calcium silicate hydrate (C–S–H) gel. This process resulted in a relative reduction of Ca content, while the Si content increased due to its involvement in gel formation and improved distribution uniformity, ultimately causing the observed decrease in the Ca/Si ratio. Furthermore, ultrasonic treatment induced a densification reconstruction process in the material’s microporous structure. Newly formed hydration products partially filled the originally larger pores, reducing pore size and creating a more compact structure. This microstructural modification not only contributed to enhanced mechanical properties but also influenced the relative distribution of elemental contents. These findings collectively reflect the significant impact of ultrasonic treatment on the hydration process of coal gangue–slag based cementitious materials.
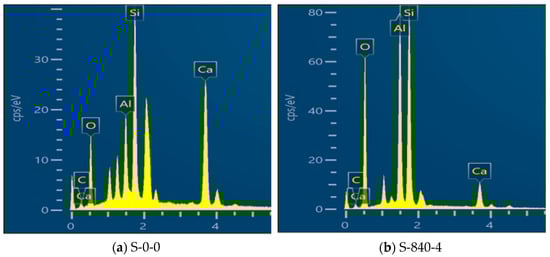
Figure 12.
EDS images under different conditions.
Table 4.
Percentage of Different Element Content.
4.4. X-Ray Diffraction Analysis
As shown in Figure 13, the XRD patterns of specimens before and after ultrasonic treatment exhibit identical characteristic peaks. This indicates that ultrasonic treatment did not alter the types of hydration products but modified their relative proportions. XRD analysis further revealed that in the untreated specimen, the characteristic peak intensities of crystalline inert components in CG (quartz and kaolinite) were significantly higher than those of gel-phase hydration products (C–S–H gel and calcite).
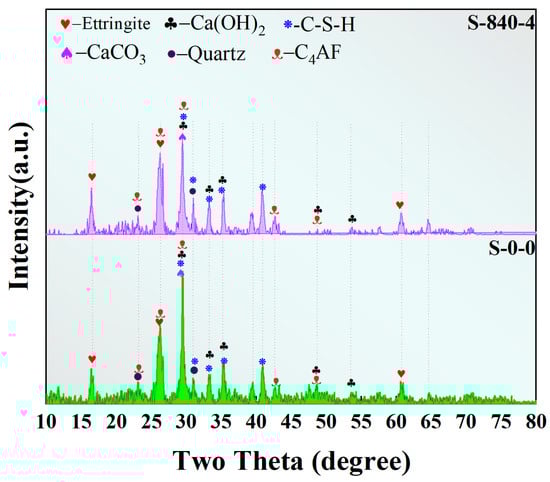
Figure 13.
XRD images under different conditions.
This phenomenon indicates that the pozzolanic reaction was limited to the particle surface layers and occurred to a low degree. The underlying reason is that the surface activation of CG particles was insufficient, and the dissociation rates of Si–O and Al–O bonds in the aluminosilicate minerals were slow, leading to inadequate release of active aluminosilicate ions and thus restricting the formation of cementitious materials. In contrast, ultrasonic treatment utilizes cavitation effects to break up and disperse CG particles, exposing more active surfaces. This process not only enhances the contact efficiency between aluminosilicate minerals and the alkaline solution but also disrupts the inert layer structure on the particle surface. As the particles are refined and internal active sites are released, the reaction progresses from initial surface adsorption to deeper penetration into the particles, ultimately generating more cementitious materials, primarily represented by C–S–H gel.
4.5. Thermogravimetric Analysis
Thermogravimetric (TGA)–Differential Thermogravimetric (DTG) test analysis can reveal crucial information about the transformation of materials, their thermodynamic properties, and thermal stability within specimens. This is achieved by closely monitoring and analyzing the mass change of specimens at various temperatures. The results of the TGA and DTG tests are presented in Figure 14. Table 5 shows the percentage of mass loss for the specimens with ultrasonic treatment, while Table 6 details how the DTG peak integration area varies across different temperature intervals. As can be seen from Figure 14, the TGA curve is a direct response to the absolute amount of the actual weight loss at each stage, which shows a similar declining trend, and the DTG curve represents the duration and intensity of the rate of mass loss in a specific temperature range (the “weight loss fast and slow”). The Gaussian peak splitting method was used, with fitting parameters R2 all exceeding 0.99, confirming the reliability of the decomposition stage division. Comparing the TGA and DTG curves, it can be found that the mass loss process of the specimens can be roughly categorized into the following three main stages as the temperature increases. Firstly, stage 1 (30 °C to 250 °C) is mainly due to the evaporation of physically bound water from the reaction products of the cementitious materials, and therefore, the peak of the DTG curve at a temperature at 150 °C is enhanced. Subsequently, stage 2 (250 °C to 600 °C) is mainly due to C–S–H thermal decomposition and dehydroxylation of the reaction products of the gelling materials. Finally, stage 3 (600 °C to 900 °C) is mainly due to the heat absorption peaks generated by the decomposition of calcium carbonate during the high temperature calcination of the specimens [41]. A sharp peak appears on the DTG curve at 650 °C, indicating the decarbonization of calcium carbonate. Compared to untreated specimens, the ultrasonically treated samples exhibit a stronger peak, suggesting more intense decarbonation.
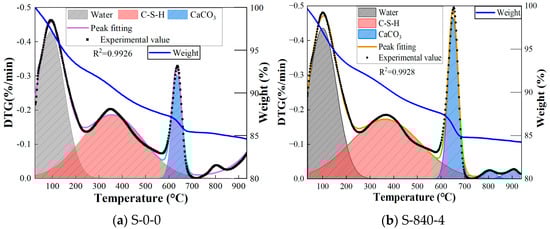
Figure 14.
Thermogravimetric curve under different conditions.
Table 5.
TGA mass loss ratio before and after ultrasonic treatment.
Table 6.
DTG peak integral area before and after ultrasonic treatment.
In the first peak, the DTG peak area of CG was significantly reduced after ultrasonic treatment, while the TGA mass loss remained at a low level. This is because the cavitation effect produced by ultrasonic treatment prompted particle fragmentation and pore refinement, resulting in a large reduction in the internal macroporous structure of CG. This effectively destroyed the free-water storage space and rapid volatilization path, resulting in a reduction in the free-water volatilization rate, which is manifested as a reduction in the area of the DTG peak. At the same time, although ultrasonic treatment changed the pore structure, the remaining free water still exists in the physical adsorption state. Coupled with the low hydrophilic activity of CG itself, the absolute value of the total weight loss is still maintained at a low level. In contrast, for the CG without ultrasonic treatment, due to the large size of internal harmful pores, a large amount of free water volatilizes rapidly through physical adsorption at low temperatures, presenting a large-area DTG peak (fast weight-loss rate). However, due to the limited adsorption capacity of CG itself, the total amount of free water is limited, so the proportion of the TGA mass loss is small. In the second peak, the area is large after ultrasonic treatment, but the TGA mass loss is small. The reason is that ultrasonic treatment promotes the dissolution of the active components of CG, generating C–S–H gel. The interlayer water in the gel accelerates the dehydration rate in the mid-temperature region because ultrasonic treatment disperses the particles, resulting in the broadening of the DTG peak and an increase in its area. Since the interlayer water is weakly bound water and the total amount is still limited, and the inert components in CG do not decompose in large quantities, there is no significant increase in the absolute value of the total weight loss at this stage. For the third peak, the area increased significantly after ultrasonic treatment. Cavitation heat and mechanical activation promotes the generation of a large number of nanoscale C–S–H gels. The structural water in these gels is gradually removed at high temperatures, manifested as the broadening of the DTG peak and a significant increase in its area. Meanwhile, the activated Si–Al reacted sufficiently after ultrasonic treatment, and the total amount of gel generated was higher than that of the non-ultrasonic group. Therefore, the absolute value of the cumulative weight loss in the high-temperature region increased, corresponding to the decrease of the TGA curve in this interval.
5. Conclusions
- The ultrasonic dispersion tests and quantitative fractal dimension analysis indicate that ultrasonic treatment effectively disrupts CG agglomerates and flocculated structures in fresh slurry, leading to uniform dispersion of CG particles in the liquid phase, increased surface area, and enhanced reactivity. Combined with compressive strength test results, the optimal ultrasonic parameters were determined to be an effective power of 840 W and a duration of 4 min. This treatment significantly improves the material’s mechanical properties.
- Microscopic analysis revealed that the fractal dimension exhibited an initial increase followed by a decrease after ultrasonic treatment. Since a higher fractal dimension indicates more complex pore distribution, the ultrasonic treatment expends the microscopic reaction interface area of particles. This significantly promotes the generation and uniform distribution of cementitious substances, resulting in denser and more compact granular C–S–H gels. Consequently, the porosity of AAM–CG materials is reduced and the pore structure optimized. Furthermore, this process enhances interfacial bonding performance, strengthens internal interactions, and significantly improves material strength.
- Diffraction and thermogravimetric analyses reveal that the core function of ultrasonic treatment is to enhance CG activity (promoting pozzolanic reactions) through mechanical actions (particle fragmentation and dispersion). This ultrasonic treatment modifies only the relative proportions of substances while preserving the types of reaction products. Specifically, it converts “rapid, low-level mass loss” in the low-temperature region into “sustained, significant mass loss” at elevated temperatures. Consequently, DTG/TGA curves exhibit peak shifts to higher temperatures and intensified high-temperature peaks, indicating the material’s transition from an inert porous structure to an active nano-gel structure.
Author Contributions
Methodology, X.Z.; Software, Q.Q.; Resources, Y.H.; Data curation, R.L.; Writing—original draft, Z.L.; Writing—review & editing, H.H. All authors have read and agreed to the published version of the manuscript.
Funding
This research was funded by the National Natural Science Foundation of China (52408257).
Data Availability Statement
Data is contained within the article.
Conflicts of Interest
The authors declare no conflict of interest.
References
- Li, J.; Li, S.; Wang, X.; Fan, F.; Zhao, K.; Wei, J.; Zhang, L.; Zhu, D. Biologically inspired silk fibroin grafted polyacrylonitrile filtration membrane prepared in ZnCl2 aqueous solution. Chin. Chem. Lett. 2019, 30, 239–242. [Google Scholar] [CrossRef]
- Zhang, X.; Feng, X.; Wang, Z.; Jian, J.; Chen, S.; Luo, W.; Zhang, C. Experimental study on the physico-mechanical properties and microstructure of foam concrete mixed with coal gangue. Constr. Build. Mater. 2022, 359, 129428. [Google Scholar] [CrossRef]
- Wang, S.; Luo, K.; Wang, X.; Sun, Y. Estimate of sulfur, arsenic, mercury, fluorine emissions due to spontaneous combustion of coal gangue: An important part of Chinese emission inventories. Environ. Pollut. 2016, 209, 107–113. [Google Scholar] [CrossRef] [PubMed]
- Zhang, Y.; Xu, L.; Seetharaman, S.; Liu, L.; Wang, X.; Zhang, Z. Effects of chemistry and mineral on structural evolution and chemical reactivity of coal gangue during calcination: Towards efficient utilization. Mater. Struct. 2015, 48, 2779–2793. [Google Scholar] [CrossRef]
- Wang, A.G.; Liu, P.; Sun, D.S.; Liu, K.W.; Fang, L.A.; Cao, J.F. Research progress on activity evaluation methods of calcined coal gangue powder materials. Mater. Rev. 2018, 32, 1903–1909. [Google Scholar]
- Wang, X.; Liu, F.; Pan, Z.; Chen, W.; Muhammad, F.; Zhang, B.; Li, L. Geopolymerization of coal gangue via alkali-activation: Dependence of mechanical properties on alkali activators. Buildings 2024, 14, 787. [Google Scholar] [CrossRef]
- Phoo-Ngernkham, T.; Sata, V.; Hanjitsuwan, S.; Ridtirud, C.; Hatanaka, S.; Chindaprasirt, P. High calcium fly ash geopolymer mortar containing Portland cement for use as repair material. Constr. Build. Mater. 2015, 98, 482–488. [Google Scholar] [CrossRef]
- Guo, X.; Shi, H.; Dick, W.A. Compressive strength and microstructural characteristics of class C fly ash geopolymer. Cem. Concr. Compos. 2010, 32, 142–147. [Google Scholar] [CrossRef]
- Kaze, C.R.; Lecomte-Nana, G.L.; Adesina, A.; Nemaleu, J.G.D.; Kamseu, E.; Melo, U.C. Influence of mineralogy and activator type on the rheology behaviour and setting time of laterite based geopolymer paste. Cem. Concr. Compos. 2022, 126, 104345. [Google Scholar] [CrossRef]
- Fei, E.; Zhang, X.; Su, L.; Liu, B.; Li, B.; Li, W. Analysis of calcination activation modified coal gangue and its acid activation mechanism. J. Build. Eng. 2024, 95, 109916. [Google Scholar]
- Kaze, C.R.; Lecomte-Nana, G.L.; Kamseu, E.; Camacho, P.S.; Yorkshire, A.S.; Provis, J.L.; Duttine, M.; Wattiaux, A.; Melo, U.C. Mechanical and physical properties of inorganic polymer cement made of iron-rich laterite and lateritic clay: A comparative study. Cem. Concr. Res. 2021, 140, 106320. [Google Scholar] [CrossRef]
- Ding, S.; Chen, J.; Guan, X. Experimental study on active excitation of coal gangue and mechanical properties of mortar. China Concr. Cem. Prod. 2021, 12, 79–83. [Google Scholar]
- Wang, A.; Liu, P.; Mo, L.; Liu, K.; Ma, R.; Guan, Y.; Sun, D. Mechanism of thermal activation on granular coal gangue and its impact on the performance of cement mortars. J. Build. Eng. 2022, 45, 103616. [Google Scholar] [CrossRef]
- Jiu, S.; Wang, M.; Chen, Y.; Chen, J.; Gao, Q. Synthesis and characterization of low-carbon cementitious materials from suspended calcined coal gangue. Front. Mater. 2022, 9, 982861. [Google Scholar] [CrossRef]
- Zhang, Y.; Ling, T.C. Reactivity activation of waste coal gangue and its impact on the properties of cement-based materials–A review. Constr. Build. Mater. 2020, 234, 117424. [Google Scholar] [CrossRef]
- Liu, X.; Wang, P.; Ding, M. Hydration process in Portland cement blended with activated coal gangue. J. Zhejiang Univ.-Sci. A 2011, 12, 503–510. [Google Scholar] [CrossRef]
- Cao, Z.; Cao, Y.; Dong, H.; Zhang, J.; Sun, C. Effect of calcination condition on the microstructure and pozzolanic activity of calcined coal gangue. Int. J. Miner. Process. 2016, 146, 23–28. [Google Scholar] [CrossRef]
- Mermerdaş, K.; Gesoğlu, M.; Güneyisi, E.; Özturan, T. Strength development of concretes incorporated with metakaolin and different types of calcined kaolins. Constr. Build. Mater. 2012, 37, 766–774. [Google Scholar] [CrossRef]
- He, Z.; Ju, F.; Ning, P.; Xiao, M.; Wang, T.; Wang, D. Acoustic emission investigation of coal gangue cementitious composites under effects on fiber type. Case Stud. Constr. Mater. 2022, 17, e01567. [Google Scholar] [CrossRef]
- Huang, G.; Ji, Y.; Li, J.; Hou, Z.; Dong, Z. Improving strength of calcinated coal gangue geopolymer mortars via increasing calcium content. Constr. Build. Mater. 2018, 166, 760–768. [Google Scholar] [CrossRef]
- Zhao, Y.; Zhang, Z.; Ji, Y.; Song, L.; Ma, M. Experimental research on improving activity of calcinated coal gangue via increasing calcium content. Materials 2023, 16, 2705. [Google Scholar] [CrossRef] [PubMed]
- Ma, H.; Zhu, H.; Yi, C.; Fan, J.; Chen, H.; Xu, X.; Wang, T. Preparation and Reaction Mechanism Characterization of Alkali-activated Coal Gangue–Slag Materials. Materials 2019, 12, 2250. [Google Scholar] [CrossRef]
- Kumar, S.; Kumar, R.; Mehrotra, S.P. Influence of granulated blast furnace slag on the reaction, structure and properties of fly ash based geopolymer. J. Mater. Sci. 2010, 45, 607–615. [Google Scholar] [CrossRef]
- Liu, R.; Zhang, C.; Liu, H.; Pei, Y.; Li, X.; Wang, Z. Effects of flocculation of cement slurry on groutability of porous media. Constr. Build. Mater. 2020, 237, 117649. [Google Scholar] [CrossRef]
- Ouyang, J.; Han, B.; Chen, G.; Zhao, L.; Ou, J. A viscosity prediction model for cement paste with nano-SiO2 particles. Constr. Build. Mater. 2018, 185, 293–301. [Google Scholar] [CrossRef]
- Chen, Y.; Chelgani, S.C.; Bu, X.; Xie, G. Effect of the ultrasonic standing wave frequency on the attractive mineralization for fine coal particle flotation. Ultrason. Sonochem. 2021, 77, 105682. [Google Scholar] [CrossRef] [PubMed]
- Toraman, O.Y. Experimental investigations of preparation of calcite particles by ultrasonic treatment. Physicochem. Probl. Miner. Process. 2017, 53, 859–868. [Google Scholar]
- Kumar, A.R.S.; Padmakumar, A.; Kalita, U.; Samanta, S.; Baral, A.; Singha, N.K.; Ashokkumar, M.; Qiao, G.G. Ultrasonics in polymer science: Applications and challenges. Prog. Mater. Sci. 2023, 136, 101113. [Google Scholar] [CrossRef]
- Wang, X.; Huang, J.; Dai, S.; Ma, B.; Tan, H.; Jiang, Q. Effect of silica fume particle dispersion and distribution on the performance of cementitious materials: A theoretical analysis of optimal sonication treatment time. Constr. Build. Mater. 2019, 212, 549–560. [Google Scholar] [CrossRef]
- Chen, C.; Tang, B.; Cao, X.; Gu, F.; Huang, W. Enhanced photocatalytic decomposition of NO on portland cement concrete pavement using nano-TiO2 suspension. Constr. Build. Mater. 2021, 275, 122135. [Google Scholar] [CrossRef]
- Hou, P.; Shi, J.; Prabakar, S.; Cheng, X.; Wang, K.; Zhou, X.; Shah, S.P. Effects of mixing sequences of nanosilica on the hydration and hardening properties of cement-based materials. Constr. Build. Mater. 2020, 263, 120226. [Google Scholar] [CrossRef]
- Jiao, Y.; Yang, Z.; Han, X.; Wang, K.; Fang, C.; Zhao, Z.; Tang, W. Ultrasonication Improves the Flotation of Coal Gasification Fine Slag Residue. Minerals 2024, 14, 363. [Google Scholar] [CrossRef]
- Xu, Z.; Ji, Y.; Ma, Z.; Xu, S.; Zhang, J.; Zhang, Z.; Xue, Q. Strengthening mechanism of ultrasonic action on mechanical properties of cement-based materials. Constr. Build. Mater. 2023, 362, 129788. [Google Scholar] [CrossRef]
- Luo, Z.; Li, W.; Li, P.; Wang, K.; Shah, S.P. Investigation on effect of nanosilica dispersion on the properties and microstructures of fly ash-based geopolymer composite. Constr. Build. Mater. 2021, 282, 122690. [Google Scholar] [CrossRef]
- Santos, R.M.; François, D.; Mertens, G.; Elsen, J.; Van Gerven, T. Ultrasound-intensified mineral carbonation. Appl. Therm. Eng. 2013, 57, 154–163. [Google Scholar] [CrossRef]
- Li, S.; Wang, H.; Wang, S.; Xie, F.; Sun, X. Mechanism and kinetics of ultrasound-enhanced CaCO3 precipitation for indium enrichment in zinc oxide dust leaching solution. Ultrason. Sonochem. 2024, 110, 107046. [Google Scholar] [CrossRef]
- Zou, Q.; Liao, Y.; An, M.; Cao, Y.; Su, H.; Wang, K.; Luo, G. Effect of ultrasonic pretreatment on the flocs characteristics in the flocculation filtration process of coal slurry water. Colloids Surf. A Physicochem. Eng. Asp. 2024, 692, 134010. [Google Scholar] [CrossRef]
- Guo, T.; Wu, T.; Gao, L.; He, B.; Ma, F.; Huang, Z.; Bai, X. Compressive strength and electrochemical impedance response of red mud-coal metakaolin geopolymer exposed to sulfuric acid. Constr. Build. Mater. 2021, 303, 124523. [Google Scholar] [CrossRef]
- Xu, L.; Cai, M.; Dai, Z.; Zheng, Z.; Chen, W.; Yin, S.; Zhang, X.; Thanh, H.V.; Soltanian, M.R. Fractal and NMR based characterizations of multi-scale pore structure alterations in tight sandstones due to scCO2-water–rock interactions. Chem. Eng. J. 2025, 508, 160898. [Google Scholar] [CrossRef]
- Xin, H.; Chaoyong, W.A.; Qiang, S.; Zaitian, D. Study on fractal characteristics of pore structure of pyrolysis coal by nuclear magnetic resonance technology. Min. Res. Dev. 2021, 41, 67–75. [Google Scholar]
- Grabowska, K.; Koniorczyk, M. Influence of organosilicon admixtures on the hydration of Portland cement. J. Therm. Anal. Calorim. 2022, 147, 6131–6145. [Google Scholar] [CrossRef]
Disclaimer/Publisher’s Note: The statements, opinions and data contained in all publications are solely those of the individual author(s) and contributor(s) and not of MDPI and/or the editor(s). MDPI and/or the editor(s) disclaim responsibility for any injury to people or property resulting from any ideas, methods, instructions or products referred to in the content. |
© 2025 by the authors. Licensee MDPI, Basel, Switzerland. This article is an open access article distributed under the terms and conditions of the Creative Commons Attribution (CC BY) license (https://creativecommons.org/licenses/by/4.0/).