Abstract
Conventional high-pressure mercury injection (HPMI) alone inadequately characterizes the fractal properties of nanopores in tight sandstone reservoirs, and existing fractal models for HPMI, low-temperature nitrogen adsorption (LTNA), and nuclear magnetic resonance (NMR) lack effective integration. Based on traditional fractal theory, this study develops a unified full-scale pore fractal model that integrates HPMI and LTNA data via a defined conversion coefficient. The model was validated using tight sandstone samples from the Songliao Basin in eastern China and the Turpan–Hami Basin in western China. Results indicate that the proposed model successfully achieves accurate characterization of full-scale pore fractal behavior. Furthermore, it provides a robust fractal-based framework for calibrating NMR T2 relaxation time and constructing enhanced full-scale pore-throat distribution profiles, thereby validating its effectiveness and practical utility as defined in our objectives.
1. Introduction
Tight oil and gas resources constitute a significant component of global unconventional hydrocarbon reserves and play a crucial role in the ongoing energy transition [1,2]. Compared with conventional sandstone reservoirs, tight sandstones are characterized by low porosity and permeability, poor pore connectivity, complex pore-throat structures, and significant heterogeneity across nano- to micro-scales [3,4,5,6]. The intricate and heterogeneous pore limits the applicability of conventional Euclidean geometry characterization [7], necessitating advanced methods to quantify pore structure complexity.
Fractal theory, introduced by Mandelbrot [8], describes scale-invariant self-similarity between local and global structures. Previous studies have demonstrated that microscopic pore-throat systems in porous media exhibit such fractal characteristics [9], making fractal geometry a powerful tool for analyzing pore structures in tight sandstones. The fractal dimension, serving as a quantitative measure of structural irregularity and complexity, has been widely applied in tight reservoir studies [10,11].
Several fractal models are currently employed to characterize pore structures in tight sandstones:
- (1)
- HPMI/(Constant-rate mercury injection) CRMI-based models derive fractal dimensions from mercury saturation-capillary pressure relationships. Although widely applied [7,12,13,14,15], these models are limited by incomplete mercury intrusion, leading to inaccuracies in characterizing small pores and an inadequate representation of full-scale pore systems.
- (2)
- LTNA-based models accurately characterize nanopore fractal features, particularly in coal and shale studies [16,17,18,19,20,21], with some applications to tight sandstones [22,23,24]. However, LTNA is restricted to pores below 50 nm and employs a more complex pore-radius conversion relationship compared to HPMI and NMR, hindering integration with other methods.
- (3)
- NMR-based models enable non-destructive analysis across a broad pore-size range. Some studies use T2 cutoffs to differentiate movable and bound fluids for fractal analysis [15,25,26], while others combine NMR with HPMI/CRMI to classify pores by size [27,28,29]. However, NMR requires calibration with mercury injection data and has strict sample requirements.
Although some studies have employed both LTNA and HPMI to extend the fractal characterization across different scales [30], a critical gap remains: these works typically present the fractal dimensions and pore-size distributions obtained from each technique in parallel, lacking a unified mathematical framework to seamlessly integrate the continuum of data across the entire nano- to micro-scale range. The primary novelty and necessity of this study are threefold. First, it addresses a critical methodological gap by establishing the first unified fractal model that integrates HPMI and LTNA data through a physically defined conversion coefficient, enabling seamless full-scale characterization. Second, it provides a necessary and practical alternative to NMR-based fractal analysis, which is often constrained by cost, availability, or sample requirements. Third, it introduces a novel fractal-centric framework for calibrating NMR T2 relaxation times and constructing pore-throat distributions, moving beyond traditional empirical fittings. By validating this approach on tight sandstones from two major Chinese basins with differing geological histories, we demonstrate its robustness and universal applicability, offering a significant advance in quantitative pore structure evaluation.
2. Geological Setting
To validate the rationality and universal applicability of the proposed methodology, this study examines tight sandstone reservoirs from two distinct geological settings: the Lower Cretaceous Yingcheng Formation in the Changling Fault Depression of the Songliao Basin (eastern China) and the Middle Jurassic Xishanyao Formation in the Taibei Sag of the Turpan–Hami Basin (western China).
The Songliao Basin, located in northeastern China (Figure 1a), is a large Mesozoic–Cenozoic intracratonic rift basin covering approximately 2.6 × 10⁵ km2 [16,31]. It comprises six primary tectonic units: the central depression, northern plunge, northeastern uplift, western slope, southeastern uplift, and southwestern uplift (Figure 1b). The Changling Fault Depression, situated in the southern part of the central depression, developed mainly during the Late Jurassic to Early Cretaceous and spans an area of about 1.3 × 10⁴ km2 [25]. Within it, the Longfengshan Sub-sag lies in the southern section, characterized by a structural pattern influenced by NE-trending basement detachment faults, forming a western salient, a southeastern low bulge, and a central depression [32].
The Turpan–Hami Basin, located in northwestern China (Figure 1a), is an elongate east–west-trending intermontane basin developed at the junction of the Tarim, Kazakhstan, and Siberian plates [33], with a total area of approximately 5.3 × 10⁴ km2. It is divided into four first-order structural elements: the Turpan Depression, Aydingkol Lake Slope, Liaodun Uplift, and Hami Depression. The Taibei Sag, situated within the Turpan Depression, represents the most significant hydrocarbon-bearing unit in the basin, covers about 1.09 × 10⁴ km2 and is subdivided into three sub-sags: Shengbei, Qiudong, and Xiaocaohu (Figure 1c) [34].

Figure 1.
(a) Geographic location of the Songliao and Turpan-Hami Basins in China; (b) Structural location of the Longfengshan Sub-sag in the Songliao Basin showing well locations [25]; (c) Structural framework of the Taibei Sag in the Turpan-Hami Basin [35].
Figure 1.
(a) Geographic location of the Songliao and Turpan-Hami Basins in China; (b) Structural location of the Longfengshan Sub-sag in the Songliao Basin showing well locations [25]; (c) Structural framework of the Taibei Sag in the Turpan-Hami Basin [35].

3. Materials, Experiments, and Methods
3.1. Materials
A total of eight standard plug samples (2.5 cm in diameter, 3 cm in length) were collected from tight sandstone reservoirs, comprising four samples from the Songliao Basin and four from the Turpan–Hami Basin. Prior to experimental analysis, all samples underwent deoiling treatment using a mixture of ethanol and benzene.
3.2. Experiments
3.2.1. High-Pressure Mercury Injection (HPMI)
HPMI analysis was conducted using an AutoPore IV 9505 porosimeter (Micromeritics, Norcross, GA, USA, Figure 2), capable of measuring pore-throat radii from 0.005 μm to 360 μm under applied pressures of 0–228 MPa. The pore-throat radius (rH) was determined using the Washburn equation [36]:
where Pc represents capillary pressure, σ denotes the surface tension of mercury (0.48 N/m), and θ is the contact angle, typically taken as 140°. According to this relationship, rH is inversely proportional to Pc.
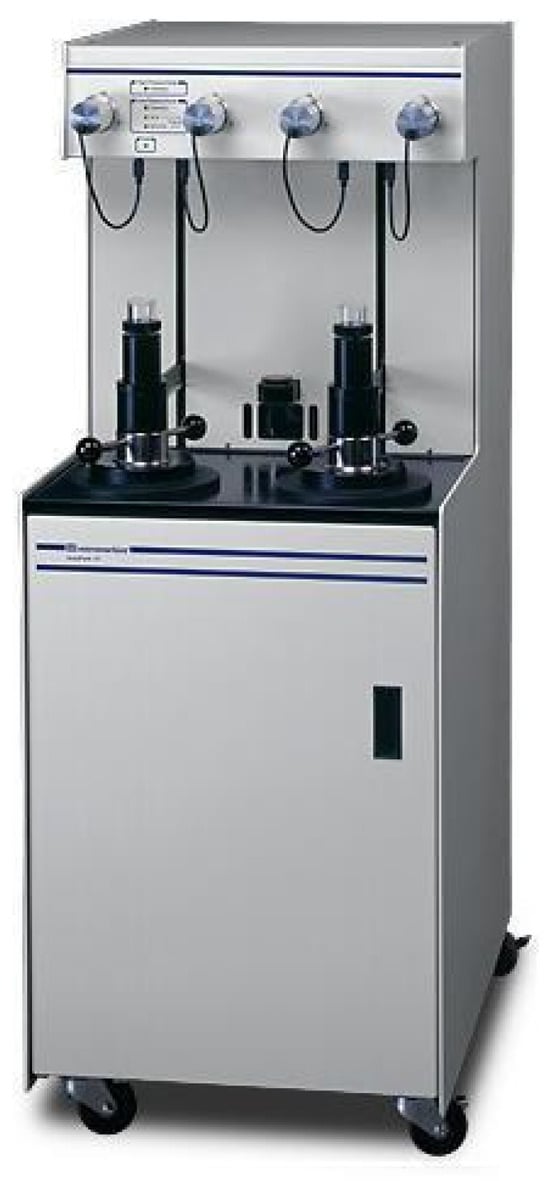
Figure 2.
AutoPore IV 9505 porosimeter.
3.2.2. Low-Temperature Nitrogen Adsorption (LTNA)
However, accurate characterization of pores below ~50 nm (corresponding to pressures above ~30 MPa) is often compromised in practice. This limitation arises from several factors: (1) at high injection pressures, mercury may compress the rock skeleton or induce micro-fractures, leading to overestimated pore volume; (2) the assumption of a constant contact angle may become invalid in nanoscale, heterogeneous, or clay-rich pore systems; and (3) the “ink-bottle” effect can cause significant hysteresis and underestimation of smaller pore-throat sizes. Therefore, while HPMI provides a broad nominal measurement range, its reliability for quantifying the fractal geometry of true nanopores (<50 nm) is limited.
LTNA analysis was conducted using an Autosorb-iQ surface area and porosity analyzer (Quantachrome Instruments, Boynton Beach, FL, USA, Figure 3). The instrument operates within a pressure range of 0–950 mmHg, measures pore diameters from 0.35 nm to 500 nm, and detects specific surface areas as low as 0.0001 m2/g. Despite this wide theoretical range, the LTNA method is most reliable and widely applied for characterizing pores below 50 nm (mesopores). For larger macropores (>50 nm), the physical adsorption mechanism becomes less sensitive, resulting in a weak and flat adsorption isotherm that complicates accurate volume quantification and fractal analysis. Consequently, LTNA data for pores above 50 nm are often associated with higher uncertainty and are seldom used independently for full-scale pore system characterization in tight sandstones.
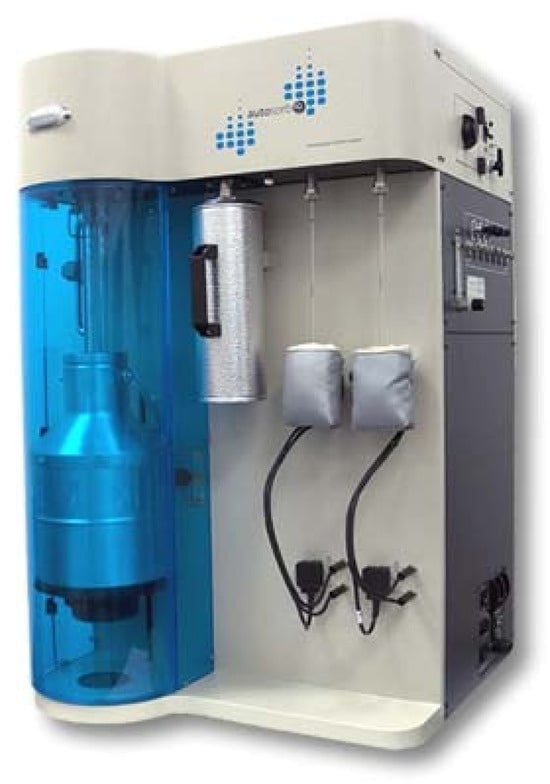
Figure 3.
Autosorb-iQ surface area and porosity analyzer.
3.2.3. Nuclear Magnetic Resonance (NMR)
NMR measurements were performed using a MesoMR23-060H-I medium-scale NMR analysis and imaging system (Niumag, Suzhou, China, Figure 4). Prior to testing, core samples were fully saturated with brine under 20 MPa pressure, followed by centrifugation for 2 h. The T2 relaxation time and signal amplitude were subsequently measured at 23 °C.
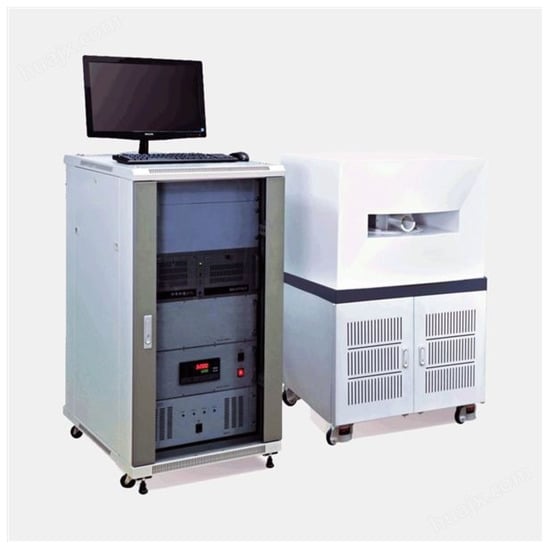
Figure 4.
MesoMR23-060H-I medium-scale NMR analysis and imaging system.
In saturated porous media, T2 relaxation behavior is governed by three mechanisms: surface relaxation, bulk relaxation, and diffusion relaxation [37]. Under conditions of complete water saturation, sufficiently high magnetic field strength, and minimal echo spacing, the effects of bulk fluid relaxation and diffusion can be neglected [37,38]. Thus, the T2 relaxation time can be simplified as:
where T2 is the transverse relaxation time, S/V represents the pore surface-to-volume ratio, and ρ denotes the surface relaxivity, a property reflecting the rock-fluid interaction [39]. This relationship indicates that T2 is inversely proportional to both the surface relaxivity and the specific surface area of the pore system.
Meanwhile, S/V can be expressed in terms of pore geometry as:
where Fs is the pore shape factor (Fs = 3 for spherical pores; Fs = 2 for tubular pores), and rN denotes the pore-throat radius derived from NMR measurements.
Substituting Equation (3) into Equation (2) yields:
which can be rearranged as:
Given that both the surface relaxivity ρ and pore shape factor Fs can be treated as constants for a specific rock-fluid system, they may be combined into a single formation-dependent coefficient CN. Thus, the pore-throat radius rN derived from NMR measurements exhibits a direct proportional relationship with the transverse relaxation time T2:
This fundamental relationship enables the quantitative conversion between NMR relaxation data and pore-throat dimensions in tight sandstone reservoirs [39].
3.3. Methods
3.3.1. Fractal Dimension from HPMI
In high-pressure mercury injection experiments, the relationship between mercury saturation, pore-throat radius, and fractal dimension can be described as follows [14,40]:
And
where SHg is the mercury saturation, rmax is the maximum pore-throat radius, and DH is the HPMI fractal dimension. By plotting the double logarithmic relationship between lg(1 − SHg) and lg(rH), and determining the slope KH of the fitted line, the fractal dimension DH is obtained as:
This approach quantifies the structural complexity of the pore system based on capillary pressure data.
3.3.2. Fractal Dimension from LTNA
The fractal characteristics derived from LTNA data are commonly quantified using the Frenkel–Halsey–Hill (FHH) model [41]. The relationship is expressed as:
where VL represents the volume of adsorbed nitrogen at pressure P, P0 is the saturated vapor pressure of the gas, C is a constant, and DL denotes the LTNA fractal dimension. By plotting lg(VL) against ln[ln(P0/P)] in double logarithmic coordinates and determining the slope KL of the linear regression, the fractal dimension DL is obtained as:
This method enables a robust characterization of nanoscale pore surface complexity and structural heterogeneity in tight sandstones.
3.3.3. Fractal Dimension from NMR
Nuclear magnetic resonance is commonly combined with HPMI to characterize pore-throat radius distribution. Previous studies have demonstrated that pore-throat systems characterized by NMR also exhibit significant fractal properties [42,43]. The fractal model can be established through the relationship between cumulative pore volume, T2 relaxation time, and pore-throat radius:
where Vc represents the cumulative pore volume, T2 is the transverse relaxation time, and DN is the NMR fractal dimension. Since T2min is generally much smaller than most measured T2 values, it can generally be neglected. simplifying the relationship to:
Taking logarithms of both sides yields:
By plotting lg(Vc) versus lg(T2) in double logarithmic coordinates and determining the slope KN of the linear regression, the fractal dimension DN is calculated as:
This method provides a robust approach for quantifying pore structure heterogeneity from NMR relaxation data.
4. Results
4.1. Fractal Characterization Based on HPMI
Following Equation (8), mercury saturation (SHg) and pore-throat radius (rH) from HPMI measurements were plotted on a double-logarithmic scale. The results indicate that the pore-throat systems in tight sandstones of the Yingcheng Formation (Changling Fault Depression) exhibit three-stage fractal behavior (Figure 5a–d), whereas those in the Xishanyao Formation (Taibei Sag) display either two- or three-stage fractal trends (Figure 5e–h). Based on Equation (9), the derived HPMI fractal dimensions (DH) range from 1.4214 to 2.9964.
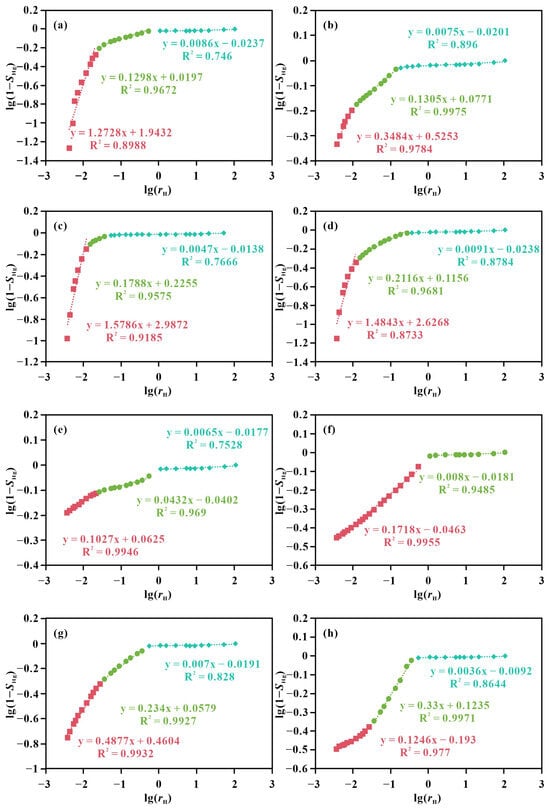
Figure 5.
Cross plot of lg(1 − SHg) vs. lg(rH) based on the HPMI data. (a) Well B206, 3235.57 m, Songliao Basin; (b) Well B206, 3332.66 m, Songliao Basin; (c) Well B206, 3409.82 m, Songliao Basin; (d) Well B208, 3590.12 m, Songliao Basin; (e) Well Db1, 2679.95 m, Turpan-Hami Basin; (f) Well G1, 1360.97 m, Turpan-Hami Basin; (g) Well G18, 3174.4 m, Turpan-Hami Basin; (h) Well Ht21, 3386.5 m, Turpan-Hami Basin.
The observed divergence in fractal stages is interpreted to reflect fundamental differences in the microscopic pore-throat architecture between the two formations, which stem from their distinct depositional and diagenetic histories. The Yingcheng Formation sandstones, deposited in a volcaniclastic-influenced rift basin setting, typically underwent complex diagenesis (e.g., clay mineral authigenesis, intense compaction) that likely created a more heterogeneous pore system with multiple dominant pore-throat populations. This complexity manifests as consistent three-stage fractal behavior. In contrast, the Xishanyao Formation in the Turpan-Hami Basin represents a fluvial-deltaic system with varying degrees of burial and cementation. The variable fractal trends (two- or three-stage) likely correspond to differences in local diagenetic intensity and the relative abundance of different pore types (e.g., intergranular vs. dissolution pores), resulting in a spectrum of pore structure complexities within the same formation.
4.2. Fractal Characterization Based on LTNA
According to Equation (10), nitrogen adsorption volume (VL) and relative pressure (P/P0) from LTNA tests were transformed, and ln(VL) was plotted against ln[ln(P0/P)] in double-logarithmic coordinates. The LTNA fractal analysis reveals a single-segment fractal behavior for both the Yingcheng (Figure 6a–d) and Xishanyao tight sandstones (Figure 6e–h), with high correlation coefficients, indicating strong self-similarity among nanopores. The corresponding LTNA fractal dimensions (DL), calculated via Equation (11), vary between 2.447 and 2.6561.
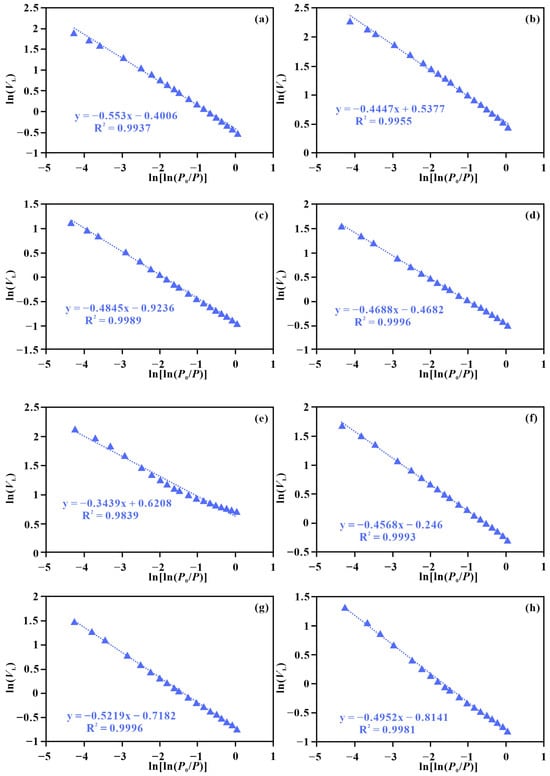
Figure 6.
Cross plot of ln(VL) vs. ln[ln(P0/P)] based on the LTNA data. (a) Well B206, 3235.57 m, Songliao Basin; (b) Well B206, 3332.66 m, Songliao Basin; (c) Well B206, 3409.82 m, Songliao Basin; (d) Well B208, 3590.12 m, Songliao Basin; (e) Well Db1, 2679.95 m, Turpan-Hami Basin; (f) Well G1, 1360.97 m, Turpan-Hami Basin; (g) Well G18, 3174.4 m, Turpan-Hami Basin; (h) Well Ht21, 3386.5 m, Turpan-Hami Basin.
4.3. Fractal Characterization Based on NMR
T2 relaxation time and cumulative pore volume were plotted on a double-logarithmic scale, with the T2 cutoff value distinguishing between bound-fluid and movable-fluid pores. Following Equation (14), the two segments of the curve were fitted separately, and the fractal dimensions for adsorption pores (D1N) and seepage pores (D2N) were obtained using Equation (15). The NMR fractal model exhibits clear two-stage fractal characteristics for tight sandstones from both the Yingcheng Formation (Figure 7a–d) and the Xishanyao Formation (Figure 7e–h). D1N ranges from 1.133 to 2.2588 and D2N lies between 2.8701 and 2.9879.
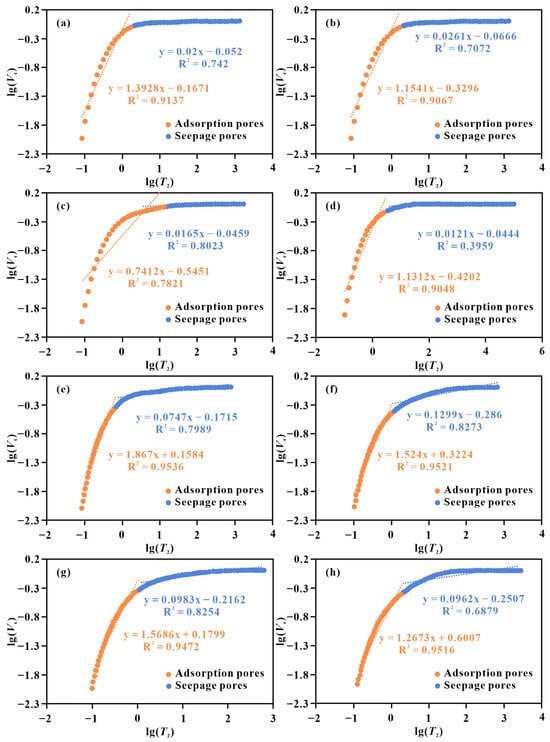
Figure 7.
Cross plot of lg(Vc) vs. Lg(T2) based on the NMR data. (a) Well B206, 3235.57 m, Songliao Basin; (b) Well B206, 3332.66 m, Songliao Basin; (c) Well B206, 3409.82 m, Songliao Basin; (d) Well B208, 3590.12 m, Songliao Basin; (e) Well Db1, 2679.95 m, Turpan-Hami Basin; (f) Well G1, 1360.97 m, Turpan-Hami Basin; (g) Well G18, 3174.4 m, Turpan-Hami Basin; (h) Well Ht21, 3386.5 m, Turpan-Hami Basin.
5. Discussion
5.1. Full-Scale Pore Fractal Model Integrating HPMI and LTNA
Equations (8) and (10) represent fractal models derived from HPMI and LTNA, respectively. To combine both models within a unified coordinate system, the variables along the horizontal and vertical axes must be standardized. First, let X = ln(P0/P) in Equation (10), and convert ln(VL) and lnX into lg(VL) and lgX, respectively. Simultaneously, transform (DL-3) into (3-DL). The derivation proceeds as follows:
Converting natural logarithms to base-10 logarithms via lna = ln10 · lga:
Dividing both sides by ln10:
Since ln10 is constant, C/ln10 can be rewritten as a new constant C′, simplifying the expression to:
which is equivalent to:
For the vertical axis, 1 − SHg in the HPMI fractal model represents the cumulative proportion of pore volume from small to large pore-throat radii. Similarly, VL in the LTNA model can be transformed into the cumulative pore volume percentage.
For the horizontal axis, 1/ln(P0/P) must be converted to pore-throat radius. The BJH (Barrett–Joyner–Halenda) model [44] is commonly used in LTNA analysis:
where rp is the pore-throat radius, t is the thickness of the adsorbed film calculated using the Halsey equation, rk is the Kelvin radius, σl is the surface tension of liquid nitrogen (0.008876 N/m), Vml is the molar volume of liquid nitrogen (0.034752 L/mol), R is the universal gas constant (8.314 J/mol/−1/K−1), and Tb is the analysis temperature (77.35 K).
Equation (21) indicates that the rp is not linearly related to 1/ln(P0/P). Therefore, a conversion factor Z (whose precise physical interpretation warrants further study) is introduced such that rpZ is interchangeable with 1/ln(P0/P), leading to:
which gives:
Curves of lg(VL) versus lg[1/ln(P0/P)] and lg(VL) versus Lg(rp) were plotted in the same coordinate system (Figure 8). The slopes of the two curves differ slightly, and from Equations (20) and (23), the ratio of the slopes equals Z, calculated as 0.8914 in Figure 8.
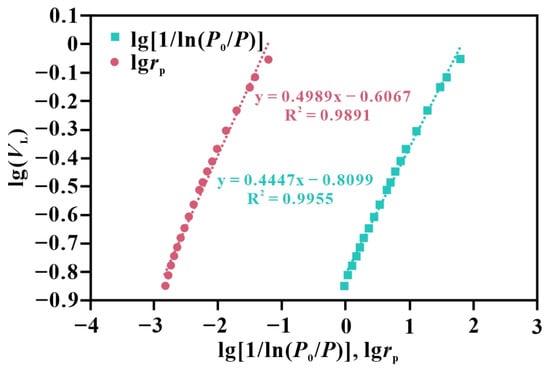
Figure 8.
Curves of lg(VL) vs. lg[1/ln(P0/P)] and lg(VL) vs. Lg(rp).
Using the modified HPMI and LTNA fractal models from Equations (8) and (23), new composite curves were plotted. The HPMI and LTNA fractal curves intersect at a single point (Figure 9a). The intersection value was recorded, retaining data from the LTNA fractal curve below this value and data from the HPMI fractal curve above it, thereby constructing a full-scale pore fractal model that integrates HPMI and LTNA data (Figure 9b).
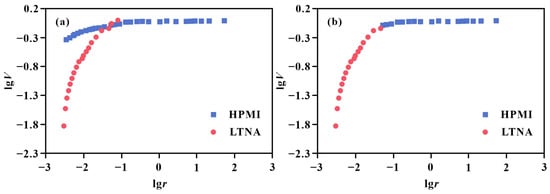
Figure 9.
(a) Intersection behavior between HPMI and LTNA fractal model curves; (b) Integrated full-scale fractal model constructed by retaining LTNA data below and HPMI data above the intersection point.
5.2. Calibration of NMR Pore-Throat Distributions Using the Full-Scale Pore Fractal Model
By combining Equations (6) and (14), the following relationship can be derived:
where both (3 − DN) · lgrNmax and (3 − DN) · lg(CN · T2max) are constants. Thus, the equation can be simplified to:
where C″ is a composite constant.
According to Equation (25), the NMR fractal model curve and the established full-scale fractal model curve were plotted in the same coordinate system. By adjusting the value of CN, the horizontal position of the NMR fractal curve can be shifted. An optimal CN was selected to align the NMR fractal curve with the full-scale fractal model curve (Figure 10a). At this point, the value of CN·T2 represents the calibrated NMR pore-throat radius.
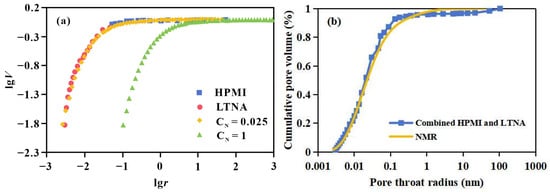
Figure 10.
(a) Calibration of NMR fractal curve by shifting via CN to match the full-scale model; (b) Comparison of cumulative pore volume distributions from the integrated HPMI-LTNA model and the calibrated NMR data.
The cumulative pore volume distribution curve obtained from the combined HPMI-LTNA data was then compared with the calibrated NMR-based cumulative distribution. The close agreement between the two curves (Figure 10b) demonstrates that the integrated HPMI-LTNA full-scale pore fractal model effectively calibrates the pore-throat radii derived from NMR experiments.
The calibration results of the NMR fractal model using the full-scale pore fractal model are presented in Figure 11. To better visualize the calibration outcome, the overlapping regions of pore-throat radii between HPMI and LTNA were retained in the plots. The results demonstrate that the HPMI fractal model exhibits significant deviations in characterizing the fractal characteristics of smaller pores, particularly under conditions of low mercury saturation (Figure 11b,e,f,h). In these cases, the HPMI fractal model displays a flattened trend in the small-pore region, whereas experimental data confirm that small pores represent the dominant contribution to total pore volume.
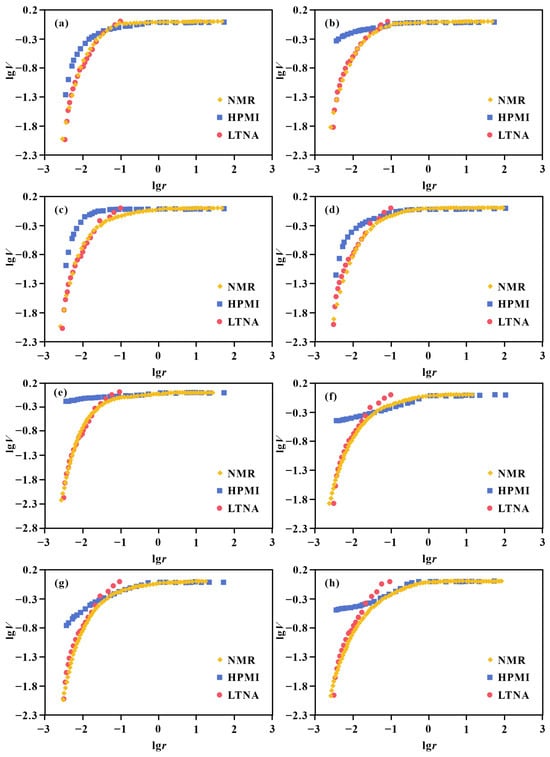
Figure 11.
Comparison between NMR fractal models and full-scale fractal models for tight sandstone samples: (a) Well B206, 3235.57 m, Songliao Basin; (b) Well B206, 3332.66 m, Songliao Basin; (c) Well B206, 3409.82 m, Songliao Basin; (d) Well B208, 3590.12 m, Songliao Basin; (e) Well Db1, 2679.95 m, Turpan-Hami Basin; (f) Well G1, 1360.97 m, Turpan-Hami Basin; (g) Well G18, 3174.4 m, Turpan-Hami Basin; (h) Well Ht21, 3386.5 m, Turpan-Hami Basin.
By dividing the pore-throat radii derived from HPMI and LTNA measurements by the conversion coefficient CN, the corresponding T2 relaxation times were obtained. The cumulative T2 distribution constructed from the combined HPMI-LTNA data was then fitted using a logistic function in Origin (v2022) software, achieving an excellent fit with a correlation coefficient R2 of 0.99897 (Figure 12a).
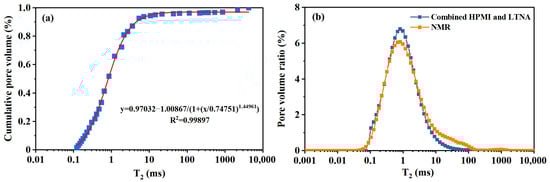
Figure 12.
(a) Calibration of T2 cumulative distribution using a logistic functions; (b) Predicted NMR T2 relaxation time distribution derived from integrated HPMI-LTNA data.
Subsequently, the fitted logistic function was used to interpolate the combined HPMI-LTNA T2 cumulative distribution according to the NMR T2 relaxation time intervals. This enabled the reconstruction of the T2 relaxation time distribution based on HPMI-LTNA data (Figure 12b). The results demonstrate that the NMR T2 distribution predicted by the full-scale pore fractal model closely matches the experimentally measured NMR T2 distribution when the pore-throat system exhibits a unimodal distribution pattern.
This agreement confirms that the full-scale pore fractal model can accurately characterize the complete pore size distribution in cases with unimodal pore-throat distributions. However, for bimodal or multimodal pore-throat distributions, a more sophisticated fitting approach would be required to accurately predict the NMR T2 relaxation time distribution.
5.3. Interpretation of Fractal Dimensions from Multi-Method Analysis
According to the International Union of Pure and Applied Chemistry (IUPAC) classification scheme, pores in tight sandstone reservoirs are categorized by diameter as micropores (<2 nm), mesopores (2–50 nm), and macropores (>50 nm) [45]. Given that the proportion of micropores in the tight sandstones from both basins examined in this study is negligible, different fractal models were employed to calculate the fractal dimensions corresponding to mesopores and macropores separately. The fractal dimensions of mesopores and macropores are denoted as DN1, DH1, DF1 and DN2, DH2, DF2, as derived from NMR, HPMI, and the Full-scale pore size fractal model, respectively.
The fractal dimensions derived from HPMI (DH1, DH2), LTNA(DL), and NMR (DN1, DN2) exhibit distinct values (Table 1). This divergence does not indicate inconsistency but rather reflects the fundamental differences in the physical principles, measurement scales, and structural aspects of the pore system that each technique probes. The concept of “fractal dimension” in porous media is not a unique, intrinsic property of the rock; it is a scale-dependent and method-dependent descriptor of complexity for specific structural attributes within defined self-similarity ranges [46].

Table 1.
Comparison of fractal dimensions for mesopores and macropores derived from independent methods (NMR, HPMI) and the integrated HPMI-LTNA model.
HPMI Fractal Dimension (DH): This dimension is calculated from the mercury saturation-capillary pressure curve, which is governed by the accessibility of mercury through pore throats. Therefore, DH predominantly characterizes the fractal geometry of the pore-throat network and its connectivity [47], effectively describing the roughness and complexity of the seepage paths. Its effective self-similarity range is typically constrained to pore-throat radii above approximately 20–50 nm [3].
LTNA Fractal Dimension (DL): Derived from nitrogen adsorption data and the FHH model, DL primarily characterizes the surface roughness and textural heterogeneity of the pore walls at the nanoscale [48,49]. It reflects the irregularity of the internal surface of pores accessible to gas molecules. Its reliable self-similarity range is confined to pores below 50 nm (mesopores), where the adsorption mechanism is most sensitive.
NMR Fractal Dimension (DN): Calculated from the T2 distribution, DN characterizes the fractal behavior of the pore volume distribution. Since the T2 time is proportional to pore size (Equation (6)), DN describes the heterogeneity in the volume distribution of different pore sizes [42,43]. The self-similarity range for NMR is theoretically broad, covering from nanopores to macropores.
In summary, the differing values of DH, DL, and DN are expected because they quantify different aspects of pore structure complexity across different but overlapping scale ranges. The HPMI-LTNA integrated model presented in this study does not seek to force these values to converge but provides a unified framework to reconcile the information from these complementary perspectives, constructing a comprehensive full-scale fractal profile that a single method cannot achieve.
5.4. Comparison of Fractal Dimensions Calculated by Different Models
As theoretically explained in Section 5.3, the fractal dimensions derived from different methods characterize distinct structural attributes. The quantitative comparison presented in Table 1 further reveals that using the HPMI fractal model to characterize mesopores introduces significant errors compared to results from the NMR fractal model. This discrepancy arises from the inherent limitations of HPMI in accurately characterizing pores below 50 nm.
Furthermore, since mercury saturation in HPMI does not reach 100%, the derived mesopore volume distribution is unreliable, leading to flattened fractal curves in the mesopore range. The lower the mercury saturation, the flatter the mesopore segment of the curve, causing the calculated fractal dimension to become artificially elevated and increasing the overall error. For instance, in Sample 5 (Well Db1, 2679.95 m) with only 35% mercury saturation, the mesopore fractal dimension deviates from the NMR-derived value by 170.65% (Table 1). Therefore, relying solely on HPMI cannot adequately characterize the fractal properties of full-scale pore systems.
In contrast, the integrated HPMI-LTNA full-scale pore fractal model provides significantly improved characterization of both mesopores and macropores. The errors in mesopore fractal dimensions are generally below 10%, demonstrating that the proposed model can effectively substitute for NMR in characterizing the fractal nature of full-scale pore systems.
5.5. Method Limitations
While the integrated HPMI-LTNA fractal model demonstrates robust performance in characterizing the full-scale pore systems of the tight sandstones studied herein, several limitations should be acknowledged to guide its future application and refinement.
First, the model relies on a defined conversion coefficient Z to reconcile the LTNA and HPMI fractal curves. Although derived empirically from our dataset with high consistency, the universality of this coefficient across vastly different diagenetic environments or lithologies requires further verification. Future work involving a larger and more diverse sample set is necessary to establish potential correlations between Z and key petrophysical/mineralogical parameters.
Second, the current model integration assumes a single, clear intersection point between the HPMI and LTNA fractal segments, which is valid for the samples exhibiting relatively continuous pore-throat distributions. In reservoirs with extremely bimodal or discrete pore systems, this intersection behavior might be ambiguous, introducing subjectivity in determining the splicing point.
Third, the model’s ability to predict NMR T2 distributions is currently most accurate for unimodal pore systems (as shown in Figure 12). For complex multimodal distributions, the simple logistic function used for fitting may be insufficient. Employing more flexible fitting algorithms or machine learning techniques could be a fruitful direction to extend the model’s predictive capability.
Despite these limitations, this study provides a foundational framework for full-scale fractal characterization.
6. Conclusions
- (1)
- The high-pressure mercury intrusion (HPMI) method alone inadequately characterizes the fractal properties of full-scale pore systems, particularly introducing significant errors for mesopores, which underscores the necessity for an integrated approach.
- (2)
- This study presents an integrated fractal model that combines HPMI and low-temperature nitrogen adsorption (LTNA) data for comprehensive pore structure characterization. The proposed model was rigorously validated against independent nuclear magnetic resonance (NMR) measurements.
- (3)
- Compared to conventional HPMI-based approaches, the integrated HPMI-LTNA model significantly improves the accuracy of mesopore fractal dimension calculations, achieving a high consistency with relative deviations within 10% of the NMR-derived benchmark across samples from different geological settings.
- (4)
- The established model provides a reliable framework for calibrating pore-throat radius distributions derived from NMR measurements, enabling more accurate full-scale pore characterization in tight sandstone reservoirs.
Author Contributions
Conceptualization, Y.Z.; methodology, Y.Z.; software, W.W.; validation, C.M.; formal analysis, H.L.; investigation, Y.Z.; resources, C.M.; data curation, Y.Z.; writing—original draft preparation, Y.Z.; writing—review and editing, Y.Z. and X.Q.; visualization, J.W.; supervision, Y.Z.; funding acquisition, Y.Z. and X.Q. All authors have read and agreed to the published version of the manuscript.
Funding
This work was supported by the National Science and Technology Major Project on New Oil & Gas Exploration and Development (Grant Nos. 2025ZD1400404, 2025ZD1402802), the Natural Science Foundation of Shandong Province (Grant No. ZR2024MD078), as well as the Innovation fund project for graduate student of China University of Petroleum (East China) and the Fundamental Research Funds for the Central Universities (Grant No. 24CX04020A).
Data Availability Statement
The data presented in this study are available from the author upon request.
Conflicts of Interest
The authors declare that they have no known competing financial interests or personal relationships that could have appeared to influence the work reported in this paper.
References
- Hackley, P.C.; Warwick, P.D. Unconventional Energy Resources: 2015 Review. Nat. Resour. Res. 2015, 24, 443–508. [Google Scholar] [CrossRef]
- Zou, C.; Zhai, G.; Zhang, G.; Wang, H.; Zhang, G.; Li, J.; Wang, Z.; Wen, Z.; Ma, F.; Liang, Y.; et al. Formation, distribution, potential and prediction of global conventional and unconventional hydrocarbon resources. Pet. Explor. Dev. 2015, 42, 13–25. [Google Scholar] [CrossRef]
- Clarkson, C.R.; Solano, N.; Bustin, R.M.; Bustin, A.M.M.; Chalmers, G.R.L.; He, L.; Melnichenko, Y.B.; Radlinski, A.P.; Blach, T.P. Pore structure characterization of North American shale gas reservoirs using USANS/SANS, gas adsorption, and mercury intrusion. Fuel 2013, 103, 606–616. [Google Scholar] [CrossRef]
- Li, W.; Lu, S.; Wang, M.; Zhou, N.; Cheng, Z. Quantitative characterization of micro heterogeneity of tight reservoirs by large-view FE-SEM splicing technology. Oil Gas Geol. 2022, 43, 1497–1504. [Google Scholar] [CrossRef]
- Xiao, D.; Lu, S.; Lu, Z.; Huang, W.; Gu, M. Combining nuclear magnetic resonance and rate-controlled porosimetry to probe the pore-throat structure of tight sandstones. Petrol. Explor. Dev. 2016, 43, 1049–1059. [Google Scholar] [CrossRef]
- Zhu, R.; Wu, S.; Su, L.; Cui, J.; Mao, Z.; Zhang, X. Problems and future works of porous texture characterization of tight reservoirs in China. Acta Pet. Sin. 2016, 37, 1323–1336. [Google Scholar] [CrossRef]
- Wu, H.; Liu, R.; Ji, Y.; Zhang, C.; Chen, S.; Zhou, Y.; Du, W.; Zhang, Y.; Wang, Y. Fractal Characteristics of Pore-throat of Tight Gas Reservoirs and Its Relation with Percolation: A case from He 8 Member of the Permian Xiashihezi Formation in Ordos Basin. Acta Sedimentol. Sin. 2017, 35, 151–162. [Google Scholar] [CrossRef]
- Mandelbrot, B.B. Les Objects Fractals: Forme, Hasard et Dimension; Fractal Objects: Form, Chance and Dimension; Flammarion: Paris, France, 1975. [Google Scholar]
- Katz, A.J.; Thompson, A.H. Fractal Sandstone Pores: Implication for Conductivity and Pore Formation. Phys. Rev. Lett. 1985, 54, 1325–1328. [Google Scholar] [CrossRef]
- Dou, W.; Liu, L.; Jia, L.; Xu, Z.; Wang, M.; Du, C. Pore structure, fractal characteristics and permeability prediction of tight sandstones: A case study from Yanchang Formation, Ordos Basin, China. Mar. Pet. Geol. 2021, 123, 104737. [Google Scholar] [CrossRef]
- Yang, M.; Huang, S.; Zhao, F.; Sun, H.; Chen, X. Experimental investigation of CO2 huff-n-puff in tight oil reservoirs: Effects of the fracture on the dynamic transport characteristics based on the nuclear magnetic resonance and fractal theory. Energy 2024, 294, 130781. [Google Scholar] [CrossRef]
- Kong, X.; Fan, H.; Fan, T.; Gao, Y.; Wang, H.; Mu, P.; Xiao, D. Fractal research on pores in oil and gas reservoirs-Inspirations from over 700 high pressure mercury injection experiments. Mar. Pet. Geol. 2024, 170, 107086. [Google Scholar] [CrossRef]
- Singh, A.; Jha, N.K.; Mandal, P.P.; Esteban, L.; Desai, B. Pore throat characterization of bioturbated heterogeneous sandstone, Bhuj Formation, Kachchh India: An integrated analysis using NMR and HPMI studies. J. Pet. Sci. Eng. 2022, 211, 110221. [Google Scholar] [CrossRef]
- Wu, Y.; Liu, C.; Ouyang, S.; Luo, B.; Zhao, D.; Sun, W.; Awan, R.S.; Lu, Z.; Li, G.; Zang, Q. Investigation of pore-throat structure and fractal characteristics of tight sandstones using HPMI, CRMI, and NMR methods: A case study of the lower Shihezi Formation in the Sulige area, Ordos Basin. Mar. Pet. Geol. 2022, 210, 110053. [Google Scholar] [CrossRef]
- Zhao, X.; Yang, Z.; Liu, X.; Wang, Z.; Luo, Y. Analysis of pore throat characteristics of tight sandstone reservoirs. Open Geosci. 2020, 12, 977–989. [Google Scholar] [CrossRef]
- Han, B.; Xiang, C.; Du, X.; Xie, L.; Huang, J.; Wang, C. Geochemistry and origins of hydrogen-containing natural gases in deep Songliao Basin, China: Insights from continental scientific drilling. Pet. Sci. 2024, 21, 741–751. [Google Scholar] [CrossRef]
- Li, Z.; Ren, T.; Li, X.; Qiao, M.; Yang, X.; Tan, L.; Nie, B. Multi-scale pore fractal characteristics of differently ranked coal and its impact on gas adsorption. Int. J. Min. Sci. Technol. 2023, 33, 389–401. [Google Scholar] [CrossRef]
- Ma, X.; Guo, S.; Shi, D.; Zhou, Z.; Liu, G. Investigation of pore structure and fractal characteristics of marine-continental transitional shales from Longtan Formation using MICP, gas adsorption, and NMR (Guizhou, China). Mar. Pet. Geol. 2019, 107, 555–571. [Google Scholar] [CrossRef]
- Ni, G.; Li, S.; Rahman, S.; Xun, M.; Wang, H.; Xu, Y.; Xie, H. Effect of nitric acid on the pore structure and fractal characteristics of coal based on the low-temperature nitrogen adsorption method. Powder Technol. 2020, 367, 506–516. [Google Scholar] [CrossRef]
- Tian, X.; Duan, X.; Sun, M.; Mohammadian, E.; Hu, Q.; Ostadhassan, M.; Liu, B.; Ke, Y.; Pan, Z. Evolution of fractal characteristics in shales with increasing thermal maturity: Evidence from neutron scattering, N2 physisorption, and FE-SEM imaging. Energy 2024, 298, 131342. [Google Scholar] [CrossRef]
- Xu, C.; Li, H.; Lu, Y.; Liu, T.; Lu, J.; Shi, S.; Ye, Q.; Jia, Z.; Wang, Z. Influence of microwave-assisted oxidant stimulation on pore structure and fractal characteristics of bituminous coal based on low-temperature nitrogen adsorption. Fuel 2022, 327, 125173. [Google Scholar] [CrossRef]
- He, T.; Zhou, Y.; Chen, Z.; Zhang, Z.; Xie, H.; Shang, Y.; Cui, G. Fractal Characterization of the Pore-Throat Structure in Tight Sandstone Based on Low-Temperature Nitrogen Gas Adsorption and High-Pressure Mercury Injection. Fractal Fract. 2024, 8, 356. [Google Scholar] [CrossRef]
- Wang, W.; Li, T.; Xiao, D.; Wang, B.; Yang, Y.; Zhang, Y.; La, W.; He, J. Geological conditions and controls on accumulation of tight sandstone gas, deep part of the Shengbei sub-sag, Turpan-Hami basin, NW China. Mar. Pet. Geol. 2023, 158, 106513. [Google Scholar] [CrossRef]
- Zhang, Y.; Qu, X.; Miao, C.; Zhu, J.; Xu, W.; Wang, W. Effect of Authigenic Chlorite on the Pore Structure of Tight Clastic Reservoir in Songliao Basin. Int. J. Environ. Res. Public Health 2023, 20, 1406. [Google Scholar] [CrossRef]
- Guo, X.; Huang, Z.; Zhao, L.; Han, W.; Ding, C.; Sun, X.; Yan, R.; Zhang, T.; Yang, X.; Wang, R. Pore structure and multi-fractal analysis of tight sandstone using MIP, NMR and NMRC methods: A case study from the Kuqa depression, China. J. Pet. Sci. Eng. 2019, 178, 544–558. [Google Scholar] [CrossRef]
- Zang, Q.; Liu, C.; Awan, R.S.; Yang, X.; Li, G.; Wu, Y.P.; Lu, Z.; Feng, D. Occurrence characteristics of the movable fluid in heterogeneous sandstone reservoir based on fractal analysis of NMR data: A case study of the Chang 7 Member of Ansai Block, Ordos Basin, China. J. Pet. Sci. Eng. 2022, 214, 110499. [Google Scholar] [CrossRef]
- Kong, X.; Xiao, D.; Jiang, S.; Lu, S.; Sun, B.; Wang, J. Application of the combination of high-pressure mercury injection and nuclear magnetic resonance to the classification and evaluation of tight sandstone reservoirs: A case study of the Linxing Block in the Ordos Basin. Nat. Gas Ind. B 2020, 7, 433–442. [Google Scholar] [CrossRef]
- Qu, Y.; Sun, W.; Tao, R.; Luo, B.; Chen, L.; Ren, D. Pore–throat structure and fractal characteristics of tight sandstones in Yanchang Formation, Ordos Basin. Mar. Pet. Geol. 2020, 120, 104573. [Google Scholar] [CrossRef]
- Zhang, Q.; Liu, Y.; Wang, B.; Ruan, J.; Yan, N.; Chen, H.; Wang, Q.; Jia, G.; Wang, R.; Liu, H.; et al. Effects of pore-throat structures on the fluid mobility in chang 7 tight sandstone reservoirs of longdong area, Ordos Basin. Mar. Pet. Geol. 2022, 135, 105407. [Google Scholar] [CrossRef]
- Zhao, X.; Yang, Z.; Lin, W.; Xiong, S.; Luo, Y.; Liu, X.; Xia, D. Fractal study on pore structure of tight sandstone based on full-scale map. Int. J. Oil Gas Coal Technol. 2019, 22, 123–139. [Google Scholar] [CrossRef]
- Feng, Z.; Jia, C.; Xie, X.; Zhang, S.; Feng, Z.; Cross, T.A. Tectonostratigraphic units and stratigraphic sequences of the nonmarine Songliao basin, northeast China. Basin Res. 2010, 22, 79–95. [Google Scholar] [CrossRef]
- Zhang, Y.; Ding, X.; Yang, P.; Liu, Y.; Jiang, Q.; Zhang, S. Reservoir formation mechanism analysis and deep high-quality reservoir prediction in Yingcheng Formation in Longfengshan area of Songliao Basin, China. Petroleum 2016, 2, 334–343. [Google Scholar] [CrossRef]
- He, H.; Liang, S.; Guo, X.; Luo, Q.; Wang, J.; Chen, X.; Yang, F.; Xiao, D.; Zhang, H. New discoveries and exploration prospects of middle and Lower Jurassic lithologic reservoirs in depression area of Turpan-Hami Basin, China. J. Nat. Gas Geosci. 2022, 7, 265–275. [Google Scholar] [CrossRef]
- Lin, T.; Wang, K.; Wang, H.; Yang, R.; Li, P.; Su, L. The hydrocarbon generation potential of the mudstone source rock in the Jurassic Shuixigou Group, the Turpan-Hami Basin, and indicative significance for oil and gas exploration. Nat. Gas Ind. B 2025, 12, 50–63. [Google Scholar] [CrossRef]
- Zhang, Y.; Qu, X.; Chen, X.; Zhang, H.; Wang, W.; Miao, C. Influence of coal rock on tight sandstone reservoirs in coal seam roofs: A case study of the lower jurassic in the Taibei sag, Turpan-Hami Basin, China. Mar. Pet. Geol. 2024, 165, 106887. [Google Scholar] [CrossRef]
- Washburn, E.W. The dynamics of capillary flow. Phys. Rev. 1921, 17, 273–283. [Google Scholar]
- Kleinberg, R.L.; Horsfield, M.A. Transverse relaxation processes in porous sedimentary rock. J. Magn. Reson. 1990, 88, 9–19. [Google Scholar] [CrossRef]
- Huang, H.; Li, R.; Xiong, F.; Hu, H.; Sun, W.; Jiang, Z.; Chen, L.; Wu, L. A method to probe the pore-throat structure of tight reservoirs based on low-field NMR: Insights from a cylindrical pore model. Mar. Petrol. Geol. 2020, 117, 104344. [Google Scholar] [CrossRef]
- Kleinberg, R.L. Pore size distributions, pore coupling, and transverse relaxation spectra of porous rocks. Magn. Reson. Imaging 1994, 12, 271–274. [Google Scholar] [CrossRef]
- Peng, L.; Zhang, C.; Ma, H.; Pan, H. Estimating irreducible water saturation and permeability of sandstones from nuclear magnetic resonance measurements by fractal analysis. Mar. Petrol. Geol. 2019, 110, 565–574. [Google Scholar] [CrossRef]
- Pfeifer, P.; Liu, K. Multilayer adsorpsion as a tool to investigate the fractal nature of porous adsorbents. Stud. Surf. Sci. Catal. 1977, 104, 625–677. [Google Scholar] [CrossRef]
- Zhang, Z.; Weller, A. Fractal dimension of pore-space geometry of an Eocene sandstone formation Fractal dimension of pore-space geometry. Geophysics 2014, 79, 377–387. [Google Scholar] [CrossRef]
- Zhou, S.; Liu, D.; Cai, Y.; Yao, Y. Fractal characterization of pore–fracture in low-rank coals using a low-field NMR relaxation method. Fuel 2016, 181, 218–226. [Google Scholar] [CrossRef]
- Barrett, E.P.; Joyner, L.G.; Halenda, P.P. The Determination of Pore Volume and Area Distributions in Porous Substances. I. Computations from Nitrogen Isotherms. J. Am. Chem. Soc. 1951, 73, 373–380. [Google Scholar] [CrossRef]
- Sing, K.S.W. Reporting physisorption data for gas/solid systems with special reference to the determination of surface area and porosity. Pure Appl. Chem. 1985, 57, 603–619. [Google Scholar] [CrossRef]
- Cai, Y.; Liu, D.; Pan, Z.; Yao, Y.; Li, J.; Qiu, Y. Petrophysical characterization of Chinese coal cores with heat treatment by nuclear magnetic resonance. Fuel 2013, 108, 292–302. [Google Scholar] [CrossRef]
- Li, K. Analytical derivation of Brooks–Corey type capillary pressure models using fractal geometry and evaluation of rock heterogeneity. J. Pet. Sci. Eng. 2010, 73, 20–26. [Google Scholar] [CrossRef]
- Pfeifer, P.; Avnir, D. Chemistry in noninteger dimensions between two and three. I. Fractal theory of heterogeneous surfaces. J. Chem. Phys. 1983, 79, 3558–3565. [Google Scholar] [CrossRef]
- Yao, Y.; Liu, D.; Tang, D.; Tang, S.; Huang, W. Fractal characterization of adsorption-pores of coals from North China: An investigation on CH4 adsorption capacity of coals. Int. J. Coal Geol. 2008, 73, 27–42. [Google Scholar] [CrossRef]


Disclaimer/Publisher’s Note: The statements, opinions and data contained in all publications are solely those of the individual author(s) and contributor(s) and not of MDPI and/or the editor(s). MDPI and/or the editor(s) disclaim responsibility for any injury to people or property resulting from any ideas, methods, instructions or products referred to in the content. |
© 2026 by the authors. Licensee MDPI, Basel, Switzerland. This article is an open access article distributed under the terms and conditions of the Creative Commons Attribution (CC BY) license.