
Sentiment Informed Sentence BERT-Ensemble Algorithm for Depression Detection


Abstract
1. Introduction
- We conduct an experimental comparison of several state-of-the-art (SOTA) ML algorithms for depression detection and discuss them from a scientific lens.
- We demonstrate the use of the Sentence BERT-Ensemble model to achieve SOTA results.
- We demonstrate that the sentiment analysis indicator is a useful external feature in depression detection.
2. Related Works
3. Methodology
- In the first experiment, we compared traditional ML algorithms using term frequency and inverse document frequency (TF-IDF) vectorizer.
- In the second attempt, we compared ML algorithms using contextual word embeddings such as BERT and SBERT.
- Finally, we implemented sentiment analysis and used the polarity result as an explicit feature. Thus, we compared ML algorithms using contextual word embeddings.
3.1. Proposed Approach
3.1.1. BERT (Bidirectional Encoder Representations from Transformers)
3.1.2. Sentence-BERT
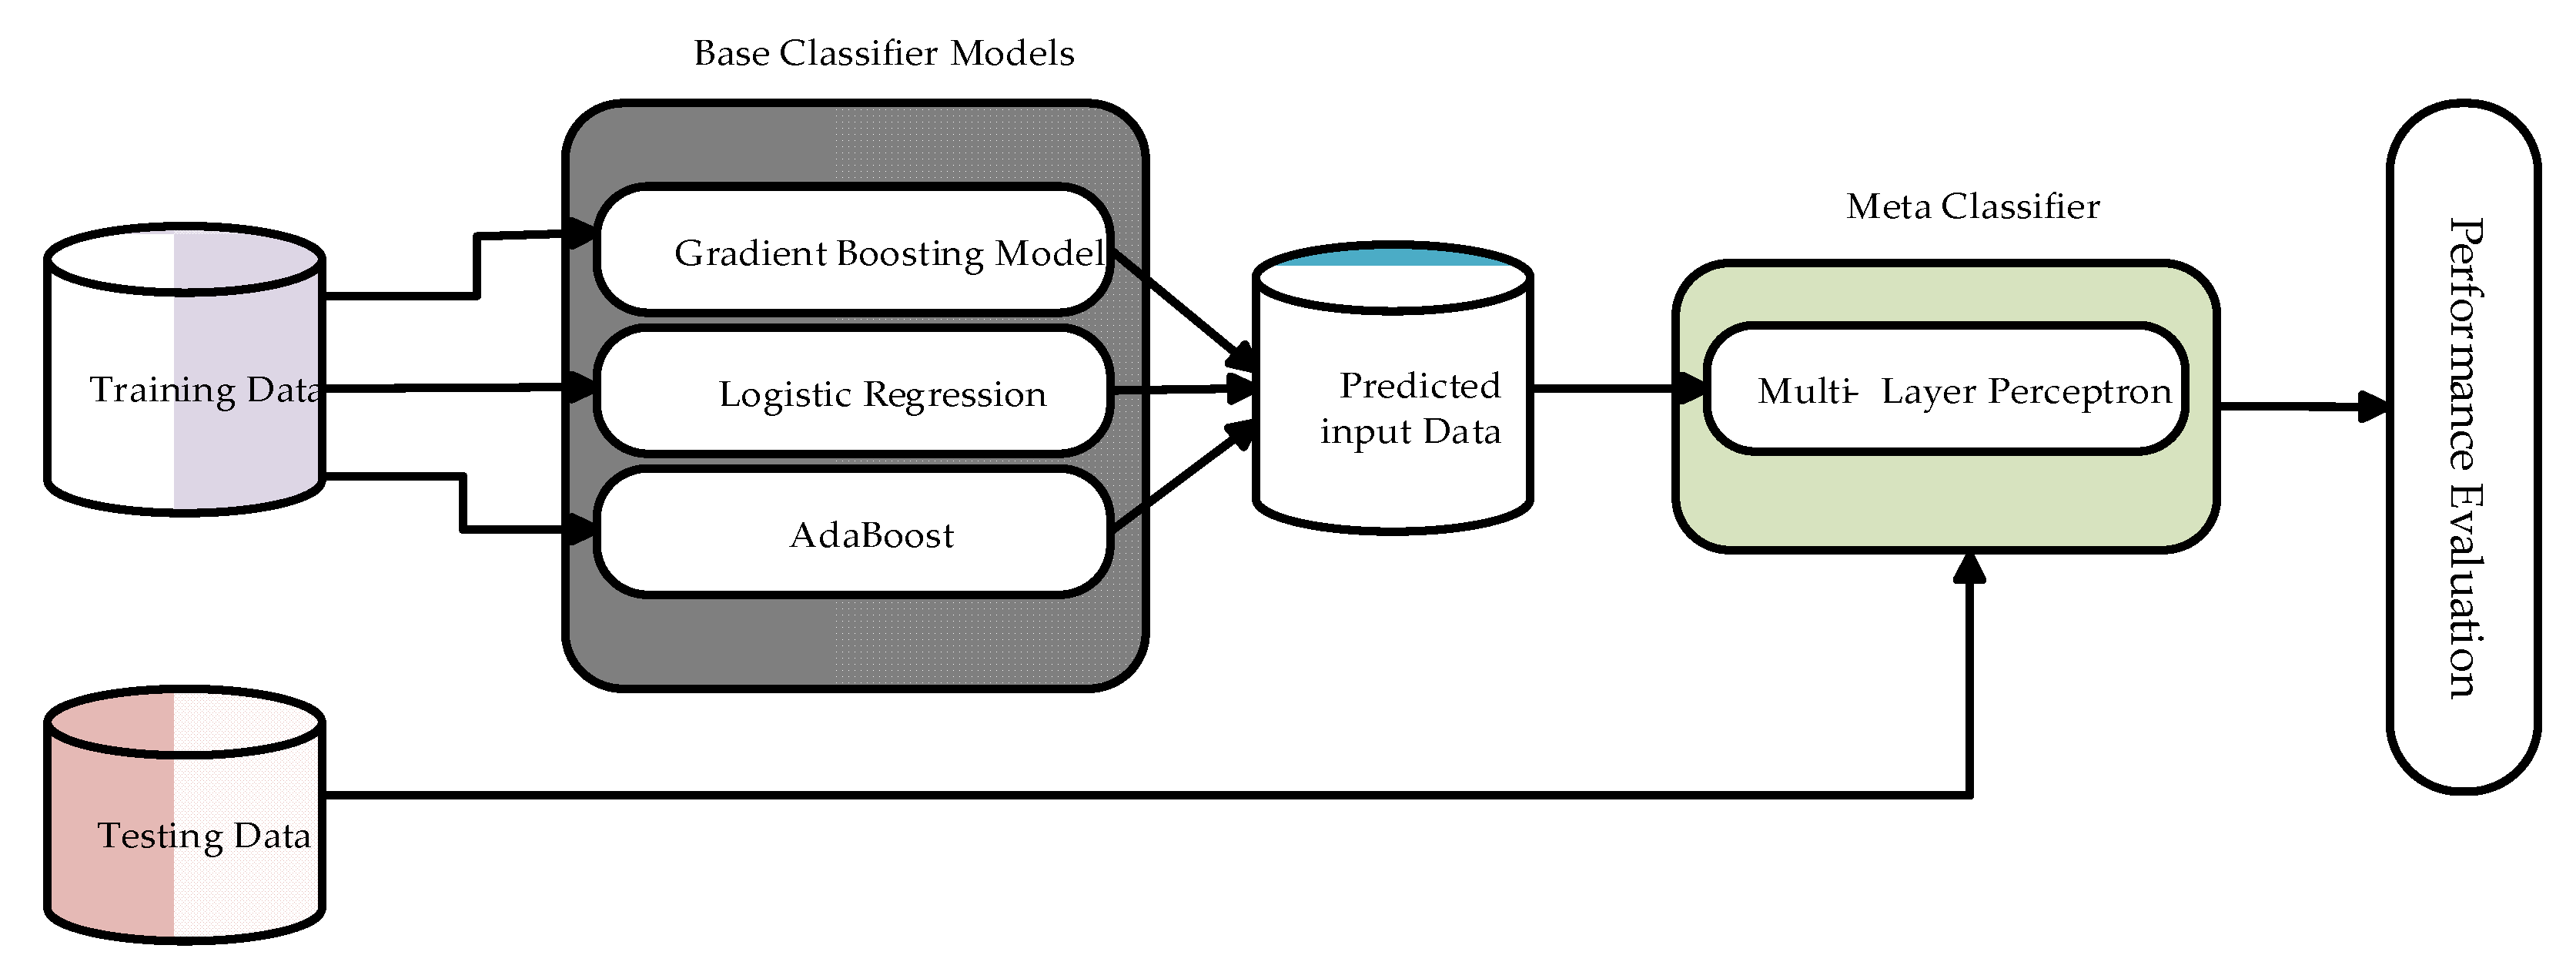
3.1.3. Stacking Ensemble Model
3.1.4. Gradient Boosting
3.1.5. AdaBoost
- 1.
- Initialize the Weights:
- 2.
- For to (number of iterations):
- a.
- Train a Weak Classifier using the weighted training set.
- b.
- Compute the Weighted Error :where is the indicator function that returns 1 if the condition is true and 0 otherwise.
- c.
- Compute the Classifier Weight
- d.
- Update the Weights:
Normalize the weights so that they sum to 1: - 3.
- Final Strong Classifier:The strong classifier is a weighted majority vote of the weak classifiers:
3.1.6. Logistic Regression
3.1.7. Multi-Layer Perceptron
- where:
- is the index of the output layer.
- is the activation function for the output layer.
3.1.8. Sentiment Analysis
3.2. Datasets
3.2.1. Dataset 1 (D1)
3.2.2. Datasets 2 (D2)
4. Results and Discussion
5. Conclusions
Author Contributions
Funding
Institutional Review Board Statement
Informed Consent Statement
Data Availability Statement
Conflicts of Interest
References
- Figuerêd, J.S.L.; Maia, A.L.L.; Calumby, R.T. Early depression detection in social media based on deep learning and underlying emotions. Online Soc. Netw. Media 2022, 31, 100225. [Google Scholar] [CrossRef]
- Thapar, A.; Eyre, O.; Patel, V.; Brent, D. Depression in young people. Lancet 2022, 400, 617–631. [Google Scholar] [CrossRef]
- World Health Organization. Depressive Disorder (Depression). 2023. Available online: https://www.who.int/en/news-room/fact-sheets/detail/depression (accessed on 27 August 2023).
- Cai, Y.; Wang, H.; Ye, H.; Jin, Y.; Gao, W. Depression detection on online social network with multivariate time series feature of user depressive symptoms. Expert Syst. Appl. 2023, 217, 119538. [Google Scholar] [CrossRef]
- World Health Organization. Depression and Other Common Mental Disorders: Global Health Estimates. Technical Report. 2017. Available online: https://apps.who.int/iris/handle/10665/254610 (accessed on 19 September 2023).
- Zhang, T.; Yang, K.; Alhuzali, H.; Liu, B.; Ananiadou, S. PHQ-aware depressive symptoms identification with similarity contrastive learning on social media. Inf. Process. Manag. 2023, 60, 103417. [Google Scholar] [CrossRef]
- Liang, Y.; Liu, L.; Ji, Y.; Huangfu, L.; Zeng, D.D. Identifying emotional causes of mental disorders from social media for effective intervention. Inf. Process. Manag. 2023, 60, 103407. [Google Scholar] [CrossRef]
- Beck, A.T.; Ward, C.H.; Mendelson, M.; Mock, J.; Erbaugh, J. An inventory for measuring depression. Arch. Gen. Psychiatry 1961, 4, 561–571. [Google Scholar] [CrossRef]
- Radloff, L.S. The use of the Center for Epidemiologic Studies Depression Scale in adolescents and young adults. J. Youth Adolesc. 1991, 20, 149–166. [Google Scholar] [CrossRef]
- Kovacs, M. The Children’s Depression Inventory (CDI). Psychopharmacol. Bull. 1985, 21, 995–998. [Google Scholar]
- Angold, A.; Costello, E.J. Mood and Feelings Questionnaire (MFQ); Developmental Epidemiology Program, Duke University: Durham, UK, 1987; Available online: https://devepi.duhs.duke.edu/measures/the-mood-andfeelings-questionnaire-mfq/ (accessed on 28 October 2023).
- Kroenke, K.; Spitzer, R.L.; Williams, J.B. The PHQ-9: Validity of a brief depression severity measure. J. Gen. Intern. Med. 2001, 16, 606–613. [Google Scholar] [CrossRef]
- Chorpita, B.F.; Moffitt, C.E.; Gray, J. Psychometric properties of the Revised Child Anxiety and Depression Scale in a clinical sample. Behav. Res. Ther. 2005, 43, 309–322. [Google Scholar] [CrossRef]
- Epstein, R.M.; Duberstein, P.R.; Feldman, M.D.; Rochlen, A.B.; Bell, R.A.; Kravitz, R.L.; Cipri, C.; Becker, J.D.; Bamonti, P.M.; Paterniti, D.A. “I didn’t know what was wrong”: how people with undiagnosed depression recognize, name and explain their distress. J. Gen. Intern. Med. 2010, 25, 954–961. [Google Scholar] [CrossRef]
- Boerema, A.M.; Kleiboer, A.; Beekman, A.T.; van Zoonen, K.; Dijkshoorn, H.; Cuijpers, P. Determinants of help-seeking behavior in depression: A cross-sectional study. BMC Psychiatry 2016, 16, 78. [Google Scholar] [CrossRef]
- Liu, D.; Feng, X.L.; Ahmed, F.; Shahid, M.; Guo, J. Detecting and measuring depression on social media using a machine learning approach: Systematic review. JMIR Ment. Health 2022, 9, e27244. [Google Scholar] [CrossRef]
- Salas-Zárate, R.; Alor-Hernández, G.; Salas-Zárate, M.D.P.; Paredes-Valverde, M.A.; Bustos-López, M.; Sánchez-Cervantes, J.L. Detecting depression signs on social media: A systematic literature review. Healthcare 2022, 10, 291. [Google Scholar] [CrossRef]
- Ogunleye, B.O. Statistical Learning Approaches to Sentiment Analysis in the Nigerian Banking Context. Ph.D. Thesis, Sheffield Hallam University, Sheffield, UK, 2021. [Google Scholar]
- Ogunleye, B.; Brunsdon, T.; Maswera, T.; Hirsch, L.; Gaudoin, J. Using Opinionated-Objective Terms to Improve Lexicon-Based Sentiment Analysis. In Proceeding of International Conference on Soft Computing for Problem-Solving; Springer Nature: Singapore, 2023. [Google Scholar] [CrossRef]
- Chancellor, S.; De Choudhury, M. Methods in predictive techniques for mental health status on social media: A critical review. NPJ Digit. Med. 2020, 3, 43. [Google Scholar] [CrossRef]
- Pérez, A.; Parapar, J.; Barreiro, A.; López-Larrosa, S. BDI-Sen: A Sentence Dataset for Clinical Symptoms of Depression. In Proceedings of the 46th International ACM SIGIR Conference on Research and Development in Information Retrieval (SIGIR ’23), Taipei, Taiwan, 23–27 July 2023; ACM: New York, NY, USA, 2023; pp. 2996–3006. [Google Scholar] [CrossRef]
- Wang, Y.; Wang, Z.; Li, C.; Zhang, Y.; Wang, H. Online social network individual depression detection using a multitask heterogenous modality fusion approach. Inf. Sci. 2022, 609, 727–749. [Google Scholar] [CrossRef]
- Islam, M.R.; Kamal, A.R.M.; Sultana, N.; Islam, R.; Moni, M.A.; Ulhaq, A. Detecting Depression Using K-Nearest Neighbors (KNN) Classification Technique. In Proceeding of the 2018 International Conference on Computer, Communication, Chemical, Material and Electronic Engineering (IC4ME2), Rajshahi, Bangladesh, 8–9 February 2018; pp. 1–4. [Google Scholar] [CrossRef]
- Cohan, A.; Desmet, B.; Yates, A.; Soldaini, L.; MacAvaney, S.; Goharian, N. SMHD: A large-scale resource for exploring online language usage for multiple mental health conditions. arXiv 2018, arXiv:1806.05258. [Google Scholar]
- Bierbaum, J.; Lynn, M.; Yu, L. Utilizing Pattern Mining and Classification Algorithms to Identify Risk for Anxiety and Depression in the LGBTQ+ Community During the COVID-19 Pandemic. In Proceedings of the Companion Proceedings of the Web Conference 2022 (WWW ‘22 Companion), Virtual Event, Lyon, France, 25–29 April 2022; ACM: New York, NY, USA, 2022; pp. 663–672. [Google Scholar] [CrossRef]
- Skaik, R.; Inkpen, D. Using Twitter Social Media for Depression Detection in the Canadian Population. In Proceedings of the 2020 3rd Artificial Intelligence and Cloud Computing Conference (AICCC 2020), Kyoto, Japan, 18–20 December 2020; ACM: New York, NY, USA, 2020. [Google Scholar] [CrossRef]
- Hosseini-Saravani, S.H.; Besharati, S.; Calvo, H.; Gelbukh, A. Depression Detection in Social Media Using a Psychoanalytical Technique for Feature Extraction and a Cognitive Based Classifier. In Advances in Computational Intelligence, Proceedings of the 19th Mexican International Conference on Artificial Intelligence, MICAI 2020, Mexico City, Mexico, 12–17 October 2020; Proceedings, Part II; Springer: Berlin/Heidelberg, Germany, 2020; pp. 282–292. [Google Scholar] [CrossRef]
- He, L.; Chan, J.C.W.; Wang, Z. Automatic depression recognition using CNN with attention mechanism from videos. Neurocomputing 2021, 422, 165–175. [Google Scholar] [CrossRef]
- Ive, J.; Gkotsis, G.; Dutta, R.; Stewart, R.; Velupillai, S. Hierarchical neural model with attention mechanisms for the classification of social media text related to mental health. In Proceedings of the Fifth Workshop on Computational Linguistics and Clinical Psychology: From Keyboard to Clinic, New Orleans, LA, USA, 5 June 2018; Association for Computational Linguistics: Stroudsburg, PA, USA, 2018; pp. 69–77. [Google Scholar]
- Amanat, A.; Rizwan, M.; Javed, A.R.; Abdelhaq, M.; Alsaqour, R.; Pandya, S.; Uddin, M. Deep learning for depression detection from textual data. Electronics 2022, 11, 676. [Google Scholar] [CrossRef]
- Almars, A.M. Attention-Based Bi-LSTM Model for Arabic Depression Classification. Comput. Mater. Contin. 2022, 71, 3092–3106. [Google Scholar] [CrossRef]
- Liu, T.; Jain, D.; Rapole, S.R.; Curtis, B.; Eichstaedt, J.C.; Ungar, L.H.; Guntuku, S.C. Detecting Symptoms of Depression on Reddit. Proceeding of the 15th ACM Web Science Conference 2023 (WebSci ’23), Austin, TX, USA, 30 April–1 May 2023; ACM: New York, NY, USA, 2023; pp. 174–183. [Google Scholar] [CrossRef]
- Harrigian, K.; Aguirre, C.; Dredze, M. Do Models of Mental Health Based on Social Media Data Generalize? In Proceedings of the Findings of the Association for Computational Linguistics: EMNLP 2020, Online, 16–20 November 2020; Association for Computational Linguistics: Stroudsburg, PA, USA, 2020; pp. 3774–3788. [Google Scholar]
- Ogunleye, B.; Dharmaraj, B. The use of a large language model for cyberbullying detection. Analytics 2023, 2, 694–707. [Google Scholar] [CrossRef]
- Cheng, Q.; Li, T.M.; Kwok, C.L.; Zhu, T.; Yip, P.S. Assessing suicide risk and emotional distress in Chinese social media: A text mining and machine learning study. J. Med. Internet Res. 2017, 19, e243. [Google Scholar] [CrossRef]
- Shrestha, A.; Tlachac, M.L.; Flores, R.; Rundensteiner, E.A. BERT Variants for Depression Screening with Typed and Transcribed Responses. In Proceedings of the 2022 ACM International Joint Conference on Pervasive and Ubiquitous Computing (UbiComp/ISWC ’22 Adjunct), Cambridge, UK, 11–15 September 2022; ACM: New York, NY, USA, 2022; pp. 211–215. [Google Scholar] [CrossRef]
- Naseem, U.; Dunn, A.G.; Kim, J.; Khushi, M. Early Identification of Depression Severity Levels on Reddit Using Ordinal Classification. In Proceedings of the ACM Web Conference 2022 (WWW ’22), Virtual Event, Lyon, France, 25–29 April 2022; ACM: New York, NY, USA, 2022; pp. 2563–2572. [Google Scholar] [CrossRef]
- Monreale, A.; Iavarone, B.; Rossetto, E.; Beretta, A. Detecting Addiction, Anxiety, and Depression by Users Psychometric Profiles. In Proceedings of the Companion Proceedings of the Web Conference 2022 (WWW ’22 Companion), Virtual Event, Lyon, France, 25–29 April 2022; ACM: New York, NY, USA, 2022; pp. 1189–1197. [Google Scholar] [CrossRef]
- Sen, I.; Quercia, D.; Constantinides, M.; Montecchi, M.; Capra, L.; Scepanovic, S.; Bianchi, R. Depression at Work: Exploring Depression in Major US Companies from Online Reviews. Proc. ACM Hum.-Comput. Interact. 2022, 6, 438. [Google Scholar] [CrossRef]
- Wu, J.; Wu, X.; Hua, Y.; Lin, S.; Zheng, Y.; Yang, J. Exploring Social Media for Early Detection of Depression in COVID19 Patients. In Proceedings of the ACM Web Conference 2023 (WWW ’23), Austin, TX, USA, 30 April–4 May 2023; ACM: New York, NY, USA, 2023; pp. 3968–3977. [Google Scholar] [CrossRef]
- Villatoro-Tello, E.; Ramírez-de-la-Rosa, G.; Gática-Pérez, D.; Magimai-Doss, M.; Jiménez-Salazar, H. Approximating the Mental Lexicon from Clinical Interviews as a Support Tool for Depression Detection. In Proceedings of the 2021 International Conference on Multimodal Interaction (ICMI ’21), Montréal, QC, Canada, 18–22 October 2021; ACM: New York, NY, USA, 2021; pp. 557–566. [Google Scholar] [CrossRef]
- Liu, Y.; Kang, K.D.; Doe, M.J. Hadd: High-accuracy detection of depressed mood. Technologies 2022, 10, 123. [Google Scholar] [CrossRef]
- Malik, A.; Shabaz, M.; Asenso, E. Machine learning based model for detecting depression during COVID-19 crisis. Sci. Afr. 2023, 20, e01716. [Google Scholar]
- Gallegos Salazar, L.M.; Loyola-Gonzalez, O.; Medina-Perez, M.A. An explainable approach based on emotion and sentiment features for detecting people with mental disorders on social networks. Appl. Sci. 2021, 11, 10932. [Google Scholar] [CrossRef]
- Burdisso, S.G.; Errecalde, M.; Montes-y-Gómez, M. A text classification framework for simple and effective early depression detection over social media streams. Expert Syst. Appl. 2019, 133, 182–197. [Google Scholar] [CrossRef]
- Trotzek, M.; Koitka, S.; Friedrich, C.M. Utilizing neural networks and linguistic metadata for early detection of depression indications in text sequences. IEEE Trans. Knowl. Data Eng. 2018, 32, 588–601. [Google Scholar] [CrossRef]
- Adarsh, V.; Kumar, P.A.; Lavanya, V.; Gangadharan, G.R. Fair and explainable depression detection in social media. Inf. Process. Manag. 2023, 60, 103168. [Google Scholar] [CrossRef]
- Guo, Z.; Ding, N.; Zhai, M.; Zhang, Z.; Li, Z. Leveraging domain knowledge to improve depression detection on Chinese social media. IEEE Trans. Comput. Soc. Syst. 2023, 10, 1528–1536. [Google Scholar] [CrossRef]
- Devlin, J.; Chang, M.W.; Lee, K.; Toutanova, K. Bert: Pre-training of deep bidirectional transformers for language understanding. arXiv 2018, arXiv:1810.04805. [Google Scholar]
- Reimers, N.; Gurevych, I. Sentence-bert: Sentence embeddings using siamese bert-networks. arXiv 2019, arXiv:1908.10084. [Google Scholar]
- Divina, F.; Gilson, A.; Goméz-Vela, F.; García Torres, M.; Torres, J.F. Stacking ensemble learning for short-term electricity consumption forecasting. Energies 2018, 11, 949. [Google Scholar] [CrossRef]
- Kwon, H.; Park, J.; Lee, Y. Stacking ensemble technique for classifying breast cancer. Healthc. Inform. Res. 2019, 25, 283–288. [Google Scholar] [CrossRef] [PubMed]
- Rajagopal, S.; Kundapur, P.P.; Hareesha, K.S. A stacking ensemble for network intrusion detection using heterogeneous datasets. Secur. Commun. Netw. 2020, 2020, 4586875. [Google Scholar] [CrossRef]
- Charoenkwan, P.; Chiangjong, W.; Nantasenamat, C.; Hasan, M.M.; Manavalan, B.; Shoombuatong, W. StackIL6: A stacking ensemble model for improving the prediction of IL-6 inducing peptides. Brief. Bioinform. 2021, 22, bbab172. [Google Scholar] [CrossRef]
- Akyol, K. Stacking ensemble based deep neural networks modeling for effective epileptic seizure detection. Expert Syst. Appl. 2020, 148, 113239. [Google Scholar] [CrossRef]
- Ribeiro, M.H.D.M.; dos Santos Coelho, L. Ensemble approach based on bagging, boosting and stacking for short-term prediction in agribusiness time series. Appl. Soft Comput. 2020, 86, 105837. [Google Scholar] [CrossRef]
- Natekin, A.; Knoll, A. Gradient boosting machines, a tutorial. Front. Neurorobotics 2013, 7, 21. [Google Scholar] [CrossRef]
- Tsai, J.K.; Hung, C.H. Improving AdaBoost classifier to predict enterprise performance after COVID-19. Mathematics 2021, 9, 2215. [Google Scholar] [CrossRef]
- Saini, D.; Chand, T.; Chouhan, D.K.; Prakash, M. A comparative analysis of automatic classification and grading methods for knee osteoarthritis focussing on X-ray images. Biocybern. Biomed. Eng. 2021, 41, 419–444. [Google Scholar] [CrossRef]
- Grosse, R. Lecture 5: Multilayer Perceptrons. 2018. Available online: https://www.cs.toronto.edu/~mren/teach/csc411_19s/lec/lec10_notes1.pdf (accessed on 13 November 2023).
- Nielsen, F.Å. A new ANEW: Evaluation of a word list for sentiment analysis in microblogs. arXiv 2011, arXiv:1103.2903. [Google Scholar]
- Sampath, K.; Durairaj, T. Data Set Creation and Empirical Analysis for Detecting Signs of Depression from Social Media Postings. In Computational Intelligence in Data Science, Proceedings of the ICCIDS 2022. IFIP Advances in Information and Communication Technology, Galway, Ireland, 22–24 November 2022; Kalinathan, L.R.P., Kanmani, M.S.M., Eds.; Springer: Cham, Switzerland, 2022; Volume 654. [Google Scholar] [CrossRef]
- Muñoz, S.; Iglesias, C.Á. Detection of the Severity Level of Depression Signs in Text Combining a Feature-Based Framework with Distributional Representations. Appl. Sci. 2023, 13, 11695. [Google Scholar] [CrossRef]
- Shi, Y.; Tian, Y.; Tong, C.; Zhu, C.; Li, Q.; Zhang, M.; Zhao, W.; Liao, Y.; Zhou, P. Detect Depression from Social Networks with Sentiment Knowledge Sharing. In Proceedings of the Chinese National Conference on Social Media Processing, Anhui, China, 23–26 November 2023; Springer: Singapore, 2023; pp. 133–146. [Google Scholar] [CrossRef]
- Tavchioski, I.; Robnik-Šikonja, M.; Pollak, S. Detection of depression on social networks using transformers and ensembles. arXiv 2023, arXiv:2305.05325. [Google Scholar]
- Poświata, R.; Perełkiewicz, M. Detecting Signs of Depression from Social Media Text using RoBERTa Pre-trained Language Models. In Proceedings of the Second Workshop on Language Technology for Equality, Diversity and Inclusion, Dublin, Ireland, 27 May 2022; Association for Computational Linguistics: Stroudsburg, PA, USA, 2022; pp. 276–282. [Google Scholar]
- Turcan, E.; McKeown, K. Dreaddit: A reddit dataset for stress analysis in social media. arXiv 2019, arXiv:1911.00133. [Google Scholar]
- Ilias, L.; Mouzakitis, S.; Askounis, D. Calibration of transformer-based models for identifying stress and depression in social media. IEEE Trans. Comput. Soc. Syst. 2023, 11, 1979–1990. [Google Scholar] [CrossRef]
- Shobayo, O.; Sasikumar, S.; Makkar, S.; Okoyeigbo, O. Customer Sentiments in Product Reviews: A Comparative Study with GooglePaLM. Analytics 2024, 3, 241–254. [Google Scholar] [CrossRef]


| Label | Count | Example |
|---|---|---|
| Positive | 878 | Good |
| Negative | 1599 | Cry |
| Label | Countraw | Countpreprocessed | Example |
|---|---|---|---|
| Not depressed | 4649 | 3503 | Happy New Years Everyone: We made it another year |
| Moderate | 10,494 | 5780 | My life gets worse every year. That’s what it feels like anyway |
| Severe | 1489 | 968 | Words can’t describe how bad I feel right now: I just want to fall asleep forever. |
| Label | Countraw | Example |
|---|---|---|
| Minimal | 2587 | I just got out of a four year, mostly on but sometimes off relationship. The last interaction we had; he was moving out. The night before, he had strangled me. We’ve had a toxic relationship, but mostly loving. He truly tried to love me as much as possible but would get drunk and be verbally abusive. |
| Mild | 290 | I just feel like the street life has fucked my head up. There’s so much I don’t even know how to talk about anymore, I just hold that shit. The only person I can really chat with is a pal I know at the bar. He has PTSD and shit from the military bad, hard-up alcoholic nowadays after killing people. We talk once every few weeks and we are open and it’s cool. But normal people? |
| Moderate | 394 | Sometimes, when I finally got out of bed and stood up, I felt like “Ugh, *finally*”. Still, it did not happen every morning, and even when it did, I still felt rested from the long sleep, so I thought no more of it. Also, they were never nightmares. Sadly, my body got habituated to the sleep-component of Mirtazapine after about five months, and my old, warped sleep cycle slowly creeped back into my life. The only benefit left in the medicine was the mild mental cushioning it provided, but at the same time I started to suspect that what I needed wasn’t cushioning but to make new constructive life decisions, that only I could make. |
| Severe | 282 | I know that I can’t be unemployed forever but I’m just too anxious to really do anything. And everyone in my family keeps asking what my plan is and I keep lying because saying I’ve got nothing is just too humiliating. I’m just stuck. Have any of you have gone through something similar, and have any advice? I appreciate it. |
| D1 | D2 | |||||||
|---|---|---|---|---|---|---|---|---|
| Algorithms | A | P | R | F | A | P | R | F |
| LR (TF-IDF) | 0.37 | 0.42 | 0.36 | 0.38 | 0.74 | 0.69 | 0.73 | 0.67 |
| NB (TF-IDF) | 0.36 | 0.40 | 0.36 | 0.36 | 0.72 | 0.52 | 0.71 | 0.60 |
| SVM (TF-IDF) | 0.43 | 0.50 | 0.43 | 0.31 | 0.72 | 0.56 | 0.71 | 0.60 |
| GBM (TF-IDF) | 0.39 | 0.46 | 0.39 | 0.35 | 0.73 | 0.67 | 0.72 | 0.66 |
| D1 | D2 | |||||||
|---|---|---|---|---|---|---|---|---|
| Algorithms | A | P | R | F | A | P | R | F |
| BERT + LR | 0.63 | 0.63 | 0.61 | 0.62 | 0.72 | 0.67 | 0.72 | 0.69 |
| BERT + SVM | 0.65 | 0.66 | 0.64 | 0.63 | 0.72 | 0.59 | 0.72 | 0.61 |
| BERT + GBM | 0.65 | 0.67 | 0.65 | 0.63 | 0.72 | 0.64 | 0.72 | 0.67 |
| BERT + BiGRU | 0.61 | 0.67 | 0.61 | 0.58 | 0.69 | 0.68 | 0.69 | 0.68 |
| BERT + BiLSTM | 0.61 | 0.68 | 0.61 | 0.60 | 0.69 | 0.69 | 0.69 | 0.69 |
| BERT + Ensemble | 0.66 | 0.68 | 0.66 | 0.64 | 0.73 | 0.66 | 0.73 | 0.68 |
| SBERT + LR | 0.64 | 0.65 | 0.64 | 0.63 | 0.74 | 0.69 | 0.74 | 0.69 |
| SBERT + SVM | 0.65 | 0.66 | 0.65 | 0.63 | 0.74 | 0.68 | 0.74 | 0.66 |
| SBERT + GBM | 0.65 | 0.64 | 0.63 | 0.62 | 0.73 | 0.65 | 0.73 | 0.66 |
| SBERT + BiGRU | 0.61 | 0.63 | 0.61 | 0.62 | 0.71 | 0.69 | 0.72 | 0.70 |
| SBERT + BiLSTM | 0.61 | 0.62 | 0.61 | 0.61 | 0.73 | 0.69 | 0.74 | 0.70 |
| SBERT + Ensemble | 0.69 | 0.69 | 0.65 | 0.68 | 0.76 | 0.69 | 0.75 | 0.70 |
| D1 | D2 | |||||||
|---|---|---|---|---|---|---|---|---|
| Algorithms | A | P | R | F | A | P | R | F |
| BERT + LRAFINN | 0.63 | 0.64 | 0.63 | 0.63 | 0.66 | 0.71 | 0.68 | 0.70 |
| BERT + SVMAFINN | 0.66 | 0.72 | 0.66 | 0.62 | 0.73 | 0.67 | 0.72 | 0.66 |
| BERT + GBMAFINN | 0.65 | 0.67 | 0.66 | 0.63 | 0.72 | 0.66 | 0.72 | 0.67 |
| BERT + BiGRUAFINN | 0.65 | 0.68 | 0.64 | 0.61 | 0.69 | 0.66 | 0.67 | 0.68 |
| BERT + BiLSTMAFINN | 0.65 | 0.67 | 0.64 | 0.65 | 0.72 | 0.70 | 0.73 | 0.71 |
| BERT + EnsembleAFINN | 0.71 | 0.69 | 0.65 | 0.67 | 0.74 | 0.65 | 0.71 | 0.67 |
| SBERT + LRAFINN | 0.64 | 0.65 | 0.63 | 0.64 | 0.75 | 0.71 | 0.74 | 0.72 |
| SBERT + SVMAFINN | 0.65 | 0.65 | 0.65 | 0.63 | 0.74 | 0.72 | 0.70 | 0.66 |
| SBERT + GBMAFINN | 0.64 | 0.65 | 0.64 | 0.63 | 0.73 | 0.65 | 0.72 | 0.67 |
| SBERT + BiGRUAFINN | 0.60 | 0.61 | 0.58 | 0.60 | 0.71 | 0.66 | 0.70 | 0.68 |
| SBERT + BiLSTMAFINN | 0.60 | 0.61 | 0.58 | 0.59 | 0.73 | 0.70 | 0.72 | 0.71 |
| SBERT + EnsembleAFINN | 0.74 | 0.71 | 0.68 | 0.69 | 0.83 | 0.77 | 0.74 | 0.76 |
| XLNet + EnsembleAFINN | 0.67 | 0.70 | 0.68 | 0.66 | 0.75 | 0.67 | 0.72 | 0.71 |
| ALBERT + EnsembleAFINN | 0.67 | 0.68 | 0.66 | 0.64 | 0.72 | 0.64 | 0.71 | 0.70 |
| RoBERTa + EnsembleAFINN | 0.69 | 0.68 | 0.66 | 0.67 | 0.75 | 0.67 | 0.72 | 0.71 |
| Literature | Method | A | P | R | F |
|---|---|---|---|---|---|
| Poswiata and Perelkiewicz [66] | Ensemble (averaging predictions of RoBERTa and DepRoBERTa) | 0.69 | 0.66 | 0.62 | 0.63 |
| Muñoz and Iglesias [63] | Ensemble (Lexicon + all-distilroberta-v1) | - | 0.58 | 0.61 | 0.58 |
| Our study | SBERT + EnsembleAFINN | 0.74 | 0.71 | 0.68 | 0.69 |
Disclaimer/Publisher’s Note: The statements, opinions and data contained in all publications are solely those of the individual author(s) and contributor(s) and not of MDPI and/or the editor(s). MDPI and/or the editor(s) disclaim responsibility for any injury to people or property resulting from any ideas, methods, instructions or products referred to in the content. |
© 2024 by the authors. Licensee MDPI, Basel, Switzerland. This article is an open access article distributed under the terms and conditions of the Creative Commons Attribution (CC BY) license (https://creativecommons.org/licenses/by/4.0/).
Share and Cite
Ogunleye, B.; Sharma, H.; Shobayo, O. Sentiment Informed Sentence BERT-Ensemble Algorithm for Depression Detection. Big Data Cogn. Comput. 2024, 8, 112. https://doi.org/10.3390/bdcc8090112
Ogunleye B, Sharma H, Shobayo O. Sentiment Informed Sentence BERT-Ensemble Algorithm for Depression Detection. Big Data and Cognitive Computing. 2024; 8(9):112. https://doi.org/10.3390/bdcc8090112
Chicago/Turabian StyleOgunleye, Bayode, Hemlata Sharma, and Olamilekan Shobayo. 2024. "Sentiment Informed Sentence BERT-Ensemble Algorithm for Depression Detection" Big Data and Cognitive Computing 8, no. 9: 112. https://doi.org/10.3390/bdcc8090112
APA StyleOgunleye, B., Sharma, H., & Shobayo, O. (2024). Sentiment Informed Sentence BERT-Ensemble Algorithm for Depression Detection. Big Data and Cognitive Computing, 8(9), 112. https://doi.org/10.3390/bdcc8090112