Abstract
With the rapid development of mobile internet technology, the explosive growth of image–text multimodal data generated by social networking platforms has provided rich practical scenarios and theoretical research value for multimodal sentiment analysis. However, existing methods generally suffer from inefficient modal interaction and imperfect sentiment aggregation mechanisms, particularly an over-reliance on visual modalities, leading to an imbalance in cross-modal semantic correlation modeling. To address these issues, this paper proposes a sentiment analysis algorithm for image–text modalities based on curriculum learning and attention mechanisms. The algorithm introduces the concept of curriculum learning, fully considering the negative impact of irrelevant images in image–text data on overall sentiment analysis, effectively suppressing interference from irrelevant visual information without requiring manual data cleaning. Meanwhile, the algorithm designs a dual-stage attention architecture—first capturing cross-modal correlation features via cross-modal attention, then introducing an attention bottleneck strategy to compress redundant information flow, achieving efficient feature fusion by constraining intra-modal attention dimensions. Finally, extensive experiments were conducted on two public datasets, demonstrating that the proposed method outperforms existing approaches in sentiment prediction performance.
1. Introduction
Emotion, as a fundamental component of human cognition, essentially represents the psychophysiological responses of individuals to external stimuli or internal experiences [1]. This understanding forms the theoretical basis for the traditional “negative–neutral–positive” trichotomy in affective research. With significant advancements in Natural Language Processing (NLP) and Computer Vision (CV) technologies, researchers are now working to equip machines with affective computing capabilities—developing intelligent systems that can identify semantic sentiment tendencies, interpret visual emotional cues, and simulate human empathy mechanisms. The realization of such Emotional Intelligence not only drives innovation in commercial applications like public opinion monitoring and consumer behavior prediction but also demonstrates transformative potential in social domains such as human–computer interaction and mental health assessment, making sentiment analysis an emerging interdisciplinary research focus. The widespread use of social platforms like Twitter, Facebook, and Weibo has transformed online spaces into primary venues for emotional expression, replacing traditional face-to-face communication. The vast amounts of user-generated data, primarily in text and visual formats, contain rich emotional information with substantial research and practical value [2]. For instance, sentiment mining of product reviews can reveal genuine user needs, helping businesses improve customer experience, while analyzing public sentiment toward trending events enables more effective public opinion management by governments and corporations [3].
Traditional social media sentiment analysis predominantly relies on unimodal text-based approaches, yet this methodology exhibits significant limitations [4]. For instance, emotional expression is often context-dependent, making pure textual analysis inadequate for accurately identifying complex linguistic phenomena such as sarcasm, humor, or puns. Unimodal data also suffers from inherent ambiguity—the same phrase may convey different emotions in varying contexts, rendering text-only interpretation unreliable. Moreover, this approach fails to align with contemporary social media users’ prevalent practice of combining images with textual content for expression.
Multimodal sentiment analysis aims to extract comprehensive emotional tendencies from image–text pairs, where visual information plays an indispensable role in overall sentiment prediction by facilitating the identification of affective elements in text. Researchers have devoted substantial efforts to effectively utilize visual content, the core challenge in this domain. Xu et al. [5] converted images into global feature vectors while filtering text-relevant visual elements. Yu et al. [6] segmented images into multiple visual patches and established connections between text sequences and visual regions. Wu et al. [7] preserved only image regions containing visual objects while enabling dynamic interaction with text sequences. Despite these advancements, current approaches still face critical limitations: they fail to address prevalent noisy images in social media data (e.g., irrelevant illustrations) that may misguide model learning when directly incorporated. Additionally, existing cross-modal fusion mechanisms predominantly employ static attention interactions, exhibiting insufficient feature integration efficiency and lacking adaptive focus capability for emotion-relevant features. These shortcomings significantly constrain sentiment analysis accuracy in social media contexts.
Therefore, this paper proposes a Curriculum Learning and Attention-based Cross-modal model for image–text sentiment analysis (MSACA). Inspired by Lewis et al. [8], we employ BART as the backbone network of our model. The MSACA framework incorporates two key components: a Multi-grained Denoising Module (MDM) that introduces curriculum learning concepts to mitigate noise interference, and a Multi-modal Dual-stage Attention Fusion Module (MDAF) for effective cross-modal feature integration. Specifically, the MDM module defines sentence-level noise measurement metrics and designs a dedicated curriculum for multimodal data, effectively reducing the negative impact of noisy image data without requiring data filtration. The MDAF module first enables cross-modal interaction between textual and visual features through cross-attention mechanisms, followed by feature fusion using an attention bottleneck strategy.
Our main contribution are as follows:
- To address negative effect of noisy image on model learning, this paper introduces curriculum learning into multimodal sentiment analysis and proposes the MDM module which includes sentence-level noise measurement and a progressive training curriculum. This curriculum-based approach significantly enhances noise robustness without requiring data filtering, To further strengthen textual understanding capabilities, our framework employs a Bidirectional GRU (BGRU) for word-level feature extraction, processes these features through a Graph Attention Network (GAT) to capture positional relationships among M word-level features, and finally aggregates them via pooling to generate comprehensive global text representations.
- To address the limitations of inefficient feature interaction and inadequate adaptive focusing in existing cross-modal fusion methods, we propose a Multi-modal Dual-stage Attention Fusion (MDAF) module. The MDAF employs a bidirectional cross-modal attention mechanism that enables deep interaction through text-guided image feature reconstruction and image-guided text feature reconstruction. Subsequently, an attention bottleneck layer is introduced to constrain redundant attention flows across modalities, forcing the model to focus only on essential information. This approach maintains effective feature fusion while reducing computational overhead from redundant attention, thereby improving the learning efficiency of multimodal sentiment representations.
- The proposed method conducts experiments on two public multimodal sentiment classification datasets demonstrate the superior performance of our proposed model. Through comprehensive ablation studies, we further validate the necessity and effectiveness of each module in our framework, providing empirical evidence for our architectural design choices.
2. Related Work
With the rise of social platforms, traditional unimodal data can no longer meet users’ needs for rich emotional expression, as multimodal posts combining images and text have become the mainstream form of social interaction. This shift poses significant challenges to conventional unimodal sentiment analysis, as such models can only process single data types and lack complementary information from multimodal sources, leading to decreased accuracy in sentiment recognition, difficulties in capturing complex emotions, and poor performance when handling noisy or incomplete data [9]. Building upon previous unimodal sentiment research, scholars have consequently shifted focus to multimodal sentiment analysis, whose core challenge lies in bridging cross-modal semantic gaps while effectively facilitating both inter-modal and intra-modal information interaction for affective feature aggregation. Current image–text multimodal sentiment analysis typically follows three key steps: feature extraction, feature fusion, and sentiment prediction [10]. Common text feature extraction models range from word embedding approaches like Word2Vec [11] and GloVe [12] to pretrained language models such as BERT [13], while visual features are predominantly extracted using ResNet [14] or ViT [15]. As the crux of multimodal tasks, feature fusion methods have evolved from earlier model-agnostic approaches to the currently dominant model-dependent fusion techniques [16].
In multimodal sentiment analysis research, building upon CNN’s strong performance in unimodal tasks, Yu et al. [17] initially employed image modality as the dominant feature by training CNNs while merely using text to generate auxiliary sentiment labels, significantly undervaluing textual information’s expressive power. You et al. [18] later adopted simple feature concatenation for prediction, failing to effectively leverage cross-modal interactions. To better utilize both modalities, Xu et al. [19] developed the HSAN model with hierarchical self-attention mechanisms (local and global) to capture multimodal semantic relationships. Subsequently, Xu et al. [19] proposed the Co-Memory network, pioneering the simulation of bidirectional influence between visual and textual information through iterative interaction—where text guides visual focus while images highlight key words. Yang et al. [4] advanced this through their MVAN model’s three-phase architecture (feature mapping, interaction learning, and fusion), employing memory networks to explore image–text interactions from multiple visual perspectives. More recently, the focus has shifted toward refining deep fusion strategies using attention and specialized embeddings. Li et al. [20] introduced a sophisticated cross-attention mechanism to achieve fine-grained alignment and dynamic weighting between image regions and textual tokens. Furthermore, Chen et al. [21] proposed incorporating prior knowledge models to enhance the holistic visual–textual sentiment analysis, leveraging external semantic information to guide feature aggregation. Recognizing dataset-level global features’ impact, Yang et al. [22] later introduced MGNNS, the first graph neural network application in multimodal sentiment detection, modeling global characteristics through GNNs while enabling deep multimodal interaction via specialized channels. Addressing noisy cross-modal relationships, Zhu et al. [23] innovated a gated interaction network that simultaneously aligns modalities while filtering mismatched data segments through simulated gating mechanisms, effectively achieving data denoising. This evolutionary trajectory demonstrates the field’s progression from modality-dominant approaches to sophisticated bidirectional interaction modeling with noise-aware architectures.
3. Materials and Methods
In image–text sentiment analysis tasks, given an input instance containing both image and text, the model needs to predict its overall sentiment polarity. To this end, this study proposes the MSACA model based on the BART encoder-decoder architecture. As shown in Figure 1, the model framework consists of four core components: (1) a multimodal feature extraction module, (2) a Multi-grained Denoising Module (MDM), (3) a Dual-stage Attention Fusion Module (MDAF), and (4) a sentiment prediction module. The processing pipeline can be formally described as follows:
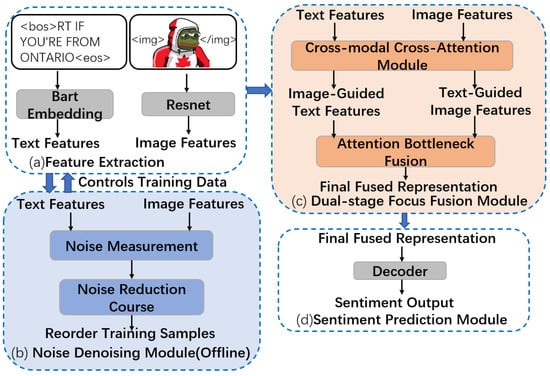
Figure 1.
Overall Architecture of MSACA.
First, the multimodal feature extraction module obtains text features through pre-trained BART embeddings and image features via ResNet. These multimodal features are concatenated and fed into the BART encoder, where stacked Transformer layers generate deep textual and visual representations. The encoded features are then processed in parallel by the MDM and MDAF modules.
The MDM module calculates sentence-level noise measurement metrics based on cosine similarity and implements a progressive learning strategy through a designed denoising curriculum: during early training stages, it prioritizes samples with high image–text feature alignment, then gradually introduces instances with increasing noise levels, thereby suppressing noise interference without requiring manual data cleaning. Simultaneously, the MDAF module employs cross-modal attention mechanisms to obtain text-guided image features and image-guided text features. An attention bottleneck layer is then applied to constrain redundant information interaction, achieving efficient cross-modal feature fusion.
Finally, the fused multimodal features are processed by the BART decoder to generate sentiment representation vectors, which are classified to output sentiment polarity. The following sections will systematically elaborate on the implementation details of each module.
3.1. Feature Extraction
The feature extraction module consists of two main components: text feature extraction and image feature extraction. For textual features, given BART’s exceptional text representation capabilities, we employ pre-trained BART to obtain initial word embeddings. For visual features, images are first resized to pixels, then processed through a pre-trained ResNet to obtain visual patch embeddings, which are subsequently projected to the same dimensionality as the word embeddings via a linear layer. This paper, inspired by Xing’s ideas [24], uses <img> and </img> to represent the start and end of visual features, and <bos> and <eos> to represent the start and end of text features. The concatenated multimodal features are then used as the input of the BART encoder X.
Specifically, for the image input V and text input T, we can obtain their multimodal hidden states , where represents the feature of image V and represents the feature of text T. Each feature vector has dimensionality d, and the specific equations are given as follows:
where m and n represent the number of visual parts and text words from image V and text T, respectively, and and represent the i-th and j-th features from image and text.
3.2. Multi-Modal Oriented Noise Reduction Module
In multimodal sentiment analysis tasks, the effective utilization of visual information is a critical research focus. Traditional methods commonly adopt a full-association strategy between visual information and textual data. While such approaches have achieved some performance improvements, they exhibit significant misjudgments at the modality utility level—implicitly assuming that images always provide auxiliary discriminative features, leading to a systematic overestimation of the importance of the visual modality.
In reality, understanding information in social media posts does not always require images, and using visual content entirely unrelated to the text can degrade overall performance. Studies [25] show that approximately 33% of tweets exhibit semantic inconsistency between images and text (i.e., the textual content is not reflected in the corresponding image, and the image provides no incremental information). Thus, mitigating the impact of such noisy images is an unavoidable challenge. Some existing studies attempt to employ hard-threshold-based filtering mechanisms for noise removal, but such binarized filtering strategies inevitably lead to the loss of useful features.
To address this issue, this paper introduces the concept of Curriculum Learning (CL) into multimodal sentiment analysis, proposing a Multimodal Denoising Module (MDM). This module avoids data filtering and instead assesses the noise level of the data, encouraging the model to train longer on clean data and shorter on noisy data, thereby improving robustness against noise. As illustrated in Figure 2, the MDM framework consists of two key components: Noise Measurement and Denoising Curriculum. The noise measurement evaluates the noise level of images at the sentence level, while the denoising curriculum prioritizes training instances based on their noise scores, controlling the model’s access order to the training set. The following sections will elaborate on these two components in detail.
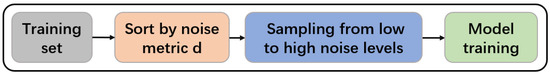
Figure 2.
Workflow of the MDM Module.
3.2.1. Statement-Level Noise Measurement
Typically, the similarity between text and image will be high when they are related. Conversely, their similarity will be low when they are unrelated. Therefore, it can be inferred that the lower the similarity between an image and its accompanying text, the more likely the image is to be noise, which can be used to measure the degree of noise image in each training instance by computing the similarity between image and text representations.
For the i-th image–text pair , the network firstly sends the data from each modalities to the MSACA to obtain the text feature and image feature , then selects the cosine similarity to assess the similarity between two features; the equation of similarity is as follows:
Then, this paper defines a sentence-level noise metric d, as formalized in Equation (4):
For the convenience of further processing, the noise metric d is normalized to the range . As clearly indicated by the formula, a lower value of d signifies that the data pair is cleaner (more reliable), while a higher value suggests a greater likelihood of it being noisy data.
3.2.2. Noise Reduction Course
During the training process of the MSACA model, we first sort each instance in the training dataset D based on the noise metric d defined in the previous section. We then employ a denoising function to regulate the model’s learning pace, gradually transitioning from clean data to noisy instances. Inspired by Platanios et al. [26], we define a straightforward denoising function , as formally expressed in Equation (5) below:
Here, represents the model’s predefined initial value, which we set to in this study. T denotes the total duration of the MDM denoising process. At the t-th epoch, we set a noise metric threshold . Only samples whose noise metric satisfies the following condition are permitted to participate in training:
In other words, during the initial training phase, since is small, only samples that are less noisy and easier to learn are selected by the sampler for training; as the epoch increases, gradually increases, and an increasing number of samples with higher noise and higher difficulty are incorporated into the training. When , the curriculum learning process is complete, and the model gains unrestricted access to all training samples.
In the practical implementation, we construct an MDM difficulty sampler. At the beginning of each epoch, this sampler dynamically filters out all samples satisfying based on the current threshold , and then constructs the training batches by performing uniform random sampling from this subset.
3.3. Multi-Modal Two-Stage Attention Fusion Module
In multimodal sentiment analysis tasks, bridging the cross-modal semantic gap represents a fundamental challenge for improving model performance. To address the current limitations of inefficient feature fusion and lack of adaptive focus caused by the inherent heterogeneity between textual and visual modalities, this paper proposes a novel Multimodal Dual-stage Attention Fusion module (MDAF). The MDAF module employs a hierarchical attention mechanism to achieve dynamic cross-modal alignment and efficient feature fusion. Specifically, it first utilizes cross-modal attention to model inter-modal relationships between image regions and sentence words, then fuses the processed features through an attention bottleneck strategy to obtain the final integrated representation. This approach enables the MDAF module to maximally leverage useful information across both modalities while significantly enhancing fusion performance.
3.3.1. Cross Modal Cross-Attention
The cross-modal attention module is primarily designed to model inter-modal relationships between textual and visual information. As illustrated in Figure 3, this module’s workflow and detailed Transformer architecture are presented. By processing the textual features and visual features obtained from the feature extraction module, the system generates (1) text-guided visual features and (2) image-guided textual features.
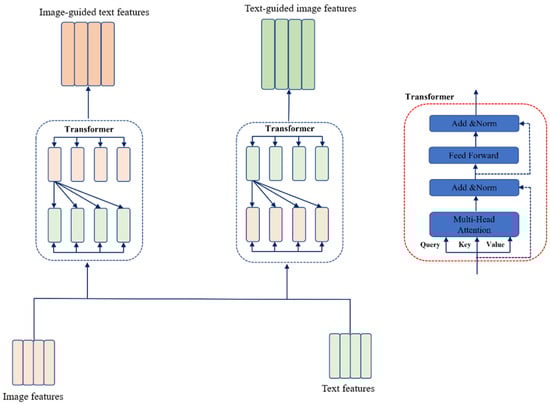
Figure 3.
Cross-Attention Mechanism.
In terms of specific implementation, this section follows the theoretical foundation proposed by Ashish et al. [27], and employs the Transformer to implement the attention mechanism. As shown in the red dashed box in Figure 3 and Figure 4, the specific structure of the Transformer unit is presented, which consists of two sub-layers: the Multi-Head Attention sub-layer and the Position Wise Feed-Forward sub-layer. In the multi-head cross-attention sub-layer, attention computation is executed multiple times to form a multi-head structure. This is achieved by applying different learnable linear projections to project the query, key, and value vectors multiple times, respectively. Specifically, for the given textual features and visual features , if the goal is to compute the image-guided textual features, the resulting query, key, and value vectors from the input can be obtained as follows: , , , where the subscript i denotes the i-th head. Subsequently, the Scaled Dot-Product Attention is applied to obtain the attention weight matrix. The weighted sum of the values can then be calculated according to Equation (7).
Here, Q, K, and V represent the query, key, and value matrices, respectively, and is the dimension of the key vector, which serves as the scaling factor. is formally defined by the overall feature dimension and the number of attention heads H as
This scaling stabilizes the dot products and effectively captures the relevance between different modal features.

Figure 4.
Standard Fusion Strategy.
Subsequently, the value of each head can be computed according to Equations (9) and (10), and these values are then concatenated to obtain the final output of the multi-head attention:
In the Position-Wise Feed-Forward sub-layer, in order to further refine the fragment representations, two fully connected layers are applied identically and independently to each fragment. This process can be described by Equation (11) as follows:
In addition, residual connections followed by layer normalization are also applied after each of the two sub-layers, respectively. With the aforementioned cross-attention Transformer unit, the features of each modality can attend to those of the other modality. If the entire processing procedure of the Transformer unit is denoted as , then the process of extracting image-guided textual features can be expressed as . The resulting guided features are denoted as , and , with the corresponding formulation given in Equation (12).
Similarly, the process of extracting text-guided visual features can be expressed as . The resulting guided features are denoted as , and , with the corresponding formulation given in Equation (13).
3.3.2. Attention Bottleneck Strategy
Based on the computations from the previous section, the Image-Guided Text Features (IGT) and Text-Guided Image Features (TGI) can be obtained. For the sake of clarity in the following discussion, the abbreviations IGT and TGI will be used to refer to these two types of features. In this module, in order to further refine and fuse the key information contained in both feature types, the same Transformer unit structure will continue to be employed. A common approach here is to directly concatenate the two types of features as input to the Transformer, thereby obtaining the fused features for each modality. The corresponding structure is illustrated in Figure 4.
Although traditional fully connected cross-modal attention mechanisms offer the advantage of intuitive implementation, they exhibit significant performance bottlenecks in visual–text sentiment analysis tasks. This type of fully modal feature interaction and fusion strategy requires all cross-modal feature fragments to undergo intensive attention computation. Such an undifferentiated interaction mechanism is prone to coupling interference between fine-grained intra-modal features and redundant inter-modal information, which impairs the focused extraction of key semantics.To address this issue, inspired by the Multimodal Information Bottleneck theory proposed by Nagrani et al. [28], this study designs a structured cross-modal fusion strategy by introducing a Multimodal Bottleneck into the fusion process of visual and textual modalities. The cross-modal interaction path is reconstructed through constraints in the latent space, and the corresponding structure is illustrated in Figure 5:
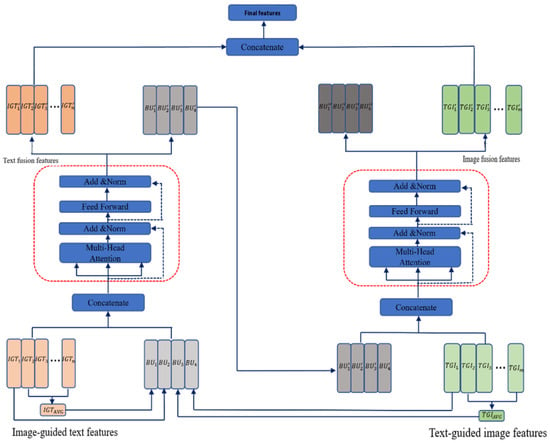
Figure 5.
Attention Bottleneck Fusion Strategy.
The core design philosophy of this strategy is based on a structured constraint mechanism on cross-modal information flow. It achieves efficient fusion by decoupling intra-modal feature optimization from inter-modal information exchange. Specifically, while preserving free attention flow within each modality, the model strictly restricts direct interaction paths across modalities: all cross-modal information exchange must be conducted via learnable latent fusion tokens. Overall, a Quaternary Attention Bottleneck Unit is introduced in this module as a shared information channel, enforcing all cross-modal interactions to be bi-directionally projected through this low-dimensional latent space. This mechanism yields a dual effect: on one hand, it leverages the Information Bottleneck Principle to ensure that only key features maximizing mutual information are transmitted across modalities; on the other hand, it reduces computational complexity to a linear scale, effectively mitigating the quadratic scaling cost of pairwise attention in traditional cross-modal interactions.
To implement this strategy, it is first necessary to initialize all attention bottleneck tokens. The feature of the first fragment in both IGT and TGI is treated as a token. In addition, for each modality, the average of the features of all fragments excluding the first one is computed, denoted as and , respectively. The function computes the element-wise mean along the sequence length dimension of the input feature sequence. In this way, a set of Bottleneck Units (BU) is obtained, serving as the attention bottleneck tokens. The detailed computation is shown in Equations (14)–(16).
Next, this attention bottleneck layer is used to perform cross-modal interaction, resulting in the fused features of IGT and TGI, respectively. First, the initialized features of and the features of are concatenated as the input to the Transformer unit, yielding the fused IGT features and the first-order selected representations of , denoted as . Then, is used as a bottleneck to interact with the features, and the concatenated result is input into another Transformer unit. Similarly, the fused TGI features and the second-order selected features of , denoted as , can be obtained. Finally, the fused features from both modalities are concatenated again to form the final fused representation , which is combined with the decoder’s previously generated output sequence at time step t as input to the decoding layer. Sentiment prediction is then performed using the Softmax function to obtain the sentiment distribution probability , as defined in Equations (17)–(19).
To obtain the global emotional representation from the concatenated multimodal features, we employ attention pooling for fusion. The attention score for each token is calculated:
After masking invalid positions, the attention weights are obtained via the softmax function:
The final global representation is given by
Subsequently, the global representation is input into a linear classification layer to perform the three-class emotion prediction:
This task is a three-class classification problem; thus, we use the standard cross-entropy loss:
where is the ground-truth label, and is the predicted class probability from the model.
4. Experiment
In the preceding sections, the MSACA model has been thoroughly introduced, with detailed discussions on the overall architecture and the implementation of each core module. In this section, a series of experiments are conducted to evaluate the performance of the MSACA model on multimodal sentiment analysis tasks, followed by a comprehensive analysis of the results. The section begins with a discussion of the experimental setup, and subsequently applies the model to widely used visual–text sentiment analysis datasets, comparing it against other existing methods to validate the overall performance of the model. In addition, ablation studies are carried out to assess the contributions of each core module, thereby demonstrating their effectiveness through empirical results.
4.1. Datasets and Evaluation Metrics
The proposed MSACA model is experimentally validated on two publicly available image–text datasets, MVSA-Single (MVSA-S) and MVSA-Multiple (MVSA-M) [29], to demonstrate its superior performance. In the original MVSA dataset, annotators separately assigned sentiment labels to both the image and text data. These labels are restricted to three sentiment categories: positive, neutral, and negative. In MVSA-S, each sample is annotated by a single annotator, resulting in a total of 4869 image–text pairs. In contrast, MVSA-M is more complex, with each sample annotated by three annotators, yielding a total of 19,600 image–text pairs.
To facilitate the subsequent experiments, the dataset is preprocessed such that each image–text pair is assigned a single unified sentiment label. The definition method for these unified sentiment labels follows the approach proposed by Xu et al. [30]. In addition, the textual modality undergoes a light noise-cleaning step, where URLs and redundant whitespace are removed while hashtags, emojis, and other sentiment-indicative tokens are preserved to maintain the affective characteristics of social-media text. The specific label distribution after preprocessing is shown in Table 1.

Table 1.
Statistics of sentiment categories in the MVSA-Single and MVSA-Multiple datasets.
The dataset is then divided into training, validation, and test sets using an 8:1:1 ratio. The detailed sample distributions for each split are provided in Table 2.
Table 2.
Sample distribution of the MVSA datasets.
For evaluation metrics, and to ensure fair comparison with previous studies, this work adopts Accuracy and Weighted F1-score as the evaluation criteria. Accuracy measures the proportion of correctly classified samples out of the total number of samples, reflecting the overall correctness of the model’s predictions. The Weighted F1-score, on the other hand, accounts for class imbalance and class importance by assigning higher weights to classes with larger sample sizes during calculation.
4.2. Data Preprocessing
To ensure consistent and model-ready multimodal inputs, we apply a unified preprocessing pipeline to both textual and visual data.
Text Processing. The raw text is first encoded using the tokenizer of a pretrained language model. Special tokens are added at the beginning and end of each sequence, and the text is truncated to a predefined maximum length. All sequences within a batch are then padded to a uniform length. Based on the positions of valid tokens and padded regions, an attention mask is generated to guide the model in ignoring padded elements during attention computation.
Image Processing. All images are resized to meet the input constraints of the visual encoder and subsequently center-cropped. During training, random horizontal flipping is applied as a form of data augmentation to enhance model generalization. The images are then converted to tensors and normalized using ImageNet mean and standard deviation to ensure compatibility with pretrained visual backbones.
Cross-Modal Attention Mask Construction. A unified attention mask is constructed by first generating the valid-token mask for the textual input and then appending a fixed number of valid positions corresponding to the visual representation (e.g., the image-level token or all patch tokens). This extended mask allows the model to attend jointly to both textual and visual tokens during multimodal fusion.
4.3. Implementation Details
Our model is built upon the BART-base framework, where the encoder of BART-base serves as the text model and is initialized with the official pretrained weights. Visual features are extracted using ResNet-50. Cross-modal interaction is achieved through the dual-stage attention module (MDAF), which performs feature fusion via an attention bottleneck mechanism. In addition, curriculum learning is applied from the beginning of training and is conducted for a total of 20 epochs. The overall training procedure consists of two stages. In the first 10 epochs, all parameters of both the text and image models remain frozen, and only the cross-modal fusion module and other randomly initialized components are trained, using a learning rate of . The second stage then fine-tunes the text model by unfreezing its last four layers. During this phase, the learning rate of the fusion module and other components is kept at , while a smaller learning rate of is applied to the unfrozen text layers. After unfreezing, the training continues for an additional 30 epochs. We use the AdamW optimizer with a dropout rate of 0.1. For the MVSA-Single dataset, the batch size is set to 32, while for the MVSA-Multiple dataset it is set to 16. To ensure reproducibility, a fixed random seed (seed = 42) is used consistently across dataset splitting, model initialization, and all stochastic operations during training.
4.4. Comparisons with the SoTA Methods
To accurately evaluate the effectiveness and performance of the MSACA model proposed in this study on multimodal sentiment classification tasks, this section will select several current leading models as benchmarks and conduct a detailed comparative analysis with the proposed model. Below is an overview of the selected comparison models:
- (1)
- Res-IAN [31]: A variant of the IAN model that integrates LSTM and attention mechanisms for text analysis, effectively extracting and utilizing key interaction information between targets and contexts. Simultaneously, this model combines ResNet to extract image features and fuses them by concatenating text and image features for cross-modal sentiment classification.
- (2)
- HSAN [19]: A cascaded semantic attention network that implements semantic attention mechanisms at different levels, progressively integrating and enhancing cross-modal semantic information. It can more finely analyze the semantic relationships between images and corresponding text descriptions to improve the accuracy and adaptability of sentiment analysis.
- (3)
- MultiSentiNet [30]: Emphasizes that visual semantic features should integrate image scenes and entity objects. This model adopts a visual feature-guided attention LSTM mechanism to efficiently extract and push keywords related to tweet sentiment, and integrates these keyword representations with visual features to construct a refined multimodal tweet comprehensive representation.
- (4)
- Co-Mem [5]: First to simulate the mutual influence between visual and textual information in multimodal sentiment analysis. The model proposes a co-memory attention mechanism that interactively captures the relationship between visual content and textual words through an iterative process: textual information guides the search for key content in images, while image information helps identify keywords in text.
- (5)
- MGNNS [22]: First to apply Graph Neural Networks (GNN) to multimodal sentiment detection in images and text. It uses GNN to simulate global features of the dataset and handles multimodal sentiment detection tasks. It also includes a multimodal interaction module that builds different channels to achieve deep multimodal interaction.
- (6)
- MVAN [4]: Constructs the large-scale image–text sentiment dataset TumEmo, exploring the interaction between images and text deeply using memory networks through three stages: feature mapping, interaction learning, and feature fusion. It considers image features from different perspectives.
- (7)
- CLMLF [32]: Considers token-level feature fusion of multimodal features, proposing a multi-layer fusion module based on Transformer-Encoder to align and fuse token-level features of text and images. It also uses contrastive learning to help the model understand and extract sentiment features from the data.
- (8)
- VSA-PF [21]: This method achieves robust visual–textual sentiment analysis by integrating multiple powerful pre-trained visual and textual prior models. The overall framework consists of visual–textual feature learning, semantic visual feature extraction from pre-trained visual expert models, CLIP-based cross-modal alignment, and a BERT-powered multimodal fusion network. Together, these components capture data-driven sentiment cues, rich semantic visual priors, and image–text correspondences, enabling the construction of more discriminative multimodal sentiment representations.
As shown in Table 3, this paper systematically compares the performance differences between the MSACA model proposed in this chapter and existing mainstream methods on the MVSA dataset. The experimental results show that among the baseline models, Res-IAN failed to effectively mine cross-modal correlations due to its simple cross-modal feature concatenation strategy, resulting in the lowest comprehensive performance. Among the subsequent improved methods, MultiSentiNet enhanced performance by constructing a visual-emotion enhancement module, while models like MGNNS and MVAN later focused more on cross-modal information interaction, also achieving certain performance improvements. Additionally, VSA-PF improves sentiment analysis by integrating multiple pre-trained visual and textual prior models to capture more discriminative multimodal features.
Table 3.
Results on MVSA datasets.
It is worth noting that the MSACA model proposed in this chapter demonstrates performance advantages on both datasets: MSACA achieves competitive results on both MVSA datasets. On the MVSA-Single dataset, MSACA attains an accuracy of 75.78% and a weighted F1 score of 74.62%, outperforming the closest baseline VSA-PF by 0.20 and 0.14 percentage points, and surpassing CLMLF by 0.45 and 1.16 percentage points, respectively, ranking as the best-performing model on this dataset. On the larger MVSA-Multiple dataset, MSACA achieves an accuracy of 72.53%—the highest among all methods—exceeding the second-best MGNNS by 0.04 percentage points. Although its weighted F1 score (69.87%) is slightly lower than that of MVAN (70.38%, −0.51 percentage points), it remains higher than CLMLF (69.83%) and all other comparative models. This sustained performance advantage validates the effectiveness of the MSACA model’s two-stage attention mechanism in multi-modal emotional representation learning, enabling it to dynamically capture the complementarity and consistency of cross-modal emotional signals, thereby achieving more precise emotional reasoning in complex scenarios.
4.5. Ablation Study
To investigate the individual contributions of each module in the MSACA model, six groups of ablation experiments are conducted on the MVSA-Single and MVSA-Multiple datasets. All experimental settings remain consistent except for the removed modules. The results are reported in Table 4 and analyzed as follows.
Table 4.
Ablation experiment on the MVSA datasets.
- (1)
- Text-only (No. 1). When the model uses only BART textual embeddings, the performance drops significantly compared to the complete MSACA model. On the MVSA-Single dataset, accuracy and weighted-F1 decrease by 5.78% and 8.54%, respectively. On the MVSA-Multiple dataset, the decreases are 3.71% and 7.91%. This indicates that textual information alone is insufficient to capture the full spectrum of multimodal emotional cues in social media content.
- (2)
- Image-only (No. 2). Using only ResNet-extracted image features results in even larger performance degradation. On the MVSA-Single dataset, accuracy and weighted-F1 decline by 8.89% and 10.93%, respectively, while on the MVSA-Multiple dataset, the decreases are 4.53% and 8.56%. These results confirm that the image modality is less informative than text for sentiment analysis in social media scenarios.
- (3)
- Text + Image without MDM and MDAF (No. 3). When both text and image features are used without the curriculum learning module (MDM) and without the feature fusion module (MDAF), the model achieves noticeably better results than single-modality settings, with 71.11% accuracy and 70.86% weighted-F1 on MVSA-Single and 71.24% accuracy and 67.11% weighted-F1 on MVSA-Multiple. Although multi-source inputs provide basic performance gains, the lack of structured cross-modal modeling prevents the model from effectively exploiting modality complementarity.
- (4)
- Removing the MDAF module (No. 4). When the MDAF feature fusion module is removed while keeping the curriculum learning mechanism, the performance decreases considerably. Compared to the complete MSACA model, MVSA-Single accuracy and weighted-F1 drop by 4.22% and 4.16%, respectively, while the MVSA-Multiple dataset shows declines of 1.53% and 2.66%. This demonstrates that MDAF plays a key role in learning effective cross-modal feature interactions.
- (5)
- Removing the MDM module (No. 5). Removing the curriculum learning module MDM while retaining MDAF causes a moderate performance decrease. On the MVSA-Single dataset, accuracy and weighted-F1 drop by 1.11% and 0.79%, respectively, while the MVSA-Multiple dataset shows a 0.53% decrease in accuracy. These results indicate that MDM stabilizes the multimodal learning process and improves robustness under noisy or inconsistent multimodal inputs.
- (6)
- Full model (No. 6). With both MDM and MDAF enabled, MSACA achieves the best results on both datasets, reaching 75.78% accuracy and 74.62% weighted-F1 on MVSA-Single and 72.53% accuracy and 69.87% weighted-F1 on MVSA-Multiple. This confirms that the combination of curriculum learning and multimodal feature fusion substantially enhances the model’s capability in multimodal sentiment understanding.
Overall, the ablation study shows that textual features dominate social media sentiment analysis, image features provide complementary cues, and both the MDM and MDAF modules contribute to improved multimodal learning, with MDAF providing the most substantial performance gain.
To assess the impact of the textual backbone, we compare BERT-base (308.11 M parameters) and BART-base (345.15 M parameters) under the same multimodal fusion framework. As shown in Table 5, BART-base consistently performs better. On MVSA-Single, it improves Accuracy from 74.00% to 75.78% and Weighted-F1 from 70.53% to 74.62%. On MVSA-Multiple, BART-base also achieves slight gains on both metrics. These results suggest that BART’s denoising sequence-to-sequence pretraining provides more robust textual representations for noisy social media text, leading to stronger multimodal sentiment classification despite the moderate increase in model size.
Table 5.
Comparison of different text encoders.
As shown in Table 6, we further compare different feature extractors used for computing the offline difficulty scores in the MDM curriculum learning module. When CLIP embeddings are used to estimate sample difficulty, the model achieves competitive results, especially on the MVSA-Single dataset, where it achieves a weighted-F1 close to the best performance. However, its overall accuracy and the results on MVSA-Multiple are consistently lower than those obtained using the BART+ResNet extractors. This is mainly because CLIP, although pretrained for multimodal alignment, produces feature representations that are not fully compatible with the main network used in MSACA. As a result, the difficulty scores generated by CLIP deviate from the sample characteristics learned during training, weakening the effectiveness of curriculum scheduling.
Table 6.
Comparison of different feature extractors for offline curriculum learning.
In contrast, using the same BART and ResNet encoders as the main model leads to the most stable and consistent improvements on both datasets. This indicates that aligning the feature space between the scoring module and the prediction model yields more reliable difficulty estimation, enabling MDM to better regulate the learning process and improve overall multimodal sentiment recognition performance.
4.6. Detailed Analysis
To better understand model behavior, we analyze the confusion matrices of MVSA-Single and MVSA-Multiple (Table 7 and Table 8). Across both datasets, the model consistently performs well in identifying positiveand negative sentiments, while the neutral class shows notably higher confusion.
Table 7.
Confusion Matrix on MVSA-Single.
Table 8.
Confusion Matrix on MVSA-Multiple.
In the MVSA-Single dataset, the neutral samples are often misclassified as either positive (20 instances) or negative (13 instances), with only 14 instances being correctly predicted as neutral. Similarly, in the MVSA-Multiple dataset, neutral instances are predominantly misclassified as positive (279 instances), with a smaller portion misclassified as negative (23 instances). The correct neutral predictions are only 138 out of 440 total neutral samples. These results suggest that the model struggles to clearly differentiate neutral content from positive and negative sentiments, particularly in cases where sentiment cues are weak or ambiguous.
Furthermore, the confusion matrices reveal that the misclassification rate between positive and negative instances remains relatively low (e.g., in MVSA-Single, the number of positive and negative instances misclassified as the opposite sentiment is 21 and 41, respectively, while in MVSA-Multiple, it is 19 and 43). This indicates that the model is able to effectively capture the decision boundaries between strongly polarized sentiments. In contrast, the neutral class tends to be misclassified toward the positive sentiment, particularly in MVSA-Multiple, likely reflecting the prevalence of mild positive expressions in social media content.
Overall, the results suggest that the primary challenge lies not in the annotation process but in the model’s ability to handle low-intensity or ambiguous emotional signals. Improving the model’s sensitivity to subtle emotional cues may help enhance its performance in classifying the neutral class.
4.7. Visualization
As shown in Figure 6, we visualize the attention weights of the Text-Guided Image Cross-Attention layer in the MDAF module to better understand how the MSACA model performs multimodal sentiment reasoning. The heatmaps overlaid on the images illustrate the attention distribution between each image region and the highlighted text token, where warmer colors indicate relatively higher attention. Four representative examples are presented. (1) Player. When the token “player” is queried, the model mainly assigns attention to the central human subject and the visible team logo, while background regions receive notably lower weights. This suggests that the model can identify image areas that are semantically relevant to the entity word. (2) Kids. When focusing on the token “kids,” the attention is distributed over the child figures in the image. This indicates that the model is able to capture multiple corresponding visual entities when processing multi-target textual references. (3) Played. For the action word “played,” the attention tends to concentrate on the region depicting the action-related content, rather than unrelated surroundings. This reflects a reasonable alignment between the neutral action word and the corresponding visual cues. (4) Love. When the highlighted token is “Love,” the attention is placed on the facial expressions and the close interaction between the two people. Such a distribution suggests that the model can associate affectively meaningful textual cues with relevant visual details.
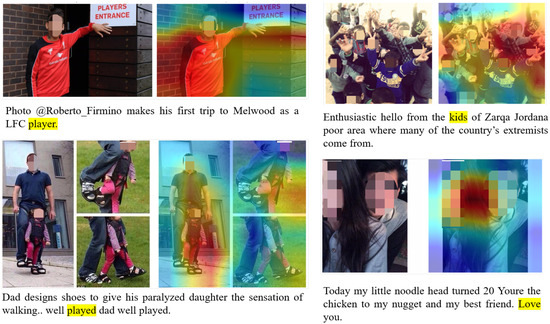
Figure 6.
Visualization of Cross-Modal Attention Weights on MVSA-Single Dataset.
Overall, the visualization demonstrates that the model produces interpretable text-guided attention patterns and can focus on visually relevant regions under different types of textual queries.
5. Conclusions
To address the challenges in multimodal sentiment analysis involving noisy image interference and the inefficiency of existing cross-modal fusion mechanisms, this paper proposes MSACA—a multimodal sentiment analysis model that integrates curriculum learning with attention mechanisms. The model adopts BART as the textual generative framework and utilizes ResNet as the image feature extractor. It further introduces a curriculum learning-based denoising module (MDM) and a dual-stage attention fusion module (MDAF) based on the attention bottleneck strategy. The design principles and implementation details of these two modules are elaborated on in depth.
To comprehensively evaluate the effectiveness of the proposed approach, extensive experiments are conducted on two public datasets. First, parameter tuning experiments are performed to identify the optimal model configuration, demonstrating that the attention bottleneck strategy not only enhances model performance but also effectively reduces computational cost. Subsequently, comparative experiments with existing models show that MSACA achieves superior classification performance on both datasets. In addition, the MDM module is integrated into other models to form variant architectures for further comparison, confirming the generalizability and effectiveness of the denoising concept in the context of this task. Finally, ablation studies further verify the critical roles played by both the MDM and MDAF modules in improving the overall performance of the MSACA model.
Author Contributions
Conceptualization, Y.R. and Z.L.; methodology, Y.R.; software, Y.R.; validation, Y.R., Y.C. and Z.L.; formal analysis, Z.L.; investigation, Y.R. and Z.L.; resources, G.Y.; data curation, Z.L.; writing—original draft preparation, Y.R.; writing—review and editing, Y.C. and Z.L.; visualization, Z.L.; supervision, G.Y.; project administration, G.Y.; funding acquisition, Y.C. All authors have read and agreed to the published version of the manuscript.
Funding
This research was funded by Kashgar Regional Science and Technology Plan Project (No.KS2023028).
Institutional Review Board Statement
Not applicable.
Informed Consent Statement
Not applicable.
Data Availability Statement
The raw data supporting the conclusions of this article will be made available by the authors upon reasonable request.
Conflicts of Interest
The authors declare no conflicts of interest.
References
- Soleymani, M.; Garcia, D.; Jou, B.; Schuller, B.; Chang, S.F.; Pantic, M. A survey of multimodal sentiment analysis. Image Vis. Comput. 2017, 65, 3–14. [Google Scholar] [CrossRef]
- Ifantidou, E.; Hatzidaki, A. Metaphor comprehension in L2: Meaning, images and emotions. J. Pragmat. 2019, 149, 78–90. [Google Scholar] [CrossRef]
- Lan, G.; Xiao, S.; Yang, J.; Zhou, Y.; Wen, J.; Lu, W.; Gao, X. Image aesthetics assessment based on hypernetwork of emotion fusion. IEEE Trans. Multimed. 2023, 26, 3640–3650. [Google Scholar] [CrossRef]
- Yang, X.; Feng, S.; Wang, D.; Zhang, Y. Image-text multimodal emotion classification via multi-view attentional network. IEEE Trans. Multimed. 2020, 23, 4014–4026. [Google Scholar] [CrossRef]
- Xu, N.; Mao, W.; Chen, G. A co-memory network for multimodal sentiment analysis. In Proceedings of the 41st International ACM SIGIR Conference on Research & Development in Information Retrieval, Ann Arbor, MI, USA, 8–12 July 2018; pp. 929–932. [Google Scholar]
- Yu, J.; Jiang, J.; Xia, R. Entity-sensitive attention and fusion network for entity-level multimodal sentiment classification. IEEE/ACM Trans. Audio Speech Lang. Process. 2019, 28, 429–439. [Google Scholar] [CrossRef]
- Wu, H.; Cheng, S.; Wang, J.; Li, S.; Chi, L. Multimodal aspect extraction with region-aware alignment network. In Proceedings of the CCF International Conference on Natural Language Processing and Chinese Computing, Zhengzhou, China, 14–18 October 2020; Springer: Berlin/Heidelberg, Germany, 2020; pp. 145–156. [Google Scholar]
- Lewis, M.; Liu, Y.; Goyal, N.; Ghazvininejad, M.; Mohamed, A.; Levy, O.; Stoyanov, V.; Zettlemoyer, L. BART: Denoising Sequence-to-Sequence Pre-training for Natural Language Generation, Translation, and Comprehension. In Proceedings of the 58th Annual Meeting of the Association for Computational Linguistics, Online, 5–10 July 2020. [Google Scholar]
- Li, S.; Zhang, T.; Chen, B.; Chen, C.P. MIA-Net: Multi-modal interactive attention network for multi-modal affective analysis. IEEE Trans. Affect. Comput. 2023, 14, 2796–2809. [Google Scholar] [CrossRef]
- Zhang, C.; Yang, Z.; He, X.; Deng, L. Multimodal intelligence: Representation learning, information fusion, and applications. IEEE J. Sel. Top. Signal Process. 2020, 14, 478–493. [Google Scholar] [CrossRef]
- Mikolov, T.; Chen, K.; Corrado, G.; Dean, J. Efficient Estimation of Word Representations in Vector Space. arXiv 2013, arXiv:1301.3781. [Google Scholar] [CrossRef]
- Pennington, J.; Socher, R.; Manning, C.D. Glove: Global vectors for word representation. In Proceedings of the 2014 Conference on Empirical Methods in Natural Language Processing (EMNLP), Doha, Qatar, 25–29 October 2014; pp. 1532–1543. [Google Scholar]
- Devlin, J.; Chang, M.W.; Lee, K.; Toutanova, K. Bert: Pre-training of deep bidirectional transformers for language understanding. In Proceedings of the 2019 Conference of the North American Chapter of the Association for Computational Linguistics: Human Language Technologies, Volume 1 (Long and Short Papers), Minneapolis, MN, USA, 2–7 June 2019; pp. 4171–4186. [Google Scholar]
- He, K.; Zhang, X.; Ren, S.; Sun, J. Deep residual learning for image recognition. In Proceedings of the IEEE Conference on Computer Vision and Pattern Recognition, Las Vegas, NV, USA, 27–30 June 2016; pp. 770–778. [Google Scholar]
- Dosovitskiy, A.; Beyer, L.; Kolesnikov, A.; Weissenborn, D.; Zhai, X.; Unterthiner, T.; Dehghani, M.; Minderer, M.; Heigold, G.; Gelly, S. An Image is Worth 16x16 Words: Transformers for Image Recognition at Scale. In Proceedings of the International Conference on Learning Representations, Virtual, 3–7 May 2021. [Google Scholar]
- Zhu, L.; Zhu, Z.; Zhang, C.; Xu, Y.; Kong, X. Multimodal sentiment analysis based on fusion methods: A survey. Inf. Fusion 2023, 95, 306–325. [Google Scholar] [CrossRef]
- Yu, Y.; Lin, H.; Meng, J.; Zhao, Z. Visual and textual sentiment analysis of a microblog using deep convolutional neural networks. Algorithms 2016, 9, 41. [Google Scholar] [CrossRef]
- You, Q.; Luo, J.; Jin, H.; Yang, J. Joint visual-textual sentiment analysis with deep neural networks. In Proceedings of the 23rd ACM International Conference on Multimedia, Brisbane, Australia, 26–30 October 2015; pp. 1071–1074. [Google Scholar]
- Xu, N. Analyzing multimodal public sentiment based on hierarchical semantic attentional network. In Proceedings of the 2017 IEEE International Conference on Intelligence and Security Informatics (ISI), Beijing, China, 22–24 July 2017; IEEE: Piscataway, NJ, USA, 2017; pp. 152–154. [Google Scholar]
- Li, H.; Lu, Y.; Zhu, H. Multi-modal sentiment analysis based on image and text fusion based on cross-attention mechanism. Electronics 2024, 13, 2069. [Google Scholar] [CrossRef]
- Chen, J.; An, J.; Lyu, H.; Kanan, C.; Luo, J. Holistic visual-textual sentiment analysis with prior models. In Proceedings of the 2024 IEEE 7th International Conference on Multimedia Information Processing and Retrieval (MIPR), San Jose, CA, USA, 7–9 August 2024; IEEE: Piscataway, NJ, USA, 2024; pp. 196–202. [Google Scholar]
- Yang, X.; Feng, S.; Zhang, Y.; Wang, D. Multimodal sentiment detection based on multi-channel graph neural networks. In Proceedings of the 59th Annual Meeting of the Association for Computational Linguistics and the 11th International Joint Conference on Natural Language Processing (Volume 1: Long Papers), Virtual Event, 1–6 August 2021; pp. 328–339. [Google Scholar]
- Zhu, T.; Li, L.; Yang, J.; Zhao, S.; Liu, H.; Qian, J. Multimodal sentiment analysis with image-text interaction network. IEEE Trans. Multimed. 2022, 25, 3375–3385. [Google Scholar] [CrossRef]
- Xing, Y.; Shi, Z.; Meng, Z.; Lakemeyer, G.; Ma, Y.; Wattenhofer, R. KM-BART: Knowledge Enhanced Multimodal BART for Visual Commonsense Generation. In Proceedings of the 59th Annual Meeting of the Association for Computational Linguistics (ACL), Virtual Event, 1–6 August 2021; pp. 525–535. [Google Scholar]
- Yadav, A.; Vishwakarma, D.K. A deep multi-level attentive network for multimodal sentiment analysis. ACM Trans. Multimed. Comput. Commun. Appl. 2023, 19, 1–19. [Google Scholar] [CrossRef]
- Platanios, E.A.; Stretcu, O.; Neubig, G.; Poczos, B.; Mitchell, T. Competence-based Curriculum Learning for Neural Machine Translation. In Proceedings of the 2019 Conference of the North American Chapter of the Association for Computational Linguistics (NAACL), Minneapolis, MN, USA, 2–7 June 2019; pp. 1162–1172. [Google Scholar]
- Vaswani, A.; Shazeer, N.; Parmar, N.; Uszkoreit, J.; Jones, L.; Gomez, A.N.; Kaiser, Ł.; Polosukhin, I. Attention is all you need. Adv. Neural Inf. Process. Syst. 2017, 30, 5998–6008. [Google Scholar]
- Nagrani, A.; Yang, S.; Arnab, A.; Jansen, A.; Schmid, C.; Sun, C. Attention bottlenecks for multimodal fusion. Adv. Neural Inf. Process. Syst. 2021, 34, 14200–14213. [Google Scholar]
- Niu, T.; Zhu, S.; Pang, L.; El Saddik, A. Sentiment analysis on multi-view social data. In Proceedings of the International Conference on Multimedia Modeling, Miami, FL, USA, 4–6 January 2016; Springer: Berlin/Heidelberg, Germany, 2016; pp. 15–27. [Google Scholar]
- Xu, N.; Mao, W. Multisentinet: A deep semantic network for multimodal sentiment analysis. In Proceedings of the 2017 ACM on Conference on Information and Knowledge Management, Singapore, 6–10 November 2017; pp. 2399–2402. [Google Scholar]
- Ma, D.; Li, S.; Zhang, X.; Wang, H. Interactive Attention Networks for Aspect-Level Sentiment Classification. In Proceedings of the 26th International Joint Conference on Artificial Intelligence, Melbourne, Australia, 19–25 August 2017; pp. 4068–4074. [Google Scholar]
- Li, Z.; Xu, B.; Zhu, C.; Zhao, T. CLMLF: A contrastive learning and multi-layer fusion method for multimodal sentiment detection. arXiv 2022, arXiv:2204.05515. [Google Scholar] [CrossRef]
Disclaimer/Publisher’s Note: The statements, opinions and data contained in all publications are solely those of the individual author(s) and contributor(s) and not of MDPI and/or the editor(s). MDPI and/or the editor(s) disclaim responsibility for any injury to people or property resulting from any ideas, methods, instructions or products referred to in the content. |
© 2026 by the authors. Licensee MDPI, Basel, Switzerland. This article is an open access article distributed under the terms and conditions of the Creative Commons Attribution (CC BY) license.