


Narrative Visualization with Augmented Reality


Abstract
1. Introduction
2. Literature Review
3. Materials and Methods
4. Results
4.1. View
4.1.1. Visual Strategies
4.1.2. Types of Simulation
4.2. Focus
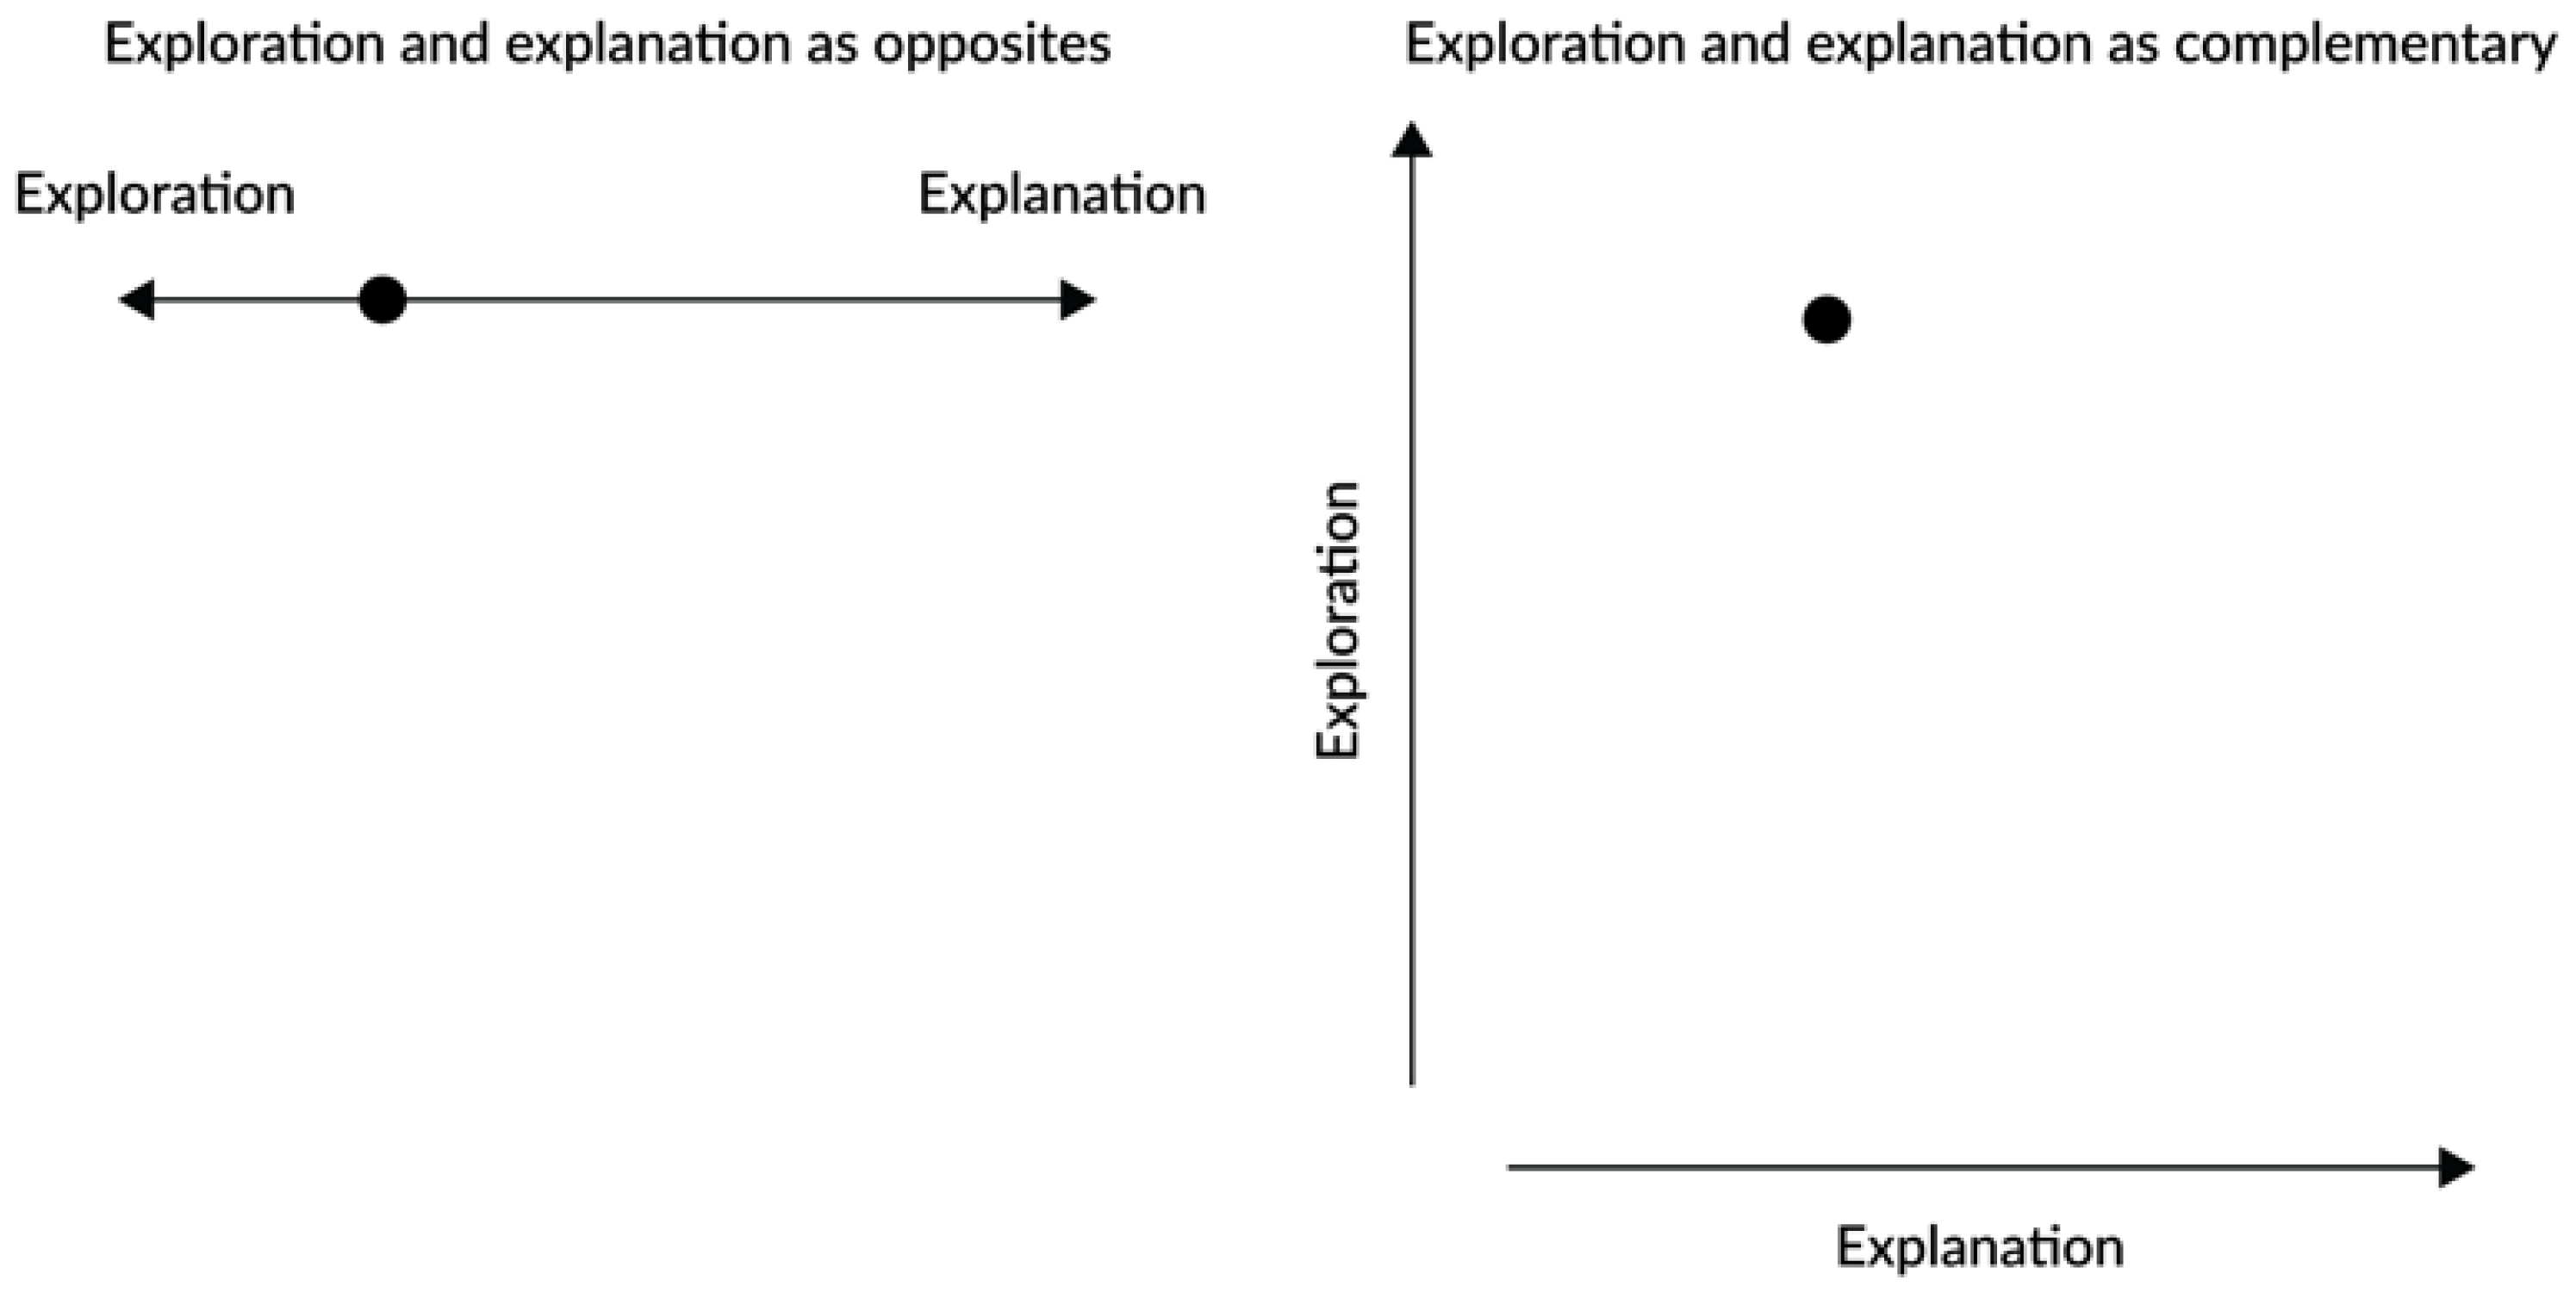
4.3. Sequence
4.3.1. Narrative Order
4.3.2. Narrative Sequence
4.3.3. User Intervention
- (A)
- The user controls the point of view; i.e., the way of seeing.
- (B)
- The user progresses throughout the narrative and/or activates an animation.
- (C)
- Although the user only progresses through the narrative and/or activates an animation, there is a simulation of an increased control of the narrative.
- (D)
- The materials that comprise the narrative are totally predetermined, but their order is variable and chosen by the user.
- (E)
- The user chooses a certain narrative path, but the ending is always the same, regardless of his or her choice.
5. Discussion
6. Conclusions
Author Contributions
Funding
Institutional Review Board Statement
Informed Consent Statement
Data Availability Statement
Conflicts of Interest
Appendix A

| Nr. | Source | Date | Title |
|---|---|---|---|
| 7 | New York Times | 5 February 2018 | Augmented Reality: Four of the Best Olympians, as You’ve Never Seen Them |
| 9 | New York Times | 21 July 2018 | Step Inside the Thai Cave in Augmented Reality |
| 10 | New York Times | 30 October 2020 | How Masks Work |
| 11 | New York Times | 19 October 2021 | Wildfire Storms |
| 12 | New York Times | 25 December 2021 | What Webb Will See |
| 13 | New York Times | 20 April 2022 | Inflation Shrinking Ray |
| 14 | USA Today | 1 May 2020 | Kent State shootings: A day of tragedy |
| 15 | New York Times | 20 March 2018 | Augmented Reality: David Bowie in Three Dimensions |
| 16 | New York Times | 8 July 2022 | How smoke Spreads |
| 18 | New York Times | 26 February 2021 | Why Opening Window is a Key to Reopening Schools |
| 21 | USA Today | 9 January 2021 | What happened where? A virtual look at last year’s Capitol riot |
| 22 | New York Times | 14 April 2020 | This 3-D Simulation Shows Why Social Distancing is So Important |
| 23 | New York Times | 2 December 2019 | See How the World’s Most Polluted Air Compares With Your City’s |
| 25 | National Geographic | April 2020 issue | The World in 2070 |
| 26 | National Geographic | August 2022 issue | Stonehenge |
| 27 | National Geographic | October 2020 issue | Deinonychus |
| 28 | USA Today | 24 January 2022 | Step inside the crime scene at the heart of ‘Accused’, Season 4’ |
| 32 | New York Times | 19 June 2018 | A Volcano Turns a Town Into a Cemetery |
| 33 | New York Times | 1 May 2018 | Augmented Reality: Explore NASA’s InSight Mission on Mars |
| 34 | New York Times | 25 October 2018 | Monsters that live on you |
| 35 | Washington Post | 20 July 2021 | Scale a 50-foot speed climbing wall in augmented reality |
| 36 | New York Times | 12 August 2022 | What will the megastorm’s rain look like? |
| 37 | Washington Post | 17 July 2019 | How to Dress for Space |
| 38 | New York Times | 19 August 2022 | EV Battery Breakdown |
| 39 | National Geographic | 28 April 2021 | California Condor |
| 40 | New York Times | 26 October 2020 | Election Forecasts |
| 41 | USA Today | 12 August 2022 | Get up close with Heat domes, a culprit behind the summer’s heat |
| 42 | USA Today | 8 September 2021 | Story of deadliest prison riot in U.S. history told in augmented reality |
| 43 | USA Today | 12 February 2021 | Explore Mars Perseverance rover in augmented reality |
| 44 | USA Today | 13 August 2020 | Statues bring suffrage history to you in augmented reality |
| 45 | USA Today | 27 January 2021 | Journey into the body to see COVID vaccine at work |
| 46 | USA Today | 7 July 2020 | Learn more about destroyed Frederick Douglass statue, in Augmented Reality |
| 47 | USA Today | 7 May 2020 | No mask? Here’s how far your germs can travel |
| 48 | USA Today | 16 July 2020 | Woman’s suffrage: Famous speeches come to life |
| 49 | USA Today | 6 February 2020 | 737 MAX: what happened to the airliner? |
| 50 | USA Today | 21 August 2019 | Rocket science made easy. Learn about Apollo 11 in AR. |
| 51 | USA Today | 27 August 2019 | Notre Dame: After the Fire |
| 52 | USA Today | 21 August 2019 | Oscars 2019: See costumes from your favorite films, from every angle |
| 53 | USA Today | 27 August 2019 | Capitals’ John Carlson discusses the All-Star game |
| 54 | Florida Today | 2018 | 321 LAUNCH—Falcon 9 |
| 55 | New York Times | 13 November 2018 | Take a Tour of Lady Liberty’s Torch (Right This Second) |
| 56 | USA Today | 19 July 2021 | Skateboarding with Tom Schaar |
| 57 | USA Today | 19 July 2021 | Sport climbing with Kyra Condie |
| 58 | New York Times | 4 August 2018 | A fire tornado hit their neighborhood. This is all that’s left. |
| 59 | New York Times | 21 December 2018 | It’s Intermission for the Large Hadron Collider |
| 62 | USA Today | 29 December 2019 | Show of Force—Explore the Fog of War |
| 65 | New York Times | 2021 | Gymnastics in Tokyo |
| 66 | New York Times | 2021 | Hurdling in Tokyo |
| 67 | Washington Post | 5 November 2018 | Practice makes perfect: Carve this virtual turkey |
| 69 | Deutsche Welle | 5 February 2020 | Water footprint: Augmented Reality shows water cost of beef |
References
- Bach, B.; Stefaner, M.; Boy, J.; Drucker, S.; Bartram, L.; Wood, J.; Ciuccarelli, P.; Engelhardt, Y.; Köppen, U.; Tversky, B. Narrative Design Patterns for Data-Driven Storytelling. In Data-Driven Storytelling; A K Peters/CRC Press: Boca Raton, FL, USA, 2018; pp. 107–133. [Google Scholar] [CrossRef]
- Segel, E.; Heer, J. Narrative Visualization: Telling Stories with Data. IEEE Trans. Vis. Comput. Graph. 2010, 16, 1139–1148. [Google Scholar] [CrossRef] [PubMed]
- Kosara, R.; MacKinlay, J. Storytelling: The next Step for Visualization. Computer 2013, 46, 44–50. [Google Scholar] [CrossRef]
- Azuma, R. Location-Based Mixed and Augmented Reality Storytelling. In Fundamentals of Wearable Computers and Augmented Reality; Barfield, W., Ed.; CRC Press: Boca Raton, FL, USA, 2015; pp. 259–276. [Google Scholar]
- Ikonen, P.; Uskali, T. Augmented Reality as News. In Immersive Journalism as Storytelling; Uskali, T., Gynnild, A., Jones, S., Sirkkunen, E., Eds.; Routledge: Oxford, UK, 2021; pp. 147–160. [Google Scholar] [CrossRef]
- Chandler, T.; Cordeil, M.; Czauderna, T.; Dwyer, T.; Glowacki, J.; Goncu, C.; Klapperstueck, M.; Klein, K.; Marriott, K.; Schreiber, F. Immersive Analytics. 2015 Big Data Vis. Anal. BDVA 2015, 2015, 1–8. [Google Scholar] [CrossRef]
- Schmitz Weiss, A. Place-Based Knowledge in the Twenty-First Century. Digit. J. 2015, 3, 116–131. [Google Scholar] [CrossRef]
- Thudt, A.; Walny, J.; Gschwandtner, T.; Dykes, J.; Stasko, J. Exploration and Explanation in Data-Driven Storytelling. In Data-Driven Storytelling; A K Peters/CRC Press: Boca Raton, FL, USA, 2018; pp. 59–83. [Google Scholar] [CrossRef]
- Ryan, M.-L. Narrative Across Media: The Language of Storytelling; University of Nebraska Press: Lincoln, NE, USA; London, UK, 2004. [Google Scholar]
- Azuma, R.; Baillot, Y.; Behringer, R.; Feiner, S.; Julier, S.; MacIntyre, B. Recent Advances in Augmented Reality. IEEE Comput. Graph. Appl. 2001, 21, 34–47. [Google Scholar] [CrossRef]
- Rieser, M. Artistic Explorations: Mobile, Locative and Hybrid Narratives. In Interactive Digital Narrative—History, Theory and Practice; Koenitz, H., Ferri, G., Haahr, M., Sezen, D., Sezen, T.İ., Eds.; Taylor & Francis: New York, NY, USA; London, UK, 2015; pp. 241–257. [Google Scholar]
- MacIntyre, B.; Bolter, J.D.; Moreno, E.; Hannigan, B. Augmented Reality as a New Media Experience. In Proceedings of the IEEE and ACM International Symposium on Augmented Reality, New York, NY, USA, 29–30 October 2001; pp. 197–206. [Google Scholar] [CrossRef]
- Liestøl, G. Augmented Reality Storytelling—Narrative Design and Reconstruction of a Historical Event in Situ. Int. J. Interact. Mob. Technol. IJIM 2019, 13, 196. [Google Scholar] [CrossRef]
- Lee, B.; Riche, N.H.; Isenberg, P.; Carpendale, S. More Than Telling a Story: Transforming Data into Visually Shared Stories. IEEE Comput. Graph. Appl. 2015, 35, 84–90. [Google Scholar] [CrossRef] [PubMed]
- Figueiras, A.R.d.P. How to Tell Stories Using Visualization: Strategies towards Narrative Visualization. Ph.D. Thesis, Universidade Nova de Lisboa, Lisboa, Portugal, 2016. [Google Scholar]
- Ma, K.L.; Liao, I.; Frazier, J.; Hauser, H.; Kostis, H.N. Scientific Storytelling Using Visualization. IEEE Comput. Graph. Appl. 2012, 32, 12–19. [Google Scholar] [CrossRef] [PubMed]
- Bastiras, J.; Thomas, B.H. Combining Virtual Reality and Narrative Visualisation to Persuade. In Proceedings of the 2017 International Symposium on Big Data Visual Analytics (BDVA), Adelaide, SA, Australia, 7–10 November 2017; pp. 1–8. [Google Scholar] [CrossRef]
- Isenberg, P.; Lee, B.; Qu, H.; Cordeil, M. Immersive Visual Data Stories. In Lecture Notes in Computer Science; Including Subseries Lecture Notes in Artificial Intelligence and Lecture Notes in Bioinformatics; Springer: Cham, Switzerland, 2018; Volume 11190, pp. 165–184. [Google Scholar] [CrossRef]
- Marques, A.B.; Branco, V.; Costa, R.; Costa, N. Data Visualization in Hybrid Space—Constraints and Opportunities for Design. In Advances in Design and Digital Communication III—Proceedings of the 6th International Conference on Design and Digital Communication, Digicom 2022; Martins, N., Brandão, D., Eds.; Springer: Barcelos, Portugal, 2022. [Google Scholar]
- Ryan, M.-L. Emotional and Strategic Conceptions of Space in Digital Narratives. In Interactive Digital Narrative—History, Theory and Practice; Koenitz, H., Ferri, G., Haahr, M., Sezen, D., Sezen, T.İ., Eds.; Taylor & Francis: New York, NY, USA; London, UK, 2015; pp. 106–120. [Google Scholar]
- Tong, C.; Roberts, R.; Borgo, R.; Walton, S.; Laramee, R.; Wegba, K.; Lu, A.; Wang, Y.; Qu, H.; Luo, Q.; et al. Storytelling and Visualization: An Extended Survey. Information 2018, 9, 65. [Google Scholar] [CrossRef]
- Esser, F.; Vliegenthart, R. Comparative Research Methods. In The International Encyclopedia of Communication Research Methods; Wiley: Hoboken, NJ, USA, 2017; pp. 1–22. [Google Scholar] [CrossRef]
- Aitamurto, T.; Aymerich-Franch, L.; Saldivar, J.; Kircos, C.; Sadeghi, Y.; Sakshuwong, S. Examining Augmented Reality in Journalism: Presence, Knowledge Gain, and Perceived Visual Authenticity. New Media Soc. 2022, 24, 1281–1302. [Google Scholar] [CrossRef]
- Tejedor-Calvo, S.; Romero-Rodríguez, L.M.; Moncada-Moncada, A.-J.; Alencar-Dornelles, M. Journalism That Tells the Future: Possibilities and Journalistic Scenarios for Augmented Reality. Prof. Inf. 2020, 29, 6. [Google Scholar] [CrossRef]
- Van Pavlik, J.; Bridges, F. The Emergence of Augmented Reality (AR) as a Storytelling Medium in Journalism. J. Commun. Monogr. 2013, 15, 4–59. [Google Scholar] [CrossRef]
- Marques, A.B. AR Data Storytelling. Zenodo 2022, 2022, 7331412. [Google Scholar] [CrossRef]
- Herman, D.; Jahn, M.; Ryan, M.-L. Routledge Encyclopedia of Narrative Theory, 1st ed.; Routledge: Oxfordshire, UK, 2005. [Google Scholar]
- Bolter, J.D.; Grusin, R. Remediation: Understanding New Media; The MIT Press: Cambridge, MA, USA; London, UK, 1999. [Google Scholar]
- USA Today. Step Inside the Crime Scene at the Heart of “Accused”, Season 4’. Available online: https://eu.usatoday.com/story/augmented-reality/2022/01/24/interactivestory-experienceid-accusedusat/6620625001/ (accessed on 27 September 2022).
- USA Today. Kent State Shootings: A Day of Tragedy. Available online: https://eu.usatoday.com/story/augmented-reality/2020/05/01/interactivestory-experienceid-kentstate/3047603001/ (accessed on 27 September 2022).
- USA Today. Journey Into the Body to See COVID Vaccine at Work. Available online: https://eu.usatoday.com/story/augmented-reality/2021/01/27/interactivestory-experienceid-mrna/6701446002/ (accessed on 27 September 2022).
- New York Times. Monsters That Live on You. Available online: https://www.nytimes.com/interactive/2018/10/25/multimedia/bugs-halloween-kids-ar-ul.html (accessed on 27 September 2022).
- New York Times. See How the World’s Most Polluted Air Compares with Your City’s. Available online: https://www.nytimes.com/interactive/2019/12/02/climate/air-pollution-compare-ar-ul.html (accessed on 27 September 2022).
- National Geographic. The World in 2070. Available online: https://www.nationalgeographic.com/pages/article/earth-day-instagram-ar-experience (accessed on 27 September 2022).
- USA Today. Woman’s Suffrage: Famous Speeches Come to Life. Available online: https://eu.usatoday.com/story/augmented-reality/2020/07/16/interactivestory-experienceid-suffrage/3134483001/ (accessed on 27 September 2022).
- New York Times. Augmented Reality: Four of the Best Olympians, as You’ve Never Seen Them. Available online: https://www.nytimes.com/interactive/2018/02/05/sports/olympics/ar-augmented-reality-olympic-athletes-ul.html (accessed on 27 September 2022).
- Washington Post. Scale a 50-Foot Speed Climbing Wall in Augmented Reality. Available online: https://www.washingtonpost.com/sports/olympics/interactive/2021/sport-climbing-brooke-raboutou-augmented-reality/ (accessed on 27 September 2022).
- New York Times. Gymnastics in Tokyo. Available online: https://www.nytimes.com/interactive/2021/sports/olympics/suni-lee-gymnastics.html (accessed on 27 September 2022).
- Masud, L.; Valsecchi, F.; Ciuccarelli, P.; Ricci, D.; Caviglia, G. From Data to Knowledge—Visualizations as Transformation Processes within the Data-Information-Knowledge Continuum. In Proceedings of the 2010 14th International Conference Information Visualisation, London, UK, 26–29 July 2010; pp. 445–449. [Google Scholar] [CrossRef]
- New York Times. Take a Tour of Lady Liberty’s Torch. Available online: https://www.nytimes.com/interactive/2018/11/13/nyregion/statue-of-liberty-torch-ar-ul.html (accessed on 27 September 2022).
- National Geographic. Deinonychus. Available online: https://www.nationalgeographic.com/magazine/article/reimagining-dinosaurs-prehistoric-icons-get-a-modern-reboot-interactive-feature (accessed on 27 September 2022).
- New York Times. What Will the Megastorm’s Rain Look Like? Available online: https://www.nytimes.com/interactive/2022/08/12/climate/california-rain-storm.html (accessed on 27 September 2022).
- New York Times. Inflation Shrinking Ray. Available online: https://www.nytimes.com/interactive/2022/04/20/business/inflation-shrink-ray.html?shared=1 (accessed on 27 September 2022).
- New York Times. Step Inside the Thai Cave in Augmented Reality. Available online: https://www.nytimes.com/interactive/2018/07/21/world/asia/thai-cave-rescue-ar-ul.html?mtrref=www.google.com&gwh=20B4938FE47F02B62FDAF2C714F48BCF&gwt=pay&assetType=PAYWALL (accessed on 27 September 2022).
- New York Times. EV Battery Breakdown. Available online: https://www.nytimes.com/interactive/2022/08/19/business/electric-vehicle-battery-made.html (accessed on 27 September 2022).
- Hullman, J.; Drucker, S.; Henry Riche, N.; Lee, B.; Fisher, D.; Adar, E. A Deeper Understanding of Sequence in Narrative Visualization. IEEE Trans. Vis. Comput. Graph. 2013, 19, 2406–2415. [Google Scholar] [CrossRef] [PubMed]
- Ryan, M.-L. The Many Forms of Interactivity. In Narrative as Virtual Reality 2: Revisiting Immersion and Interactivity in Literature and Eletronic Media; John Hopkins University Press: Baltimore, MD, USA, 2015. [Google Scholar]
- USA Today. Notre Dame: After the Fire. Available online: https://eu.usatoday.com/story/augmented-reality/2019/08/27/interactivestory-experienceid-notredame/2083634001/ (accessed on 27 September 2022).
- USA Today. Explore Mars Perseverance Rover in Augmented Reality. Available online: https://eu.usatoday.com/story/augmented-reality/2021/02/12/interactivestory-experienceid-mars/4452739001/ (accessed on 27 September 2022).
- USA Today. Sport Climbing with Kyra Condie. Available online: https://eu.usatoday.com/story/augmented-reality/2021/07/19/interactivestory-experienceid-climb/7800474002/ (accessed on 27 September 2022).
- USA Today. Capitals’ John Carlson Discusses the All-Star Game. Available online: https://eu.usatoday.com/story/augmented-reality/2019/08/27/interactivestory-experienceid-carlson/2122972001/ (accessed on 27 September 2022).
- USA Today. Statues Bring Suffrage History to You in Augmented Reality. Available online: https://eu.usatoday.com/story/augmented-reality/2020/08/13/interactivestory-experienceid-suffragestatues/3358813001/ (accessed on 27 September 2022).
- Florida Today. 321 Launch—Falcon 9. Available online: https://www.321launchapp.com/ (accessed on 27 September 2022).
- New York Times. Election Forecasts. Available online: https://rd.nytimes.com/projects/augmented-reality-storytelling#election-forecast (accessed on 27 September 2022).


| Dimension | Aspects Addressed | Functional Equivalents | Strategies for Flexibility (Without AR) | Strategies for Interpretation (Without AR) |
|---|---|---|---|---|
| View | The ways in which data is shown to the reader, including the available encodings and any transformations made on the data (such as normalization or aggregation). | Strategies for the visual encoding of data. Strategies for reader-driven visual encoding. | Multiple separate views (to highlight different aspects of the data); Multiple coordinated views; Animated transitions; Reader-driven visual encoding. | Choice of representation: visual encoding (color, media, etc.); Choice of how data is represented (data aggregation, data normalization); Use of visual metaphors. |
| Focus | The subject of the story, the particular set or subset of data shown, and the aspects of data that are shown. | Strategies allowing the user to select a particular set of the data shown. | Allow readers to view different subsets of the data or decide which attributes to show. Interaction techniques that allow the reader to change focus: filtering, selecting, zooming/panning, drill down. | Guiding the focus of the reader specifically to the aspects that support the story; Highlight and annotations; Fading out or omitting data that is not directly relevant to the interpretation. |
| Sequence | The order in which the information in the story can be viewed. | Types of narrative structure. Strategies allowing the user to choose the narrative order. | Ways that allow readers to determine order or aspects of order. Flexible methods that allow a reader to explore freely typically permit the reader to jump to different visualizations in any order. | Interface controls that support interpretation: Step-by-step (stepper); scrolling (scrolly-telling); Panning and zooming. |
| Dimension | Strategies | Count | Cases (Nr.) | ||
|---|---|---|---|---|---|
| View | Mockup/Diorama | 15 | 11, 14, 18, 21, 26, 28, 42, 47, 49, 50, 51, 54, 56, 57, 62 | ||
| Microscopic or atomic representation | 6 | 10, 23, 34, 45, 47, 59 | |||
| 3D Astronomic representation | 6 | 12, 25, 33, 41, 43, 50 | |||
| Traditional narrative form | 1 | 1 | |||
| Real person | 4 | 7, 53, 56, 57 | |||
| Human activity/performance | 3 | 35, 65, 66 | |||
| Full Scale real artifact | 13 | 15, 32, 33, 37, 43, 44, 46, 47, 52, 55, 57, 58, 67 | |||
| Full scale animal | 2 | 27, 39 | |||
| Natural phenomenon | 2 | 16, 36 | |||
| Quantitative data representation | 5 | 13, 38, 40, 49, 69 | |||
| Two-dimensional area, size or configuration | 2 | 9, 22 | |||
| Focus | Selecting | 26 | 7, 10, 12, 13, 18, 25, 26, 28, 33, 38, 39, 40, 42, 43, 44, 46, 48, 50, 51, 52, 53, 54, 56, 57, 59, 62 | ||
| Filter | 1 | 23 | |||
| Searching Tool | 1 | 23 | |||
| Sequence | Narrative Order | Linear | 24 | 9, 11, 13, 14, 15, 16, 21, 22, 27, 32, 34, 35, 36, 37, 41, 45, 47, 49, 55, 58, 65, 66, 67, 69 | |
| Non-linear | 26 | 7, 10, 12, 18, 23, 25, 26, 28, 33, 38, 39, 40, 42, 43, 44, 46, 48, 50, 51, 52, 53, 54, 56, 57, 59, 62 | |||
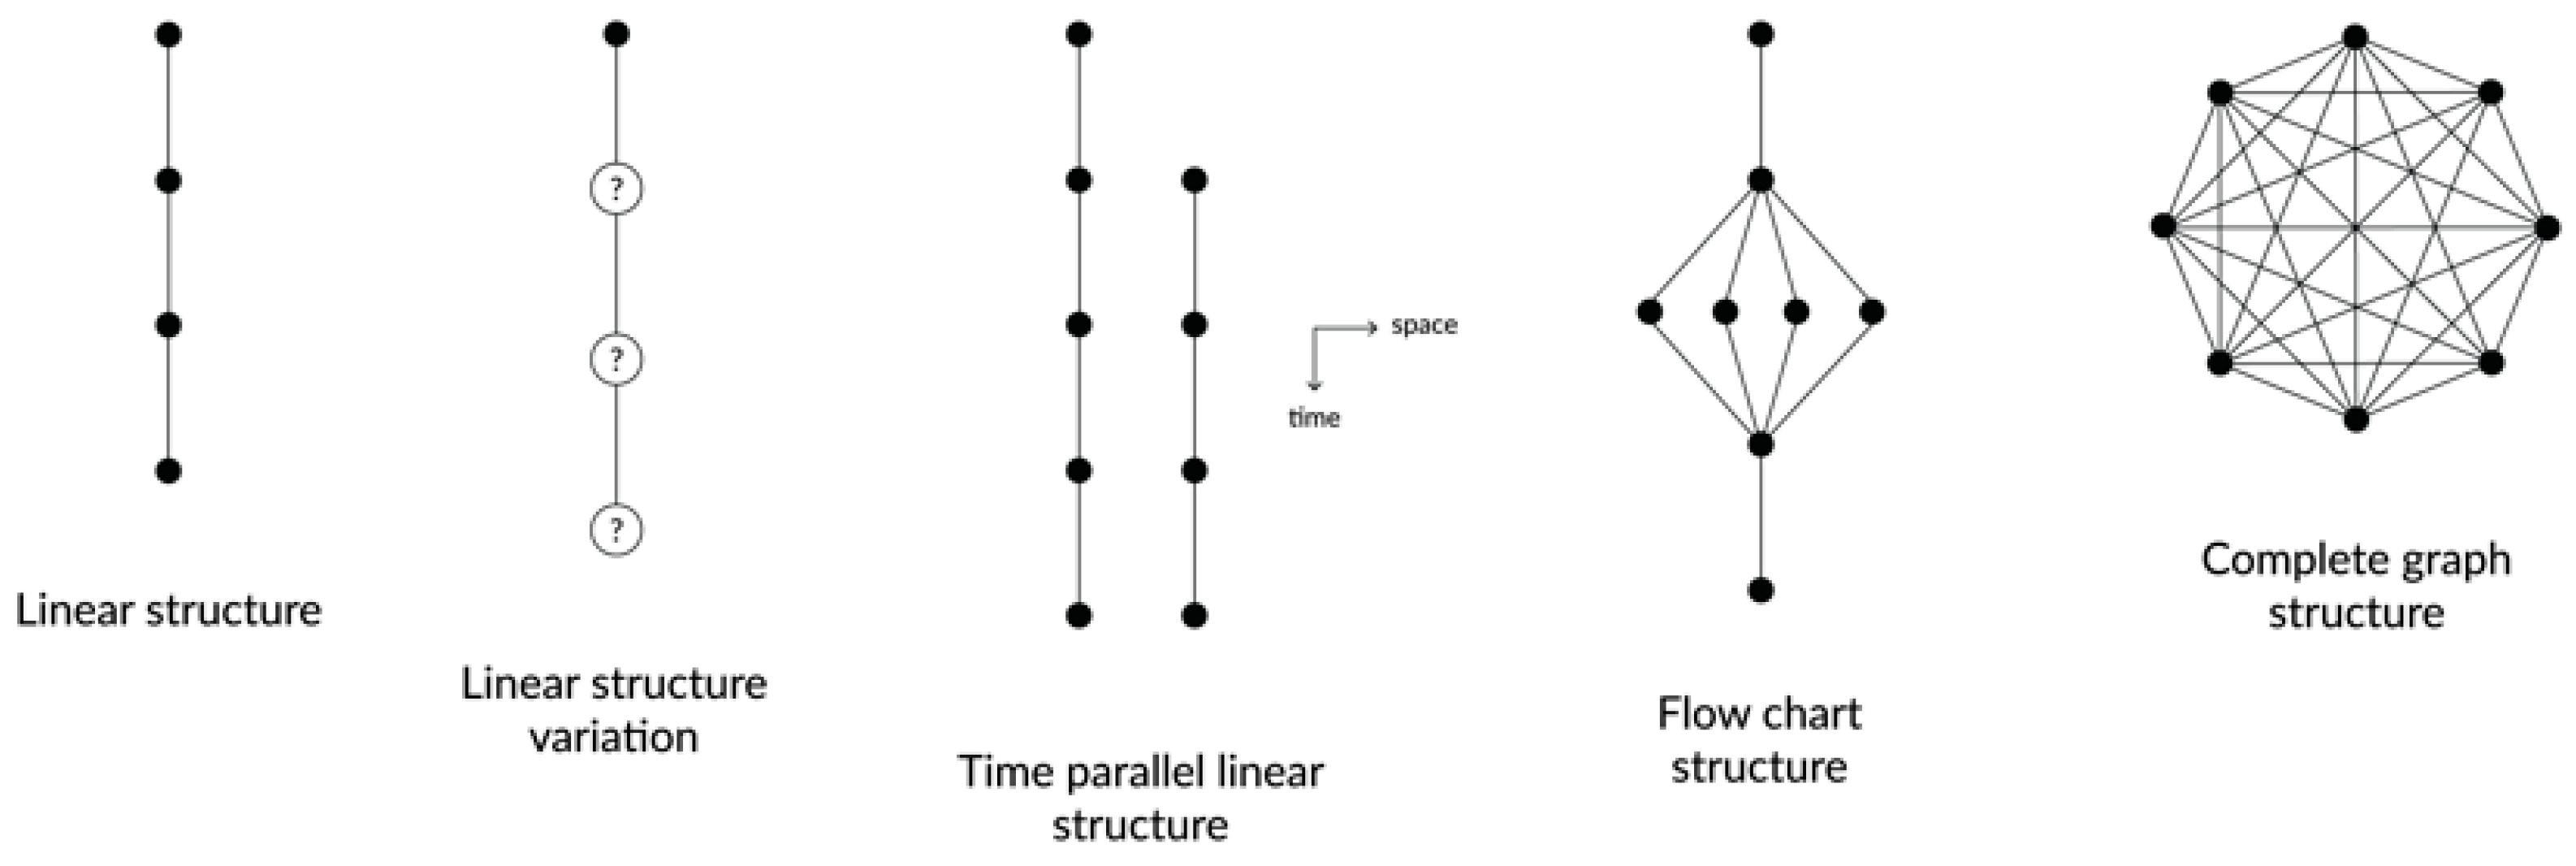
| Narrative Sequence | Structure Type | Linear structure | 20 | 9, 11, 14, 15, 16, 21, 27, 32, 34, 35, 36, 41, 45, 47, 49, 55, 65, 66, 67, 69 | |
| Linear structure variation | 4 | 13, 22, 37, 58 | |||
| Time parallel linear structure | 1 | 28 | |||
| Flow chart | 1 | 23 | |||
| Complete graph | - | Complete graph only occurs in combination with other types of structure. | |||
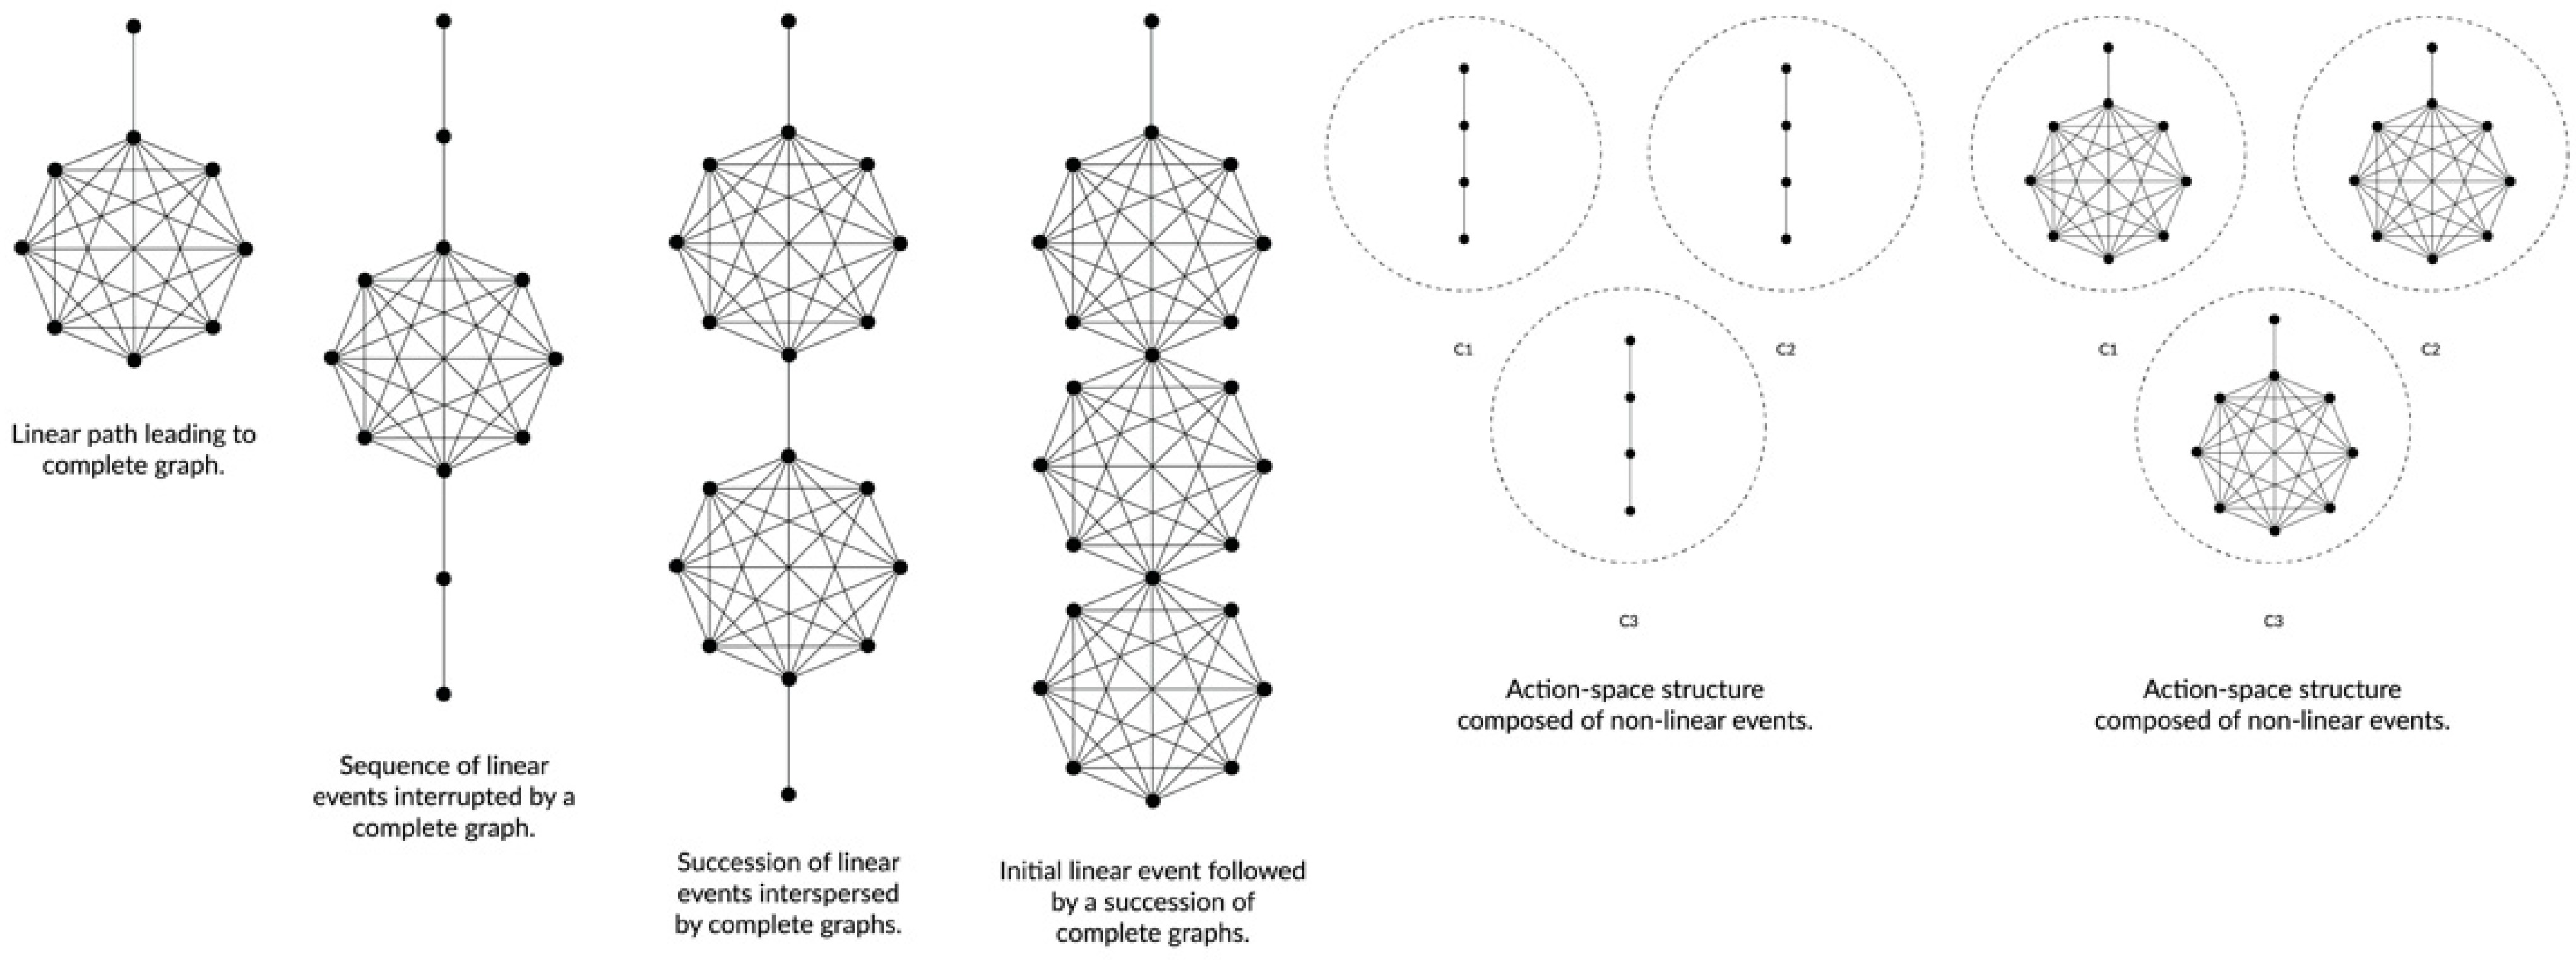
| Combined Narrative Structures | Linear path leading to complete graph. | 6 | 12, 25, 26, 39, 46, 51 | ||
| Sequence of linear events interrupted by a complete graph. | 3 | 43, 54, 59 | |||
| A succession of linear events interspersed by complete graphs. | 8 | 7, 33, 38, 42, 50, 56, 57, 62 | |||
| Initial linear event followed by a succession of complete graphs. | 1 | 53 | |||
| Action-Space | 6 | 10, 18, 40, 44, 48, 52 | |||
| User Intervention | User Intervention Type | (A) The user controls the framing of the view, controls the way of seeing. | 50 | All cases | |
| (B) The user progresses through the narrative and/or activates an animation. | 46 | All except 25, 27, 39, 51 | |||
| (C) Although the user only progresses through the narrative and/or activates an animation, there is a simulation of greater control of the narrative. | 3 | 13, 43, 54 | |||
| (D) The materials that make up the narrative are totally predetermined, but their order is variable and chosen by the user. | 25 | 7, 10, 12, 18, 25, 26, 28, 33, 38, 39, 40, 42, 43, 44, 46, 48, 50, 51, 52, 53, 54, 56, 57, 59, 62 | |||
| (E) The user chooses a certain narrative path, but the ending is always the same regardless of his choice. | 1 | 23 | |||
| Combined User Intervention | AB | 22 | 9, 11, 14, 15, 16, 21, 22, 32, 34, 35, 36, 37, 41, 45, 47, 49, 55, 58, 65, 66, 67, 69 | ||
| ABD | 20 | 7, 10, 12, 18, 26, 28, 33, 38, 40, 42, 44, 46, 48, 50, 52, 53, 56, 57, 59, 62 | |||
| AD | 3 | 25, 39, 51 | |||
| ABCD | 2 | 43, 54 | |||
| ABE | 1 | 23 | |||
| ABC | 1 | 13 | |||
| A | 1 | 27 | |||
Publisher’s Note: MDPI stays neutral with regard to jurisdictional claims in published maps and institutional affiliations. |
© 2022 by the authors. Licensee MDPI, Basel, Switzerland. This article is an open access article distributed under the terms and conditions of the Creative Commons Attribution (CC BY) license (https://creativecommons.org/licenses/by/4.0/).
Share and Cite
Marques, A.B.; Branco, V.; Costa, R. Narrative Visualization with Augmented Reality. Multimodal Technol. Interact. 2022, 6, 105. https://doi.org/10.3390/mti6120105
Marques AB, Branco V, Costa R. Narrative Visualization with Augmented Reality. Multimodal Technologies and Interaction. 2022; 6(12):105. https://doi.org/10.3390/mti6120105
Chicago/Turabian StyleMarques, Ana Beatriz, Vasco Branco, and Rui Costa. 2022. "Narrative Visualization with Augmented Reality" Multimodal Technologies and Interaction 6, no. 12: 105. https://doi.org/10.3390/mti6120105
APA StyleMarques, A. B., Branco, V., & Costa, R. (2022). Narrative Visualization with Augmented Reality. Multimodal Technologies and Interaction, 6(12), 105. https://doi.org/10.3390/mti6120105