1. Introduction
Along with the growth of the economy, urbanization and population, plastic waste, especially non-degradable plastic bags, tends to increase, putting pressure on the environment [
1,
2]. Plastic waste clogs drainage, channels and rivers and threatens marine and coastal ecosystems. This has a negative impact on important sectors of the economy, including tourism, maritime transportation and aquaculture [
2,
3,
4]. In 2015, Vietnam disposed of approximately 5 million tons of plastic. In 2018, plastic production increased by 7%, reaching 8.3 million tons [
5]. Of the total processed plastic waste, the percentage of recovered or recycled plastic was 11–12%, while the rest was incinerated, landfill-disposed or leaked into the environment [
5]. The oceans are considered the final reservoir for some plastic waste as about 80% of the waste in the sea comes from the mainland [
5].
Water surface area of the Tam Giang–Cau Hai lagoon system is over 21,000 hectares, a high biodiversity area with many species listed in the Vietnam Red Data Book recognized by both domestic and international scientists [
6]. This area receives water from river systems flowing through 33 wards/communes alongside the lagoon, into which uncontrolled solid and liquid substances from domestic and agricultural activities are disposed. Thus, all of these wastes end up in the Tam Giang–Cau Hai lagoon system. Agricultural, industrial, tourism and daily activities in the wards/communes alongside the lagoon are the main sources of plastic waste in the lagoon [
7,
8,
9]. Furthermore, the inadequacy of waste collection and treatment exacerbates the issue of plastic waste leakage into the lagoon [
9]. There have been several studies on problems of plastic waste leakage. A study by Yusuf et al. (2018) in Indonesia showed that plastic waste was a serious problem, with plastic bags and bottles being the most common items found in the sea [
10]. Schmidt et al. investigated plastic waste from the mainland to the ocean via rivers such as the Yangtze River (carrying 1,469,481 tons of plastic), the Nile (84,792 tons), the Meghna, Ganga and Brahmaputra (72,845 tons), and the Mekong River (33,431 tons) [
11]. In Vietnam, a number of studies have assessed the current status of plastic waste such as those by Tran (2020) and Nguyen and Ho (2022) [
12,
13]. These studies found that plastic waste has increased dramatically over the past few years, with plastic bottles and bags being the most common items [
12,
13]. However, there are few studies on the leakage of plastic waste from different sources into the ocean. Therefore, this was the first study to evaluate the amount of plastic waste leakage from Hue City to the Tam Giang–Cau Hai lagoon system, contributing to investigating the composition and origin of plastic waste and determining the path of plastic waste leakage. Thus, several solutions could be recommended to minimize plastic waste.
2. Materials and Methods
2.1. Study Area
The Tam Giang–Cau Hai lagoon system stretches from 16°14′ to 16°42′ North latitude and 107°38′ to 107°93′ East longitude. The study was carried out in wards and communes surrounding the Tam Giang–Cau Hai lagoon system. A total of 21 survey wards and communes were included, located in four districts and a city: three wards/communes (Hai Duong and Huong Phong Communes and Thuan An Ward) in Hue City; two communes in Phong Dien District (Dien Hai and Dien Hoa); five communes in Phu Loc District (Giang Hai, Vinh Hien, Phu Gia, Loc An and Vinh Hung); six communes in Phu Vang District (Phu Xuan, Phu Da, Phu Hai, Phu Dien, Phu An and Phu My); and five communes in Quang Dien District (Quang Loi, Quang Thai, Quang Cong, Quang Ngan and Quang An) (
Figure 1).
The Tam Giang–Cau Hai lagoon system is a coastal wetland in Thua Thien Hue Province with the surface area of over 210 km
2 and includes three water bodies: Tam Giang lagoon in the Northern, Thuy Tu lagoon in the Central and Cau Hai in the Southern region. The average volume of the water basin is from 300 to 400 million m
2. The water basin is connected to the sea through Tu Hien Inlet in the South, which is 50–100 m in width and 1–2 m in depth, and Thuan An Inlet in the North, which is 250–300 m in width and 6–7 m in depth. Furthermore, the Tam Giang–Cau Hai lagoon system receives water sources from five rivers flowing into the lagoon, including O Lau, Huong, Dai Giang and Truoi Rivers; and from a river that flows directly to the sea (Bu Lu River) [
7].
The Tam Giang–Cau Hai lagoon system is an area encompassing numerous coastal ecosystems, which serve as important habitats for many species of shrimp, fish, and other marine flora and fauna [
14,
15]. Consequently, local livelihoods heavily rely on lagoon resources [
16]. Alongside the industrial and agricultural sectors, water-based economic activities are rapidly developing in the lagoon area including wild fishing, aquaculture, transportation, mine exploitation, tourism and other activities. These economic activities have significantly impacted the natural environment of the lagoon [
7,
17]. Additionally, the Tam Giang–Cau Hai lagoon system is also the recipient of domestic waste from residents living along its shores [
18].
2.2. Data Collection
This method was used to synthesize five articles on the status and impacts of plastic waste on the environment and six other documents related to climate, precipitation features and hydrometeorological characteristics of the Tam Giang–Cau Hai lagoon system in the last five years. Furthermore, sixteen reports and documents regarding the population, socio-economic status and current state of solid waste in the study area (Hue City, Huong Tra, Huong Thuy and Phu Vang Districts) were also collected. Details of the documents collected are presented in the References Section.
2.3. Solid Waste Sources and Components
Two substantial sources of solid waste released into the lagoon system were identified, comprising households and non-households. Field surveys were conducted based on the guidelines of the Smart Waste Management City Assessment Tool (WaCT) of UN Habitat (2020) to estimate the amount of solid waste generated from households and non-household sources in wards/communes distributed around the Tam Giang–Cau Hai lagoon system [
19].
For households, solid waste samples were collected during eight consecutive days (5–12 July 2021) from 20 households in Thuan An and Huong Phong wards (10 households/ward) to estimate the amount of generated solid waste. The non-households that were broken down into 11 subjects comprise (i) households, (ii) commercial establishments (restaurants, hotels, markets, etc.), (iii) institutions (schools, offices, hospitals, healthcare stations, etc.) and (iv) activities of business households (tourist boats, coastal fishing boats, lagoon boats and off-shore fishing boats). The amount and composition of solid waste generated from tourist boats, coastal fishing boats, lagoon boats and offshore fishing boats were estimated by in-person interview according to the WaCT User Manual [
19]. For other non-household subjects, the amount and composition of generated solid waste were determined by a series of field surveys and representative sampling [
19].
After collecting solid waste samples from households and non-household sources, the samples were transported to the General Environmental Laboratory, University of Sciences, Hue University, and then weighed and separated following six two-criteria categories according to the WFD User Manual and identification code. There are seven distinct identification code categories, namely polyethylene terephthalate (PET/PETE), high-density polyethylene (HDPE), polyvinyl chloride (PVC), low-density polyethylene (LDPE), polypropylene (P), polystyrene (PS) and other categories encompassing materials like glass fiber, polycarbonate and acrylic. For the WFD User Manual, solid waste samples underwent segregation into six specific types. These types consist of paper, plastic, glass, metal, organic waste, and finally, other categories encompassing items such as tires and secondhand electronic goods like televisions and refrigerators [
19].
2.4. Abundance and Separation of Solid Waste at Recycling Facilities and Landfills
The abundance and separation of recovered solid waste at junk shops: The numbers of junk shops in ten communes were collected by field survey. The survey and collected results showed that there were eight junk shops in 10 communes. Therefore, it was estimated that the total number of junk shops established in 33 communes along the lagoon system was about 26. In addition, these facilities were interviewed to estimate the amount of paper, plastic, metal and mixed solid waste to be classified. The interview form is presented in Appendix 6 of the WaCT user manual [
19].
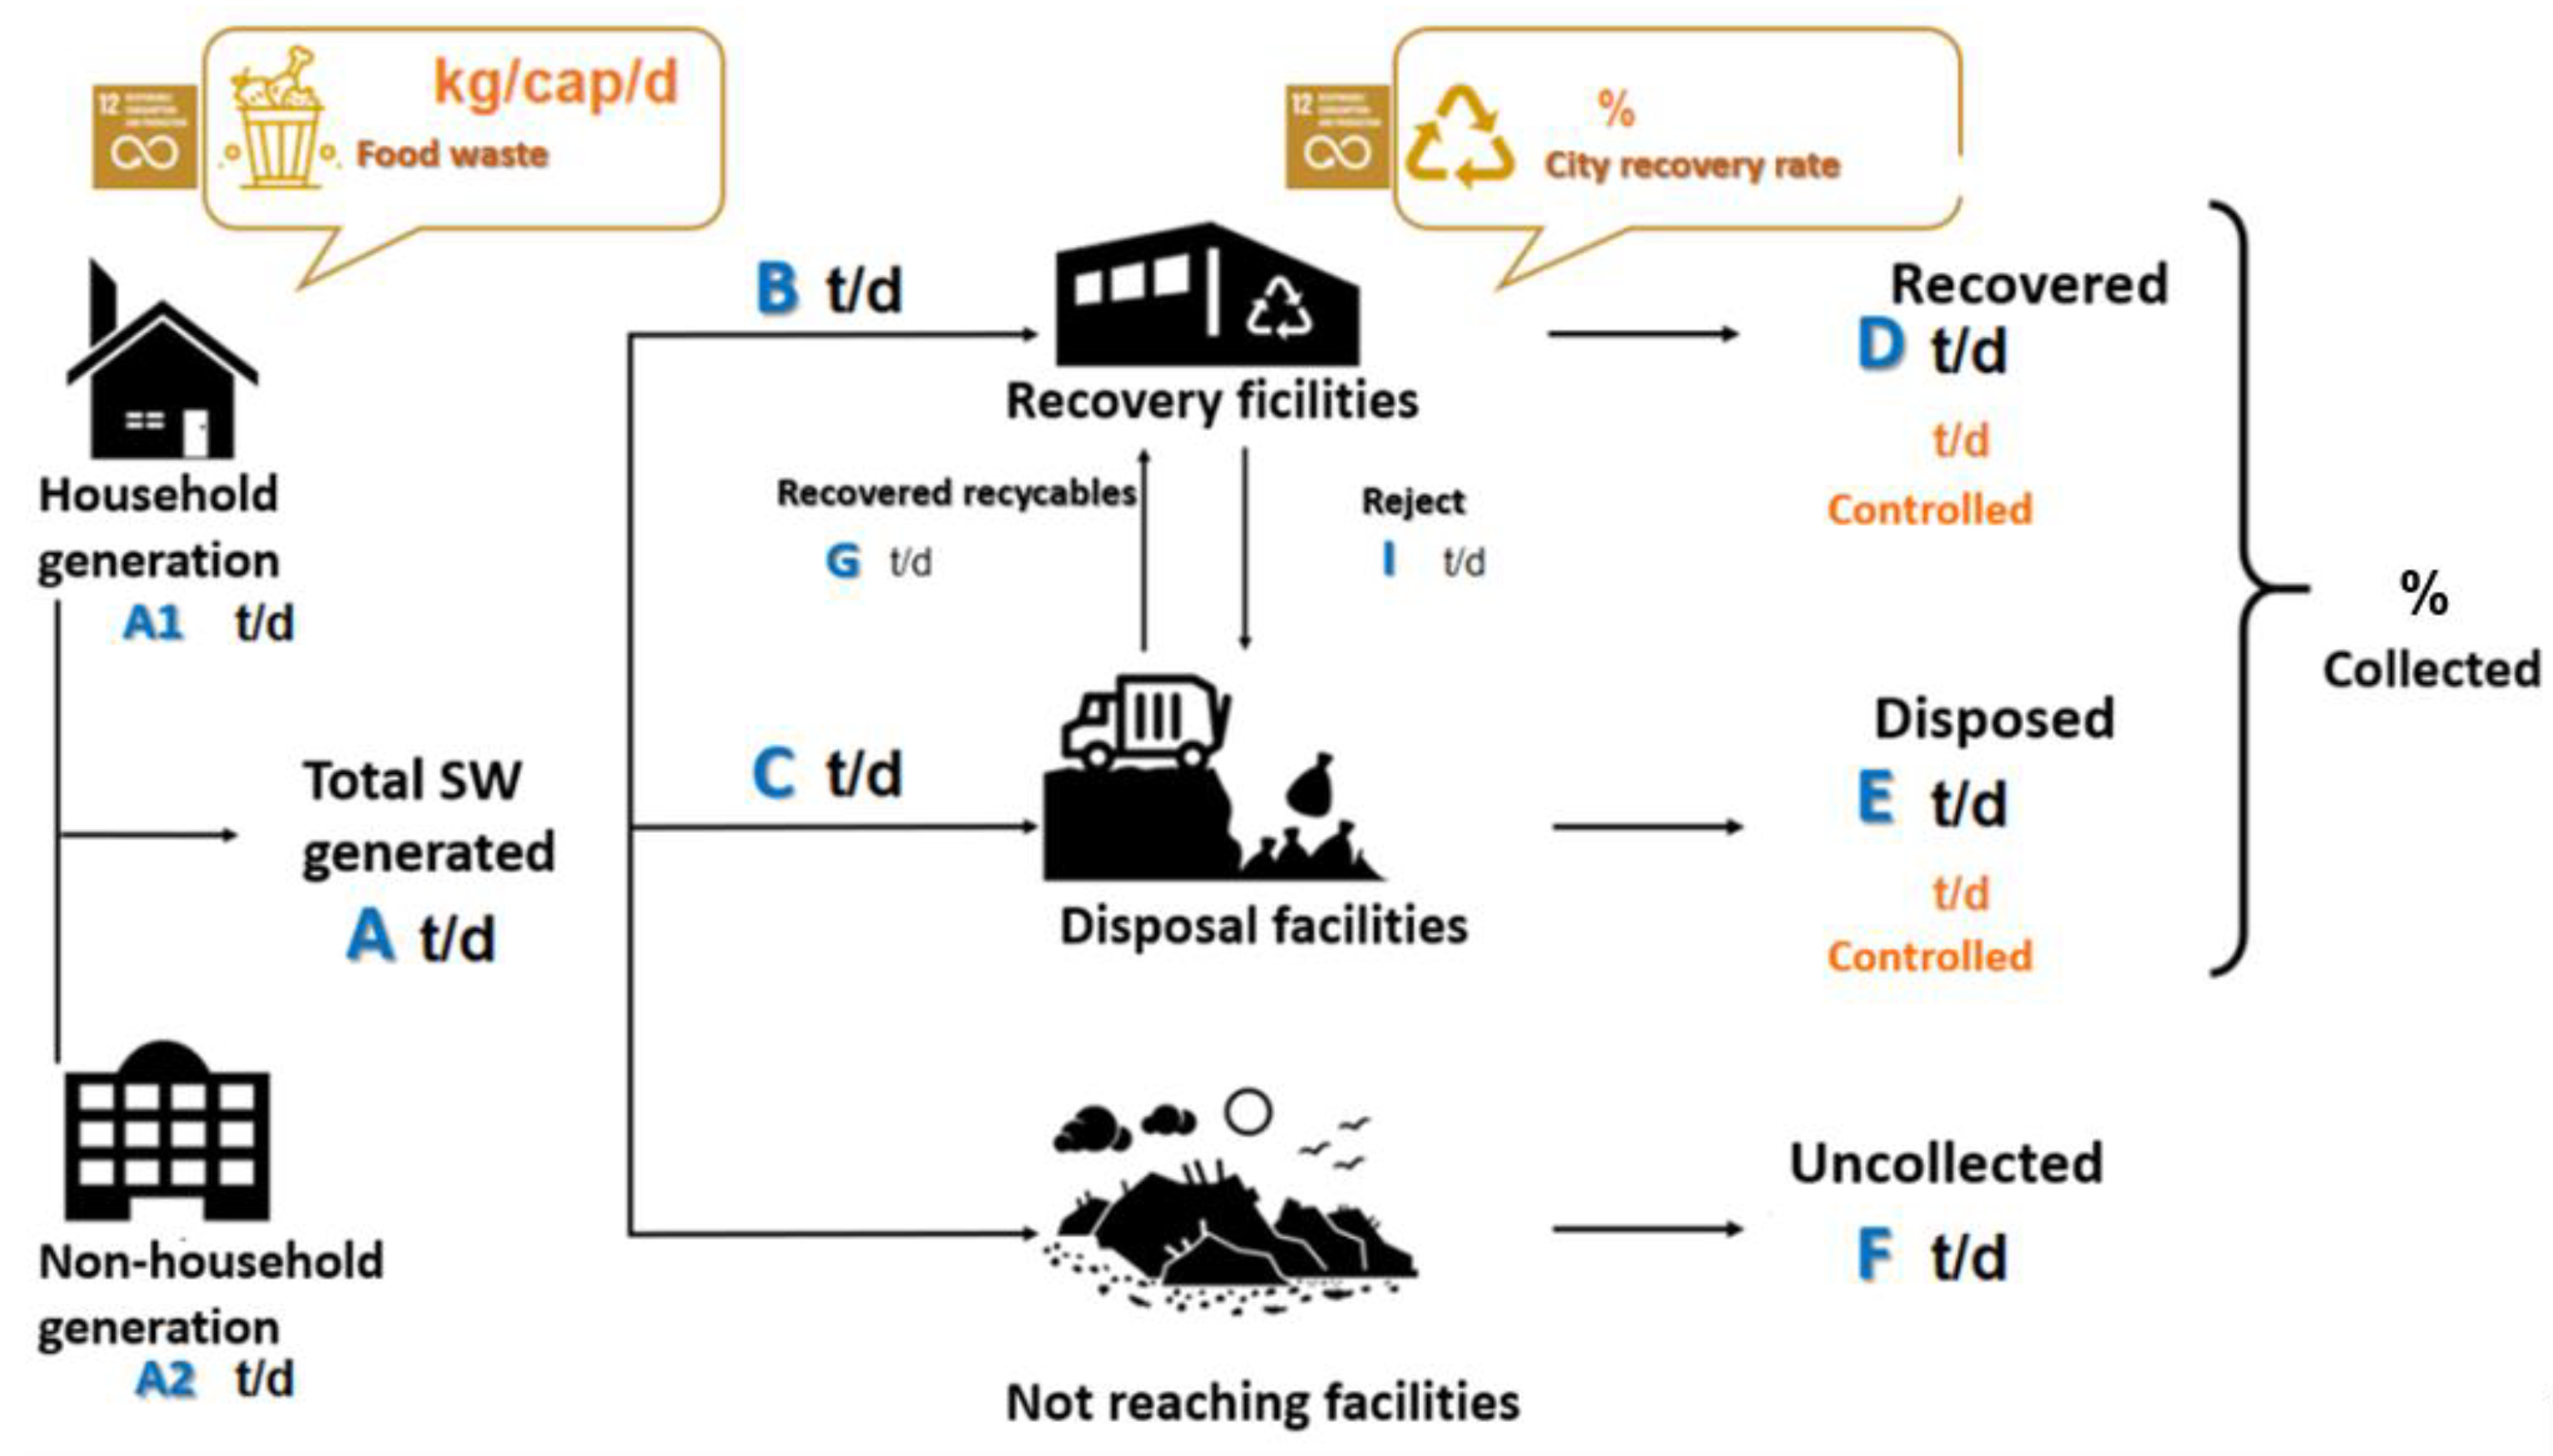
The abundance and separation of processed solid waste at landfills: Three landfills associated with plastic leakage into the Tam Giang–Cau Hai lagoon system, namely Thuy Phuong, Quang Loi, and Phong Thu, were surveyed. At each landfill, the collected amount and composition of solid waste were assessed. However, the solid waste at the landfills included many other categories such as construction and handicrafts. Additionally, environmental companies collected solid waste not only within the administrative boundaries of the 33 wards/communes along the lagoon system but also along the roads in Phong Dien, Phu Vang, Huong Tra, Phu Loc, Quang Dien and Hue City. Thus, the data collected from these surveys were not used for constructing the diagram of solid waste flows in the Tam Giang–Cau Hai lagoon system. Instead, the waste flow diagram from the WaCT (
Figure 2) was used to estimate the amount of solid waste at the landfill using Formula (1):
where
A: amount of solid waste generation from households and non-households;
B: amount of classified solid waste for collection at collection facilities;
Collection rate: this rate was calculated from the generated quantity and collected amount of the study area in the Report on Assessment of solid waste management [
20];
G: amount of solid waste sorted by scavengers at the landfill;
I: quantified rejects from the recovery system.
2.5. Amount of Plastic Waste Leakage
After estimating the amount and composition of solid waste collected, recovered, recycled and treated at junk shops and landfills, the waste flow diagram (WFD) was used to estimate the amount of plastic waste leakage into the environment [
21]. The WFD toolkit enables urban and rural areas to quickly assess their solid waste management system and map the flows of waste.
The WFD was employed to estimate the total volume of collected solid waste and the leakage volume into the environment [
21]. The data used for building the WFD were the following:
Solid waste sources and components;
The amount and composition recovered solid waste at junk shops;
The amount and composition processed solid waste at landfills;
The amount of uncollected solid waste leakage into the environment.
In addition, waste collection, sorting, transportation, soil, precipitation and water systems in communes/wards surrounding the Tam Giang–Cau Hai lagoon system were investigated to quantify plastic leakage. Leakage potential levels, leakage factors and the fate of the plastic waste leakage were determined following steps C and D elaborated in the WFD User Manual [
21]. The WFD calculates the total mass of plastic waste leaking from each stage of the solid waste management system by multiplying the combined leakage percentages by the total amount of plastic moving through that stage. There are five stages in which plastic can leak, including
- -
Plastic waste leakage from solid waste collection services;
- -
Plastic waste leakage form the recycling facilities;
- -
Plastic waste leakage during the solid waste transportation to the landfill;
- -
Plastic waste leakage from solid waste processing facilities;
- -
Plastic waste leaked into rain water and entering the water pathways.
Based on the WFD, the fate of plastic leakage was finally determined using the following criteria:
- -
Level of plastic waste openly incinerated;
- -
Level of plastic waste leakage to the soil;
- -
Level of plastic waste leakage to drains;
- -
Level of plastic waste leakage to water body system.
3. Results
3.1. Plastic Waste Sources and Amount
The survey results showed that the total amount of solid waste generated in the study area was 80.25 tons day
−1, with an average solid waste generation of 41 g person
−1 day
−1. Among the total solid waste, plastic waste accounts for 13.6% of the waste composition in the Tam Giang–Cau Hai lagoon system, ranking second after organic waste (77%) (
Figure 3). In terms of the composition of plastic waste, LDPE plastic (plastic bags, plastic films, etc.) has the highest proportion, followed by PET (water bottles, soft drink bottles, food bottles, etc.). LDPE plastic is commonly used in daily life (
Figure 3).
Regarding the sources of plastic solid waste, there are four categories including (i) households, (ii) commercial establishments (restaurant, hotel, markets, etc.), (iii) institutions (schools, offices, hospitals, healthcare stations, etc.) and (iv) activities of business households (tourist boats, coastal fishing boats, lagoon boats and off-shore fishing boats). The amount of plastic solid waste of each source is shown in
Table 1. The total amount of generated plastic waste in the study area is 3986 tons year
−1. The largest waste generation is concentrated in households and markets, with household waste accounting for 70.4% (2807 tons year
−1) and markets contributing 16.9% (675 tons year
−1). In contrast, hotels, coastal fishing boats and lagoon boats have the lowest waste generation, making up 0.1–0.3% (
Table 1).
3.2. Abundance of Recovered Plastic Waste
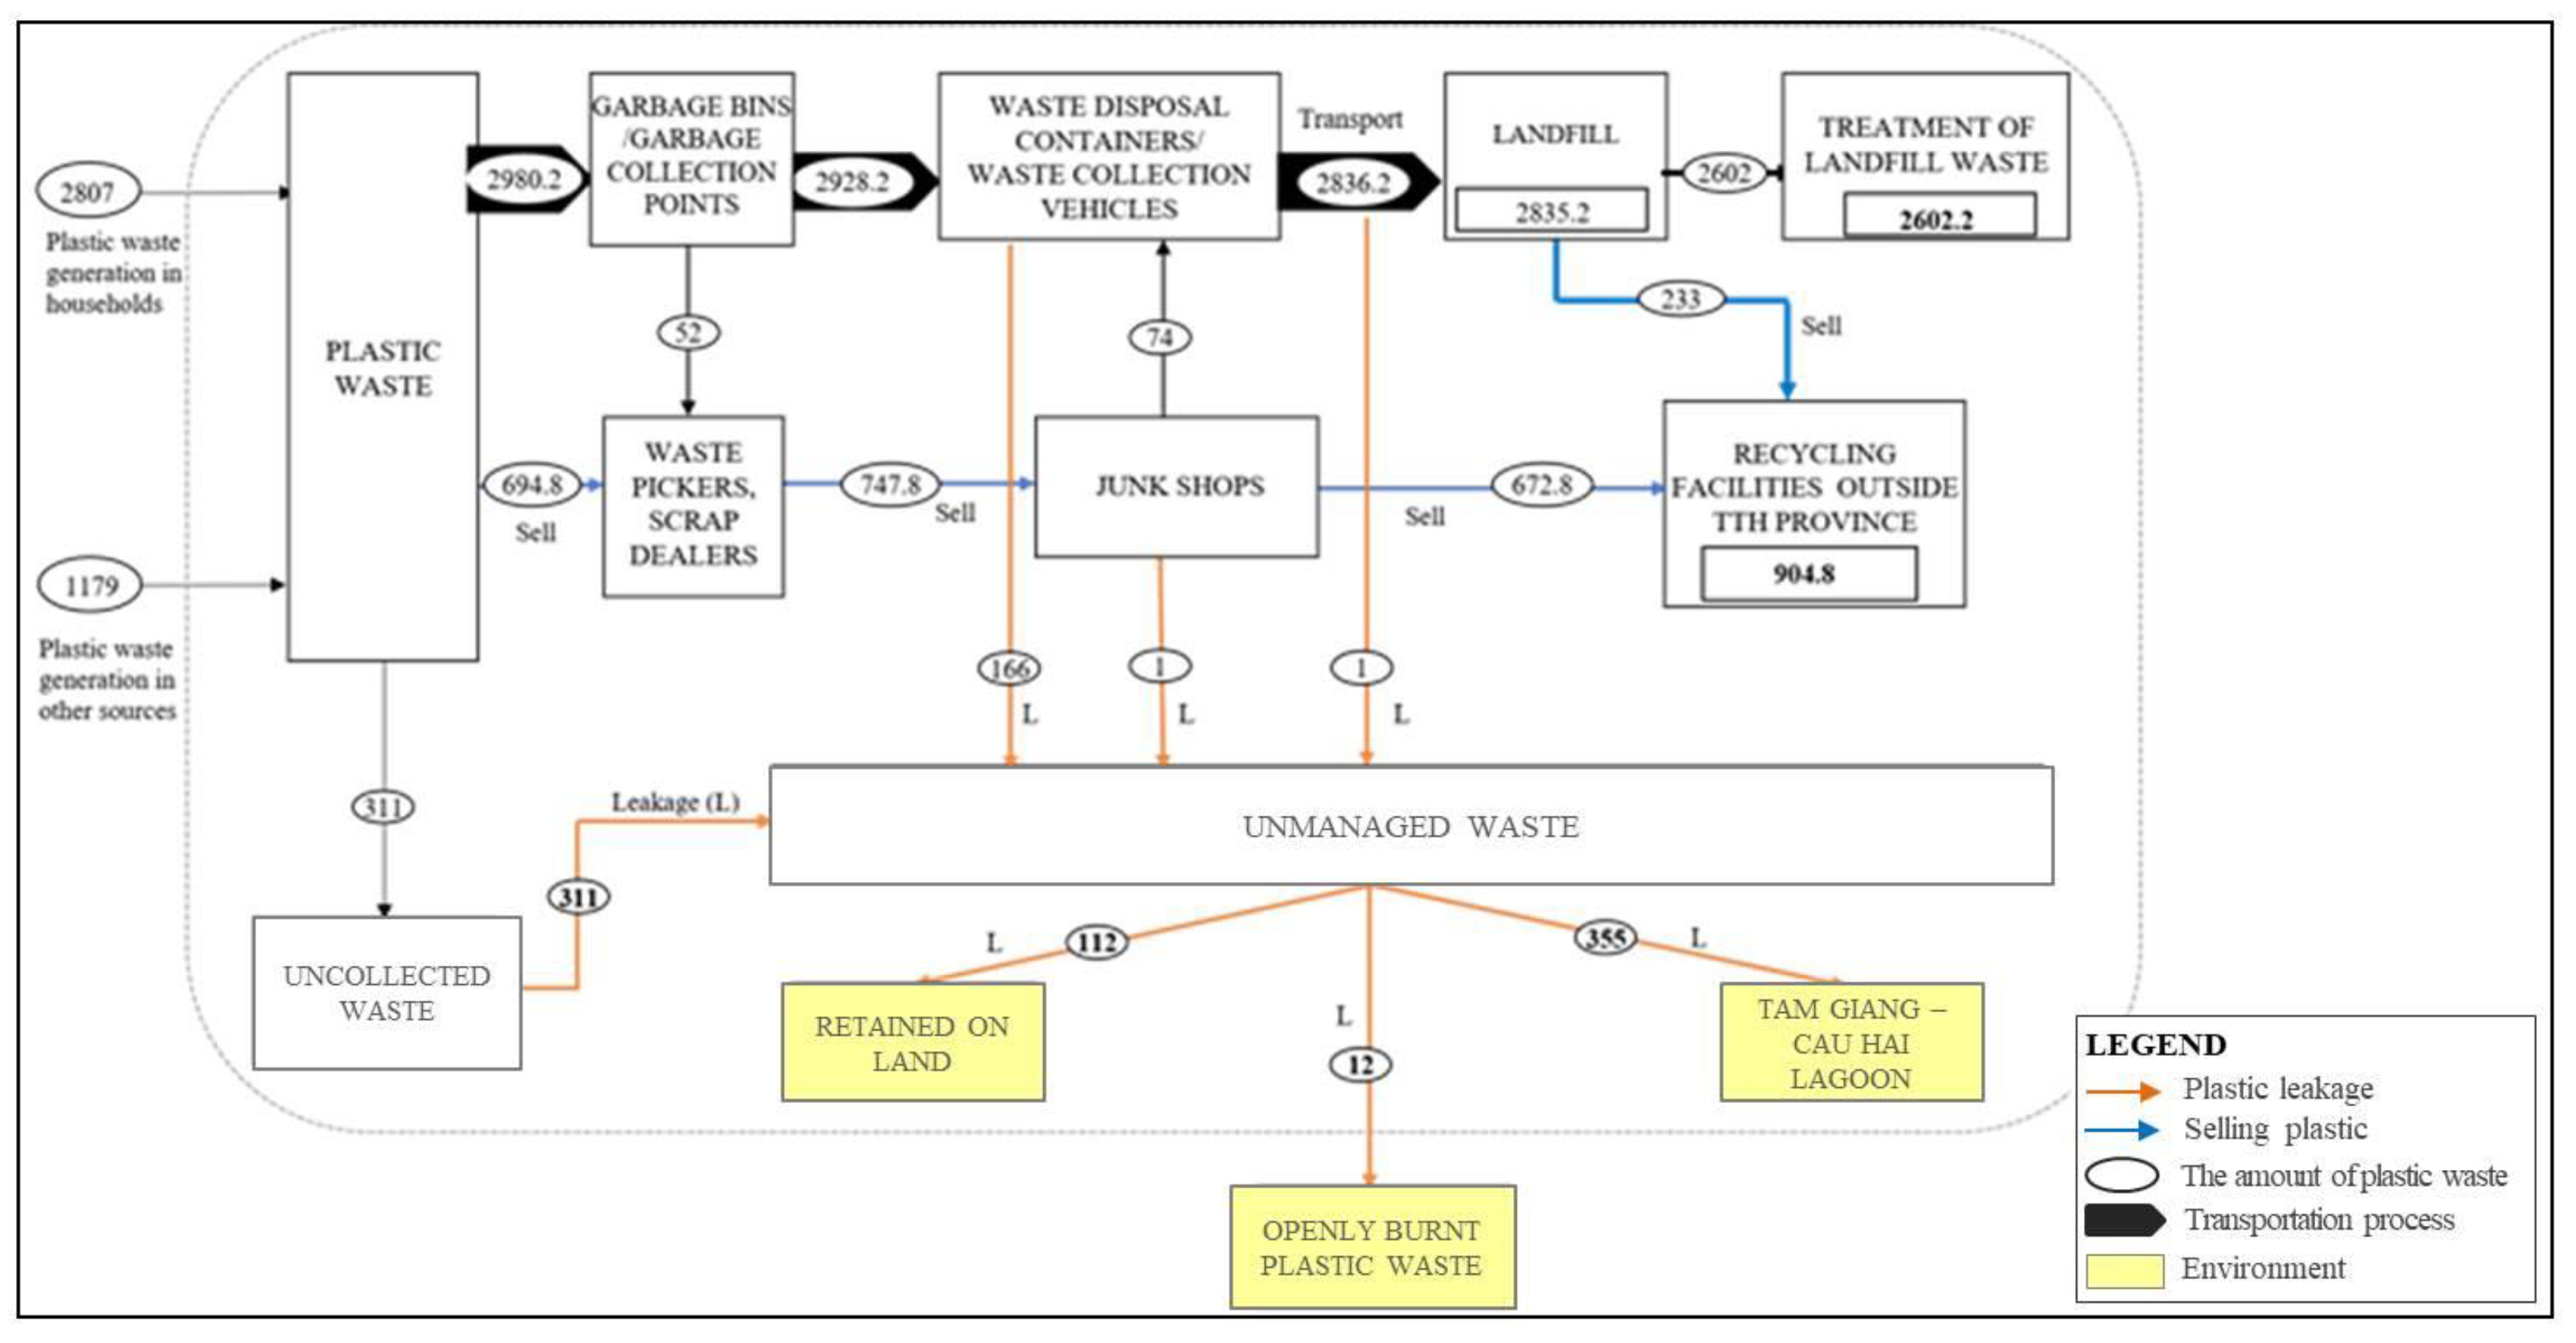
Through interviews and surveys, various types of solid waste such as plastic, paper and metal were classified and sourced from households, businesses and offices. These materials were then sold to intermediate traders, commonly known as scrap dealers. Waste pickers also collected recyclable materials from street garbage bins and garbage collection points. The upcoming process is that the materials collected by scrap dealers and waste pickers are purchased by secondary junk shops and transported to primary junk shops or recycling facilities outside Thua Thien Hue province. Furthermore, when solid waste is transported to landfills, waste pickers have the opportunity to recover “valuable” waste, which they can sell to recycling facilities outside Thua Thien Hue province. The recycling process of plastic waste in the Tam Giang–Cau Hai lagoon system is shown in
Figure 4.
In one year, the amount of recovered plastic waste collected from waste pickers and scrap dealers and transported to secondary junk shops is approximately 52 and 695 tons, respectively (
Figure 4). Secondary junk shops reject 24 tons in the process of sorting, export 216.8 tons of plastic waste to recycling facilities outside Thua Thien Hue province and transfer 506 tons to primary junk shops. In primary junk shops, 51 tons are rejected in the pre-processing of recyclables, and 455 tons are exported directly to the recycling facilities outside Thua Thien Hue province. In addition, the recycling facilities receive 233 tons of plastic waste from waste pickers from landfills. Therefore, the total amount of recycling plastic waste in the survey is approximately 904.8 tons year
−1 (
Figure 4).
3.3. Abundance and Composition of Solid Waste at Recycling Facilities and at the Landfill
The abundance and composition of plastic waste from recycling facilities and landfills surrounding the Tam Giang–Cau Hai lagoon system are presented in
Table 2.
The recovery of waste included five types: plastic, paper, metal, glass, and mixed waste. The amount of plastic was 904.8 tons year−1, constituting the largest proportion of the total recovered waste (52.9%). Paper is the second most commonly recycled material, with a total amount of 683 tons year−1, accounting for 39.9%. Glass and metal were not popular in the recycling market in the study area.
Regarding solid waste in the landfills, all solid waste generated in communes/wards surrounding the Tam Giang–Cau Hai lagoon system was collected and transported to Thuy Phuong, Quang Loi and Phong Thu landfills. The research results indicated that three landfills received nearly 23,486.6 tons year−1 of solid waste, of which plastic accounted for 11.1% of the solid waste composition at the landfill, ranking second after organic waste (81.8%).
3.4. Current Status of Plastic Waste Leakage
Based on the amount of solid waste from different sources and the WFD tool, the plastic leakage flows in the Tam Giang–Cau Hai lagoon system were calculated as shown in
Figure 5. The results in
Figure 5 show that the majority of plastic leakage came from uncollected waste, with 331 tons year
−1, and from garbage bins or garbage collection points with 166 tons year
−1. These amounts are equivalent to 8.3% and 4.2% of the total plastic waste generated, respectively. Additionally, the process of transporting solid waste to landfills and junk shops also made waste leak into the environment, but the plastic leakage of these two processes is relatively low, approximately 1 ton year
−1.
The amount of plastic leakage into the Tam Giang–Cau Hai lagoon system due to tranportation and waste treatment is estimated at 479 tons year−1, accounting for 11.5% of the total plastic waste generated. Meanwhile, the largest amount of plastic was leaked into the Tam Giang–Cau Hai lagoon system (335 tons year−1), followed by plastic retained on land (112 tons year−1, 2.8%) and finally by incinerated plastic waste, approximately 12 tons year−1 (0.3%).
4. Discussion
On average, each person in the wards/communes of the Tam Giang–Cau Hai lagoon system emits about 41 g/person/day. The emission volume in the study area is lower than the average of Vietnam (63 g/person/day) [
22]. The amount of waste leakage in the study area is 335 tons year
−1, accounting for 8.9% of the total amount of generated plastic. This rate is aligned with the results of research on waste leakage into hydrological systems in Ho Chi Minh City (11.3%), Da Nang (8.3%), Quang Ninh (8.9%) and Rach Gia (13%) [
12].
The leakage of plastic waste in the area alongside Tam Giang lagoon was quite high, accounting for approximately 12% of the generated amount. The amount of plastic waste leakage was mainly from uncollected sources. According to the survey’s results, some households in the neighborhood often disposed of waste directly into the environment. The lack of designated garbage collection points for households, situated at a distance from residential areas, is the underlying cause of this situation. Another factor causing the leakage of plastic waste into the Tam Giang–Cau Hai lagoon system is that most of the wards/communes do not have suitable rainwater drainage systems which can retain the waste instead of letting it be disposed of directly into the environment. The results of the field survey show that plastic waste which is not collected in the area alongside the Tam Giang–Cau Hai lagoon system, under the impact of water overflow, will enter the water system. Moreover, several households still have the habit of incinerating plastic waste such as old tarpaulins and broken fishing nets as an easy way to handle plastic waste. This would potentially cause air pollution because of emitted odors and toxic gases (CO2, dioxin, furan, SO2, etc.).
The means of collection is also one of the factors leading to the leakage of plastic waste in this area. The absence of container lids on storage containers exposes them to the environment, increasing the risk of waste leakage from these containers into the soil and water bodies due to the influence of natural elements such as wind, rainwater, flood or storms. Moreover, plastic waste is collected using various vehicles and frequently deposited on the ground temporarily before being transferred to the next transport. In several areas surrounding Tam Giang–Cau Hai lagoon, the capacity of these containers is not sufficient for the quantity of waste, leading to dumping of waste around the collection container. These wastes are spread approximately 1–2 m from the water’s edge. Throughout this process, the impact of natural elements can result in the potential leakage of waste into the soil and water systems.
In addition, plastic waste in the study area is collected and transported to the landfill by garbage trucks; while moving, this type of vehicle is only covered with canvas, from which plastic waste might spill out when the wind blows strongly. Furthermore, overloaded garbage trucks can also result in the leakage of plastic waste from the transport vehicle.
The analysis composition of plastic waste reveals that single-use plastic products are the biggest source of solid waste leakage, both in quantity and amount. Therefore, the management, reduction, reuse and recycling of plastic waste, especially single-use plastics, are considered one of the key issues that need to be addressed.
Thus, campaigns and good practices of environmental protection as a whole and reduction of plastic waste in particular have recently been promoted, making Thua Thien Hue province a benchmark nationwide in terms of solid waste minimization.
5. Conclusions
Plastic waste has continued to increase, exerting pressure on many sectors such as tourism, maritime transportation, aquaculture and daily activities. Multiple models have been formulated to estimate the leakage of plastic waste, all of which include the waste flow diagram. This method has enabled authorities to evaluate the amount and composition of solid waste that is generated, collected, recovered and disposed of at landfills. It is then used to estimate the annual leakage of plastic waste in the water bodies system.
The outcomes of the investigation revealed a total of 11 sources from which plastic waste is released into the Tam Giang–Cau Hai lagoon system, with primary contributors being households, markets and restaurants. Furthermore, inadequate waste collection and waste treatment habits of several households result in the leakage of plastic waste into the land and the water body system. The extent of plastic waste leakage is notably high, constituting 12% of the overall generated plastic waste.
In light of these findings, it is recommended that campaigns aimed at enhancing awareness about proper household waste management and the enhancement of waste collection systems should be significantly expanded to reduce leakage and address plastic pollution in the Tam Giang–Cau Hai lagoon system in particular and water body systems in general.
Author Contributions
All authors contributed to the research extensively. All team members were engaged with different parts of the research and manuscript. Conceptualization, N.B.G., T.N.T. and H.C.T.; methodology, N.B.G., T.N.T., H.C.T., D.T.C. and L.C.T.; software, D.T.C., T.N.K.N. and N.H.B.; validation, D.T.C., T.N.K.N. and N.H.B.; investigation, D.T.C., T.N.K.N., N.H.B., D.T.N., L.C.T. and T.M.S.; data curation, D.T.C. and T.N.K.N.; writing—original draft preparation, T.N.K.N., N.H.B., D.T.N., L.C.T. and T.M.S.; writing—review and editing, N.B.G., T.N.T., H.C.T. and N.T.B.K.; visualization, T.N.K.N. and N.H.B.; supervision, T.N.T. and H.C.T.; project administration, H.C.T.; funding acquisition, H.C.T. All authors have read and agreed to the published version of the manuscript.
Funding
This research was funded by the Plastic Smart City–Hue TVA project (WWF-Vietnam).
Data Availability Statement
Not applicable.
Acknowledgments
The authors acknowledge the Plastic Smart City–Hue TVA project (WWF-Vietnam) for financial support. The authors also acknowledge the partial support of Hue University under the Core Research Program, Grant No. NCM.DHH.2020.03.
Conflicts of Interest
The authors declare no conflict of interest.
References
- Irdanto, S.L.; Davide, T.; Dario, C.; Paola, F.A.; Jorge, C.; Martijn, R.; Marvin, K.; Kim, R.; Kevin, M.V.G.; Jo, D.; et al. How much can chemical recycling contribute to plastic waste recycling in Europe? An assessment using material flow analysis modeling. Resour. Conserv. Recycl. 2023, 192, 106916. [Google Scholar] [CrossRef]
- Franco-Trecu, V.; Drago, M.; Katz, H.; Machín, E.; Marín, Y. With the noose around the neck: Marine debris entangling otariid species. Environ. Pollut. 2017, 220, 985–989. [Google Scholar] [CrossRef] [PubMed]
- Hermabessiere, L.; Dehaut, A.; Paul-pont, I.; Lacroix, C.; Jezequel, R.; Soudant, P.; Du, G. Occurrence and effects of plastic additives on marine environments and organisms: A review. Chemosphere 2017, 182, 781–793. [Google Scholar] [CrossRef] [PubMed]
- Issac, M.N.; Kandasubramanian, B. Effect of microplastics in water and aquatic systems. Environ. Sci. Pollut. Res. 2021, 28, 19544–19562. [Google Scholar] [CrossRef]
- Ministry of Natural Resources and Environment. Proposal No. 97/TTr-BTNMT Dated December 25, 2019 Approving the Project on Strengthening Plastic Waste Management in Vietnam; Ministry of Natural Resources and Environment: Bangkok, Thailand, 2019. [Google Scholar]
- Department of Natural Resources and Environment of Thua Thien Hue. Comprehensive Report: Monitoring of the Environment and Biodiversity in the Tam Giang-Cau Hai Wetland Protected Area, Thua Thien Hue Province; Project “Conservation of Critical Wetland Protected Areas and Linked Landscapes” (UNDP–GEF); Department of Natural Resources and Environment of Thua Thien Hue: Hue, Vietnam, 2020; p. 196. [Google Scholar]
- Trang, C.T.T.; Luu, V.T.; Cu, N.H. The Quality of Water in the Tam Gian—Cau Hai Lagoon System System; Report for the Workshop on Environment of the Coastal Central Vietnam: Thua Thien Hue, Vietnam, 2009. [Google Scholar]
- IMOLA Project. Integrated Management of Lagoon Activities in Tam Giang Cau Hai Lagoon System (Thua Thien Hue Province); Final Report; FAO: Rome, Italy, 2008. [Google Scholar]
- Cao, T.T.T.; Tran, D.T.; Le, X.S. Assessment of pollution load into Tam Giang—Cau Hai lagoon and a prediction to 2020. Vietnam J. Mar. Sci. Technol. 2013, 13, 276–283. [Google Scholar] [CrossRef]
- Yusuf, M.; Susanto, B.; Manurung, D.D. Plastic Waste Pollution and Its Impact on the Environment: A case study in Gili Trawangan, Indonesia. IOP Conf. Ser. Earth Environ. Sci. 2018, 138, 012025. [Google Scholar]
- Schmidt, C.; Krauth, T.; Wagner, S. Export of plastic debris by rivers into the sea. Environ. Sci. Technol. 2017, 51, 12246–12253. [Google Scholar] [CrossRef] [PubMed]
- Tran, T.H. Research and survey the status of plastic waste in Vietnam. In Report of the WWF Organization 2020; (In Vietnamese)
- Nguyen, V.T.; Ho, B.L. Assessing the status of using plastic products and proposing measures to manage plastic waste in Thu Dau Mot city, Binh Duong. Sci. J. Thu Dau Mot Univ. 2022, 57, 2. (In Vietnamese) [Google Scholar]
- Tin, H.C.; Pho, M.V.; Phap, T.T. The current situation of mangroves at Tam Giang-Cau Hai coastal lagoon, Thua Thien Hue province. J. Res. Dev. 2010, 1, 88–94. [Google Scholar]
- Tin, H.C.; Phap, T.T.; Tuan, N.Q.; Son, T.P.H. Application of Remote Sensing and Geographical Information System (GIS) techniques in assessing the existing situation of seagrass meadow at coastal wetland in Huong Phong commune, Huong Tra district, Thua Thien Hue province. J. Sci. 2011, 65, 231–239. [Google Scholar]
- Binh, N.Q.V. Management of Fishery Resources in Tam Giang Lagoon; Thuan Hoa Publication: Hue, Vietnam, 2006. [Google Scholar]
- Center for Monitoring Natural Resources and Environment of Thua Thien Hue Province. Summary Report on Environmental Monitoring Results in Thua Thien Hue Province in 2020; Center for Monitoring Natural Resources and Environment of Thua Thien Hue Province: Hue, Vietnam, 2020. [Google Scholar]
- Department of Natural Resources and Environment of Thua Thien Hue. Report on the Collection and Treatment of Solid Waste in the Province of Thua Thien Hue; Report No. 88 /BC-STNMT-MT, 26 June 2019; Department of Natural Resources and Environment of Thua Thien Hue: Hue, Vietnam, 2019. [Google Scholar]
- UN-Habitat. Waste Wise Cities Tool, Step by Step Guide to Assess a City’s Municipal Solid Waste Management Performance through SDG Indicator 11.6.1 Monitoring; UN-Habitat: Nairobi, Kenya, 2020. [Google Scholar]
- Thua Thien Hue DONRE. Official Letter No. 1418 on Evaluation of Solid Waste Management in Thua Thien Hue Province; Thua Thien Hue DONRE: Hue, Vietnam, 2020. [Google Scholar]
- Velis, C.A.; Cottom, J.; Zabaleta, I.; Zurbruegg, C.; Stretz, J.; Blume, S. GIZ, University of Leeds, Eawag-Sandec, Wasteaware. In User Manual: Waste Flow Diagram (WFD): A Rapid Assessment Tool for Mapping Waste Flows and Quantifying Plastic Leakage; Version 1.0. February 2020; Eschborn, Germany; 2020; Available online: http://plasticpollution.leeds.ac.uk (accessed on 14 April 2022).
- IUCN. National Guidance for Plastic Pollution Hotspotting and Shaping Action; Final Report for Vietnam; IUCN: Gland, Switzerland, 2020. [Google Scholar]
| Disclaimer/Publisher’s Note: The statements, opinions and data contained in all publications are solely those of the individual author(s) and contributor(s) and not of MDPI and/or the editor(s). MDPI and/or the editor(s) disclaim responsibility for any injury to people or property resulting from any ideas, methods, instructions or products referred to in the content. |
© 2023 by the authors. Licensee MDPI, Basel, Switzerland. This article is an open access article distributed under the terms and conditions of the Creative Commons Attribution (CC BY) license (https://creativecommons.org/licenses/by/4.0/).


 ,
, 


