Abstract
The growing integration of tourist areas and complexes increases the demand for electrical power systems. This increased demand may represent a vulnerability to voltage and frequency stability in electrical grids, where these parameters are essential for an optimal and continuous supply of electrical energy. The Dominican Republic has begun a tourist expansion process in areas that were previously not commercially exploited. Based on the factors mentioned above, this article’s objective was to analyze the impact caused by the increase in electricity demand due to the tourism sector, using the Enriquillo Region of the Dominican Republic as a case study. The impacts of this expansion on the voltage profiles and the system’s frequency were determined. The methodology consisted of obtaining information on the mathematical model of the system to evaluate the expansion plan for the study period and the projection of the demand of the grid. The complete system was modeled with this information, including expansion and possible renewable generators. Finally, the flow of charges was measured, and dynamic analysis was carried out. The quasi-dynamic and RMS/EMT simulations were carried out in the DIgSILENT software for this investigation. The results showed that the electrical system benefits stability and national standards. This is because the transmission lines reduced their loading by approximately 2.99% in 2032. As the years of study passed and the system load increased, the voltage in the bars of the 138 kV systems and generators did not exceed the range of ±5% established in the technical regulations of the Dominican electricity market.
1. Introduction
Today, the demand for electrical energy is seeing drastic increases [1]. Electricity is the heart of modern societies and economies, so its evolution brings with it the growth of power systems. Communities are expected to continue to increase their demand for electricity thanks to rising household incomes and the growing order and purchase of electrical devices with various applications, such as electric vehicles becoming more prevalent in homes and workplaces [2]. This situation forces electrical power systems to work to their limits and calls for reliable, stable, and quality systems that meet society’s current and future demands. The electrical power systems provide consumers with the necessary electrical energy at the highest possible quality standards. For this reason, the stability of electrical power systems is critical [3,4].
Most tourism-related activities directly or indirectly require energy from fossil fuels or electricity, typically transformed from gas, coal, and petroleum [5]. The tourism industry typically involves high demands on energy use, living standards, and the environment. Moreover, population density and energy demand might shift significantly with the seasons [6]. While examining the impact of the energy systems of islands, tourism should be considered.
The number of rooms, usage patterns of visitors, building type and style, and maintenance of outside temperature are only a few variables that affect how much energy is needed in the tourism zone [7]. Several tourist destinations are found in distant locales that are far from the national electricity grids.
Globally, tourism is one of the sectors that contribute the most to the economies of many countries. According to [8], the tourism sector directly and indirectly contributes 270 million jobs and contributes more than USD 4.5 billion to the world’s gross domestic product—a number given in 2020 by the World Travel and Tourism Council. In North, Central, and South America, 69.70 million tourist arrivals were registered for this year—an amount affected by the current global situation regarding SARS-CoV-2. In 2019, there were 219.30 million tourist arrivals [9]. This puts into perspective the relevance of the tourism sector in the Americas, through which nations’ interest in promoting this sector can be understood and developed.
In the Dominican Republic, one of the sectors contributing the most to the national economy is tourism. According to the indicators presented by the Central Bank of the Dominican Republic [10], for 2019, the income was USD 7468.10, and the number of hotel rooms was 83,041.00, reflecting an increase of 21% in the number of available rooms and a 79% increase in economic income due to tourism compared to 2010.
The tourism industry has seasonal variations (summer and winter) in energy consumption, affecting the demand on the electrical grid [11]. The growth in demand due to the increase in the tourism sector in different countries causes the electrical distribution grid to work at or very close to its maximum capacity, producing power and energy losses in the system [12]. Similarly, it compromises the grid’s stability, reducing its security and reliability.
Due to the economic importance of tourism and the close relationship that exists with the increase in electricity demand in countries [13], there is a growing need to analyze and project the medium- and long-term electricity demand in tourist areas [14], so as to be able to create more flexible electrical systems and ensure the technical capabilities to maintain the technical requirements for the generation, transmission, and distribution of the electricity grid.
Therefore, the study and planning of demand, voltage, and frequency stability is an important task to see the impact of tourist areas on the power grid. The voltage stability in a power supply is essential. The operating environment and load on the electrical grid are constantly changing. In order to improve the planning, design, operation, and economic aspects of the electric power grid, dynamic stability analysis is one of the most critical and practical approaches [15].
Following the development of global tourism, studies have attempted to analyze the stability of electric power systems—specifically, by applying frequency and voltage stability in areas where tourism is expected to expand.
Considering the above, this article aims to present a methodology for analyzing the impact caused by the increase in electricity demand due to the tourism sector. The Enriquillo Region, located in the southwestern Dominican Republic, was used as a case study.
The main contributions of this paper in this field of research are as follows:
- Evaluating the impact produced by the increase in electrical demand in the transmission lines on the frequency stability and system voltage, which impacts the quality of the energy service provided.
- Presenting some differences between the North American Reliability Corporation (NERC)’s primary international frequency regulations and the regulations applied in the Dominican Republic to maintain frequency stability.
- A methodological study with load profiles of areas used to evaluate the long-term impact of the power capacity by applying quasi-dynamic and RMS/EMT simulations using DIgSILENT software.
This article presents the methodology in Section 2. The topics concerning stability in the electrical grid are presented in Section 3. We then continue with the description of the case study in Section 4. Section 5 presents the results and discussion. Finally, Section 6 presents the conclusions and perspectives for future work.
2. Methodology
This article presents a methodology to evaluate tourism’s impact on electrical systems, grid expansion, and the demand increase in the case study area. The impact of this expansion on the voltage profiles and the system’s frequency is determined. The methodology consists of obtaining information on the mathematical model of the system to evaluate the expansion plan for the study period and the projection of the demand on the grid. With this information, the complete system is modeled, including expansion and possible renewable generators to consider. Finally, the flow of charges is measured, and dynamic analysis is carried out.
First, the necessary technical information was collected, which was obtained from the Dominican Electric Transmission Company (ETED), the electric power distribution company Edesur, and the National Energy Commission (CNE). The technical information on the generation technologies, transmission lines, and users connected to the grid was obtained from ETED and Edesur. This information was used to define the characteristic load profiles of the southern and hotel zones, while the data obtained from the CNE disclosed the system’s trends.
The simulation defined two power demand profiles: The first profile was that of the southern zone. All measurement points were considered and used for the coordinate organism (OC-SENI) to establish present and future data. The second profile was that of the tourist areas and complexes, which served as a reference to simulate the behavior of the tourist sector. For the current load profiles, the electrical energy consumption obtained from the measurement points of the selected areas was used, estimating the average hours of all of the days of the month to determine the average behavior for a year. For future demand profiles, data on demand growth were used in the scenario forecast by the CNE until 2032.
Quasi-dynamic and RMS/EMT simulations were then performed in DIgSILENT. Quasi-dynamic simulation works well for planning studies where long-term load and generation profiles are established, and where grid evolution is modeled using variations and expansion stages [16]. The quasi-dynamic simulations were used to model the system’s development during the analysis period, measuring variables such as line currents; line load; solar, wind, hydro, and conventional energy generation; and active, reactive, and apparent power in lines [17]. Regarding the RMS/EMT simulations, they were used to observe the system’s behavior in the following situations: output of a generator with the capacity to activate the load shedding system, and input of the most significant load in a bus of the system. The bus bars’ electrical frequency and voltage behavior were measured to validate whether they were within the stability margins. Finally, the results were analyzed, describing the behaviors in the simulations, and their relevance was verified in terms of the adverse effects that they could produce on the electrical power system. Figure 1 shows the methodology used for the study.
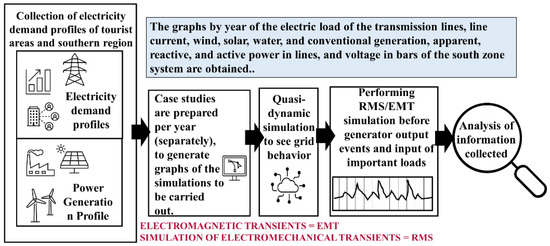
Figure 1.
Methodology used.
3. Stability in Electrical Grids
Global electricity demand is expected to increase by more than 50% by 2030, according to the International Energy Agency [3]. Power systems must meet the voltage and frequency stability requirements to allow a level of reliability [18], but this is affected by the increase in demand caused by the rise in population, services, and tourist demand [19].
Grid stability should be maintained during normal and abnormal operations while minimizing system costs (both operating and long-term investment costs). This is why analysis and stability tools are used to understand how system behavior would be based on demand trends and, thus, to be able to propose solutions to possible system restrictions and operations. Some of the simulation tools that can be used for stability studies include GridLAB-D [20], PSS/E [21], OpenDSS [22], Siemens PTI PSS [23], and DIgSILENT PowerFactory [24].
Some studies that have analyzed how to maintain the stability of power systems using voltage and frequency variables as indicators of energy service quality are shown in Table 1.

Table 1.
Studies of voltage and frequency stability in electrical power systems.
Due to the increase in demand, electrical distribution grids are forced to operate at or near maximum capacity, which causes power and energy losses in the system, affecting the grid’s stability and reducing its security and reliability [12].
Voltage stability refers to the ability of a system to maintain steady-state voltage while balancing active power. Table 2 presents the different types of voltage stability analysis and their interest times for analysis.

Table 2.
Types of voltage stability analysis and their time responses.
Frequency stability refers to the ability of the system to maintain the balance of active power between generation and demand, and its objective is to keep the system frequency at its nominal value. Frequency stability may be required in transient instability and small disturbances. Table 3 shows the advantages and applications of some of the methods used for frequency stability.

Table 3.
Methods of frequency stability.
The NERC [36] presented a voltage stability control policy addressing voltage and frequency stability regulations.
4. Case Study
The Enriquillo Region is in the southwestern area of the Dominican Republic, formed by the provinces of Barahona, Pedernales, Independencia, and Bahoruco. The area occupied by these four provinces is 6961.43 km2. The Enriquillo Region has five wind generation plants in two of its four areas: Barahona and Pedernales. Barahona has three plants, with a total installed capacity of 149.80 MW. At the same time, Pedernales has two plants, with a total installed capacity of 33.45 MW. Additionally, Barahona has a photovoltaic generation plant with an installed capacity of 25 MW, a thermal generation plant with an installed capacity of 51.80 MW, and a hydroelectric generation plant with an installed capacity of 7.50 MW (see Figure 2).
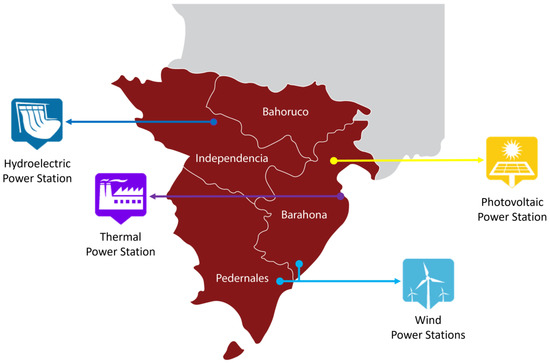
Figure 2.
Location of the Enriquillo Region, Dominican Republic. Source: https://www.mapas.cne.gob.do/ (Accessed on 15 February 2023).
Table 4 presents the provinces, the type of generation, the capacity, and the year of implementation of the power plants that are part of the Enriquillo Region.

Table 4.
Generation plants in the Enriquillo Region.
The bus bar measurements of the electrical power flow of the southern zone are presented in Figure 3. In addition to considering the measurement points mentioned above, the measurement points of the tourist areas located in the eastern and northern parts of the country were considered as a reference for the impact on electricity demand caused by tourist areas, such as Guavaberry, Juan Dolio, Sosua, Cabarete, and Las Americas Airport.
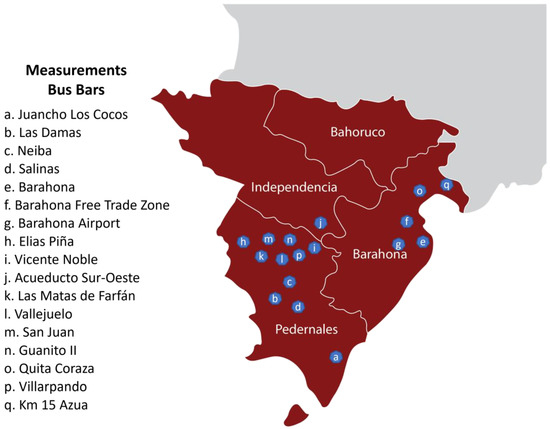
Figure 3.
Points of measurement of power flow and electricity demand in the southern part of the country.
Figure 4 shows the grid configuration in the simulated southern zone [17].
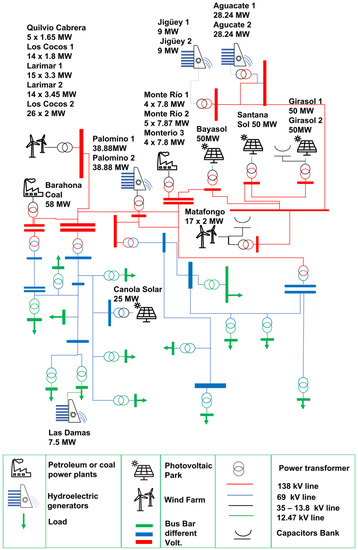
Figure 4.
Grid section of the southern zone.
Figure 5 shows the average monthly demand registered in the southern zone for 2020, while Figure 6 shows the generation curves by source for the same area and year. Figure 6 shows the system’s time demand; this peak is presented from the 20th hour. In contrast, photovoltaic solar generation presents its generation peak at 12–14 h. This difference is a challenge for the electrical system that could limit renewable generation. These data were essential for the simulation and scenarios presented in the Section 5.
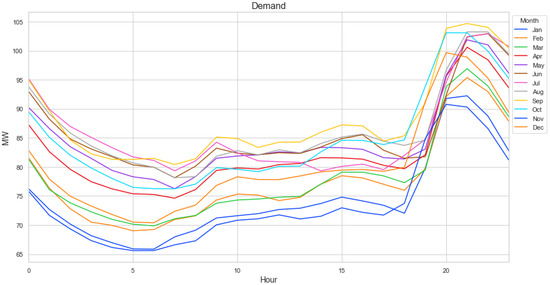
Figure 5.
Average monthly demand in the southern zone.
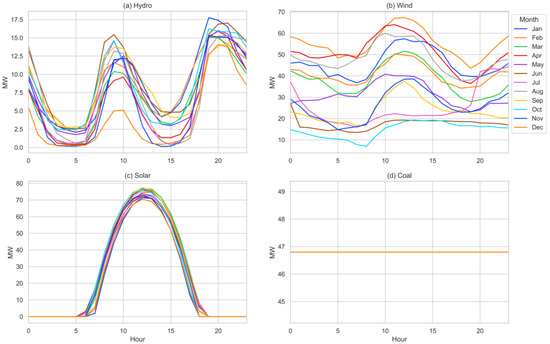
Figure 6.
Generation curves by source: (a) hydro; (b) wind; (c) solar photovoltaic; (d) coal power plant.
Figure 7 presents the monthly generation curves for the year 2021 for technologies in the southern zone. For coal generation, the generation of electrical energy was constantly maintained; there were no ungathered outputs during the period observed. Wind generation in winter (from December until February) is where the most significant production was obtained. Photovoltaic solar generation remained constant, with variations in spring and in the summer presenting an increase in availability. Hydroelectric generation remained constant, experiencing decreases due to hydraulic resource management in winter due to a decrease in rainfall in the winter period. To maximize the value of the water, the hydro plant increases power generation during peak hours (18–23).
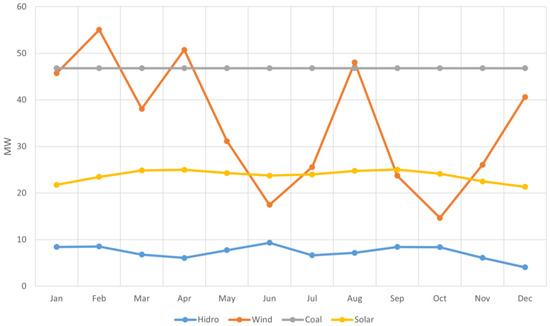
Figure 7.
Monthly generation curves in the year 2021 for technologies in the southern zone.
The regulations for the primary frequency regulation are explained in Regulation of Law No. 125-01 [37]. Table 5 shows a comparison of international frequency stability standards with those of the Dominican Republic:

Table 5.
Comparison of regulations on frequency stability.
In resolution SI-060-2015-MEM, CC4.1.1 [38], it is explained that the regulation of voltages in 69 kV, 138 kV, or greater bus bars and generators must remain within the range of ±5%.
The power demand data per province are determined as the average of the maximum, average, and minimal demand in the daily dispatch program (PDD) [39]. The average power demand in the Enriquillo region in 2019 for the following provinces was Barahona 30.49 MW, Pedernales 1.97 MW, and Bahoruco 10.03 MW. The average power demand is from 11 a.m.–2 p.m., because in this area there are many solar photovoltaic components, and the grid is stressed more since the low demand is also affected by homes that install photovoltaic systems, which impacts the power demand.
According to [40], this area will have an annual growth of 3.41% in demand for electricity from 2021 to 2032. The analysis of the long-term demand for 2021 to 2024 was based on a single demand scenario with the annual energy projection obtained from the historical data of the actual demand supplied and forecast models based on the Box–Jenkins method. The Box–Jenkins method creates an autoregressive integrated moving average model and makes seasonal and trend adjustments [41] using the following function (Equation (1)):
where
= the present stationary observation.
, …, , , … the past observations and forecasting error for the stationary time series.
= the present forecasting error.
In the expansion plan of the electric transmission system for 2021–2035 [26], it is explained that there will be a proliferation of non-conventional renewable energies in the electric power system without a specific insertion plan. This proliferation of non-conventional renewable energies causes much uncertainty about the definition of the optimal growth of the transmission grid. Due to the uncertainty caused, various scenarios in the areas most likely to carry out projects with more significant renewable potential were analyzed, along with the development of thermal generation projects near ports. This projection of power generation is why the country’s future demand from 2017 to 2030 presents two possible scenarios:
Low growth: This scenario is based on the trend of the demand for electrical energy, which presents an average annual increase of 3.41%.
High growth: This alternative possibility considers a higher growth of the economic development of the country and a decrease in the energy not supplied, which presents a supply level of 100% by 2028.
Figure 8 presents the growth of demand considering a high-projection tourist area, while Figure 9 presents the growth of demand considering low demand growth in tourist areas. Both scenarios consider projections from other tourist sectors in the Dominican Republic. In both figures, a decrease in demand can be observed when the winter season begins. In addition, the cement plant executes its maintenance plan at the end of the year, reducing its electrical demand.
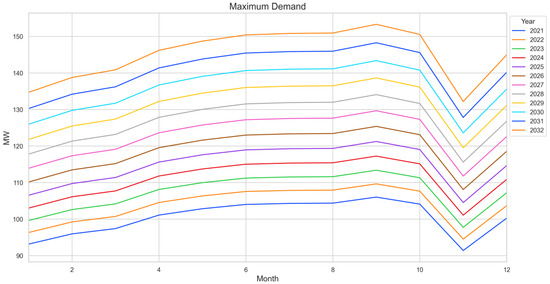
Figure 8.
Growth of demand considering a high-projection future from 2017 to 2030.
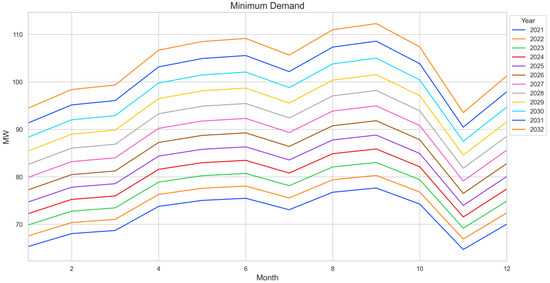
Figure 9.
Growth of demand considering a low-projection future from 2017 to 2030.
5. Results and Discussion
In the Quasi-dynamic simulations, the following behaviors were identified:
Transmission lines reduced their load capacity by approximately 2.99%, which can be extrapolated to all of the regional lines. The evolution of the transmission line with the highest average load in the analysis period can be seen in Table 6. The southern region of SENI is purely an exporter of electrical energy. As mentioned, the lines connecting this area with the plant carry much power, especially when there is a good amount of Sun. With the increased local demand, the lines reduce their load level in this area. Generation is consumed locally; this behavior contributes to a longer useful life of the lines, alleviates grid congestion, allows for lower operating costs, improves grid reliability in the event of breakdowns or maintenance on adjacent lines, and reduces losses [30]. For this calculation, the security criterion was also taken (N-1).

Table 6.
Transmission line evolution with a higher average load.
Table 7 shows that the highest- and lowest-voltage bus bars reduce their levels to more central values in the range that the regulations allow. Adjustment of the voltages above the acceptable range towards the safe area is achieved 10 years after the start of the study (2030).

Table 7.
Evolution in bus bars of lower and higher average stress.
The RSM/EMT simulations were performed assuming a failure at the AES Andres power plant, which supplies 300 MW to the electrical grid through two plants of 196.80 MW and 121.32 MW, representing 10% of the demand of the electrical system [27]; 300 MW represents approximately 10% of SENI’s demand. Figure 10 shows the only demand from the southern zone, and compares the system’s responses in 2021 and 2032—the years with the greatest and least impact, respectively.
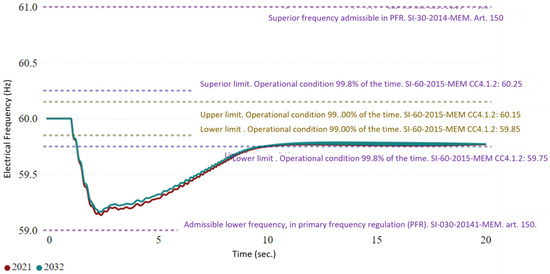
Figure 10.
Electric frequency comparison slack bus between the years 2021 and 2032.
The simulation was carried out in a period of 20 s where, at the first second of starting, the electricity generator failed; the behavior of the system frequency can be visualized in the established period; this process was carried out for each year from 2021 to 2032.
Similarly, it can be seen that the frequency of the system reaches lower values in 2021 before the output of the power plant, reaching values of 59,135 Hz, while in 2032 minimum values of 59.165 Hz are reached, which represents an average difference of 0.0233% during the analysis period. After 3 s of analysis, primary regulation by raising the frequency to 59.768 for 2021 and 59.165 for 2032 presented a faster response in the latter. It should be noted that the frequency did not reach nominal values due to the lack of modeling of the secondary regulation, because it could not be observed in a 20 s time window but in minutes; this is an area that can be expanded in future research.
It is worth mentioning that the results obtained are shown to be outside the acceptable frequency ranges in the system operating conditions scenario, and that in the event of transients or faults that affect frequency stability, the primary regulation must come into play within 30 s of the event occurring, without leaving the established limits; this condition was fulfilled in the established analysis. These operating conditions show that even if a significant generator trips, the frequency can fluctuate and recover according to established regulations.
In the RSM/EMT simulations, the behavior of the electrical system in the region was analyzed in the face of the unexpected entry of a large load in the Pedernales area, which has the highest average annual demand for electricity. Figure 11 compares voltages in the system when a large power demand load enters during the analysis period. Currently, the southern zone is characterized by having a proven grid, with low demand and surplus generation. This causes the voltage to remain high in several areas of the southern zone, e.g., Substation Los Cocos and Barahona. With the increase in demand by 2031, voltage is normalized.
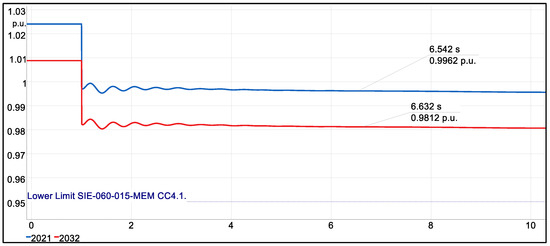
Figure 11.
Comparison of voltages in the system when a large load enters between 2021 and 2032.
The voltage in the treated bus bar is above the upper limit of the norm, i.e., 1.05 p.u., while in 2032 it is within the allowed range. In both scenarios, the voltages in the bus bars oscillate before the entry of the most critical load in the Pedernales bus bar, tending to show more noticeable and more significant fluctuations in 2021, while in 2032 there are more damped oscillations (see Figure 12).
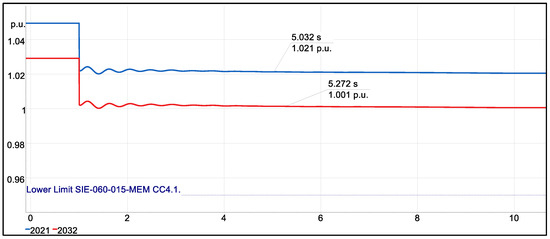
Figure 12.
Comparison of voltage in the Pedernales bus bar before the entry of a large load.
Figure 13 shows a behavior similar to that in the bus bar. In both 2021 and 2032, it is observed that both voltages are identified above the allowed limits before the event. When the input event occurs, the voltage in 2021 remains outside the range. In 2032, this behavior does not take place, implying that the introduced load is crucial in maintaining the voltage within the range established by the norm. In both cases, the same thing happens as in the previous point—oscillations occur that are later corrected, with the one in 2021 being more pronounced.
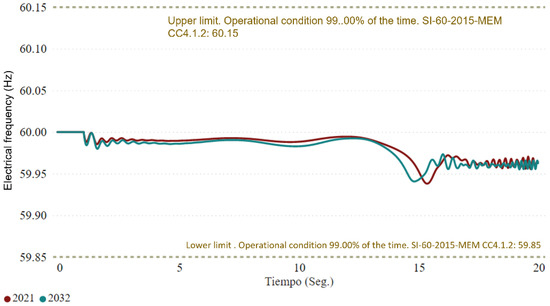
Figure 13.
Frequency comparison in the system—load input in Pedernales, 2021 and 2032.
In the same way, an apparent variation in the electrical frequency is identified upon introducing the load in the Pedernales bus bar. For 2021 and 2032, oscillations are observed in the system. The apparent difference is that in 2021, there is a more pronounced disturbance in the frequency compared to 2032. It can also be observed that the frequency regulation starts working faster in 2032, i.e., 15 s after the event. In both cases, the frequency remains within the standard range, so this event does not compromise the electrical system.
6. Conclusions and Future Works
The stability control of interconnected national electrical systems at the voltage and frequency levels is a common problem that can be evaluated depending on the power system’s complexity. The electrical demand that the tourist infrastructure can produce due to the growth of this sector in different regions of any country can affect the stability parameters of the power system, which can reduce the quality of energy service.
With the acquisition of data from the case study, it was possible to compare and evaluate the behavior of the current and projected energy demand due to growth according to the trend scenario of the electric power transmission company. It was also possible to simulate the necessary scenarios to conduct a technical analysis to reveal the system’s behavior in the face of certain events.
In the simulation of a significant load connection event, the system maintained the voltage within the limits established by regulations, with a minimum value of 0.98 p.u. In the case of the simulation output of a large generator, the system’s frequency remained above 59.90 Hz throughout the simulated period. The results of the simulations affirm that within the study time, the current system has sufficient capacity for the addition of electrical demand from the tourist facilities that are to be incorporated in the southern part of the country as part of a new tourism strategy that is to be developed. In addition, there is no need to implement techniques and/or methods for controlling voltage and frequency in the grid. With the quasi-dynamic simulations, it was possible to demonstrate that, as the years go by with the estimated growth, several parameters manage to change states from out of range to within range. The RMS/EMT simulations verified that in the face of events such as the output of a critical generator or the entry of a large load, the system does not present complications that put its continuous operation at risk.
One limitation of this methodology is not having adequate information about the grid model, the expansion of transmission lines, and the electric power generation system’s features. This is crucial information that impacts the outcomes of the investigation.
For future work, conducting a stability study considering the intermittence of the connected renewable energies is recommended, to see how this affects the system’s stability. In addition, scenarios should be implemented where unscheduled outputs of the generation plants are considered to observe the voltage and frequency profiles of the bus bars. Finally, a secondary regulation system should be implemented during the simulation of the generation profiles in the system.
The methodology used here can be applied to other electrical systems. It is necessary to have the model of the system to be analyzed, the expansion plan for transmission lines and electricity generation, and the demand forecast for the cases to be analyzed.
Author Contributions
Conceptualization, methodology, writing—review and editing, supervision: M.A.-M.; investigation, writing—original draft, software, formal analysis: R.A., A.C.-S., C.M. and W.-J.N.-G.; software, validation, formal analysis, supervision: E.A.J.M.; writing—review and editing: G.S.-Z., D.M.-H. and M.A.-M. All authors have read and agreed to the published version of the manuscript.
Funding
This research received no external funding.
Data Availability Statement
Data sharing not applicable.
Acknowledgments
We wish to thank the electricity generation company Haina (Egehaina) for information and support during the simulations using the DIgSILENT software, the Dominican Edesur Energy Distribution Company for the technical data on the demand for its circuits in the southern zone, and the Dominican Electrical Transmission Company (ETED) and the Energy Control Center (CCE) for the information on electric power flows and data on the transmission lines in the southern part of the country.
Conflicts of Interest
The authors declare no conflict of interest.
References
- Li, X.; Ge, Y.Y.; Mao, X.; Xue, W.; Xu, N. Improved Energy Structure Prediction Model Based on Energy Demand Forecast. In Proceedings of the 2018 2nd IEEE conference on energy internet and energy system integration (EI2), Beijing, China, 20–22 October 2018; pp. 1–5. [Google Scholar] [CrossRef]
- Patil, S.; Deshmukh, S.R. Development of control strategy to demonstrate load priority system for demand response program. In Proceedings of the 2019 5th IEEE International WIE Conference on Electrical and Computer Engineering, Bengaluru, India, 15–16 November 2019; pp. 1–6. [Google Scholar] [CrossRef]
- IEA World Energy Outlook. 2020. Available online: https://www.iea.blob.core.windows.net/assets/a72d8abf-de08-4385-8711-b8a062d6124a/WEO2020.pdf (accessed on 19 February 2023).
- Patel, T.; Parmar, M. (Special Issue for ITECE 2016) Power System Stability and Control. Int. J. Adv. Res. Eng. Sci. Technol. 2017, 3, 5. Available online: https://ijarest.com/index.php/ijarest/article/view/2019 (accessed on 1 February 2023).
- Meo, M.S.; Chowdhury, M.A.F.; Shaikh, G.M.; Ali, M.; Masood Sheikh, S. Asymmetric impact of oil prices, exchange rate, and inflation on tourism demand in Pakistan: New evidence from nonlinear ARDL. Asia Pacific J. Tour. Res. 2018, 23, 408–422. [Google Scholar] [CrossRef]
- Liu, Y.; Yu, S.; Zhu, Y.; Wang, D.; Liu, J. Modeling, planning, application and management of energy systems for isolated areas: A review. Renew. Sustain. Energy Rev. 2018, 82, 460–470. [Google Scholar] [CrossRef]
- Suanpang, P.; Jamjuntr, P.; Jermsittiparsert, K.; Kaewyong, P. Autonomous Energy Management by Applying Deep Q-Learning to Enhance Sustainability in Smart Tourism Cities. Energies 2022, 15, 1906. [Google Scholar] [CrossRef]
- Orús, A. El Turismo en el Mundo—Datos Estadísticos|Statista. Available online: https://es.statista.com/temas/3612/el-turismo-en-el-mundo/#:~:text=En%202021%2C%20seg%C3%BAn%20datos%20de,inicio%20de%20la%20pandemia%20de (accessed on 10 October 2021).
- Statista Llegadas de Turistas Internacionales a América 1990–2020|Statista. Available online: https://es.statista.com/estadisticas/632568/llegadas-de-turistas-internacionales-a-america/ (accessed on 10 October 2021).
- Banco Central de la República Dominicana Estadísticas Sector Turismo. Available online: https://www.bancentral.gov.do/a/d/2537-sector-turismo (accessed on 30 December 2022).
- Thomas, D.; Deblecker, O.; Ioakimidis, C.S. Optimal design and techno-economic analysis of an autonomous small isolated microgrid aiming at high RES penetration. Energy 2016, 116, 364–379. [Google Scholar] [CrossRef]
- Jorge Eduardo Játiva Sierra. Impacto de la generación distribuida en la estabilidad del voltaje en los sistemas de distribución, Universidad Politécnica Salesiana Sede Quito. 2020. Available online: http://dspace.ups.edu.ec/handle/123456789/19169, (accessed on 10 October 2021).
- Stefánsson, Þ.; Sæþórsdóttir, A.D.; Hall, C.M. When tourists meet transmission lines: The effects of electric transmission lines on tourism in Iceland. Energy Res. Soc. Sci. 2017, 34, 82–92. [Google Scholar] [CrossRef]
- Zhang, D.; Li, H.; Zhu, H.; Zhang, H.; Goh, H.H.; Wong, M.C.; Wu, T. Impact of COVID-19 on Urban Energy Consumption of Commercial Tourism City. Sustain. Cities Soc. 2021, 73, 103133. [Google Scholar] [CrossRef] [PubMed]
- Refaat, S.S.; Abu-Rub, H.; Sanfilippo, A.P.; Mohamed, A. Impact of grid-tied large-scale photovoltaic system on dynamic voltage stability of electric power grids. IET Renew. Power Gener. 2018, 12, 157–164. [Google Scholar] [CrossRef]
- GmbH, D. Quasi-Dynamic Simulation—DIgSILENT. Available online: https://www.digsilent.de/en/quasi-dynamic-simulation.html (accessed on 3 November 2022).
- Organismo Coordinador del Sistema Eléctrico Nacional Interconectado de la República Dominicana (CO-SENI) Operación del Sistema Eléctrico Nacional Interconectado de la República Dominicana (SENI). Available online: https://www.dropbox.com/sh/rhs9u44j7z79u1k/AACEZm9U25eOQNY-XQiDQZMZa/UNIFILAR%20SENI?dl=0&subfolder_nav_tracking=1 (accessed on 9 November 2022).
- Jabir, H.J.; Teh, J.; Ishak, D.; Abunima, H. Impacts of Demand-Side Management on Electrical Power Systems: A Review. Energies 2018, 11, 1050. [Google Scholar] [CrossRef]
- Wu, Y.; Xin, B.; Zhu, H.; Ye, Z. Energy-Saving Operation Strategy for Hotels Considering the Impact of COVID-19 in the Context of Carbon Neutrality. Sustainability 2022, 14, 14919. [Google Scholar] [CrossRef]
- Bharati, A.K.; Ajjarapu, V. SMTD Co-Simulation Framework with HELICS for Future-Grid Analysis and Synthetic Measurement-Data Generation. IEEE Trans. Ind. Appl. 2022, 58, 131–141. [Google Scholar] [CrossRef]
- Lai, Y.; Hu, Y.; Li, W.; Liu, F.; Qie, Z.; Sun, Z. Research on Voltage Stability of Reactive Power Weak Support Regions in Countries along the Belt and Road Based on PSS/E. In Proceedings of the 2022 5th International Conference on Energy, Electrical and Power Engineering (CEEPE), Chongqing, China, 22–24 April 2022; pp. 235–239. [Google Scholar]
- de Lima Vianna, P.; Viana, M.S.; Manassero, G.; Udaeta, M.E. A General Analysis of the Distributed Generation Impact on Electrical Energy Planning. In Proceedings of the 2018 53rd International Universities Power Engineering Conference (UPEC), Glasgow, UK, 4–7 September 2018; pp. 1–6. [Google Scholar]
- Audring, D.; Kuri, A. Modelling and challenges of integration of large renewable power plants. In Proceedings of the 2021 56th International Universities Power Engineering Conference (UPEC), Middlesbrough, UK, 31 August–3 September 2021; pp. 1–6. [Google Scholar]
- Al-Akayshee, A.S.; Kuznetsov, O.N.; Alwazah, I.; Deeb, M. Investigation of the Performance of Iraqi 400kV Electrical Network in DIgSILENT Power Factory. In Proceedings of the 2020 International Youth Conference on Radio Electronics, Electrical and Power Engineering (REEPE), Moscow, Russia, 12–14 March 2020; pp. 1–6. [Google Scholar]
- Adetokun, B.; Muriithi, C. Application and control of flexible alternating current transmission system devices for voltage stability enhancement of renewable-integrated power grid: A comprehensive review. Heliyon 2021, 7, 7. [Google Scholar] [CrossRef] [PubMed]
- Gu, M.; Meegahapola, L.; Wong, K.L. Coordinated Voltage and Frequency Control in Hybrid AC/MT-HVDC Power Grids for Stability Improvement. IEEE Trans. Power Syst. 2021, 36, 635–647. [Google Scholar] [CrossRef]
- Mukherjee, N.; De, D.; Nandagaoli, N. Effect of sudden variation of grid voltage in primary frequency control application using converter based energy storage systems for weak grid systems. In Proceedings of the 2017 19th European Conference on Power Electronics and Applications (EPE’17 ECCE Europe), Warsaw, Poland, 11–14 September 2017; pp. P.1–P.10. [Google Scholar]
- Bompard, E.; Mazza, A.; Toma, L. Classical grid control: Frequency and voltage stability. In Converter-Based Dynamics and Control of Modern Power Systems; Academic Press: Cambridge, MA, USA, 2021; p. 360. ISBN 978-0-12-818491-2. Available online: https://linkinghub.elsevier.com/retrieve/pii/B9780128184912000031 (accessed on 1 February 2023).
- Ojo, Y.; Benmiloud, M.; Lestas, I. Frequency and voltage control schemes for three-phase grid-forming inverters. IFAC PapersOnLine 2020, 53, 13471–13476. [Google Scholar] [CrossRef]
- Yan, L.; Xiaohui, Q.; Yongning, C.; Xinshou, T.; Sujuan, S.; Shenglun, Z.; Xiangmei, K.; Lei, S. Study on Requirement of Control and Stability with Renewable Energy Generation Grid Integration. In Proceedings of the 2019 IEEE 8th International Conference on Advanced Power System Automation and Protection (APAP), Xi’an, China, 21–24 October 2019; pp. 26–30. [Google Scholar]
- Khamies, M.; Magdy, G.; Ebeed, M.; Kamel, S. A robust PID controller based on linear quadratic gaussian approach for improving frequency stability of power systems considering renewables. ISA Trans. 2021, 117, 118–138. [Google Scholar] [CrossRef] [PubMed]
- Guo, J. Application of a novel adaptive sliding mode control method to the load frequency control. Eur. J. Control 2021, 57, 172–178. [Google Scholar] [CrossRef]
- Dreidy, M.; Mokhlis, H.; Mekhilef, S. Inertia response and frequency control techniques for renewable energy sources: A review. Renew. Sustain. Energy Rev. 2017, 69, 144–155. [Google Scholar] [CrossRef]
- Golpîra, H.; Seifi, H.; Haghifam, M.R. Dynamic equivalencing of an active distribution network for large-scale power system frequency stability studies. IET Gener. Transm. Distrib. 2015, 9, 2245–2254. [Google Scholar] [CrossRef]
- Vazquez, S.; Rodriguez, J.; Rivera, M.; Franquelo, L.G.; Norambuena, M. Model Predictive Control for Power Converters and Drives: Advances and Trends. IEEE Trans. Ind. Electron. 2017, 64, 935–947. [Google Scholar] [CrossRef]
- Counsil, W.E.C. Voltage Stability Criteria. Available online: https://www.wecc.org/Reliability/Voltage%20Stability%20Criteria%20May%201998.pdf (accessed on 10 October 2021).
- Electricidad, S. de Reglamento para la Aplicación de la Ley General de Electricidad Número 125-01. 2012, 314. Available online: https://sie.gob.do/images/sie-documentos-pdf/leyes/LeyGeneraldeElecctricidadNo.125-01.pdf, (accessed on 10 October 2021).
- Superintendencia de Electricidad (SIE) Resolucion SIE-060-2015-MEM; Distrito Nacional: Santo Domingo, Dominican Republic, 2015.
- SENI, O.C. Informe Anual de Operaciones y Transacciones Económicas. 2020. Available online: https://www.oc.do/Informes/Administrativos/Informe-Anual/EntryId/175028 (accessed on 10 October 2021).
- Roa, L.; Ogando, L.; LastNameSimó, A.; Aquino, F.; De La Cruz, S. Organismo Coordinador del Sistema Eléctrico Nacional Interconectado de la República Dominicana Para: Agentes del mem Preparado por: Gerencia de Operaciones Oc-Seni. Available online: https://www.oc.org.do/DesktopModules/Bring2mind/DMX/API/Entries/Download?Command=Core_Download&EntryId=160872&language=es-ES&PortalId=0&TabId=188 (accessed on 19 February 2022).
- Lu, Y.; AbouRizk, S.M. Automated Box–Jenkins forecasting modelling. Autom. Constr. 2009, 18, 547–558. [Google Scholar] [CrossRef]
Disclaimer/Publisher’s Note: The statements, opinions and data contained in all publications are solely those of the individual author(s) and contributor(s) and not of MDPI and/or the editor(s). MDPI and/or the editor(s) disclaim responsibility for any injury to people or property resulting from any ideas, methods, instructions or products referred to in the content. |
© 2023 by the authors. Licensee MDPI, Basel, Switzerland. This article is an open access article distributed under the terms and conditions of the Creative Commons Attribution (CC BY) license (https://creativecommons.org/licenses/by/4.0/).