Abstract
In contemporary construction practice, concrete surfaces are commonly coated; however, this factor is often disregarded in durability assessments, particularly with respect to carbonation. Such omission may lead to overly conservative designs and unnecessary material consumption. This study evaluates the actual performance of traditional coatings applied to concrete, considering three types of concrete: ordinary Portland cement (OPC), high-volume fly ash (FA), and high-volume FA with a low water-to-binder ratio. The coatings investigated were mainly based on cement and hydrated lime, with the inclusion of a FA-based alternative. Accelerated carbonation tests were performed on coated and uncoated concretes, as well as on coating mortars, while a sensitivity analysis was undertaken using an empirical and semi-probabilistic model across different exposure classes to simulate real service conditions. The results demonstrate excellent performance, with coated concretes achieving on average more than 52% higher resistance compared with uncoated counterparts. These findings indicate that properly designed coatings can enable reductions in cement content while still satisfying durability requirements, thereby contributing to more sustainable reinforced concrete structures.
1. Introduction
Reinforcement corrosion is recognised as a major durability concern in reinforced concrete structures [1,2,3,4,5], often leading to structural degradation and reduced service life. Among the different corrosion mechanisms, carbonation-induced corrosion plays a relevant role in many exposure scenarios, particularly for concretes with reduced alkaline reserve [6,7,8]. Moreover, it is associated with significant social, functional and economic losses [7,9,10]. Concrete carbonation is a major factor contributing to corrosion. In the 1970s, Tuutti (1979) identified carbonation as one of the principal causes of serious building damage in Sweden [11]. Since then, numerous studies have confirmed the occurrence of this phenomenon in other regions worldwide [12,13,14,15,16,17,18,19,20,21,22].
In simple terms, carbonation occurs when carbon dioxide (CO2) reacts with concrete constituents, primarily calcium hydroxide (CH) formed during cement hydration, producing calcium carbonate () and releasing water (H), as shown in Equation (1) [23,24,25]. This reaction progressively consumes CH, ultimately leading to its depletion and a consequent reduction in pH, which is essential for maintaining reinforcement passivation [26].
Furthermore, the presence of carbon dioxide is a fundamental prerequisite for carbonation. It is well established that the atmospheric concentration of this gas has been rising significantly; in 2020, it reached 413 ppm, representing a 1.5-fold increase compared with pre-industrial levels [27,28]. Moreover, global population growth is projected to reach 9.7 billion by 2050, with the majority concentrated in urban areas [29,30,31]. Taken together, these factors suggest that carbonation-induced deterioration is likely to gain relevance as a durability issue in certain concrete structures, depending on exposure conditions and binder composition.
Concrete quality also influences the susceptibility to carbonation [26]. Contrary to common perception, modern and eco-friendly concretes may be more vulnerable than traditional ones. Moreover, ecological concretes containing high volumes of supplementary cementitious materials (SCMs) may present additional risks. During the main hydraulic reactions of cement components, namely tricalcium silicate (C3S) and dicalcium silicate (C2S), calcium silicate hydrate (C–S–H) and calcium hydroxide (CH) are formed as shown in Equations (2) and (3). In addition to these hydraulic reactions, pozzolanic reactions occur between pozzolans, mainly their amorphous silica (S), water and CH as shown in Equation (4). In other words, CH is progressively consumed and depleted, which also reduces pH. This reduction further increases the vulnerability of concrete to carbonation [32,33].
Two main strategies can be adopted to protect concrete against carbonation in structural design: a performance-based approach or a prescriptive approach. Documents such as the Eurocodes, EN 206-1, fib Bulletin 34 (Model Code for Service Life Design) and RILEM Report 14 (Durability Design of Concrete Structures) describe the methodological framework to be applied, which must be combined with adequate reinforcement cover [34,35,36,37,38]. An alternative strategy is the application of surface coatings [39,40,41,42,43]. However, standards and specifications are often very restrictive regarding the types of coating materials permitted [44]. As a result, the consideration of most coatings for carbonation resistance is currently not feasible, and due to this complexity, further research is still required [45]. One of the main challenges is that while coatings act as barriers to carbon dioxide diffusion, their low permeability may also promote moisture retention within the concrete [45]. Adhesion of the coating to the concrete substrate represents an additional concern [46]. The majority of anti-carbonation products available on the market are based on modified cementitious paints and mortars [47]. Other coating systems include alkyd, acrylic, vinyl, vinyl–acrylic, polyurethane, styrene–butadiene, metallic, and reactive crystalline materials [39,45,46,47]. Nevertheless, traditional coatings are still widely used in practice to provide protection, although their presence is generally not considered in durability assessments.
Veiga and Faria [48] present a classification and describe the functioning of traditional mineral-based coatings, as summarised below. Traditional coatings can be classified as strong or weak according to their cement content. Strong coatings, with a high cement content, exhibit better workability, improved adhesion and lower porosity. Mineral binder coatings are typically applied in several layers, each with a specific function. This method reduces porosity, shrinkage and cracking, thereby limiting the ingress of aggressive agents, particularly when strong mortars are used. Proper application of the layers requires adherence to two principles. First, the binder regressivity rule states that the binder content should decrease from the inner to the outer layers as shown in Figure 1. This arrangement ensures that, if a crack forms, it does not propagate through the entire coating. Second, sufficiently long drying intervals are required to allow partial shrinkage of each layer before the next one is applied. Thus, traditional coatings typically consist of three or more layers: a coarse mortar (discontinuous coat), a base layer (which may include one or more sub-layers), and a finishing layer. The coarse mortar enhances adhesion by producing a discontinuous, rough surface with a high binder content. The base layer is homogeneous, ensuring flatness and verticality, improving overall surface regularity, and providing impermeability together with strong adhesion to the subsequent layer. Finally, the finishing layer fulfils a decorative role while also contributing to waterproofing and resistance to impact.
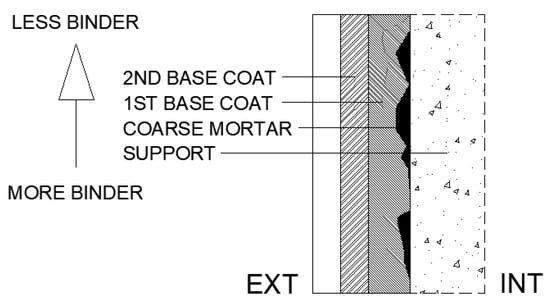
Figure 1.
Binder regressivity rule.
Therefore, this commonly used type of coating exhibits characteristics that may enhance resistance to carbonation, namely its multilayer structure, regressive binder content and potentially adequate water vapour diffusion. In this context, an experimental programme was conducted to assess the carbonation resistance of several coatings applied to different types of concrete. A reference publication was followed to define the coating compositions [48], considering the coarse mortar and unfinished base layers. Furthermore, coatings incorporating hydrated lime (HL) and fly ash (FA) were included with the objective of providing a physical barrier. Finally, a thin coating with a high cement content was evaluated, designed to act as a chemical barrier.
This investigation represents the first stage of a broader research programme aimed at assessing the effectiveness of different types of concrete coatings against carbonation. Traditional mineral-based coatings were intentionally selected in this initial phase in order to establish a clear experimental and methodological baseline, which will be extended in future studies to include modern coating systems, such as polymer-modified and crystalline coatings. The main objective of this research was to evaluate the effectiveness of traditional exterior coatings for carbonation mitigation in three types of concrete: common concrete, high-volume FA concrete, and high-performance concrete with high-volume FA. In this context, the study also explores the hypothesis that considering the protective effect of exterior coatings in durability assessments may contribute to reducing conservative overdesign. The analysis considered both coated and uncoated concrete. Accelerated carbonation tests were performed to determine how coatings influence carbonation depth, and a sensitivity analysis was carried out under different environmental exposure conditions. An empirical and semi-probabilistic model [49] was applied to assess concrete performance in relation to service life. This statistical approach, proposed by the RILEM Technical Committee 130-CSL [38], is comparable to other European models, such as fib Bulletin 34 [37,50]. It is therefore assumed, within the scope of this investigation, that these models may be applied to coated concretes. Service life was assumed to be 50 and 100 years. Finally, two approaches for service life assessment were considered: only the corrosion initiation period, or both the initiation and propagation periods. Both approaches were applied, and the corresponding results are discussed in detail.
2. Materials and Methods
2.1. Materials
Three types of concrete were produced: common concrete (I), high-volume FA concrete (II), and high-volume FA concrete with a low w/b ratio (III). In the latter, a superplasticizer was incorporated to ensure the required workability.
For concrete production, cement and FA were used as binders in combination with three types of aggregates. For the coatings, the binders selected were cement, FA and HL, together with an additive for the coarse mortar (discontinuous coat). Only the finest aggregate fraction was employed. Detailed information about these materials is available in a previous study [32].
2.1.1. Aggregates
Three types of aggregates were used: one natural sand and two crushed gravels. The sand, rounded in shape, was collected from the Douro River at Entre-os-Rios, whereas the gravels were angular, compact granite aggregates sourced from the “Sorte do Mato do Monte das Lagedas” quarry in the Guimarães region (northern Portugal). The commercial designations were Sand 0/4, Coarse 4/8 and Coarse 6/12, corresponding to the finest, intermediate and coarsest fractions, respectively. These materials were characterised in terms of particle size distribution, density, void content, water absorption and moisture content [51,52,53,54,55,56,57,58].
2.1.2. Binders
Table 1 presents the fundamental characteristics of the binders. Portland cement (CEM I 42.5R), produced at the SECIL Maceira-Liz factory in Portugal, was employed [59]. After 28 days, the compressive strength, determined in accordance with EN 196-1 [60], was 58.4 MPa. Laser granulometry revealed a maximum particle size of 37.80 μm and a d50 value of 9.30 μm.
The FA was obtained from the Pego thermoelectric power plant in central Portugal. Its chemical and microstructural characterisation was performed using a Scanning Electron Microscope (SEM) equipped with Energy Dispersive Spectroscopy (EDS). Additional tests have been reported in previous studies [32,61], including Loss on Ignition (LOI), selective dissolution with hydrofluoric acid, X-ray Fluorescence (XRF), Simultaneous Thermal Analysis (STA), and X-ray Diffraction (XRD) with Rietveld refinement. The FA was classified as type F [62], with an oxide composition mainly of silica, alumina and iron. These oxides were identified in the mineralogical forms of quartz, mullite and haematite, together with a glassy (reactive) phase accounting for 62.5%. The LOI ranged from 2.73 to 3.07%, corresponding to class A [63]. The particle morphology was predominantly spherical, consisting mainly of cenospheres with regular geometry and occasional carbon agglomerates. The maximum particle size was 32.57 μm, with a mean d50 of 8.55 μm, indicating a granulometry similar to that of Portland cement.
The HL was supplied by the Portuguese company Lusical (reference H100) [64]. STA tests confirmed its high purity, with calcium hydroxide and calcium carbonate contents of 92.1% and 3.6%, respectively. HL was the finest binder, with a maximum particle size of 10.41 µm and a d50 of 3.80 µm.

Table 1.
Summary of binder properties.
Table 1.
Summary of binder properties.
| C | FA | HL | |||||||
|---|---|---|---|---|---|---|---|---|---|
| CEM I 42.5 R | Pego | Lusical H100 | |||||||
| Chemical properties [%] | |||||||||
| SiO2 | 17.85 | [59] | 55.10 | ≤0.35 | [64] | ||||
| Al2O3 | 4.15 | [59] | 26.60 | ≤0.20 | [64] | ||||
| Fe2O3 | 3.71 | [59] | 5.70 | ≤0.20 | [64] | ||||
| CaO | 65.06 | [59] | 2.58 | ≥80 | [64] | ||||
| SO3 | 3.44 | [59] | 0.50 ± 0.06 | [61] | ≤2.0 | [64] | |||
| MgO | 1.85 | [59] | 1.30 | ≤5.0 | [64] | ||||
| CO2 | ≤1.8 | ||||||||
| K2O | 0.91 | [59] | 1.41 | ||||||
| TiO2 | 1.33 | ||||||||
| Na2O | 0.28 | [59] | 0.26 | ||||||
| Cl− | 0.26 | [59] | <0.01 | [61] | |||||
| Others (<1%) | 1.08 | ||||||||
| Rest for 100% | 2.69 | 4.64 | |||||||
| Insoluble residue | 0.99 | [59] | |||||||
| LOI | NP EN 196-2 | 2.15 | [59] | 2.73 | |||||
| ATS | 2.92 | 3.07 | 2.59 | ||||||
| Chapelle test modified [mg Ca(OH)2/g] [65] | 525.2 | ||||||||
| Mechanical properties [%] | |||||||||
| Activity index EN 196-1 [%] [60] | 7d | 68.8 | |||||||
| 28d | 79.5 | ||||||||
| 90d | 87.9 | ||||||||
| Physical properties [%] | |||||||||
| Particle density [kg/m3] | 3130 | [59] | 2420 | 2317 | |||||
| Laser granulometry [μm] | D10 | 1.33 | 1.53 | 1.36 | |||||
| D50 | 9.30 | 8.55 | 3.80 | ||||||
| D90 | 24.16 | 20.19 | 7.73 | ||||||
| Dmáx | 37.80 | 32.57 | 10.41 | ||||||
2.1.3. Superplasticizer and Cementitious Bonding Bridges
BASF’s GLENIUM SKY 617 was used as a superplasticizer (SP) in the high-volume FA concrete with a low w/b ratio. This commercial superplasticizer, based on a modified polycarboxylic ether chain, enables the use of low w/b ratios without segregation. According to the manufacturer, it has a relative density of 1.05 ± 0.02 g/cm3, a pH of 7.3 ± 1.5, and complies with NP EN 934-2, class T 11.1 [66,67]. The solids content was determined to be 35.5%.
In addition to CEM, cementitious bonding bridges (SikaLatex) were incorporated into the coarse mortar layer to improve adhesion between the concrete and the first base layer. This product is based on styrene–butadiene and has a density of approximately 1 kg/dm3 [68].
2.2. Methods
2.2.1. Concrete Mixtures
The composition of all concretes was determined according to Faury’s methodology [69]. The SP was incorporated only in concrete III, owing to its low w/b ratio, to ensure adequate workability. Table 2 presents the detailed composition of the concretes.
Table 2.
Concrete constitution.
2.2.2. Coating Mixtures
For the coating compositions, seven mortars were prepared using CEM, HL and FA (Table 3). From these, nine different coatings were developed, together with one reference, resulting in a total of ten mixtures. Table 4 presents the volumetric composition of these coatings. Three layers were applied: discontinuous coarse mortar, first base layer and second base layer. The table also reports the total quantities of binder, CEM, FA, HL, sand and water applied per square metre. The binder regressivity rule was applied, resulting in a progressive decrease in binder content from the inner to the outer layers (Figure 1).
Table 3.
Mortar compositions.
Table 4.
Coating compositions.
Thus, type 1 corresponded to uncoated concrete. Type 2 (coating 2) consisted of a single discontinuous coarse mortar layer incorporating SikaLatex, applied by random projection. Coatings 3 to 5 were composed of conventional cementitious materials. Coatings 6 to 8 incorporated HL, whereas coating 9 used FA as a binder. Coating 10 comprised a single thin layer of strong CEM mortar, applied without coarse mortar. It should be noted that coatings 5 and 8 included two continuous base layers in addition to the coarse mortar.
2.2.3. Overview
Figure 2 illustrates the overview of the experimental programme. Concrete was mixed in a vertical-axis mixer, and fresh concrete properties were tested immediately afterwards, namely slump [70] and density [71]. For the accelerated carbonation test, beams with dimensions of 250 × 100 × 100 mm3 were cast and subsequently cut into three parts to obtain specimens, each measuring 83 × 100 × 100 mm3.

Figure 2.
Overview of the experimental programme.
After 2 days, the specimens were demoulded and cured under water until 90 days of age. They were then preconditioned for 10 days in a ventilated dryer at 40 °C. The purpose of this preconditioning step, carried out at a temperature higher than that specified in NP EN 12390-3:2003 [72], was to adapt the standard procedure in order to better simulate more realistic concrete conditions during coating application. Otherwise, the concrete would remain excessively moist. It should be noted that current standards do not specifically address accelerated carbonation testing for this type of investigation, thus requiring minor methodological adaptations. At this point, the specimens were ready to receive the coatings, which were applied in up to three layers with 3-day intervals between applications. Before each new layer was applied, the previous one was moistened (Figure 3). After all layers had been applied, a drying period of 20 days was observed. The consistence of the fresh mortars was determined for all coating mixtures [73].
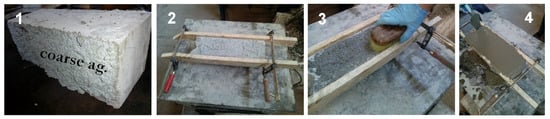
Figure 3.
Some phases of the coating process: coarse aggregate and four faces sealed with paraffin (1); preparation of the formworks (2); coarse aggregate moistening (3); application of the first base coat (4).
Therefore, the coated concrete specimens were sealed with paraffin applied in two layers on four faces, leaving the two larger parallel faces exposed to allow CO2 penetration (Figure 3). The specimens were then subjected to accelerated carbonation testing, based on NP EN 12390-3:2003 [72], with minor adaptations, mainly a slight increase in the CO2 concentration (by 1%), in order to ensure carbonation of the coated concrete specimens (Figure 4). They were placed in a climatic chamber for 60 days at 20 ± 2 °C, 4 ± 0.5% CO2 and 55 ± 5% RH. A previous study on high-performance concretes validated the adequacy of these parameters and the overall testing conditions for accelerated carbonation testing [32]. Carbonation depth was measured on a transversal section obtained by fracturing one end of each specimen using a steel rod placed between the specimen and the upper platen of a compression testing machine. Thymolphthalein solution was applied to the fractured surface, and after approximately 10 min, the carbonation front was traced. Each profile was divided into six equal segments, yielding five measurement points. The distance from each point to the external concrete surface was measured using a digital calliper, excluding the coating thickness. The carbonation depth for each mixture was calculated as the arithmetic mean of ten measurements and rounded to a precision of 0.1 mm.
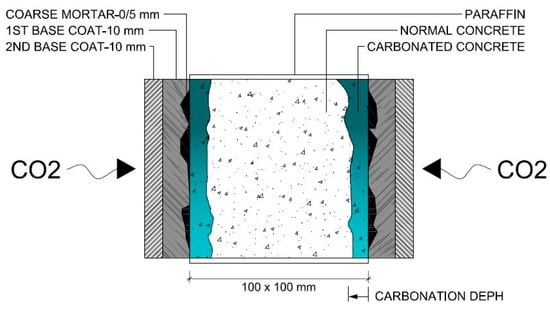
Figure 4.
Schematic representation of accelerated carbonation test on coated concretes.
In addition, complementary tests were conducted. For hardened uncoated concrete, cubic specimens of 100 × 100 × 100 mm3 were employed. The following properties were assessed: compressive strength using a 3000 kN ELE International testing machine [74] and rebound hammer index with Proceq model N/L [75] at 28, 90 and 180 days; electrical resistivity with Proceq model Resipod 38 mm [76] and ultrasonic pulse velocity with Proceq model Pundit Lab [77] at 7, 14, 21, 28, 90 and 180 days; and water absorption by immersion [78] and by capillarity [79] at 90 and 180 days. The coatings were characterised by measuring compressive strength [74], flexural strength [60] and carbonation depth [72] at 180 days, using mortar specimens of 160 × 40 × 40 mm3. Strength tests were performed with LLOYD equipment, model LR50K Plus. For each age and test, three specimens were examined, and the mean values were reported, except for the accelerated carbonation test, which was carried out with only two specimens.
2.2.4. Service Life Model
As mentioned earlier, an empirical and semi-probabilistic model was used to estimate the service life of concrete. In this approach, the carbonation performance of the concrete was considered. The objective was to determine whether coated concrete could provide a service life of 50 or 100 years under different exposure classes (XC1, XC2, XC3 and XC4). For class XC4, two climatic zones were considered: dry and wet. Probabilities were calculated using consequence class 2. According to EN 1990 [34], Consequence Class 2 (CC2) is applicable to most conventional buildings and civil engineering structures. This class was therefore selected as the most appropriate and representative scenario for the present analysis. The model was applied to both the corrosion initiation period of the reinforcement and the propagation period. Nominal concrete covers of 25 mm and 35 mm were adopted for classes XC1–XC3 and XC4, respectively.
Thus, the resistance to carbonation (RC65) was determined from the measured carbonation depth and the exposure time in the climatic chamber. Calculations were subsequently performed for the initiation period and, where applicable, the propagation period, for each exposure class and nominal concrete cover. An average CO2 concentration of 400 ppm was assumed, equivalent to 7.2 × 10⁻⁴ kg CO2/m3. Finally, the service life was estimated based on consequence class 2. Table 5 presents a summary of the key input parameters of the service life model.
Table 5.
Summary of service life model’s key input parameters.
3. Results
3.1. Uncoated Concretes
3.1.1. Workability and Fresh Concrete Density Results
The results of the slump test are presented in the left image of Figure 5. The three colours represent the types of concrete: black, green and blue, corresponding to common concrete (I), high-volume FA concrete (II) and high-volume FA concrete with a low w/b ratio (III), respectively. Concrete I, taken as the reference, exhibited a slump of 35 mm, corresponding to class S1 according to NP EN 206-1:2007 [36]. Concrete II showed high workability due to the presence of FA, achieving a slump of 205 mm, corresponding to class S4. Concrete III, with a low w/b ratio, had a slightly higher slump than concrete I owing to the combined effect of FA and the superplasticizer. This concrete reached a slump of 55 mm, corresponding to class S2.
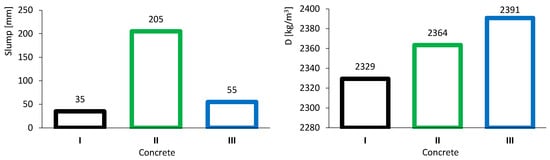
Figure 5.
Fresh concrete tests results: slump (left) and density (right).
Figure 5 (right) presents the results of fresh concrete density. Concrete II (2364 kg/m3) was denser than concrete I (2329 kg/m3), even though FA is less dense than CEM. This outcome is attributed to the improved workability of concrete II, which likely reduced porosity. Concrete III showed the highest density (2391 kg/m3), as it was produced with a lower w/b ratio, leading to a smaller volume of voids.
3.1.2. Accelerated Carbonation Results
Figure 6 presents the results of the accelerated carbonation tests. As expected, the carbonation depth of concrete II (28.2 mm) was significantly greater than that of concrete I (19.1 mm). This behaviour is most likely related to the neutralisation of alkaline compounds arising from pozzolanic reactions as shown in Equation (4). Because FA reacts primarily with CH, it is progressively consumed and depleted, resulting in a reduction in pH. These findings underline one of the main concerns regarding the use of supplementary cementitious materials, namely the incorporation of high volumes of FA.
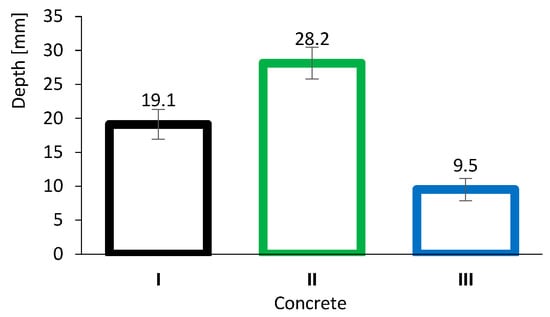
Figure 6.
Concrete carbonation depth results. Error bars represent standard deviation.
However, it is noteworthy that concretes with high volumes of FA can still achieve good durability performance, including resistance to carbonation. This is exemplified by concrete III (9.5 mm), which differs from concrete II owing to its very low w/b ratio. In this case, although neutralisation may occur, the high density and performance of the concrete matrix effectively limit the ingress of the aggressive agent (CO2).
3.1.3. Compressive Strength Results
The results of the compressive strength test are presented in Figure 7. On the left, the evolution over time is displayed together with the standard deviation bars. The dashed lines correspond to the specimens subjected to accelerated carbonation. In addition to the coloured lines representing the different types of concrete, the results after carbonation (C) are also indicated. On the right, the activity index of carbonated specimens (AIC–N) is shown, which quantifies the variation in compressive strength of carbonated specimens relative to non-carbonated specimens at 180 days, as given in Equation (5). It is therefore essential to interpret this index in conjunction with the dashed lines on the left-hand side of the figure.
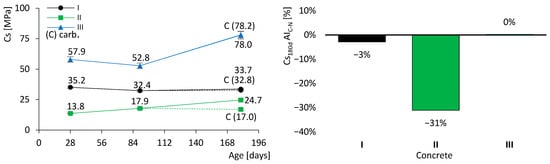
Figure 7.
Concrete compressive strength results (dashed lines for the specimens with accelerated carbonation). Evolution over time (left). Activity index of carbonated specimens (right). Error bars represent standard deviation.
It was observed that the strength of concrete I remained relatively stable, between 33 and 35 MPa. This behaviour was expected, as almost all hydraulic reactions had already been completed by 28 days. In contrast, concretes II and III exhibited significant strength gains over time: concrete II increased by approximately 80% (from 13.8 to 24.7 MPa), while concrete III increased by about 30% (from 57.9 to 78.0 MPa). These results were anticipated owing to the presence of FA in their composition. It is well established that FA contributes to strength development at later ages through its slow pozzolanic reaction, in which FA reacts with calcium hydroxide (CH), in accordance with the hydraulic CEM reactions described above (Equations (2) and (3)). Thus, the formation of CH is essential to supply the reagents for pozzolanic reactions. Nevertheless, the incorporation of FA in concrete II resulted in lower compressive strength compared with concrete I, at least up to 180 days. By contrast, the mechanical strength of concrete III, containing FA and a low w/b ratio, was significantly higher than that of concrete I, which is a remarkable outcome. This demonstrates that it is feasible to produce concrete with a high volume of FA while still achieving high mechanical strength.
Figure 7 shows that only concrete II exhibited a marked reduction in strength after accelerated carbonation, with a loss of 31%. Concretes I and III presented no significant changes, although for different reasons. The cement in concrete I is predominantly composed of clinker, which imparts high resistance to carbonation. In contrast, although concrete III contains FA, its very low w/b ratio restricts the ingress of aggressive agents, thereby mitigating carbonation.
3.2. Mortars
3.2.1. Workability Results
The mortars produced according to Table 3 were tested in the fresh state. The left image of Figure 8 shows the flow test results, with spreads ranging from 108 to 210 mm. Workability increased with higher w/b ratio and cement content, and was further enhanced by the presence of FA. Conversely, the incorporation of HL led to a significant reduction in workability: “mortar e” recorded a flow spread of only 168 mm despite a w/b ratio of approximately 2.00. It is also noteworthy that “mortar b” exhibited the lowest workability, most likely due to its high sand content.
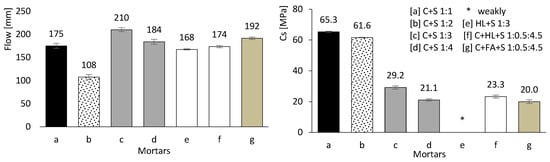
Figure 8.
Mortar flow test (left) and carbonation depth results (right). Error bars represent standard deviation.
3.2.2. Accelerated Carbonation Results
The right-hand image in Figure 8 presents the results of the accelerated carbonation tests. Mortars with a high CEM content (a, b, c, and d) exhibit superior resistance to carbonation, owing to the greater production of calcium hydroxide, which is proportional to the amount of hydrated CEM. In contrast, mortars containing HL or FA perform less effectively, particularly those without any CEM in their composition (e and g).
In “mortar e”, the carbonation rate is so rapid that the entire specimen cross-section becomes carbonated (beyond 160 mm). In other words, the thymolphthalein indicator shows that the pH is significantly reduced, preventing any reliable carbonation depth measurement. HL alone does not provide resistance to carbonation, as it reacts readily with carbon dioxide. Consequently, when comparing the results of “mortars d and f”, it becomes clear that HL has no beneficial effect.
Similarly, FA alone is ineffective, as it requires calcium hydroxide to trigger the pozzolanic reaction. This explains why “mortars e and g” exhibit comparable behaviour, with complete carbonation across the entire specimen cross-section.
3.2.3. Mechanical Strength Results
Figure 9 presents the mechanical strength results of the mortars after 180 days of curing. Flexural strength is presented on the left, while compressive strength is presented on the right. It can be concluded that both compressive and flexural strengths are directly dependent on the CEM content (a, b, c, and d, where the percentage of CEM decreases progressively). It is also evident that the modulus of elasticity and the deformation capacity increase with the CEM content, unlike in mixtures containing FA and HL (e, f, and g).
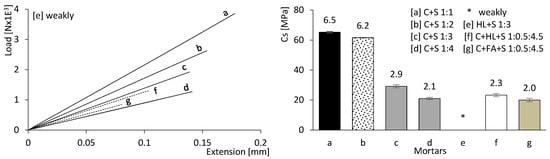
Figure 9.
Mortar flexural strength (left) and compressive strength results (right) at 180 days of age. Error bars represent standard deviation.
The mechanical strength values of the mortars incorporating CEM with HL (f) or CEM with FA (g) are comparatively lower. Furthermore, the mixture containing only HL and sand (e) exhibited insufficient strength for testing; therefore, no mechanical results could be obtained.
3.3. Coated Concretes Results
So far, only basic performance results have been presented for both concrete and mortar. In this chapter, the focus is on assessing the carbonation performance of the entire set. Figure 10, Figure 11 and Figure 12 present the results of the accelerated carbonation tests performed on the concrete specimens. On the left, the average carbonation depth was determined using thymolphthalein, while on the right, the carbonation activity index is shown. This index represents the difference between coated concrete (coatings 2 to 10) and uncoated concrete (type 1). The so-called coating 1 refers to concrete without any surface coating, which serves as the reference. The designation “D” indicates two-layer continuous coatings, beyond the discontinuous coarse-mortar layer, as in coatings 5 and 8.
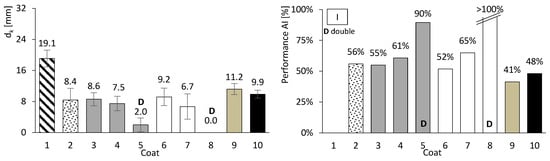
Figure 10.
Accelerated carbonation results of coated concrete I. Carbonation depth (left) and coating performance (right). Error bars represent standard deviation.
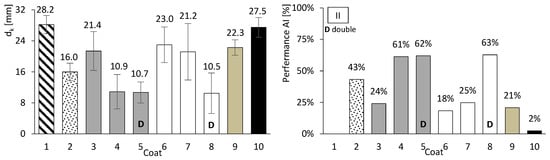
Figure 11.
Accelerated carbonation results of coated concrete II. Carbonation depth (left) and coating performance (right). Error bars represent standard deviation.
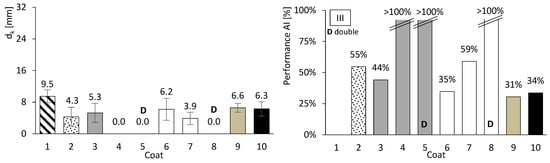
Figure 12.
Accelerated carbonation results of coated concrete III. Carbonation depth (left) and coating performance (right). Error bars represent standard deviation.
It should be noted that the results exhibit a considerable degree of variability. Therefore, the analysis is focused on comparative trends rather than on absolute performance rankings. No formal statistical comparison between individual coatings was performed, and the results should be interpreted accordingly.
All coatings, except coating 10, exhibited lower carbonation depths than concretes I, II, and III. The average coating performance exceeded 60% for concretes I and III, and 35% for concrete II. All coatings achieve carbonation depths at least 41% lower for ordinary Portland cement concrete (I), 31% lower for high-volume FA concrete (III), and 2% lower for high-volume FA concrete with a low w/b ratio (II). Even coatings composed of materials without inherent resistance to carbonation, such as HL or FA (Figure 8, right), showed apparently good results when applied to concrete. The term “apparently” is used here because, as will be discussed later, certain components of the coatings performed better than others.
The best results were probably obtained for coatings comprising two continuous layers, designated by the letter “D”. This behaviour may be attributed to the combination of greater thickness and a higher number of layer interfaces, which likely capture and retain the aggressive agent. These interfaces act as a buffer, allowing CO2 accumulation and thereby hindering its penetration into the concrete substrate.
Coatings applied to concrete II generally exhibited higher carbonation depths than those applied to concretes I and III. This behaviour may be related to the high FA content, which is associated with increased water demand and, consequently, higher porosity. In addition, the neutralisation of alkaline components discussed earlier may also contribute to this trend. The reduction in concrete pH is partly influenced by its binder composition, irrespective of external CO2 ingress. Nevertheless, the presence of external surface protection remains effective in limiting carbonation.
Regarding the discontinuous coarse-mortar coating (coating 2), reductions in carbonation depth ranging between 43% and 56% were observed. This coating exhibited comparatively favourable performance, which may be related, among other factors, to the presence of the adhesive admixture (SikaLatex). Although coating adhesion is recognised as a critical factor influencing durability performance, no direct adhesion tests were performed in the present study. The application procedure followed established practice, including the use of a bonding agent (SikaLatex), in order to promote adequate adhesion across the different substrate types. Nevertheless, the results reported herein focus on the global protective effect of the coatings against carbonation and do not explicitly account for potential variability in adhesion performance.
When compared with other coatings with thicknesses of 3–10 mm (coatings 3, 6, 7, 9 and 10), the discontinuous coarse-mortar coating exhibited lower carbonation depths. This behaviour was not anticipated and may be tentatively interpreted considering different contributing factors. These may include the presence of the adhesive admixture or the relatively high CEM content of the coarse mortar, which could influence CO2 transport and coating density.
Coatings consisting of discontinuous coarse mortar combined with a CEM–sand layer (coatings 3–5) exhibited lower carbonation depths when a thickness of 20 mm was used (coatings 4 and 5). This trend may be associated with the combined effect of increased thickness and higher CEM content.
Coatings containing HL exhibited trends broadly consistent with the mortar tests. In particular, mortar e became fully carbonated (Figure 8, right), and coating 6, composed solely of HL, showed carbonation depths comparable to or higher than those observed for the coarse-mortar coating across all concretes (Figure 10, Figure 11 and Figure 12). While the mortar results followed the expected trend, the corresponding coating performance did not show a similar improvement. The comparatively higher carbonation depths observed for HL-based coatings, particularly in concretes containing FA (concretes II and III), may be influenced by several factors. These may include rapid carbonation of HL-rich matrices and potential microstructural changes affecting porosity and CO2 transport. Possible adhesion-related effects between the coating and the underlying mortar layer may also contribute to the observed behaviour.
This interpretation is consistent with results obtained for the uncoated concretes discussed earlier. After carbonation, an increase in the absorption coefficient was observed, particularly for concrete II, suggesting a higher proportion of larger pores (Figure 6). Similarly, the compressive strength results (Figure 7) are consistent with a reduction in mechanical and durability-related properties following carbonation, especially in concrete II containing FA.
Coating 7, composed of HL and CEM, exhibited lower carbonation depths than coating 6 (HL only) and several CEM–sand coatings, such as coatings 3 and 4 in concrete I and coating 3 in concretes II and III. Despite its lower CEM content compared with coatings 3 and 4, coating 7 showed comparatively favourable performance. This behaviour may be associated with interactions between HL and CEM within the coating matrix. Possible contributing factors include differences in matrix compactness and microstructural evolution, as well as calcium carbonate precipitation effects previously reported in the literature [30]. Consistent with these observations, mortar tests showed that mortars composed exclusively of HL exhibited low compressive and flexural strengths and limited resistance to accelerated carbonation (Figure 8 and Figure 9), whereas the incorporation of a small amount of CEM (mortar f) was associated with improved performance.
Coating 8, consisting of two continuous layers, exhibited comparatively lower carbonation depths across the different concretes. This behaviour may be related to the presence of multiple layer interfaces and to the combined use of different binder compositions within the coating system. Possible contributions include physical barrier effects associated with HL in the second base layer and chemical buffering effects related to CEM in the first layer.
Coating 9 has a composition similar to that of coating 7, except that HL was replaced by FA. This coating exhibited relatively limited effectiveness, with reductions ranging between 21% and 41%. Its carbonation depth was generally higher than that observed for the coarse-mortar coating (coating 2). Although the incorporation of FA is commonly associated with porosity refinement and reduced CO2 diffusion, this trend was not clearly reflected in the present results. Possible contributing factors include an insufficient curing period for the development of pozzolanic reactions and the influence of carbonation on CEM–FA systems, which may promote pore coarsening and facilitate CO2 transport. In addition, the high FA content within the coating may have reduced the availability of calcium hydroxide, allowing the carbonation front to advance further.
Finally, coating 10, consisting solely of a thin CEM layer, exhibited reductions in carbonation depth of 49% and 34% for concretes I and III, respectively, whereas a much lower reduction of approximately 2% was observed for concrete II. These results suggest that coating thickness may influence the effectiveness of carbonation protection.
3.4. Service Life Model Results
The aim here is to predict the expected performance of coated concrete under different carbonation environments. Figure 13, Figure 14 and Figure 15 present the results obtained from the service life model for concretes I, II, and III, respectively. On the left, the propagation period of reinforcement corrosion is not considered (cp = 0), whereas on the right, the same propagation period is included (cp ≠ 0). For each coated concrete (2–10) and for the uncoated reference concrete (1), the corresponding carbonation classes achieved are shown. When a class is met, a circle or a square symbol is used to represent a service life of 50 or 100 years, respectively.
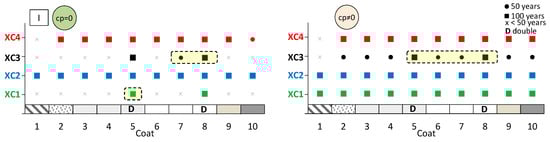
Figure 13.
Predicted lifetime for exposure classes of coated concrete I. Without corrosion period (cp = 0) (left) and with corrosion period (cp ≠ 0) (right).
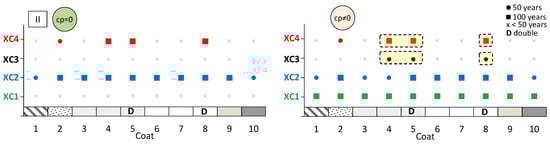
Figure 14.
Predicted lifetime for exposure classes of coated concrete II. Without corrosion period (cp = 0) (left) and with corrosion period (cp ≠ 0) (right).
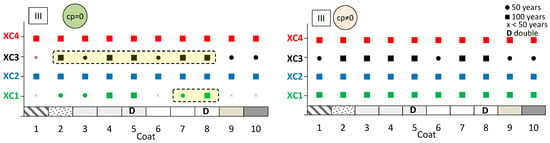
Figure 15.
Predicted lifetime for exposure classes of coated concrete III. Without corrosion period (cp = 0) (left) and with corrosion period (cp ≠ 0) (right).
It is evident that the service life of concrete increases when the corrosion propagation period is considered. Uncoated concrete does not fulfil all carbonation classes, particularly when the propagation period is disregarded. Without any coating, concretes I and II only meet the requirements of classes XC1 and XC2, even when the propagation period is included.
The most significant finding is that the application of coatings enables a greater number of carbonation classes to be achieved. In almost all cases, coated concretes exhibit enhanced class performance or an extended predicted service life compared with the reference. In the figures, the best results are highlighted in the cream-shaded region. The double continuous coatings (coatings 5 and 8) are particularly noteworthy, as only these coatings achieve classes XC1 and XC4 at 100 years, even without considering the propagation period. Subsequently, the coating composed of CEM and sand (coating 4) attains classes XC3 and XC4 in concrete II, while coating 7—consisting of CEM, HL, and sand—also demonstrates superior performance.
It was not possible to obtain reliable sensitivity results for the adopted model due to the high dispersion of the data.
Another analysis can be conducted using Figure 16, which illustrates the percentage of exposure classes achieved by uncoated and coated concretes. Each segment of the pie chart corresponds to one of the four exposure classes analysed individually. Consequently, the total of each chart amounts to 400%. The left part refers to uncoated concretes, while the right part corresponds to coated concretes. It should also be noted that the charts reflect the average percentage of coatings that meet the requirements for 50 and 100 years of exposure. The results are presented without considering the initiation period (cp = 0), and with the initiation period included (cp ≠ 0). According to the initial assumptions of the model, the easiest class to achieve is XC1 or XC2, depending on whether the propagation period is considered. The most challenging class is XC3, rather than XC4. The required cover depth for XC4 is 10 mm greater than that for XC3, which explains this outcome (Table 5). It is also evident that uncoated concretes achieved fewer exposure classes overall.
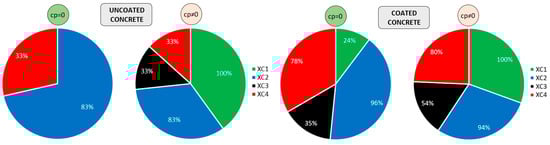
Figure 16.
Exposure classes achieved by uncoated (left) and coated (right) concretes: without corrosion period (cp = 0) and with corrosion period (cp ≠ 0) on the right. Each pie segment represents an exposure class, with each class independently normalised to 100%. The chart does not represent proportions of a single whole; consequently, the cumulative percentage reaches 400%.
4. Discussion
Regarding the core of coating research—coated concrete—the coatings exhibit distinctly different behaviours. Their effectiveness may also vary depending on whether the analysis focuses on carbonation depth or on the exposure classes achieved. The average performance of coated concretes, compared with uncoated concrete, is shown in Figure 17: on the left, with respect to carbonation depth, and on the right, according to the number of exposure classes satisfied for service lives of 50 and 100 years. The most notable feature is the consistency observed between both analytical perspectives. The thin coating (coating 10) appears to be less effective, whereas the discontinuous coarse-mortar coating (coating 2) performs more efficiently in terms of exposure class.
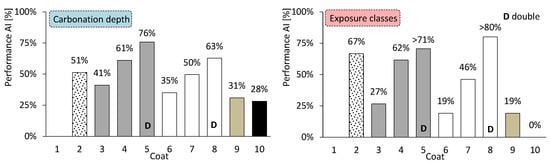
Figure 17.
Average performance of coated concretes. By carbonation depth (left) and by exposure classes (right).
Finally, Figure 18 presents the analysis of coated concretes according to the main influencing factors. This analysis highlights the parameters that account for the most favourable outcomes in terms of carbonation depth (left) and exposure classes (right). The double continuous layer exhibits the best performance, reaching values up to 86%. All other factors clearly underperform the double continuous layer, although they remain relevant. These include the amount of CEM, layer thickness, the presence of discontinuous coarse mortar, and layers composed of CEM and HL mixtures. Each of these factors contributes to a coated concrete performance exceeding 50%.
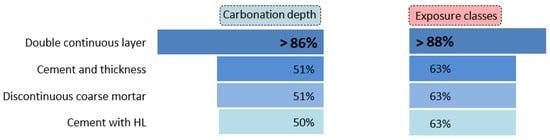
Figure 18.
Average performance of coated concretes by main factors.
No clear correlations were found between the carbonation depth of the concrete and the CEM content in the coatings, nor with other parameters such as binder quality, layer thickness, w/b ratio, or the number of layers. This strongly suggests that the resistance to carbonation of these coatings is a complex phenomenon influenced by multiple interrelated factors, rather than a single dominant variable.
5. Conclusions
The experimental results demonstrate that the application of exterior coatings significantly improves the resistance of concrete to carbonation. The magnitude of this improvement depends on both the concrete composition and the coating system applied. Coated concrete performance exceeding 50% than uncoated concrete. Furthermore, all coatings achieve carbonation depths at least 41% lower for ordinary Portland cement concrete, 31% lower for high-volume FA concrete, and 2% lower for high-volume FA concrete with a low w/b ratio.
Discontinuous coarse-mortar coatings prepared with a bonding agent also showed favourable performance, indicating that continuous coating layers probably are not strictly required to achieve effective carbonation protection.
Coating systems composed of multiple layers exhibited the highest effectiveness, with performance improvements exceeding 80%. Enhanced performance was consistently observed for coatings combining higher cement content, increased thickness and the inclusion of coarse mortar layers.
Service life predictions indicate that neglecting the protective effect of coatings leads to a substantial underestimation of concrete durability.
It should be noted that coating adhesion was not experimentally quantified in this study. Although standard application procedures and a bonding agent were used, future work should include direct adhesion testing in order to further support the durability assessment and confirm the long-term effectiveness of the coatings under different substrate conditions.
Author Contributions
Conceptualization, R.R.; Methodology, R.R. and É.F.; Software, R.R.; Validation, R.R., A.C., M.R. and R.M.; Formal analysis, R.R.; Investigation, R.R.; Resources, A.C. and É.F.; Writing—original draft, R.R.; Writing—review & editing, R.R., A.C., M.R. and R.M.; Visualization, R.R.; Supervision, A.C. and M.R.; Project administration, A.C.; Funding acquisition, A.C. All authors have read and agreed to the published version of the manuscript.
Funding
This research was funded by Autoridade de Gestão: PITD, through the Fundação para a Ciência e a Tecnologia (FCT), under Project No. 16142, grant number COMPETE2030–FEDER.
Data Availability Statement
The original contributions presented in this study are included in the article. Further inquiries can be directed to the corresponding authors.
Conflicts of Interest
The authors declare no conflict of interest.
References
- Helene, P. (Ed.) Introduction. In Manual of Repair, Protection and Reinforcement of Concrete Structures (in Spanish); Degussa Construction Chemical: São Paulo, Brazil, 2008. (In Spanish) [Google Scholar][Green Version]
- Rodrigues, R.; Gaboreau, S.; Gance, J.; Ignatiadis, I.; Betelu, S. Reinforced concrete structures: A review of corrosion mechanisms and advances in electrical methods for corrosion monitoring. Constr. Build. Mater. 2021, 269, 121240. [Google Scholar] [CrossRef]
- Otieno, M.; Ikotun, J.; Ballim, Y. Experimental investigations on the influence of cover depth and concrete quality on time to cover cracking due to carbonation-induced corrosion of steel in RC structures in an urban, inland environment. Constr. Build. Mater. 2019, 198, 172–181. [Google Scholar] [CrossRef]
- Das, C.S.; Zheng, H.; Dai, J.-G. A review of chloride-induced steel corrosion in coastal reinforced concrete structures: Influence of micro-climate. Ocean Eng. 2025, 325, 120794. [Google Scholar] [CrossRef]
- Wen, X.; Pagcaliwagan, A.M.; Hou, H.; Yin, X. Advancements in self-healing concrete: Material mechanisms, durability assessment, and implications for infrastructure lifecycle management. Alex. Eng. J. 2025, 131, 104–124. [Google Scholar] [CrossRef]
- Monteiro, I. Model of Evolution of Carbonation in Reinforced Concrete Elements. Master’s Thesis, University of Lisbon, Lisbon, Portugal, 2010. (In Portuguese) [Google Scholar]
- Huy Vu, Q.; Pham, G.; Chonier, A.; Brouard, E.; Rathnarajan, S.; Pillai, R.; Gettu, R.; Santhanam, M.; Aguayo, F.; Folliard, K.J.; et al. Impact of different climates on the resistance of concrete to natural carbonation. Constr. Build. Mater. 2019, 216, 450–467. [Google Scholar] [CrossRef]
- Li, H.; Wu, X.; Nie, Q.; Yu, J.; Zhang, L.; Wang, Q.; Gao, Q. Lifetime prediction of damaged or cracked concrete structures: A review. Structures 2025, 71, 108095. [Google Scholar] [CrossRef]
- ASCE. American Society of Civil Engineering Infrastructure Report Card 2021; ASCE: Reston, VG, USA, 2021. [Google Scholar]
- NACE. IMPACT—The International Measures of Prevention, Application, and Economics of Corrosion Technologies Study; NACE International: Houston, TX, USA, 2016. [Google Scholar]
- Tuutti, K. Corrosion Damage on Reinforcement in Concrete Balconies—Report 2:79; Cement-och Betonginstitutet: Stockholm, Swedish, 1979. (In Swedish) [Google Scholar]
- Basheer, P.A.M.; Chidiact, S.E.; Long, A.E. Predictive models for deterioration of concrete structures. Constr. Build. Mater. 1996, 10, 27–37. [Google Scholar] [CrossRef]
- Lee, H.J.; Kim, D.G.; Lee, J.H.; Cho, M.S. A study for carbonation degree on Concrete using a phenolphthalein indicator and fourier-transform infrared spectroscopy. Int. J. Civ. Environ. Eng. 2012, 34, 184–190. [Google Scholar]
- Torgal, F.P.; Miraldo, S.; Labrincha, J.A.; De Brito, J. An overview on concrete carbonation in the context of eco-efficient construction: Evaluation, use of SCMs and/or RAC. Constr. Build. Mater. 2012, 36, 141–150. [Google Scholar] [CrossRef]
- Gonen, T.; Yazicioglu, S. The influence of compaction pores on sorptivity and carbonation of concrete. Constr. Build. Mater. 2007, 21, 1040–1045. [Google Scholar] [CrossRef]
- Polito, G. Corrosion in Reinforced Concrete Structures: Causes, Mechanisms, Prevention and Recovery. Ph.D. Thesis, Federal University of Minas Gerais, Belo Horizonte, Portugal, 2006. (In Portuguese) [Google Scholar]
- Thiery, M. Model of Atmospheric Carbonation of Cementitious Materials: Taken into Account Kinetic Effects and Microstructural and Water Changes. Ph.D. Thesis, Ecole des Ponts Paris Tech, Paris, France, 2005. (In French) [Google Scholar]
- Baroghel-Bouny, V. Concrete Design for a Given Lifetime of Structures: Control of Durability Against Reinforcement Corrosion and Alkali-Reaction; Association Française de Génie Civil: Paris, France, 2004. (In French) [Google Scholar]
- Tuutti, K. Corrosion of Steel in Concrete. Ph.D. Thesis, Lund University, Lund, Sweden, 1982. [Google Scholar]
- Revert, A.B.; De Weerdt, K.; Hornbostel, K.; Geiker, M.R. Carbonation-induced corrosion: Investigation of the corrosion onset. Constr. Build. Mater. 2018, 162, 847–856. [Google Scholar] [CrossRef]
- Gulikers, J. Theoretical considerations on the supposed linear relationship between concrete resistivity and corrosion rate of steel reinforcement. Mater. Corros. 2005, 56, 393–403. [Google Scholar] [CrossRef]
- Silva, A.; Neves, R.; de Brito, J. Statistical modelling of carbonation in reinforced concrete. Cem. Concr. Compos. 2014, 50, 73–81. [Google Scholar] [CrossRef]
- Lagerblad, B. Carbon Dioxide Uptake During Concrete Life Cycle—State of the Art; CBI: Stockholm, Sweden, 2005. [Google Scholar]
- Jang, J.G.; Kim, G.M.; Kim, H.J.; Lee, H.K. Review on recent advances in CO2 utilization and sequestration technologies in cement-based materials. Constr. Build. Mater. 2016, 127, 762–773. [Google Scholar] [CrossRef]
- Aceituno, D.; Zhang, X.; Hao, H. A comprehensive review on carbon utilization pathways in concrete from conventional to improved strategies. Carbon Capture Sci. Technol. 2025, 16, 100467. [Google Scholar] [CrossRef]
- Davolio, M.; Muciaccia, G.; Ferrara, L. Concrete carbon mixing—A systematic review on the processes and their effects on the material performance. Clean. Mater. 2025, 15, 100292. [Google Scholar] [CrossRef]
- WMO. WMO Greenhouse Gas Bulletin: The State of Greenhouse Gases in the Atmosphere Based on Global Observations Through 2019; WHO: Geneva, Switzerland, 2020. [Google Scholar]
- Al-Ameeri, A.S.; Rafiq, M.I.; Tsioulou, O.; Rybdylova, O. Impact of climate change on the carbonation in concrete due to carbon dioxide ingress: Experimental investigation and modelling. J. Build. Eng. 2021, 44, 102594. [Google Scholar] [CrossRef]
- Papadakis, V.G. Effect of supplementary cementing materials on concrete resistance against carbonation and chloride ingress. Cem. Concr. Res. 2000, 30, 291–299. [Google Scholar] [CrossRef]
- UN. World Population Prospects 2019: Highlights; UN: New York, NY, USA, 2019. [Google Scholar]
- Zhang, P.; Fu, Y.; Jia, B.; Zelele, T.; Al-Hussein, M. Quantifying operational-phase carbon sequestration in urban concrete buildings: A spatiotemporal analysis of Qingdao City. Energy Build. 2025, 349, 116549. [Google Scholar] [CrossRef]
- Reis, R. Influence of Hydrated Lime Addition on the Carbonation of High-Volume Fly Ash Concretes. Ph.D. Thesis, University of Minho, Minho, Portugal, 2022. Available online: https://repositorium.sdum.uminho.pt/handle/1822/81153 (accessed on 5 December 2025). (In Portuguese)
- Reis, R.; Camões, A.; Ribeiro, M. Using Thymolphthalein for Accelerated Carbonation Testing of High Volume Fly Ash Cementitious Blends. In Service Life and Durability of Reinforced Concrete Structures; Andrade, C., Gulikers, J., Marie-Victoire, E., Eds.; Using thymolphthalein for accelerated carbonation testing of high volume fly ash cementitious blends; Springer International Publishing: Cham, Switzerland, 2016; pp. 17–30. [Google Scholar]
- IPQ (2009) NP EN 1990:2009; Eurocode. Basis of Structural Design. IPQ: Caparica, Portugal, 2009. (In Portuguese)
- IPQ (2010) NP EN 1992-1-1:2010; Eurocode 2. Design of Concrete Structures—Part 1-1: General rules and Rules for Buildings. IPQ: Caparica, Portugal, 2010. (In Portuguese)
- IPQ (2007) NP EN 206-1:2007; Concrete. Part 1: Specification, Performance, Production and Conformity. IPQ: Caparica, Portugal, 2007. (In Portuguese)
- Fib. Model Code for Service Life Design; fib Bulletin No. 34; Fib: Lausanne, Switzerland, 2009. [Google Scholar]
- Sarja, A. Durability design of concrete structures—Committee report 130-CSL. Mater. Struct. 2000, 33, 14–20. [Google Scholar] [CrossRef]
- Merah, A. Concrete anti-carbonation coatings: A review. J. Adhes. Sci. Technol. 2020, 35, 337–356. [Google Scholar] [CrossRef]
- Qu, H.; Feng, M.; Li, M.; Tian, D.; Zhang, Y.; Chen, X.; Li, G. Enhancing the carbonation and chloride resistance of concrete by nano-modified eco-friendly water-based organic coatings. Mater. Today Commun. 2023, 37, 107284. [Google Scholar] [CrossRef]
- Li, G.; Dong, L.; Bai, Z.A.; Lei, M.; Dua, J. Predicting carbonation depth for concrete with organic film coatings combined with ageing effects. Constr. Build. Mater. 2017, 142, 59–65. [Google Scholar] [CrossRef]
- Park, D.C. Carbonation of concrete in relation to CO2 permeability and degradation of coatings. Constr. Build. Mater. 2008, 22, 2260–2268. [Google Scholar] [CrossRef]
- Lo, T.Y.; Liao, W.; Wonga, C.K.; Tang, W. Evaluation of carbonation resistance of paint coated concrete for buildings. Constr. Build. Mater. 2016, 107, 299–306. [Google Scholar] [CrossRef]
- BSI (2004) NP EN 1504-2:2004; Products and Systems for the Protection and Repair of Concrete Structures—Definitions, Requirements, Quality Control and Evaluation of Conformity—Part 2: Surface Protection Systems for Concrete. CEN: Brussels, Belgium, 2004.
- McGrath, P.F. A Simple Chamber for Accelerated Carbonation Testing of Concrete; McGrath Engineering Ltd.: Coalisland, Ireland, 2016. [Google Scholar]
- Serrano, I.D.; Moreno, E.I. Barrier films: An option against carbonation of reinforced concrete. Ing. Rev. Acad. FI-UADY 2006, 10, 37–45. (In Castilian) [Google Scholar]
- Simas, M. Concrete Protection Systems Against Carbonation. Master’s Thesis, New University of Lisbon, Lisbon, Portugal, 2007. (In Portuguese) [Google Scholar]
- Veiga, M.R.; Faria, P. Coating of mineral and mixed binders, based on cement, lime and synthetic resin. In Specialization in Wall Coverings, 5th ed.; LNEC, Ed.; LNEC (Laboratório Nacional de Engenharia Civil): Lisbon, Portugal, 2004; Chapter II; pp. 40–120. (In Portuguese) [Google Scholar]
- LNEC (2005) E 465-2005; Concretes: Methodology to Estimate the Performance Properties that Allow to Satisfy the Lifetime of Reinforced or Prestressed Concrete Structures under Environmental Exposures XC and XS. LNEC: Lisbon, Portugal, 2005.
- Gonçalves, A.F.; Ribeiro, A.B.; Esteves Ferreira, M.J. Pro056: The new LNEC specifications on reinforced concrete durability. In International RILEM Workshop on Integral Service Life Modelling of Concrete Structures; Ferreira, R.M., Gulikers, J., Andrade, C., Eds.; RILEM Publications SARL: Bagneux, France, 2013; pp. 131–140. Available online: https://www.rilem.net/publication/publication/61?id_papier=8037 (accessed on 4 January 2026).
- BSI (2012) BS EN 480-8:2012; Admixtures for Concrete, Mortar and Grout. Test Methods. Part 8: Determination of the Conventional Dry Material Content. BSI: London, UK, 2012.
- ASTM (2001) C33/C33M; Standard Specification for Concrete Aggregates. ASTM International: West Conshohocken, CA, USA, 2001.
- Coutinho, A. Manufacturing and Properties of Concrete—Volume II, 2nd ed.; LNEC: Lisbon, Portugal, 2006. (In Portuguese) [Google Scholar]
- IPQ (2000) NP EN 933-1:2000; Tests for Geometrical Properties of Aggregates. Part 1: Determination of Particle Size Distribution. Sieving Method. IPQ: Caparica, Portugal, 2000. (In Portuguese)
- Coutinho, A. Manufacturing and Properties of Concrete—Volume I, 4th ed.; LNEC: Lisbon, Portugal, 2006. (In Portuguese) [Google Scholar]
- IPQ (2003) NP EN 1097-6:2003/A1:2010; Tests for Mechanical and Physical Properties of Aggregates. Part 6: Determination of Particle Density and Water Absortion. IPQ: Caparica, Portugal, 2003.
- IPQ (2002) NP EN 1097-3:2002; Tests for Geometrical Properties of Aggregates. Part 5: Determination of Loose Bulk Density and Voids. IPQ: Caparica, Portugal, 2002. (In Portuguese)
- IPQ (2002) NP EN 1097-5:2002; Tests for Geometrical Properties of Aggregates. Part 5: Determination of the Water Content by Drying in a Ventilated Oven. IPQ: Caparica, Portugal, 2002. (In Portuguese)
- SECIL. Bulletin N. ACM-008/2014—Portland cement—EN 197-1 CEM I 42.5 R: Results of Self-Control; Maceira-Liz: Leiria, Portugal, 2014. (In Portuguese) [Google Scholar]
- IPQ (2006) EN 196-1:2006; Cements Test Methods. Part 1: Determination of Strength. IPQ: Caparica, Portugal, 2006. (In Portuguese)
- PEGOP. Fly Ash from the Pego Thermoelectric Plant: Self-Control; PEGOP: Lisbon, Portugal, 2013. (In Portuguese) [Google Scholar]
- ASTM (2005) C618-05; Standard Specification for Coal Fly Ash and Raw or Calcined Natural Pozzolan for Use in Concrete. ASTM: West Conshohocken, CA, USA, 2005.
- IPQ (2006) EN 196-2:2006; Cements Test Methods. Part 2: Chemical Analysis of Cement. IPQ: Caparica, Portugal, 2006. (In Portuguese)
- Lusical. Product Specification Sheet: Hydrated Lime H100; Lusical: Lisbon, Portugal, 2012. (In Portuguese) [Google Scholar]
- ABNT (2010) ABNT NBR 15895:2010; Pozzolanic Materials—Determination of Calcium Hydroxide Fixed—Modified Chapelles’s Method. ABNT: Rio de Janeiro, Brazil, 2010. (In Portuguese)
- BASF. Glenium Sky 617: Product Specification Sheet; BASF: Prior-Velho, Portugal, 2011. (In Portuguese) [Google Scholar]
- IPQ (2003) NP EN 934-2:2003; Admixtures for Concrete, Mortar and Grout. Part 2: Concrete Admixtures—Definitions, Requirements, Conformity, Marking and Labelling. IPQ: Caparica, Portugal, 2003. (In Portuguese)
- Sikalatex. Sikatalex Product Data Sheet; Sikalatex: Vila Nova de Gaia, Portugal, 2020. (In Portuguese) [Google Scholar]
- Faury, J. Concrete: Influence of Its Inert Components, Rules to Adopt for Its Best Composition, Manufacture and Transport on Construction Sites, 3rd ed.; Dunod: Paris, France, 1958. (In French) [Google Scholar]
- IPQ (2002) NP EN 12350-2:2002; Testing Fresh Concrete. Part 2: Slump Test. IPQ: Caparica, Portugal, 2002. (In Portuguese)
- IPQ (2002) NP EN 12350-6:2002; Testing Fresh Concrete. Part 6: Density. IPQ: Caparica, Portugal, 2002. (In Portuguese)
- CEN (2020) NP EN 12390-12:2020; Testing Hardened Concrete. Part 12: Determination of the Carbonation Resistance of Concrete—Accelerated Carbonation Method. CEN: Brussels, Belgium, 2020.
- CEN (2004) EN 1015-3: 2004; Methods of Test for Mortar for Masonry—Part 3: Determination of Consistence of Fresh Mortar (by Flow Table). CEN: Brussels, Belgium, 2004.
- IPQ (2003) NP EN 12390-3:2003; Testing Hardened Concrete. Part 3: Compressive Strength of Test Specimens. IPQ: Caparica, Portugal, 2003. (In Portuguese)
- IPQ (2003) NP EN 12504-2: 2003; Testing Concrete in Structures. Part 2: Non-Destructive Testing. Determination of Rebound Number. IPQ: Caparica, Portugal, 2003. (In Portuguese)
- UM (2005) PE 002; Concrete. Electrical Resistivity: Measurement of the Electrical Resistivity of a Surface of a Concrete Element. UM-Laboratório de Materiais de Construção (Universidade do Minho): Guimarães, Portugal, 2005. (In Portuguese)
- IPQ (2007) NP EN 12504-4:2007; Concrete Tests on Structures. Part 4: Speed Determination of Ultrasound Propagation. IPQ: Caparica, Portugal, 2007. (In Portuguese)
- LNEC (1993) E 394-1993; Determination of Water Absorption by Immersion. LNEC: Lisbon, Portugal, 1993. (In Portuguese)
- CEN (2002) EN 13057:2002; Products and Systems for the Protection and Repair of Concrete Structures. Test Methods. Determination of Resistance of Capillary Absorption (English Version). CEN: Brussels, Belgium, 2002.


Disclaimer/Publisher’s Note: The statements, opinions and data contained in all publications are solely those of the individual author(s) and contributor(s) and not of MDPI and/or the editor(s). MDPI and/or the editor(s) disclaim responsibility for any injury to people or property resulting from any ideas, methods, instructions or products referred to in the content. |
© 2026 by the authors. Licensee MDPI, Basel, Switzerland. This article is an open access article distributed under the terms and conditions of the Creative Commons Attribution (CC BY) license.