Abstract
Dynamic identification using accelerometers is a common technique for measuring the modal frequencies of existing structures. Strategically placing these sensors on a bridge allows for the derivation of its modal parameters through operational modal analysis (OMA). This study aims to demonstrate how the number of accelerometers required for the identification of a historical three-arch masonry bridge can be optimized. The experimental campaign involved the Santa Teresa bridge (STb) in Bitonto, a XIX masonry bridge in Southern Italy. Twenty-eight accelerometers were installed on the STb; frequency analysis was first performed with all accelerometers, and then the number was decreased to 13, 8 and 4 accelerometers. The four optimizations performed involved both the number and positioning of accelerometers along the central arch. The five primary vibration modes obtained revealed that with a smaller number of accelerometers, it is possible to correctly identify the natural frequencies of the bridge. A further optimization was per-formed with only No. 6 accelerometers on the keystone of the bridge’s three arches. The results of the modal shapes and natural frequencies showed that a limited number of accelerometers is sufficient to dynamically identify a bridge. The configuration with 13 accelerometers proved to be the best for this purpose. However, optimization with 6 accelerometers proved to be the best for recording normalized displacements compared to the reference configuration. The advantages of this study are directly related to the reduction in time, logistics and costs of in situ monitoring. This preliminary assessment approach enables the establishment of baseline conditions for subsequent periodic monitoring campaigns.
1. Introduction
The Italian infrastructure heritage largely consists of masonry buildings and bridges that require systematic structural assessment and monitoring strategies [1,2,3]. The preservation of these historical structures presents unique challenges that demand innovative approaches balancing conservation requirements with modern safety standards. In this context, the distinction between continuous monitoring and one-shot dynamic characterization becomes crucial for developing appropriate assessment strategies. Continuous monitoring enables real-time detection of structural changes and damage progression through repeated measurements over extended periods, achieving damage detection capability as low as 5% stiffness reduction through real-time assessment and environmental compensation [4]. Conversely, one-shot dynamic characterization provides baseline structural properties through focused experimental campaigns that can inform numerical model calibration and establish reference conditions for future assessments, typically requiring 15–25% stiffness changes for reliable detection but reducing operational costs significantly [5].
Modern non-destructive dynamic identification techniques, such as operational modal analysis (OMA), enable a comprehensive understanding of civil structures’ modal behavior without compromising structural integrity [6,7,8,9]. Recent systematic reviews of optimization algorithms for structural health monitoring demonstrate that enhanced genetic algorithms and modified particle swarm optimization variants now achieve superior convergence characteristics, with biology-based algorithms showing particular effectiveness for bridge applications [10]. However, despite these theoretical advances, practical implementation studies focusing on heritage masonry bridges remain limited, particularly those addressing the specific challenges of optimizing sensor configurations for three-arch historical structures. OMA, integrated with finite element method (FEM) analysis, can simulate structural behavior under real conditions and proves crucial for interpreting monitoring data and enabling potential damage detection [11]. This technique emerges as an excellent tool for characterizing historical masonry buildings, thereby enhancing the existing safety level of these structures [12,13]. The integration of OMA with other computational methodologies, such as FEM, significantly broadens the scope of structural investigation. However, model calibration remains essential, particularly for FEM applications where vibration-based model updating provides the foundation for accurate structural representation [14,15].
The field of sensor placement optimization has undergone a remarkable transformation, with comprehensive classification studies identifying six primary evaluation criteria: maximum vibration signal, maximum modal identification, minimum parameter identification error, data reconstruction error minimization, probability-based damage detection, and minimum energy consumption [16,17]. Advanced optimization frameworks now employ hybrid approaches combining simulated annealing with ensemble Kalman filtering, where GA-EnKF outperforms SA-EnKF in accuracy while SA-EnKF offers lower computational cost [18]. Recent developments in sensitivity analysis frameworks address modeling uncertainties through hierarchical clustering and Monte Carlo simulations, achieving a 10–15% improvement in damage detection sensitivity compared to conventional approaches [19]. While these methodologies provide robust theoretical foundations, there remains a significant gap in practical validation studies that demonstrate sensor optimization effectiveness specifically for masonry arch bridges under real operational conditions.
Accelerometer placement optimization is highly dependent on structural morphology and monitoring objectives. For composite steel–concrete bridges, positioning accelerometers along pylons rather than exclusively on the deck may prove beneficial [20], while masonry arch bridges require specialized strategies that account for their unique dynamic characteristics and heritage preservation constraints. Recent breakthrough results on heritage structures using improved genetic algorithms demonstrate a 9.16–28.24% reduction in optimization time while improving damage detection capability by 12–64% compared to conventional methods [21]. However, these studies primarily focus on single-arch or suspension bridge configurations, highlighting the need for dedicated research on multi-arch masonry bridges where structural complexity and modal interaction patterns differ significantly. The OMA monitoring methodology demonstrates universal applicability across structural typologies and materials. The fundamental frequencies recorded for reinforced concrete and steel structures typically differ by approximately an order of magnitude [22], reflecting the inherent material properties where cementitious conglomerates are more vulnerable to cracking due to low tensile strength [23]. Steel truss bridges require specialized approaches focusing on fatigue-critical locations and connection monitoring, with stiffness separation methods achieving reduced computational complexity through substructure analysis [24].
The Modal Assurance Criterion (MAC) serves as a fundamental parameter for assessing experimental result reliability and validating proposed methodologies for measuring frequency errors in masonry bridges [25]. Recent advances employ hypotrochoid spiral optimization algorithms for triaxial accelerometers using three MAC-based objective functions, demonstrating superior performance in modal independence assessment and sensor redundancy elimination [26]. Understanding the dynamic behavior of historical structures proves crucial for their preservation, with OMA offering powerful non-destructive monitoring capabilities that, when optimized with reduced accelerometer configurations, provide efficient and cost-effective structural health assessment solutions [27,28]. The validation of sensor optimization strategies through experimental campaigns on actual heritage structures represents a critical research need, as most existing studies rely primarily on numerical simulations without comprehensive field validation. Comparative analysis of experimental results from masonry [29] and reinforced concrete structural elements [30,31,32,33] with OMA identification outcomes provides powerful tools for numerical validation and model refinement.
Recent developments in wireless sensor network architectures have further enhanced the practical viability of reduced sensor configurations. Comprehensive analyses of wireless smart sensor networks demonstrate that multi-hop communication protocols achieve 7 kB/s data collection rates, with ZigBee protocol implementation extending sensor life from days to 160–168 days [34]. Advanced IoT integration with narrowband connectivity enables structural health monitoring systems that achieve 99.91% data transmission accuracy while supporting autonomous operation through energy harvesting capabilities [35]. These technological advances directly support the feasibility of optimized sensor deployments for heritage structures where traditional wired installations may prove impractical or invasive.
The implementation of reduced sensor arrays represents a paradigm shift toward cost-effective monitoring solutions, with particular relevance for heritage infrastructure where budget constraints often limit the extent of monitoring deployments. The adoption of fewer sensors, particularly low-cost MEMS accelerometers, results in significantly lower costs compared to traditional piezoelectric devices. The development of low-cost adaptable, reliable accelerometer (LARA) systems achieves 0.00005 m/s2 resolution using five aligned MEMS accelerometers with multiplexing to reduce noise density, operating effectively in the 0.1–165 Hz frequency range at significantly reduced cost compared to commercial alternatives [36]. Recent technological advances demonstrate that MEMS technologies enable unit cost reductions of up to 400% compared to previous generations while maintaining adequate accuracy and sensitivity levels [30]. Wireless networks combined with inexpensive MEMS devices [35,37] further reduce wiring and maintenance costs [38], with comprehensive analysis revealing that wireless sensor networks achieve an 80% cost reduction compared to traditional wired systems while maintaining comparable performance [39]. Installation of fewer accelerometers significantly reduces operational time, especially when utilizing intelligent architectures based on distributed storage or simple Ethernet networks [34]. Practical implementations, such as the Serra Cazzola viaduct in Sicily, demonstrate efficient setup time reduction through locally synchronized MEMS sensors, with each span initially equipped with 6 triaxial accelerometers [40].
Practical implementations of high-density accelerometer arrays have demonstrated that strategic optimization can significantly reduce installation complexity while maintaining monitoring effectiveness. Recent deployments on major infrastructure projects show that systems with substantial sensor counts benefit from intelligent architecture optimization, with locally synchronized configurations proving particularly effective for span-based monitoring approaches [41]. The evolution toward distributed fiber optic sensing systems provides additional validation for optimized sensor placement strategies, with successful implementations on masonry arch rail bridges enabling quantified analysis of dynamic loading while maintaining non-invasive installation requirements [42].
Contemporary research reveals that optimized sparse sensing approaches achieve damage detection sensitivities within 10–15% of full-scale deployments while reducing costs by 40–60% [43]. Fisher Information-based optimization maximizes damage detectability while minimizing sensor count, showing a 35–40% improvement in damage detection probability for critical structural components [43]. Digital twin systems integrating wireless MEMS accelerometers with IoT infrastructure achieve 99.99% ROC-AUC for anomaly detection using LightGBM classifiers, with hybrid edge-cloud architectures reducing costs by 80% compared to traditional wired systems [36]. However, the translation of these optimization principles to heritage masonry bridges requires specialized consideration of structural morphology, modal characteristics, and practical constraints that differentiate such structures from modern bridge designs.
The practical application of sensor optimization extends beyond simple cost reduction to encompass comprehensive monitoring strategy development. Recent research on limited roving sensor methodologies demonstrates that strategic sensor positioning can effectively monitor bridges subjected to random traffic loading, providing validation for reduced sensor array effectiveness under realistic operational conditions [44]. Multi-objective optimization frameworks now specifically address masonry bridge model calibration, incorporating uncertainty quantification and parameter identification strategies that directly support the validation of sensor reduction approaches [25]. These developments confirm the scientific validity of systematic sensor reduction strategies when properly implemented and validated through comprehensive experimental programs.
Formal optimization methodologies now incorporate multi-objective frameworks balancing damage sensitivity, measurement uncertainty, and cost considerations through NSGA-III algorithms handling 3–15 objectives simultaneously [45]. Advanced sensitivity analysis employs Fisher Information Matrix optimization for quantifying measurement information content, eigenvector sensitivity approaches for modal parameter analysis, and local sensitivity matrices for forward uncertainty propagation [19]. Optimal sensor placement methodologies for parametric identification utilize comprehensive frameworks that ensure maximum damage detectability while minimizing parameter identification errors [46]. Despite these theoretical advances, practical implementation studies that validate optimization effectiveness through systematic experimental reduction from comprehensive sensor arrays to minimal configurations remain scarce in the literature, particularly for heritage masonry structures.
The convergence of artificial intelligence, digital twin technologies, and advanced sensor networks creates unprecedented capabilities for autonomous structural assessment. Machine learning-enhanced Fisher Information Matrix approaches integrate explainability through SHAP (SHapley Additive exPlanations) for optimal sensor placement, while deep reinforcement learning frameworks formulate optimization as Markov decision processes, demonstrating superior performance over traditional algorithms [47]. Digital twin architectures integrate real-time sensor data with 500 Hz sampling rates for instantaneous structural analysis and adaptive sensor configuration optimization based on evolving structural conditions [48]. However, the practical application of these advanced computational frameworks to heritage structures requires experimental validation that considers the unique challenges of masonry arch bridges, including their distinctive modal patterns, environmental sensitivity, and preservation constraints.
Within this rapidly evolving technological landscape, the present study addresses a critical gap in the literature by providing comprehensive experimental validation of sensor optimization strategies specifically for historical masonry arch bridges. The objective is to demonstrate how the number of accelerometers required for dynamic identification of such structures can be systematically optimized through strategic sensor placement, validated through actual field measurements rather than numerical simulation alone. The case study focuses on the Santa Teresa bridge (STb) in Bitonto, a representative three-arch masonry structure that provides an ideal testbed for developing and validating practical optimization frameworks. This research contributes essential empirical evidence supporting the effectiveness of reduced sensor configurations for heritage bridge assessment, establishing practical optimization strategies that minimize instrumentation requirements while maintaining measurement reliability. The validation methodology employed in this study incorporates measurement-system design principles that combine information from dynamic excitations, following established frameworks for optimal sensor configuration validation [35]. Recent advances in modal kinetic energy-based sensor placement optimization provide theoretical foundations for understanding the effectiveness of reduced sensor arrays in capturing essential structural dynamics [49].
The systematic approach from comprehensive to minimal sensor configurations enables quantitative assessment of the trade-offs between sensor reduction and measurement accuracy, addressing a critical need identified in contemporary research. The systematic approach from a 28-accelerometer reference configuration through multiple reduced configurations provides a useful experimental validation of sensor optimization principles, thereby enabling evidence-based cost-effective monitoring solutions for heritage infrastructure preservation.
The objective of this study is to identify the natural frequencies of a three-arch masonry bridge, optimizing the number of accelerometers. The case study is a historical bridge in Bitonto: the Santa Teresa bridge (STb). This study provides a framework for performing accurate monitoring using fewer sensors. This result was achieved by identifying the natural frequencies and mode shapes observed in the case study. The optimization was performed following a heuristic approach and comparing the natural frequency values and mode shapes of the bridge to identify the most relevant accelerometers. This research aims to demonstrate that it is possible to minimize the instrumentation required while still obtaining consistent results. This reduction in equipment allows for a streamlining of instrumentation and a consequent reduction in the costs of monitoring existing structures.
2. Framework and Novelty
This study seeks to address the effectiveness and efficiency of structural monitoring of historic masonry bridges through dynamic identification. The main aim is to develop and validate a practical approach for sensor placement optimization, demonstrating that a reduced number of accelerometers can provide reliable modal parameters in comparison to high-density acquisition.
This paper is structured as follows: Section 3 introduces the experimental setup of the Santa Teresa bridge, including the detailed specifications of the instrumentation and sensor assembly configurations. Section 4 presents the experimental methodology and the results of the dynamic characterization tests, including the frequency identification through different sensor configurations and the comprehensive analysis of the modal displacement patterns. Section 5 discusses the optimization outcomes, comparing the effectiveness of reduced sensor arrays through quantitative metrics of performance, including frequency accuracy and modal assurance criterion analysis. Finally, Section 5 presents conclusions, emphasizing practical implications for the assessment of historic bridges and making recommendations for future research directions in sensor optimization for masonry arch bridges.
This paper is innovative for several reasons. Unlike most studies that rely exclusively on numerical simulations, this investigation uses an extensive experimental campaign with 28 accelerometers as a “ground truth” condition to validate the effectiveness of a reduced sensor array. This data-driven approach provides concrete evidence that optimized configurations can maintain an accuracy equivalent to high-density ones, but with significantly lower installation complexity and cost. The study addresses a common challenge in structural monitoring: the need for analysis under realistic operational conditions. The application of an optimization approach to a masonry structure subjected to random traffic loading demonstrates the robustness of the proposed research. The research validates the effectiveness of reduced configurations in operational scenarios, overcoming the limitations of controlled-load experimental campaigns.
The study specifically addresses optimization strategies for preliminary dynamic characterization aimed at establishing accurate baseline properties for heritage masonry bridges. The optimized sensor configurations developed can subsequently be implemented for periodic reassessment campaigns (typically at 5-year intervals) to enable long-term structural health monitoring through comparison with established baseline measurements.
3. Experimental Setup of the STb
The bridge considered in the present study is an Italian arch bridge in limestone, Santa Teresa bridge (STb) in Bitonto (BA) (see Figure 1). The bridge is made of three arches, with the central one bigger than the others. The overall design of STb is strictly symmetrical with respect to its vertical and barycentric axes, as detailed in [50], which reports the survey campaign carried out.
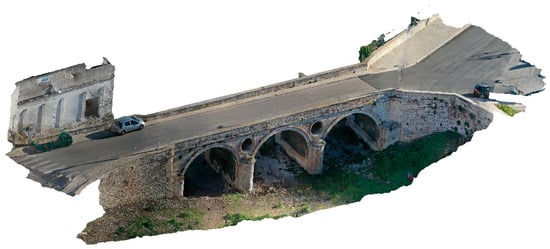
Figure 1.
General visualization of the monitored STb in Bitonto.
Initially, 28 uniaxial accelerometers were used to monitor the STb, positioned at various positions on both sides of the bridge. In particular, 22 of these were vertically oriented to capture vibration frequencies in the Z-direction, while the remaining 6 were set up to monitor frequencies in the transverse Y-direction. Figure 2 provides top (a) and side (b) views detailing the placement of both uniaxial and biaxial accelerometers. More information regarding the experimental setup can be found in previous studies [6,51]. Looking in the direction of the X-axis, it is possible to state that the arches on the left side are numbered from 12 to 22, while the arches on the right side are numbered from 1 to 11 in relation to the bridge deck.
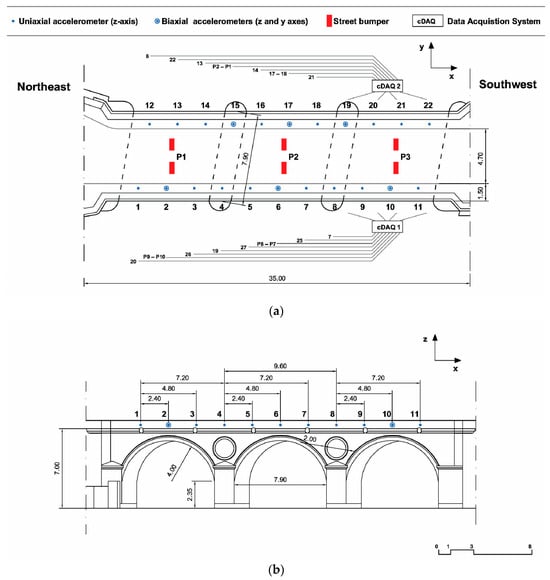
Figure 2.
Schematic illustration of the plan (a) and facade (b) placement of accelerometers for the STb experimental campaign [51].
Within the scope of this scientific investigation, the reference configuration (baseline) for STb monitoring was defined by the deployment of 28 accelerometers. Alternative experimental configurations, characterized by a reduced number of accelerometers, specifically 13, 8, 6, and 4, represent optimized scenarios. The data acquired from these latter scenarios were systematically compared to those obtained from the reference configuration, with the objective of evaluating their comparative performance and efficiency in detecting natural frequency and modal displacement. In all considered scenarios, accelerometers were positioned at the top of the central arch. Only in the scenario with No. 6 accelerometers, the sensors were placed at the top of the keystones of all three arches. The sensor reduction strategy employs a systematic heuristic optimization approach that evaluates structural behavior and modal characteristics to guide sensor placement decisions. This approach incorporates an iterative assessment of modal participation factors, identification of structurally critical locations, and quantitative evaluation of measurement effectiveness to determine optimal sensor configurations for different accuracy requirements.
Instrumentation and Sensor Assembly
The dynamic characterization employed 28 individual uniaxial accelerometers (Model 393B31, PCB Piezotronics) with the following specifications: sensitivity 10.0 V/g (±5%), frequency range 0.1–200 Hz (±5%), and broadband resolution 0.000001 g rms. These uniaxial sensors were assembled into different measurement configurations using custom aluminum mounting cubes that enable flexible monoaxial, biaxial, and triaxial arrangements depending on the specific measurement requirements at each location. The total of 28 accelerometers was distributed across 22 measurement points, with 22 sensors oriented vertically (Z-direction) and 6 sensors positioned horizontally (Y-direction) at strategic locations. This assembly approach explains the apparent discrepancy between the total number of accelerometers (28) and the number of visible measurement points in Figure 2, where multiple sensors may be co-located at single spatial coordinates but oriented in different directions.
4. Experimental Results from Environmental Tests
4.1. Methodology and Reference Configuration
To ensure comparability of the test results from the STb, identical methodological measurement techniques were employed for each measurement. Data acquisitions were performed under both ambient conditions and forced vibrations induced by a heavy vehicle passing on the bridge deck. Each acquisition lasted 13–15 min for the ambiental acquisitions while 25 s for the forced ones. The forced vibration tests employed a commercial heavy vehicle with a total mass of approximately 3.5 tonnes, traveling at 30 km/h along the bridge centerline. The vehicle passage provided controlled excitation conditions, with multiple crossings recorded to ensure measurement consistency across all sensor configurations. Of the total recordings obtained for the STb, only the results of three forced inputs will be considered in this study; however, comprehensive results are available in previous publications [6,51]. Given the substantial mass and inherent damping characteristics of the historical masonry bridge, forced vibration tests were selected over ambient measurements to ensure adequate excitation of the structural modes. The heavy vehicle loading provided sufficient energy input to clearly identify the natural frequencies across all sensor configurations, while ambient excitation proved insufficient to generate measurable responses in the reduced sensor arrays. This methodological choice ensured consistent and repeatable test conditions essential for comparing different sensor configurations. The selection of forced vibration testing over ambient measurements was based on multiple technical considerations. The massive masonry structure requires significant excitation energy to generate measurable responses above ambient noise levels, particularly for the reduced sensor configurations investigated. Heavy vehicle loading represents the most critical operational condition for bridge safety assessment and provides controlled, repeatable excitation conditions essential for comparative analysis across different sensor arrangements. Additionally, forced vibration tests enable acquisition times of 25 s compared to 13–15 min required for ambient measurements, significantly reducing the cost and logistical complexity of dynamic characterization campaigns. Comprehensive ambient vibration analysis for this structure has been previously documented [6,51], confirming that forced excitation provides optimal modal identification for masonry arch bridges. It is important to underline that even if not all the acquisitions carried out in the experimental campaign were considered, the results presented in this study were sufficient for the dynamic identification of the structure. For this purpose, Artemis Modal software was utilized, enabling data analysis through the powerful operational modal analysis (OMA) technique, specifically Stochastic Subspace Identification with eXtended Un-weighted Principal Component (SSI-UPCX). The optimization analysis utilized post-processing of simultaneously recorded data from all 28 accelerometers, with reduced configurations simulated by selecting appropriate subsets of measurement channels. This methodology ensures identical excitation conditions across all analyzed configurations, eliminating variability due to different test sessions and enabling direct comparison of sensor arrangement effectiveness. The reduced configurations (13, 8, 6, and 4 accelerometers) were selected based on strategic positioning criteria that prioritize locations with maximum modal participation and structural significance. The summarized results for the STb are presented in Table 1 and Table 2, respectively. In columns 2, 3 and 4 of Table 1 and Table 2, the first 5 recorded frequencies in Hz are shown. The fifth column of each Table displays the main modal shapes of each mode. The first three vibration modes are visualized in Figure 3. The latter illustrates the direction of the measurement positions and the first three vibration modes of the STb, as recorded in Test 3. The aim of this study is to reduce the total number of accelerometers used for monitoring existing bridges. This aim will be pursued by demonstrating how it is possible to optimize the number of accelerometers, allowing for the acquisition of the same data that could be achieved with a large number of measurement instruments.

Table 1.
Identified frequencies (Hz) for the STb, obtained from three tests utilizing 28 accelerometers [6,51].
Table 2.
Identified frequencies (Hz) of the STb, obtained from forced tests utilizing 28, 13, 8, 6 and 4 accelerometers.
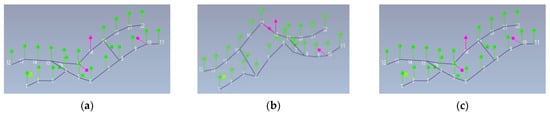
Figure 3.
Visualization of the first (a), the second (b) and the third (c) identified mode of the STb during Test 3 for the reference configuration (28 accelerometers) [6,51].
The average value between the frequencies of the three tests was compared with each one individually, and the test with the smallest frequency deviation was considered. This deviation was chosen to compare the frequency values of the other tests with those of the subsequent scenarios optimized with a reduced number of accelerometers. In this case, study, the mean values of the 3 tests were considered for the comparison with the other optimizations.
All identified modes exhibit predominantly vertical displacement patterns, consistent with the expected dynamic behavior of masonry arch bridges under vertical excitation. This vertical character of the modal response validates the effectiveness of vertically oriented sensor arrangements in capturing the essential dynamic characteristics of the structure.
4.2. Identification of the Vibration Modes in the Optimized Scenarios
The sensor optimization employed a systematic, heuristic iterative procedure appropriate for the manageable parameter space of this three-arch bridge configuration. The approach systematically evaluated each sensor configuration by ranking positions according to modal kinetic energy distribution, structural criticality, and measurement sensitivity criteria. Performance assessment at each iteration included frequency identification accuracy and modal correlation evaluation, with sensor reduction continuing until predetermined thresholds were approached. This iterative approach enabled identification of minimum sensor requirements while maintaining quantitative validation against the reference configuration.
MAC analysis was not implemented for cross-configuration comparison due to inherent mathematical limitations when comparing modal shapes with different measurement point distributions. The normalization properties of the MAC index and the spatial inconsistency between configurations would compromise the reliability of comparative assessments. This represents a methodological limitation that future research could address through the development of correlation metrics specifically designed for variable sensor array comparisons.
It was found, for the STb, that placing accelerometers exclusively along the keystones of the bridge deck was sufficient for an accurate modal analysis. Neglecting measurements from positions near the piers of the bridge did not result in a significant variation in the vibration modes of the structure. Accelerometers could only be positioned along the two sides of the deck, in proximity to the two arches of the central vault. Table 2 contains all identified frequency values in each accelerometer configuration from 28 to 13, 8, 6 and 4. The modal shape for each identified frequency in all optimized configurations consistently coincides with that of the reference configuration. As expected, an exception is observed solely in the configuration employing 6 accelerometers, where the modal shape is vertical for all identified frequencies. Figure 4a–c correspond to the frequency values collected in the previous tables. They display the dynamic identification of each optimization of the STb performed with Artemis.
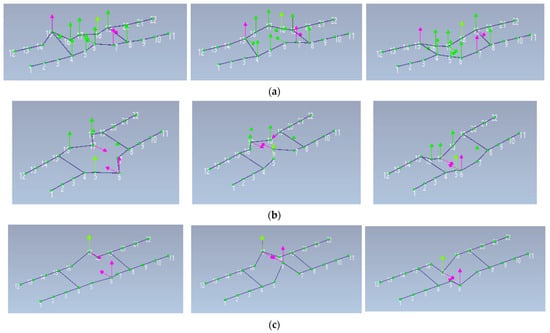
Figure 4.
Visualization of the first three identified modes of the optimizations with 13 (a), 8 (b) and 4 (c) accelerometers placed near the main central arch of STb.
The frequency variations observed across different sensor configurations require evaluation from an engineering perspective. Specifically, the percentage errors relative to the reference 28-accelerometer setup are as follows: 13-accelerometer configuration shows a maximum error of 5.5% (Mode 2), 8-accelerometer configuration exhibits a maximum error of 2.2% (Mode 1), 6-accelerometer configuration presents a maximum error of 14.1% (Mode 1), and 4-accelerometer configuration displays a maximum error of 18.5% (Mode 1). For historical masonry structures, frequency variations within 10–15% are generally acceptable for structural characterization and model updating purposes. The trade-off analysis demonstrates that configurations with 8 or more accelerometers maintain engineering accuracy suitable for most monitoring applications.
Figure 5 shows an even further optimization of accelerometer placement, reducing the number to 6. These accelerometers are positioned near the six keystones of the arches that delineate the three vaults, but only in the Z-direction. Conversely, as with previous optimizations, it is evident that the frequency values closely align with those from optimization that used No. 28, 13, 8, and 4 accelerometers, respectively, placed only along the central arch. Figure 5 shows the three main vibration modes related to the recordings obtained with the optimization using 6 accelerometers placed at the keystone.
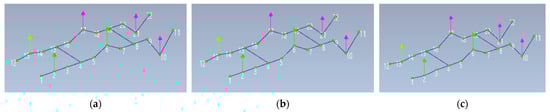
Figure 5.
Visualization of Mode 1 (a), Mode 2 (b) and Mode 3 (c) of the fourth optimization with 6 accelerometers.
From Figure 5, it is possible to observe that the deformed configurations of the first 3 modes coincide. In each graphical representation of the vibration mode, no interpolations of the vibration shape were performed; rather, deformations were identified exclusively at the nodes where the measuring instruments were placed. This is why the only nodes that show displacement are those where the accelerometers were positioned. This happens in all optimized configurations, and in the optimization with 6 accelerometers, the distance between the nodes where the measuring instrument was placed is more evident.
4.3. Identification of the Frequencies in the Optimized Scenarios
To gain a more comprehensive understanding of the variability in each vibration mode across all monitored nodes, the normalized displacement values were compared for every optimization scenario. It should be noted that the normalization of displacements with respect to Y and Z translations was conducted exclusively for Mode 1. This outcome is attributable to the fact that it was the unique mode displaying a translational modal shape in the Y-axis. In contrast, higher vibration modes (2, 3, 4, and 5) exhibited a predominance of vertical displacements along the Z-axis, consequently resulting in the plotting of displacements exclusively in the vertical direction. In the optimization with 13 accelerometers, in nodes 4, 5, 7, 8, 16, and 18, nodal displacements were measured only in the Z-axis direction and not in the Y-direction; so, the displacement in the Y-axis direction was not considered. Similarly, for each optimization and for each vibration mode in the Y-direction, only values at nodes 2, 6, 10, 15, 17, and 19 were considered, as measurement accelerometers were present exclusively at these positions. Table 3 contains the results of the normalized displacement for Mode 1 in each node and for the configurations with 28, 13, 8 and 4 accelerometers. Figure 6 shows the graphical behavior of the normalized Y-axis displacements in absolute value of Mode 1.
Table 3.
Mode 1 normalized displacements in the Y-axis in the optimized scenarios with 13, 8 and 4 accelerometers.
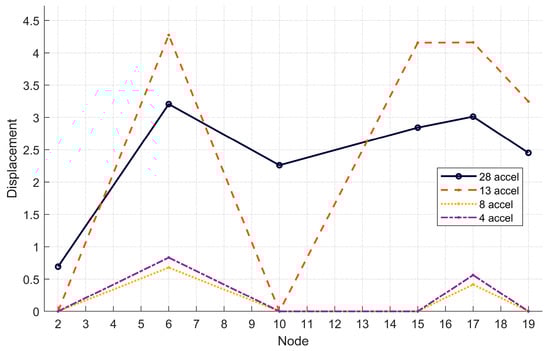
Figure 6.
Mode 1—Visualization of the Y-axis in absolute value for the optimized scenarios with 13, 8 and 4 accelerometers.
Table 4 and Figure 7 contain the normalized displacement values in the Z-direction for Mode 1. As can be observed, compared to the displacements in the Y-direction, the quantity of recorded data is significantly larger. The scenarios with 13, 8, 6, and 4 accelerometers show peaks at nodes 6, 10, 15, and 21. In the central arch area (near node 6), the displacement values recorded with optimized scenarios better approximate those of the reference configuration.
Table 4.
Mode 1—Normalized displacements in the Z-axis for each optimized scenario.
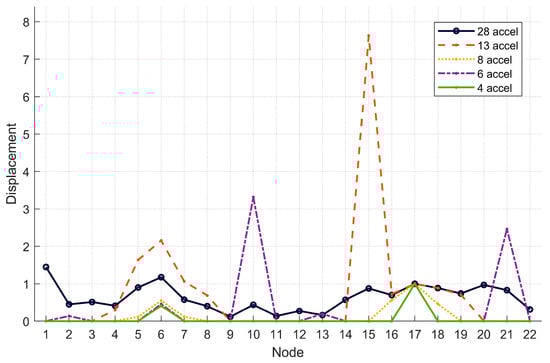
Figure 7.
Mode 1—Visualization of the Z-axis normalized displacements in absolute value for each optimized scenario.
Table 5 and Figure 8 present the normalized displacement values in the Z-direction for Mode 2. In this case, by using only 6 accelerometers and without considering the outliers in nodes 10 and 21, it is possible to rebuild the components of vibration Mode 2 with good approximation. At node 10, the normalized displacement value obtained by placing 6 accelerometers at the keystone segments of the three arches exactly matches that recorded in the reference configuration with 28 accelerometers.
Table 5.
Mode 2—Normalized displacements in the Z-axis for each optimized scenario.
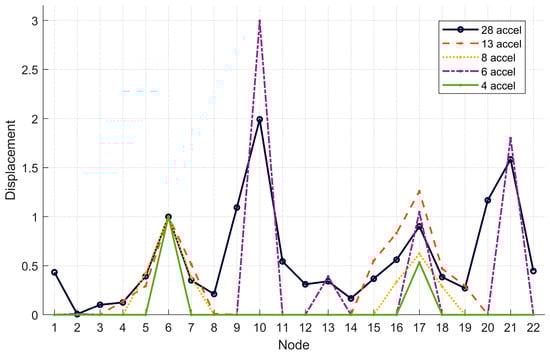
Figure 8.
Mode 2—Visualization of the Z-axis normalized displacements in absolute value for each optimized scenario.
The normalized displacement values for all configurations for Modes 3, 4, and 5 are included in Table 6, Table 7 and Table 8, respectively. Their corresponding absolute values are graphically represented in Figure 9, Figure 10 and Figure 11, respectively.
Table 6.
Mode 3—Normalized displacements in the Z-axis for each optimized scenario.
Table 7.
Mode 4—Normalized displacements in the Z-axis for each optimized scenario.
Table 8.
Mode 5—Normalized displacements in the Z-axis for each optimized scenario.
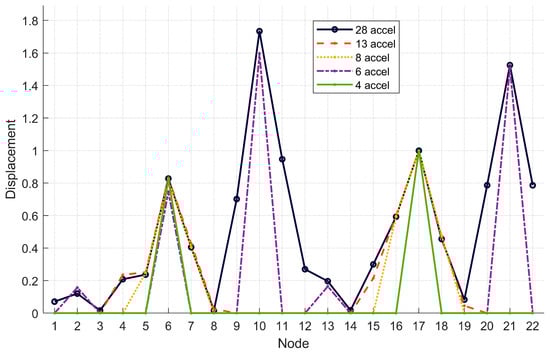
Figure 9.
Mode 3—Visualization of the Z-axis normalized displacements in absolute value for each optimized scenario.
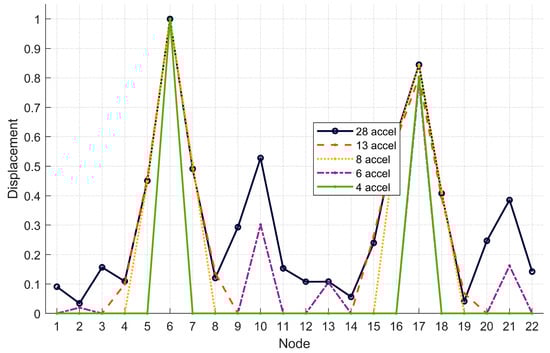
Figure 10.
Mode 4—Visualization of the Z-axis normalized displacements in absolute value for each optimized scenario.
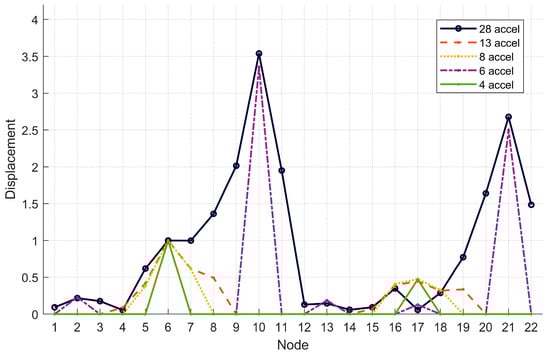
Figure 11.
Mode 5—Visualization of the Z-axis normalized displacements in absolute value for each optimized scenario.
In Mode 3, the optimization with 6 accelerometers proves to be the best; the main error between the displacements is within 10%. This is because, for all nodes where an accelerometer is present, the displacement values align with those recorded in the reference configuration. The fact that the 13-accelerometer configuration does not reconstruct the main components of Mode 3 is due to the accelerometers not being placed at the keystones of the two lateral vaults.
Unlike the previous cases, Figure 10 shows that for Mode 4 the best optimized scenario appears to be the one with 13 accelerometers. In fact, except for nodes where no accelerometer was placed, in the central sections of the bridge, the 13-accelerometer scenario perfectly follows the dashed line. Nevertheless, even the configuration with 6 accelerometers placed at the keystones also closely follows the displacements measured in the reference configuration.
Mode 5 is correctly recorded in the scenario with 6 accelerometers. In this case, unlike the previous vibration modes, the other optimizations are not reasonable. None, except for the one with 6 accelerometers placed at the keystone, correctly reconstructs the normalized displacements recorded with 28 accelerometers. In particular, by eliminating the outlier of 0.128 at node 17, the configuration with 6 accelerometers shows an average measurement error of approximately 9%.
5. Conclusions
Through a case study of a historical masonry bridge, this study investigates how reducing the number of measurement accelerometers yields analogous results. A dynamic identification performed with 28 accelerometers on the STb shows no substantial differences compared to 3 subsequent optimizations in which 13, 8 and 4 accelerometers were, respectively, placed along only the central arch, if only the natural frequencies are considered. Furthermore, even changing the position of the accelerometers from the central arch to the keystone sections showed that the frequencies remained very close to each other. Using only 4 or 6 accelerometers on the central arch and on the keystone, respectively, the values of the first frequency result to be different by more or less 10%. Therefore, through a heuristic approach, it can be shown that deformations could be recorded correctly even with the smallest number of accelerometers.
Comparing the four optimized scenarios, those that came closest to matching the 28 accelerometers were the one with 13 and the one with 6 accelerometers for different aspects. Optimization with 13 accelerometers offers the best optimization to the identification of the STb frequencies but also the shape of the mode, with a lower number the accuracy of the shape is lost. Observing the normalized displacements for each vibration mode and every optimization, the 6-accelerometer configuration stands out as the best. In fact, to accurately record the displacements of almost all vibration modes, it would be sufficient to strategically place 6 accelerometers at the keystones of each arch in the bridge to correctly capture the structure’s deformed configuration. The displacements of Modes 3 and 5 were found to be the most correctly identified through the 6-accelerometer configuration. For these, in fact, the percentage measurement error was around 10%. Unlike the displacements in the Z-direction, those in the Y-direction (transverse to the bridge) were not estimated with the same precision through the different optimized configurations.
This instrumental optimization offers several advantages. Primarily, it leads to a significant reduction in the costs associated with monitoring existing structures. It also decreases measurement time, as the installation of much fewer accelerometers is less demanding. A larger quantity of data implies a level of precision that, from an engineering perspective and considering the time constraints in professional practice, is unnecessary. Naturally, a complete understanding of the structure under investigation is required to precisely determine the accelerometer placement. In the context of this study, the most intelligent strategic choice for accelerometer placement along the bridge deck was clearly the most deformable central zone, specifically near the central arch. In addition, recording with discrete monitoring takes on another major benefit related to the durability of the measuring instrument. By interrupting the measurement at each recording, it is possible to avoid damage to the accelerometer itself, which, by remaining connected and active for less time, would be preserved from possible instrumental deterioration. The sensor optimization strategies developed in this study provide a foundation for cost-effective preliminary assessment that can be repeated at regular intervals to track structural condition changes over time, thereby enabling practical monitoring programs for heritage infrastructure. The sensor optimization principles demonstrated in this study show potential for application to similar masonry arch bridges, particularly those with comparable structural morphology and material characteristics. The strategic placement approach focusing on arch keystones reflects fundamental structural behavior patterns common to masonry arch bridges. However, the specific sensor configurations and reduction ratios identified should be validated for different span lengths, arch geometries, and masonry materials before general application. The approach provides a systematic framework that can be adapted to different heritage bridge assessments while maintaining the core principles of strategic placement and quantitative performance evaluation.
In the future, this approach should be extended to bridges with different numbers of arches, span configurations, and masonry materials to establish broader applicability guidelines. Additionally, comparative studies across different heritage bridge types would help identify universal principles versus structure-specific optimization requirements, ultimately leading to standardized approaches for heritage bridge assessment. Future research directions should explore the extension of these optimization strategies to ambient vibration monitoring scenarios. While the current study demonstrates the effectiveness of sensor reduction under controlled excitation conditions, the development of similar optimization frameworks for ambient monitoring would further enhance the practical applicability of these findings for long-term structural health monitoring programs. The principles established in this work provide a foundation for such developments, particularly regarding the strategic placement of sensors at structurally critical locations such as arch keystones.
Author Contributions
Conceptualization, C.G.C. and M.F.S.; methodology, M.F.S. and F.R.; software, C.G.C. and F.R.; validation, C.G.C. and M.F.S.; formal analysis, C.G.C. and M.F.S.; investigation, M.F.S. and F.R.; resources, M.F.S. and F.R.; data curation, C.G.C. and M.F.S.; writing—original draft preparation, C.G.C.; writing—review and editing, C.G.C. and M.F.S.; visualization, C.G.C.; supervision, C.G.C., M.F.S. and F.R.; project administration, M.F.S.; funding acquisition, F.R. All authors have read and agreed to the published version of the manuscript.
Funding
This research was funded by Project CSLLPP/ReLUIS REP. n.3561 and the S-MoSES (Smart Monitoring for Safety of Existing Structures and Infrastructures) Project (Research Project of National Interest, PRIN2020) by the MUR (Italian Ministry of University and Research). This essential funding was pivotal for executing the extensive experimental campaigns, acquiring the advanced instrumentation, and performing the subsequent data analysis presented herein. Without this support, the research could not have been completed.
Data Availability Statement
The original contributions presented in this study are included in the article. Further inquiries can be directed to the corresponding author.
Acknowledgments
The financial support provided through the S-MoSES (Smart Monitoring for Safety of Existing Structures and Infrastructures) Project (Research Project of National Interest, PRIN 2020) by the MUR (Italian Ministry of University and Research) is gratefully acknowledged.
Conflicts of Interest
The authors declare no conflicts of interest.
References
- Borlenghi, P.; Gentile, C.; D’Angelo, M.; Ballio, F. Long-Term Monitoring of a Masonry Arch Bridge to Evaluate Scour Effects. Constr. Build. Mater. 2024, 411, 134580. [Google Scholar] [CrossRef]
- La Scala, A. Ancient Solutions for Modern Challenges: Structural Analysis of Roman Ventilated Facade Systems. Buildings 2025, 15, 3229. [Google Scholar] [CrossRef]
- Rizzo, F.; Barbato, M.; Sepe, V. Shape Dependence of Wind Pressure Peak Factor Statistics in Hyperbolic Paraboloid Roofs. J. Build. Eng. 2021, 44, 103203. [Google Scholar] [CrossRef]
- Rizzo, P.; Enshaeian, A. Challenges in Bridge Health Monitoring: A Review. Sensors 2021, 21, 4336. [Google Scholar] [CrossRef]
- Riasat Azim, M.; Gül, M. Damage Detection of Steel-Truss Railway Bridges Using Operational Vibration Data. J. Struct. Eng. 2020, 146, 04020008. [Google Scholar] [CrossRef]
- Foti, D.; Giannoccaro, N.I.; Rizzo, F.; Sabbà, M.F.; La Scala, A.; Mansour, S. Dynamic Characterization of a Squat Historical Bridge by Considering Vehicle-Bridge Interaction. In Proceedings of the International Operational Modal Analysis Conference; Naples, Italy, 22–24 May 2024, Springer: Cham, Switzerland, 2024; pp. 493–504. [Google Scholar]
- Bel-Hadj, Y.; Weil, M.; Weijtjens, W.; Devriendt, C. Experimental Validation of Automated OMA and Mode Tracking for Structural Health Monitoring of Transmission Towers. Struct. Health Monit. 2025, 24, 1272–1291. [Google Scholar] [CrossRef]
- Foti, D.; Giannoccaro, N.I.; Diaferio, M.; Ivorra, S. Structural Identification and Numerical Models for Slender Historical Structures. In Handbook of Research on Seismic Assessment and Rehabilitation of Historic Structures; IGI Global: Hershey, PA, USA, 2015; pp. 674–703. ISBN 9781466682870. [Google Scholar]
- Diaferio, M.; Foti, D.; Gentile, C.; Ivan Giannoccaro, N.; Saisi, A.E. Dynamic Testing of a Historical Slender Building Using Accelerometers and Radar. In Proceedings of the 6th International Operational Modal Analysis Conference; Gijon, Spain, 12–14 May 2015, EDICIONES UNIV OVIEDO, SERV PUBLICACIONES UNIV OVIEDO, CAMPUS HUMANIDADES: Oviedo, España, 2015; pp. 1–10. [Google Scholar]
- Hassani, S.; Dackermann, U. A Systematic Review of Optimization Algorithms for Structural Health Monitoring and Optimal Sensor Placement. Sensors 2023, 23, 3293. [Google Scholar] [CrossRef]
- Ferrara, M.; Bertagnoli, G.; Giordano, L. Model Updating of Different Bridge Types Using Ambient Vibration and OMA Identification. Procedia Struct. Integr. 2024, 62, 773–780. [Google Scholar] [CrossRef]
- Diaferio, M.; Foti, D.; La Scala, A.; Sabbà, M.F. Selection Criteria of Experimental Setup for Historical Structures. In Proceedings of the 2021 AEIT International Annual Conference (AEIT), Milan, Italy, 4–8 October 2021; pp. 1–6. [Google Scholar]
- Bru, D.; Ivorra, S.; Baeza, F.J.; Reynau, R.; Foti, D. OMA Dynamic Identification of a Masonry Chimney with Severe Cracking Condition, IOMAC’15. In Proceedings of the 6th International Operational Modal Analysis Conference, Gijón, Spain, 12–14 May 2015; pp. 1–8. [Google Scholar]
- Borlenghi, P.; Saisi, A.; Gentile, C. Determining Structural Models of a Masonry Tower from Architectural Research and Operational Modal Analysis. J. Build. Eng. 2025, 111, 113347. [Google Scholar] [CrossRef]
- Rizzo, F.; Caracoglia, L.; Piccardo, G. Examining Wind-Induced Floor Accelerations in an Unconventionally Shaped, High-Rise Building for the Design of “Smart” Screen Walls. J. Build. Eng. 2021, 43, 103115. [Google Scholar] [CrossRef]
- Sun, Z.; Mahmoodian, M.; Sidiq, A.; Jayasinghe, S.; Shahrivar, F.; Setunge, S. Optimal Sensor Placement for Structural Health Monitoring: A Comprehensive Review. J. Sens. Actuator Netw. 2025, 14, 22. [Google Scholar] [CrossRef]
- Chang, M.; Pakzad, S.N. Optimal Sensor Placement for Modal Identification of Bridge Systems Considering Number of Sensing Nodes. J. Bridge Eng. 2014, 19, 04014019. [Google Scholar] [CrossRef]
- Nasr, D.; Dahr, R.E.; Assaad, J.; Khatib, J. Comparative Analysis between Genetic Algorithm and Simulated Annealing-Based Frameworks for Optimal Sensor Placement and Structural Health Monitoring Purposes. Buildings 2022, 12, 1383. [Google Scholar] [CrossRef]
- Yang, C. An Adaptive Sensor Placement Algorithm for Structural Health Monitoring Based on Multi-Objective Iterative Optimization Using Weight Factor Updating. Mech. Syst. Signal Process 2021, 151, 107363. [Google Scholar] [CrossRef]
- Diaferio, M.; Foti, D.; La Scala, A.; Sabbà, M.F. Design of the Set-up for Ambient Vibration and Dynamic Forced Tests on a Cable-Stayed Bridge. In Proceedings of the 2021 AEIT International Annual Conference (AEIT), Milan, Italy, 4–8 October; pp. 1–5.
- Guo, H.Y.; Zhang, L.; Zhang, L.L.; Zhou, J.X. Optimal Placement of Sensors for Structural Health Monitoring Using Improved Geneticalgorithms. Smart Mater. Struct. 2004, 13, 528. [Google Scholar] [CrossRef]
- Foti, D.; Giannoccaro, N.I.; Sabbà, M.F.; La Scala, A. Dynamic Identification of a Strategic Building of the Sixties with a Mixed Structure. Procedia Struct. Integr. 2023, 44, 782–789. [Google Scholar] [CrossRef]
- Coviello, C.G.; La Scala, A.; Sabbà, M.F.; Carnimeo, L. On the Cementitious Mixtures Reinforced with Waste Polyethylene Terephthalate. Materials 2024, 17, 5351. [Google Scholar] [CrossRef]
- Xiao, F.; Mao, Y.; Sun, H.; Chen, G.S.; Tian, G. Stiffness Separation Method for Reducing Calculation Time of Truss Structure Damage Identification. Struct. Control Health Monit. 2024, 2024, 5171542. [Google Scholar] [CrossRef]
- Barros, B.; Conde, B.; Cabaleiro, M.; Solla, M.; Riveiro, B. Multi-Objective Optimization-Based Model Calibration of Masonry Bridges. Case Stud. Constr. Mater. 2023, 19, e02306. [Google Scholar] [CrossRef]
- Mahjoubi, S.; Barhemat, R.; Bao, Y. Optimal Placement of Triaxial Accelerometers Using Hypotrochoid Spiral Optimization Algorithm for Automated Monitoring of High-Rise Buildings. Autom. Constr. 2020, 118, 103273. [Google Scholar] [CrossRef]
- Faridi, M.A.; Kuncham, E.; Roy, K.; Singhal, V. Using Limited Roving Sensors to Monitor Bridge Subjected to Random Traffic Load. J. Civ. Struct. Health Monit. 2024, 14, 693–710. [Google Scholar] [CrossRef]
- Wang, Y.; Chen, Y.; Yao, Y.; Ou, J. Advancements in Optimal Sensor Placement for Enhanced Structural Health Monitoring: Current Insights and Future Prospects. Buildings 2023, 13, 3129. [Google Scholar] [CrossRef]
- Foti, D.; Diaferio, M.; Vacca, V.; Sabbà, M.F.; La Scala, A. Parameterization and Mechanical Behavior of Multi-Block Columns. In Architecture and Design for Industry 4.0: Theory and Practice; Springer: Cham, Switzerland, 2023; pp. 963–978. [Google Scholar]
- La Scala, A.; Rizzo, F.; Carnimeo, L.; Chorro, S.I.; Foti, D. A Proposal of a Neural Predictor of Residual Compressive Strength in an SCC Exposed to High Temperatures for Resilient Housing. In Proceedings of the 2024 IEEE International Humanitarian Technologies Conference (IHTC), Bari, Italy, 27–30 November 2024; pp. 1–6. [Google Scholar]
- Śliwa-Wieczorek, K.; La Scala, A.; Derkowski, W.; Binder, E. Longitudinal Shear in Timber–Concrete Composites with Flexible Adhesive Connections—Experimental and Numerical Investigations. Materials 2024, 17, 6055. [Google Scholar] [CrossRef] [PubMed]
- La Scala, A.; Śliwa-Wieczorek, K.; Rizzo, F.; Sabbà, M.F.; Zając, B. Flexible Polyurethane Adhesives: Predictive Numerical Model Calibration through Experimental Testing at Elevated Temperature. Appl. Sci. 2024, 14, 1943. [Google Scholar] [CrossRef]
- La Scala, A.; Carnimeo, L. Effective Comparison of Thermo-Mechanical Characteristics of Self-Compacting Concretes Through Machine Learning-Based Predictions. Fire 2025, 8, 289. [Google Scholar] [CrossRef]
- Sofi, A.; Regita, J.J.; Rane, B.; Lau, H.H. Structural Health Monitoring Using Wireless Smart Sensor Network–An Overview. Mech. Syst. Signal Process 2022, 163, 108113. [Google Scholar] [CrossRef]
- Di Nuzzo, F.; Brunelli, D.; Polonelli, T.; Benini, L. Structural Health Monitoring System with Narrowband IoT and MEMS Sensors. IEEE Sens. J. 2021, 21, 16371–16380. [Google Scholar] [CrossRef]
- Armijo, A.; Zamora-Sánchez, D. Integration of Railway Bridge Structural Health Monitoring into the Internet of Things with a Digital Twin: A Case Study. Sensors 2024, 24, 2115. [Google Scholar] [CrossRef]
- Komarizadehasl, S.; Mobaraki, B.; Ma, H.; Lozano-Galant, J.-A.; Turmo, J. Development of a Low-Cost System for the Accurate Measurement of Structural Vibrations. Sensors 2021, 21, 6191. [Google Scholar] [CrossRef]
- Komarizadehasl, S.; Huguenet, P.; Lozano, F.; Lozano-Galant, J.A.; Turmo, J. Operational and Analytical Modal Analysis of a Bridge Using Low-Cost Wireless Arduino-Based Accelerometers. Sensors 2022, 22, 9808. [Google Scholar] [CrossRef]
- Dai, Z.; Wang, S.; Yan, Z. BSHM-WSN: A Wireless Sensor Network for Bridge Structure Health Monitoring. In Proceedings of the 2012 Proceedings of International Conference on Modelling, Identification and Control, Wuhan, China, 24–26 June 2012; pp. 708–712. [Google Scholar]
- Sforza, G.; Gentile, C.; Mannella, P. Monitoring System with a High Number of Accelerometers: Optimization of Installation and OMA. In Proceedings of the International Operational Modal Analysis Conference; Springer: Cham, Switzerland, 2024; pp. 334–341. [Google Scholar]
- Yi, T.; Li, H.; Song, G.; Zhang, X. Optimal Sensor Placement for Health Monitoring of High-rise Structure Using Adaptive Monkey Algorithm. Struct. Control Health Monit. 2015, 22, 667–681. [Google Scholar] [CrossRef]
- Kishida, K.; Aung, T.L.; Lin, R. Monitoring a Railway Bridge with Distributed Fiber Optic Sensing Using Specially Installed Fibers. Sensors 2024, 25, 98. [Google Scholar] [CrossRef]
- Papadimitriou, C.; Beck, J.L.; Au, S.-K. Entropy-Based Optimal Sensor Location for Structural Model Updating. J. Vib. Control. 2000, 6, 781–800. [Google Scholar] [CrossRef]
- Singh, S.; Shanker, R. Wireless Sensor Networks for Bridge Structural Health Monitoring: A Novel Approach. Asian J. Civ. Eng. 2023, 24, 1425–1439. [Google Scholar] [CrossRef]
- Waqas, M.; Jan, L.; Zafar, M.H.; Hassan, S.R.; Asif, R. A Sensor Placement Approach Using Multi-Objective Hypergraph Particle Swarm Optimization to Improve Effectiveness of Structural Health Monitoring Systems. Sensors 2024, 24, 1423. [Google Scholar] [CrossRef] [PubMed]
- Kammer, D.C. Sensor Placement for On-Orbit Modal Identification and Correlation of Large Space Structures. J. Guid. Control. Dyn. 1991, 14, 251–259. [Google Scholar] [CrossRef]
- Civera, M.; Mugnaini, V.; Zanotti Fragonara, L. Machine Learning-based Automatic Operational Modal Analysis: A Structural Health Monitoring Application to Masonry Arch Bridges. Struct. Control Health Monit. 2022, 29, e3028. [Google Scholar] [CrossRef]
- Zinno, R.; Haghshenas, S.S.; Guido, G.; VItale, A. Artificial Intelligence and Structural Health Monitoring of Bridges: A Review of the State-of-the-Art. IEEE Access 2022, 10, 88058–88078. [Google Scholar] [CrossRef]
- An, H.; Youn, B.D.; Kim, H.S. A Methodology for Sensor Number and Placement Optimization for Vibration-Based Damage Detection of Composite Structures under Model Uncertainty. Compos. Struct. 2022, 279, 114863. [Google Scholar] [CrossRef]
- Foti, D.; Sabbà, M.F.; Pavone, R.; Cucumazzo, F. A Dynamically Validated Model Verified by Drone Photos of the Masonry Bridge of the XIX Century. Procedia Struct. Integr. 2023, 44, 1506–1513. [Google Scholar] [CrossRef]
- Mansour, S.; Rizzo, F.; Giannoccaro, N.I.; La Scala, A.; Sabbà, M.F.; Foti, D. Essential Dynamic Characterization of a Historical Bridge: Integrated Experimental and Numerical Investigations. J. Civ. Struct. Health Monit. 2024, 14, 85–102. [Google Scholar] [CrossRef]
Disclaimer/Publisher’s Note: The statements, opinions and data contained in all publications are solely those of the individual author(s) and contributor(s) and not of MDPI and/or the editor(s). MDPI and/or the editor(s) disclaim responsibility for any injury to people or property resulting from any ideas, methods, instructions or products referred to in the content. |
© 2025 by the authors. Licensee MDPI, Basel, Switzerland. This article is an open access article distributed under the terms and conditions of the Creative Commons Attribution (CC BY) license (https://creativecommons.org/licenses/by/4.0/).