Abstract
In cellular networks, call blocking causes lower customer satisfaction and economic loss. Therefore, the channel allocation for call block avoidance is an important issue. This study proposes a mechanism that considers the real-time traffic information (e.g., traffic flow and vehicle speed) and the user behavior (e.g., call inter-arrival time and call holding time) to analyze the adaptable number of communication calls in the specific cell for channel allocation. In experiments about call block probabilities (CBP), this study simulated two cases that are the situations of the whole day and traffic accident. The simulation results show that all CBPs in the scenario of whole day are less than 21.5% by using the proposed mechanism, which is better than using the static channel allocation (SCA) mechanism. Moreover, all CBPs in the scenario of traffic accidents are less than 16.5% by using the proposed mechanism, which is better than using the SCA mechanism. Therefore, the proposed mechanism can decrease the number of CBPs effectively.
1. Introduction
In recent years, the rise in economic growth and information technology advancement has improved the quality of personal communication systems (PCS). Moreover, people now pay more attention to the quality of service in cellular systems. As the number of mobile stations (MS) rises, how to provide the high quality of service in cellular systems has become a big challenge. The cellular system is composed of cells. A cell is the specific coverage of the base station (BS), and it overlaps the coverage of neighboring cells. BS are fixed and interconnected through a fixed network. The structure of the cellular network is the connective coverage of the cell. Moreover, every cell only has limited channels to provide communication services. Among cellular systems, Global System for Mobile Communications (GSM) and Universal Mobile Telecommunications System (UMTS) are well known[1,2,3,4]. They can decide whether to accept the call or not depending on the available number of the channels. When an MS wants to communicate with another user, it must first obtain a free channel provided by BS. If the BS has no free channel, the call will fail. Therefore, the number of channels for Handover In BSs that are reserved is an important issue for cellular systems. The number channels provided by BS is limited, and almost everyone has at least one cellphone at the moment, so the channels of BS are usually fully connected.
When the channels of BS are fully occupied, the MSs will encounter the situation of call drop or call block [5]. If the MS wants to communicate with another MS, it must request a free channel from the BS to generate a new call. If a channel is free, it is assigned to the MS. If the BS has no free channel to allocate to the MS, the BS will drop the new call request from MS. If the communicating call moves from the old cell to the new cell, it has to request from the new cell a free channel. If the new cell has no free channel, the call block occurs. The call block causes more loss than the call drop because it stops the ongoing call. This study solves the problem through reserving channels for Handover In BS, but how many channels of the BS to reserve is an important issue.
Therefore, there is much research that is working on the quality of cellular telephone system improvement. A number of studies have investigated the method to reserve the number of channels. These can be divided into two methods: one method is a static algorithm for channel allocation and another method is a dynamic algorithm [4,6,7,8,9,10,11,12,13]. However, the static allocation algorithms are unsuitable in dynamic environments.
This paper will provide a dynamic channel allocation (DCA) mechanism. This study considers the traffic information to analyze the communication behavior and proposes a method to design the DCA mechanism in personal communication systems. This study uses the communication behavior of MSs and the MS movement to estimate the status of channel use in cells. Moreover, this study uses the above information to provide a method that decides how many channels have to be reserved in the cellular telephone system. Therefore, this study uses the proposed mechanism to dynamically adjust the number of channels reserved in each BS according to the variation of traffic information. Simulation results show that the call block probability (CBP) by using the DCA mechanism is lower than by the static channel allocation (SCA) mechanism. In cellular systems, the CBP is an important factor for measuring the quality of service [14,15]. Therefore, this study will consider the factor of CBP and prove that the proposed mechanism is better than the SCA mechanism.
2. Related Work
In this section, this study will introduce some concepts of PCS. In order to design a dynamic channel mechanism, the knowledge of PCS (e.g., GSM and UMTS) and the channel allocation mechanism in PCS is described in the following subsections.
2.1. Cellular Network Architecture
The rapid growth in the demand for PCS has led the industry to intense research and development efforts towards a new generation of cellular systems. Nowadays, people can’t live without cellular systems. The MS can perform the communication via the cellular system when the specific cell has a free channel. In this part, we will introduce two major systems in present cellular systems. The architectures of GSM and UMTS are described in the following subsections.
2.1.1. Global System for Mobile Communications
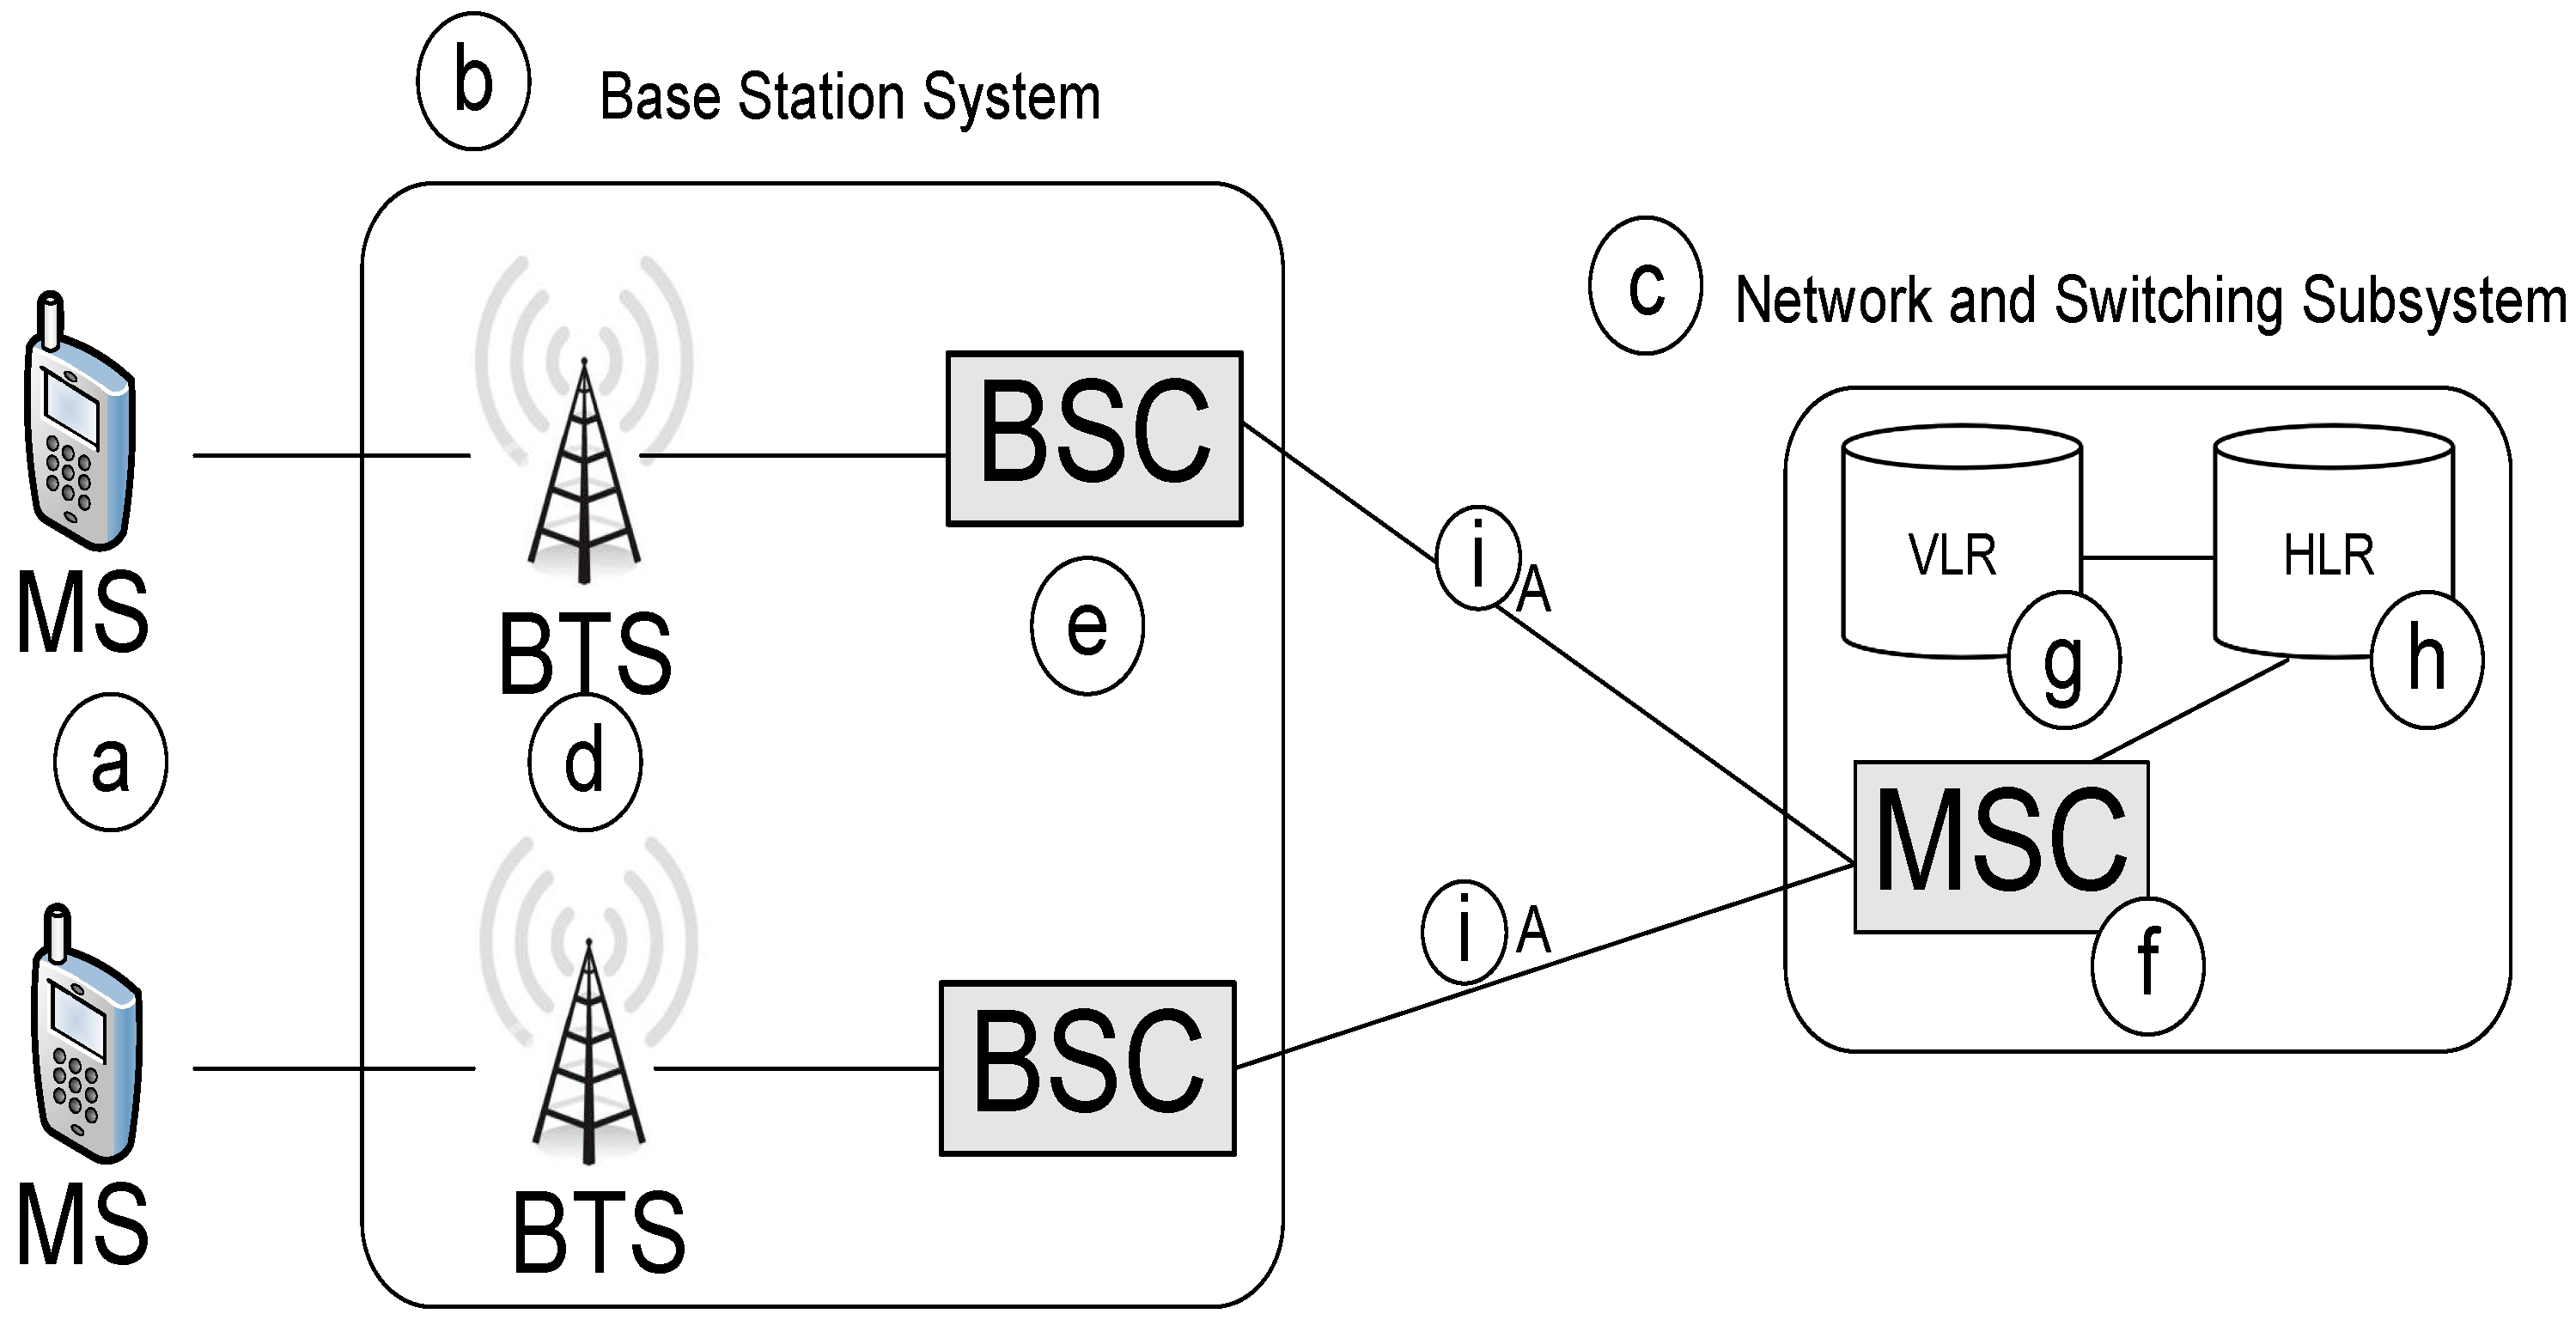
The GSM is a digital wireless network specified by standardization committees from major European telecommunications operators and manufacturers. Through the standard, all mobile users worldwide can use a common set of compatible services. Figure 1 illustrates the architecture of GSM [16,17,18]. The network system of GSM at least includes three sections: an MS (Figure 1a), a Base Station Subsystem (BSS, Figure 1b), and a Network and Switch Subsystem (NSS, Figure 1c). Moreover, it has to build the standard communication interface between any two components in GSM to transmit information and control command. Through the standard interface, the components in GSM can communicate with each other and complete the capability of communication. BSS consists of the Base Transceiver Station (BTS, Figure 1d) and the Base Station Controller (BSC, Figure 1e). NSS consists of the Mobile Switching Center (MSC, Figure 1f), Visitor Location Register (VLR, Figure 1g) and Home Location Register (HLR, Figure 1h). The work of BTS is listening to the order from BSC to communicate with the MS via the radio interface, while the BSC communicates with the MSC via the A interface (Figure 1i). MSC is a special switch that executes the capability of circuit switch and is responsible for recording to the billing system. HLR is responsible for recoding the information of user subscribed our system, including what service user subscribed and the location of MS. VLR is responsible for recording the information of user inside its domain, including the state and location of user.
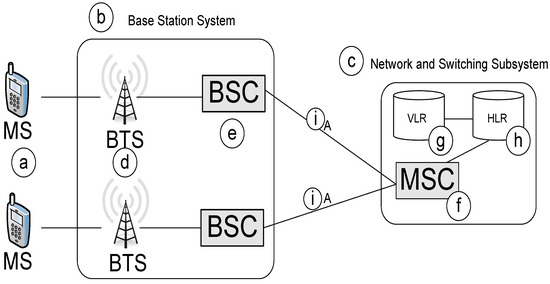
Figure 1.
The GSM network architecture [18].
2.1.2. Universal Mobile Telecommunications System
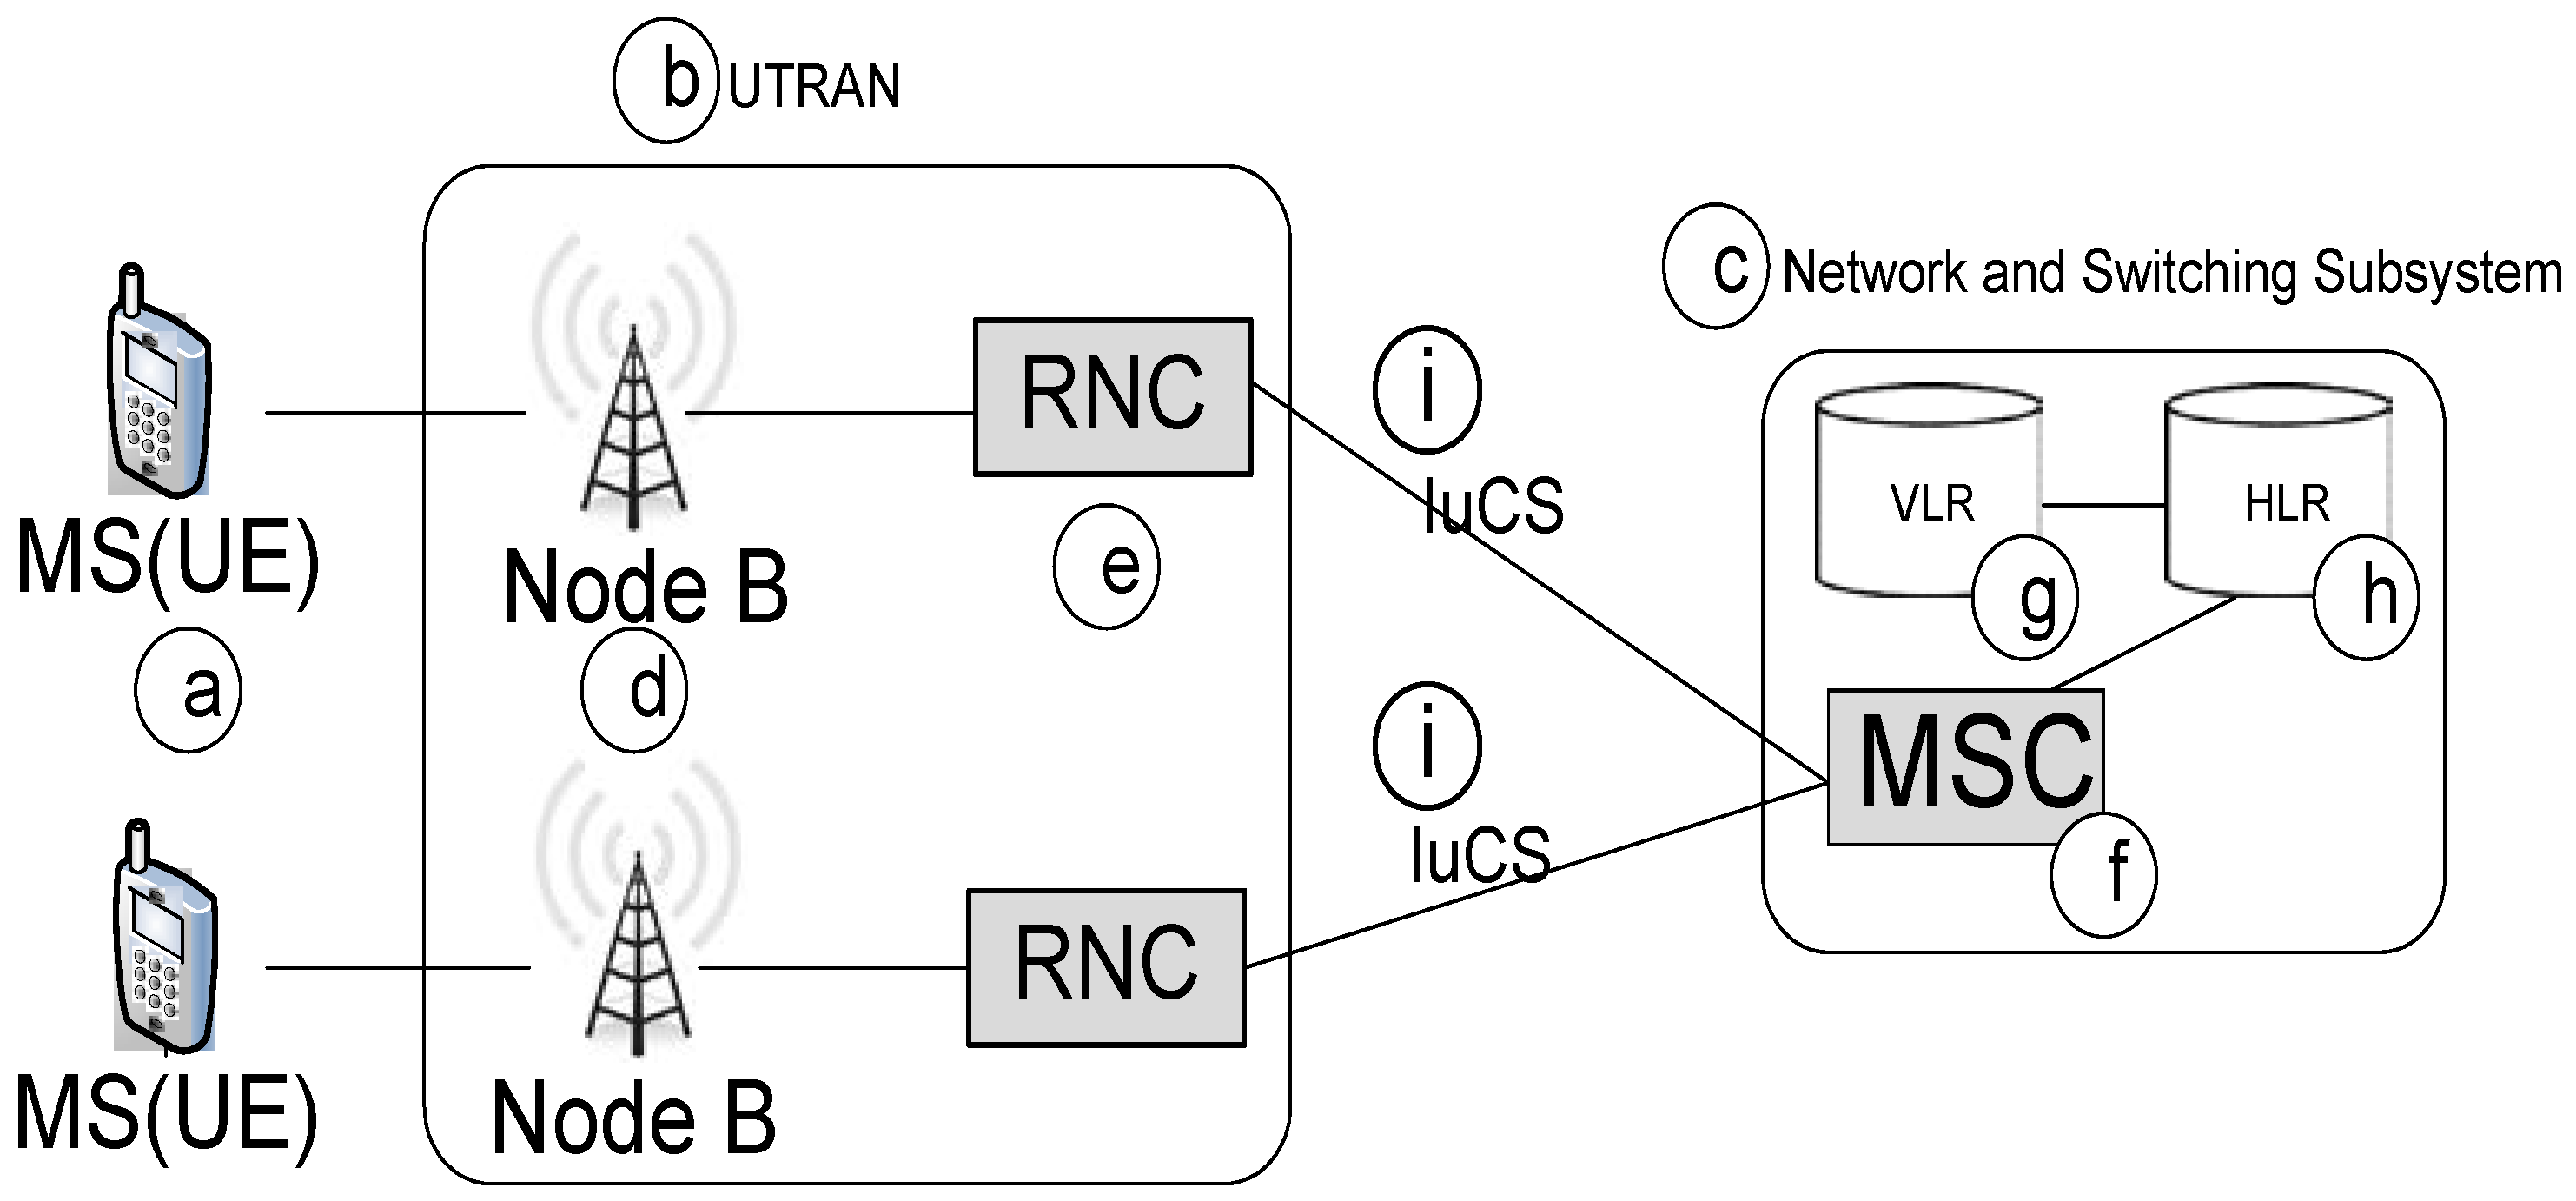
The UMTS is the third generation (3G) and is the standard of mobile communication system. UMTS has a feature which is compatible with existing GSM/General Packet Radio Service (GPRS), so it is considered the best cellular system in mobile communication systems. Figure 2 illustrates the architecture of the UMTS Circuit-Switched (CS) service domain [16,17,18]. The network system of UMTS includes User Equipment (UE, Figure 2a), and UMTS Terrestrial Radio Access Network (UTRAN, Figure 2b). Moreover, it has to build the standard communication interface between any two components in UMTS to transmit information and control command. Through the standard, all mobile users worldwide can use a common set of compatible services. URTAN consists of Node B (Figure 2d) and Radio Network Controllers (RNC, Figure 2e). UE is equal to user end equipment such as MS. Node B is responsible for capability of physical layer, including controlling information of spread spectrum and modulation. RNC is responsible for radio resource management and the capability to connect to MSC via the interface of IuCS (Figure 2a). In general, any coverage of Node B is called Cell. HLR is responsible for recoding the information of users subscribed to the system, including what service users subscribed to and the location of MS.
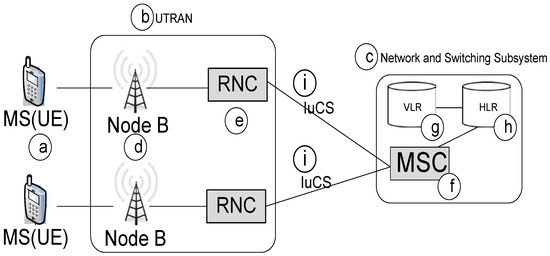
Figure 2.
The UMTS network architecture [18].
2.2. Channel Allocation Mechanisms
In cellular networks, when one MS wants to communicate with another MS, it must get a free channel provided from BS to serve it. Thus, if the BS has a free channel, the connection between two MSs will be built successfully; otherwise, the connection of communication fails. Therefore, to allocate the adaptable number of channels for communication is a critical issue. In this subsection, we will introduce two types of channel allocation mechanisms, which are the traditional SCA mechanism and the DCA mechanism, respectively.
2.2.1. Static Channel Allocation
The mechanism of channel allocation in PCS adopts the Static Channel Allocation (SCA) mechanism; when the channels which are allocated, the BS can only use these channels to provide the service of communication. In this case, there is a definite relationship between the channels and the cells that can be used at any time. The obvious disadvantage of using the SCA mechanism can be explained using an example. Imagine two adjacent cells with their allocated channels. At any time, one of the cells may have all of its channels occupied, and another new call requests a free channel in this cell. This call will be blocked even if the adjacent cell has a free channel at this moment. The situation will result in the customer satisfaction and economic loss.
Channel reuse is an essential feature of cellular system. However, the discussion of directional cell sites explained the economic incentive for minimizing the ratio of σ, and the parameter of σ can be expressed as a ratio of the physical distance between the center of cells (D) divided by the radius (R) of cells. The co-channel reuse ratio has an impact on both the communication quality and the ender customer capacity of the system [19]. Because the co-channel ratio actually has impact on the communication quality, the ratio will decide the number of channels in each channel sets. The ratio also can limit the communication capacity of cells by deciding the number of channels in each channel set. In the SCA mechanism, when the number of channel (N) is assigned to each cell, the number of channels (N) is a fixed number and permanently allocated to each cells [20]. When the number of channel is decided, the BS only can use these channels to provide service of communication. In general, the number of channels (N) in each cell can be expressed as Formula (1) [6,10,21]:
Here, we define σ as D/R, where D is the physical distance between the two cell centers and the R is the radius of the cell. Therefore, the number of N can only be an integer value. For example, N is 3, 4, etc.
In the SCA mechanism, because the number of channels in each cell is permanent, the solution is suitable for the stable situation of traffic information. The CBP will increase with the traffic flow increases.
2.2.2. Dynamic Channel Allocation
The SCA mechanism can’t achieve high efficiency of channels using the variation of traffic in the cellular system. In order to overcome this problem, the Dynamic Channel Allocation (DCA) mechanism in recent years has been studied widely. In contrast to the SCA mechanism, the DCA mechanism has no fixed relationship with each cell and channel [21]. All channels are in the central pool. When any cell has a new call arrival, it will allocate one free channel to that cell [10,22,23,24,25]. After the call is complete, the channel will be return to the central pool.
In DCA, a channel can be used in any cell provided that the signal interference constraints are satisfied. Generally, more channels can be assigned to the cells’ required channel by the central pool. The main idea of the DCA mechanism is that it minimizes the cost to select and use the candidate channels provided that the interference constraints are satisfied. The selections of cost functions are designed with the different schemes. The factors when we design the function include the usage frequency of the candidate channel, the reuse distance, channel occupancy distribution under current traffic conditions, and radio channel measurements of individual MSs of the average CBP of the system [12]. In this part, the DCA mechanism can dynamically allocate free channels to the cell-required channel, depending on the variation of traffic information. Therefore, the DCA mechanism is suitable for dynamical environment. We design the mechanism for channel allocation based on the DCA scheme in PCS. Finally, depending on the type of control, the DCA mechanism can be divided into centralized and distributed mechanisms [10].
Centralized DCA Mechanism
In the centralized DCA mechanism, the channels in cells are allocated by the central pool in PCS for temporary use, and the channels return to the central pool when the use is over. The difference between these mechanisms is the specific cost functions adopted for selection the candidate channel for allocation. Generally, the factors of cost functions are First Available (FA) and Locally Optimized Dynamic Assignment (LODA). In the centralized DCA mechanism, the FA is the simplest strategy to select the candidate channel for use. In FA, the first available channel within the reuse distance σ selected during the channel search is assigned to the cell. In LODA, the selected cost function is based on the future blocking probability adjacent to the cell where a call is initiated.
Distributed DCA Mechanism
Due to economic growth and the demand of the quality of service in PCS, DCA mechanisms have been studied in recent years. Several simulation results and analyses have shown that the centralized DCA mechanism can provide near optimum channel allocation, but it will cause the immense management costs in the central control. Therefore, distributed DCA mechanism is proposed. The difference between the centralized DCA mechanism and the distributed DCA mechanism is that the distributed DCA mechanism doesn’t have the central pool for channel control. The number of available channels and signal strength measurements are considered and used by the proposed distributed DCA mechanism [10].
3. Channel Allocation Mechanism in Cellular Networks
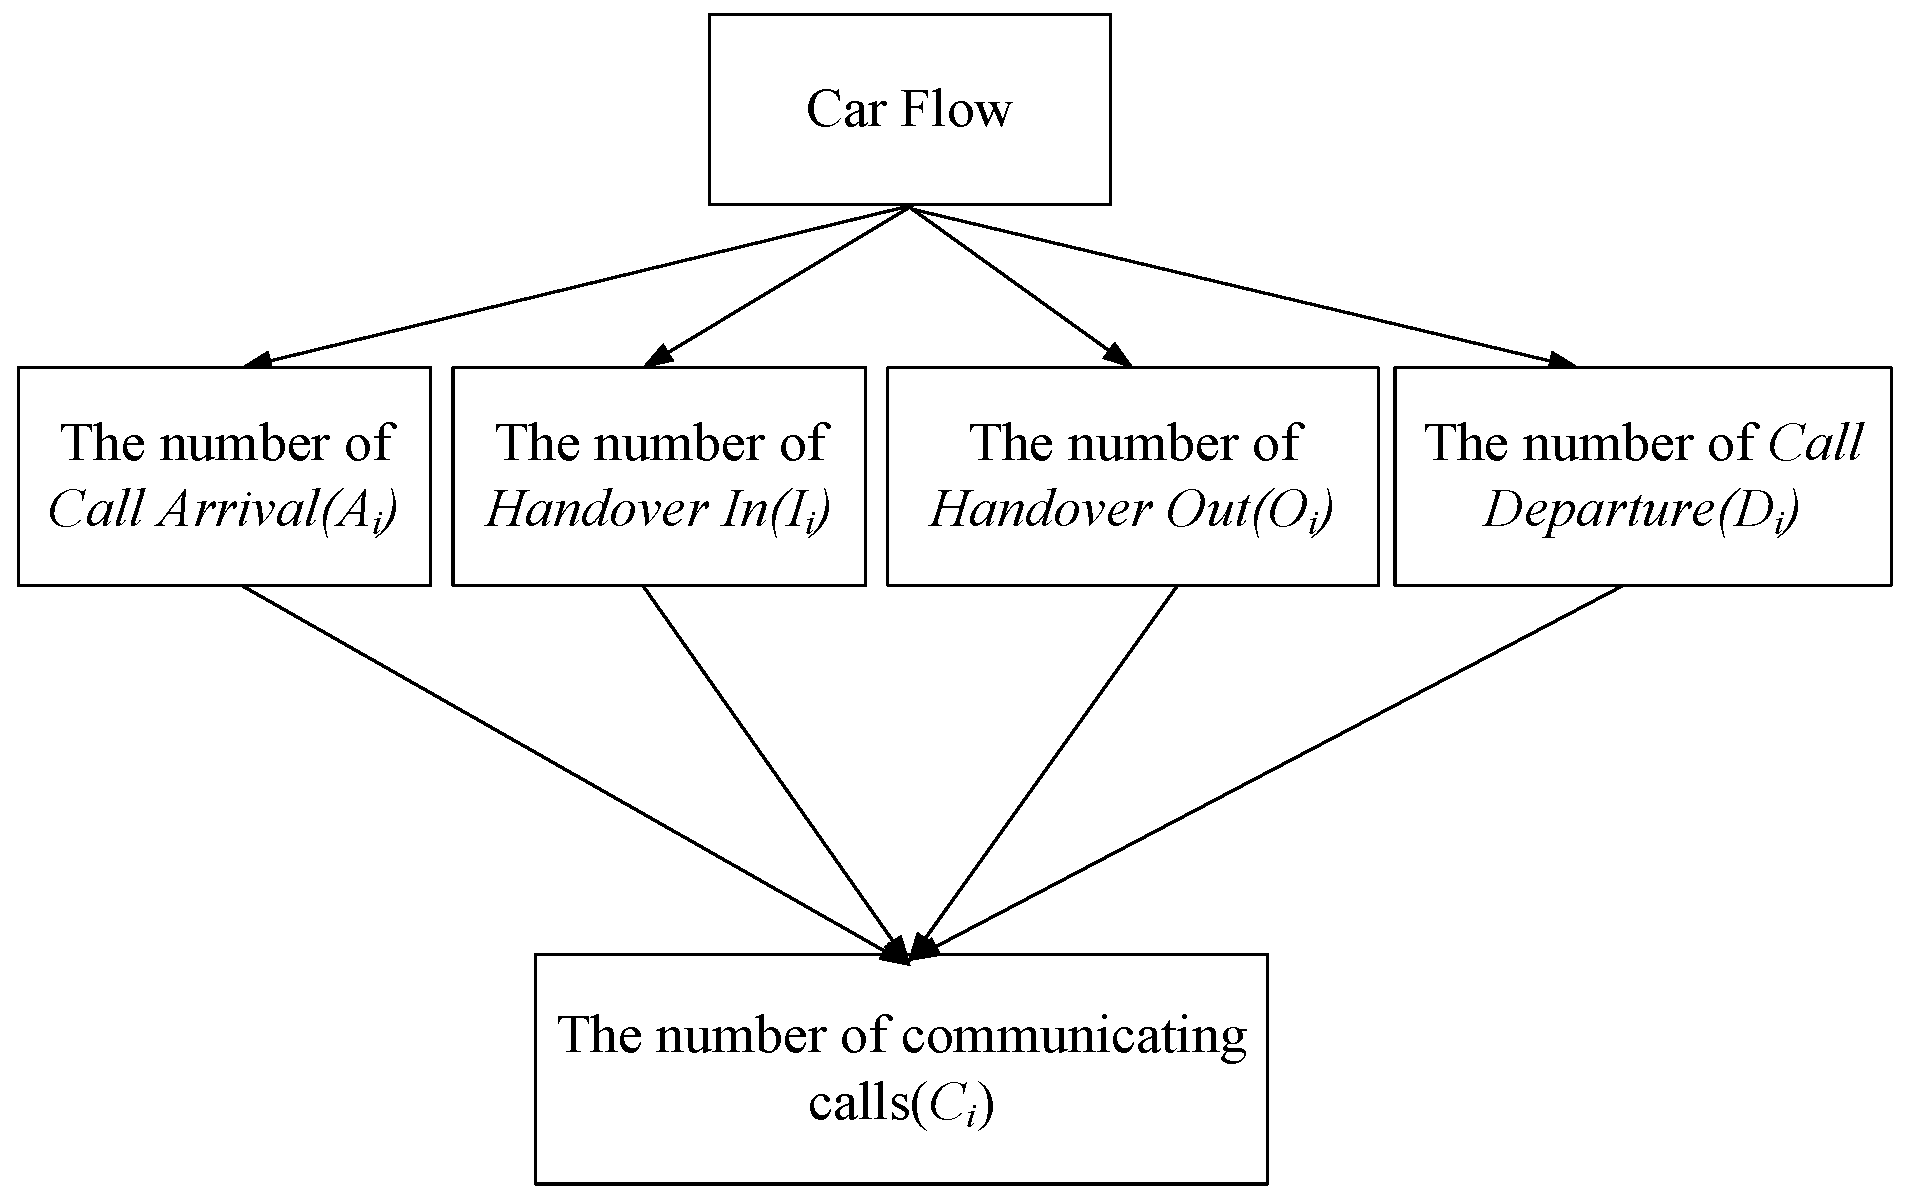
In this section, this study will analyze the relation of communication behavior of MSs and the status of traffic. Moreover, this study uses this traffic information to provide a method that can help the cellular telephone system to decide the number of channels that can be reserved. Figure 3 shows the architecture of our proposed mechanism. The goal in the proposed mechanism is to get the number of communicating calls (Ci) that is derived from four factors. The factors include the number of Call Arrival (Ai), the number of Handover In (Ii), the number of Handover Out (Oi), and the number of Call Departure (Di). Moreover, this study uses Formula (2) to estimate the number of communicating call (Ci) for Celli. In the following, this study will discuss the four factors, respectively:
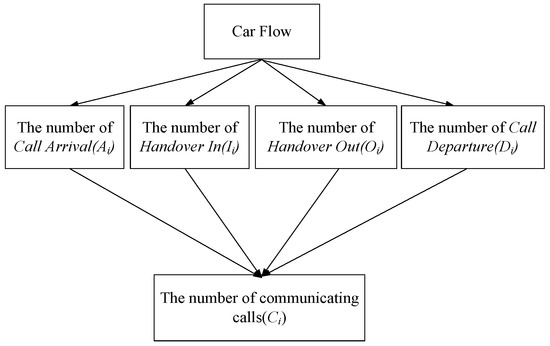
Figure 3.
The architecture of proposed mechanism.
3.1. The Number of Call Arrival (Ai)
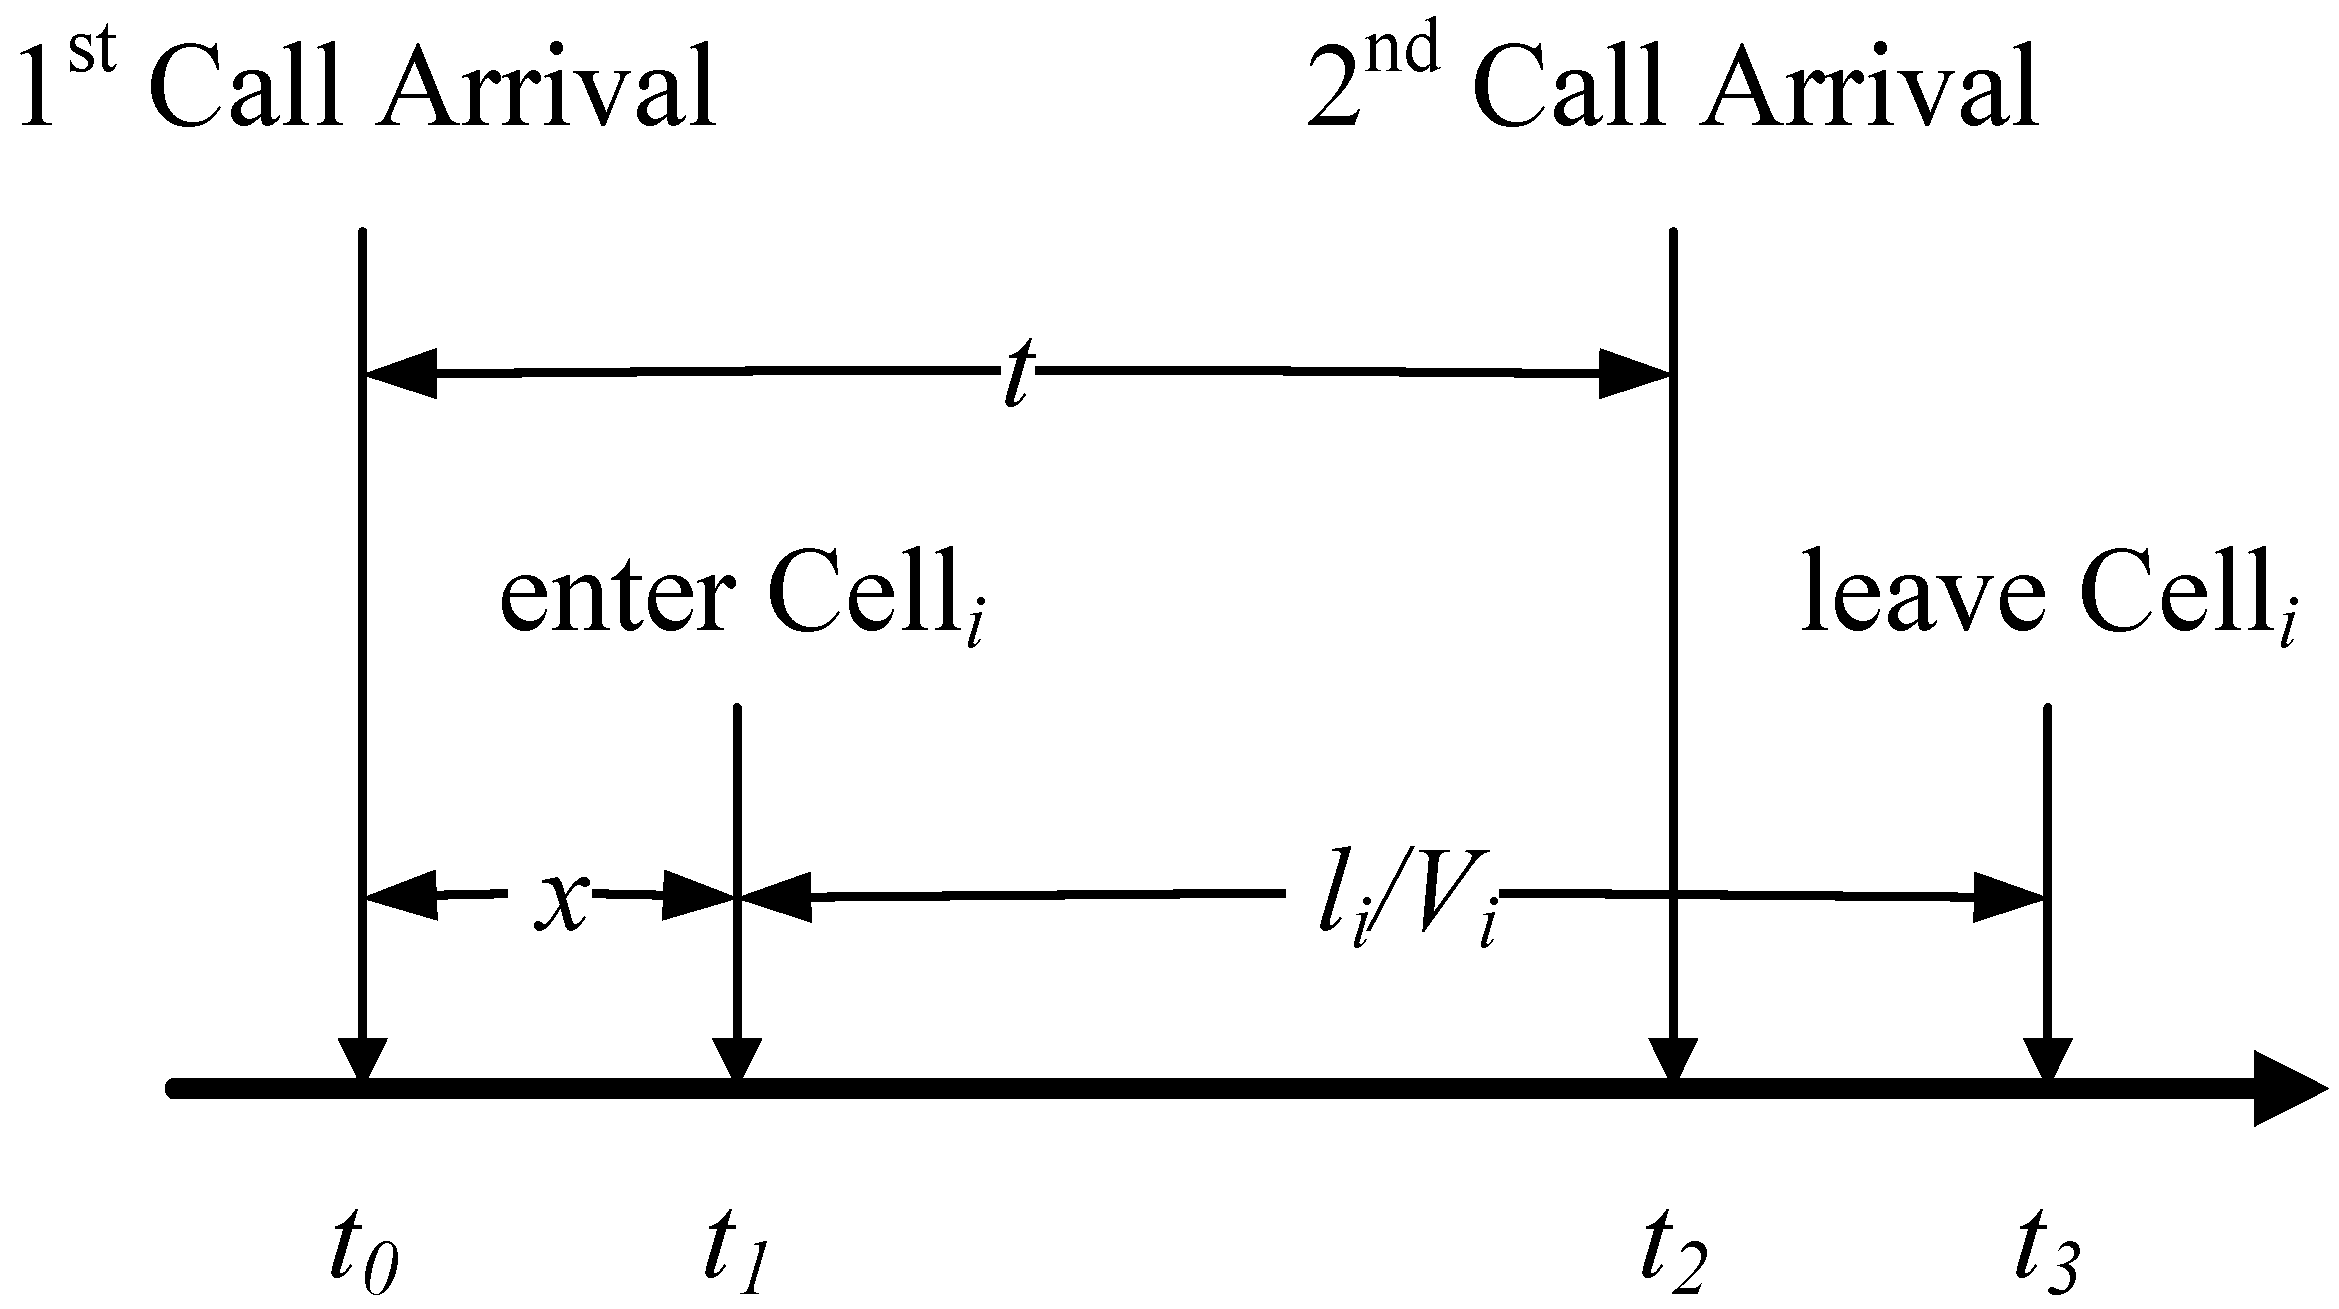
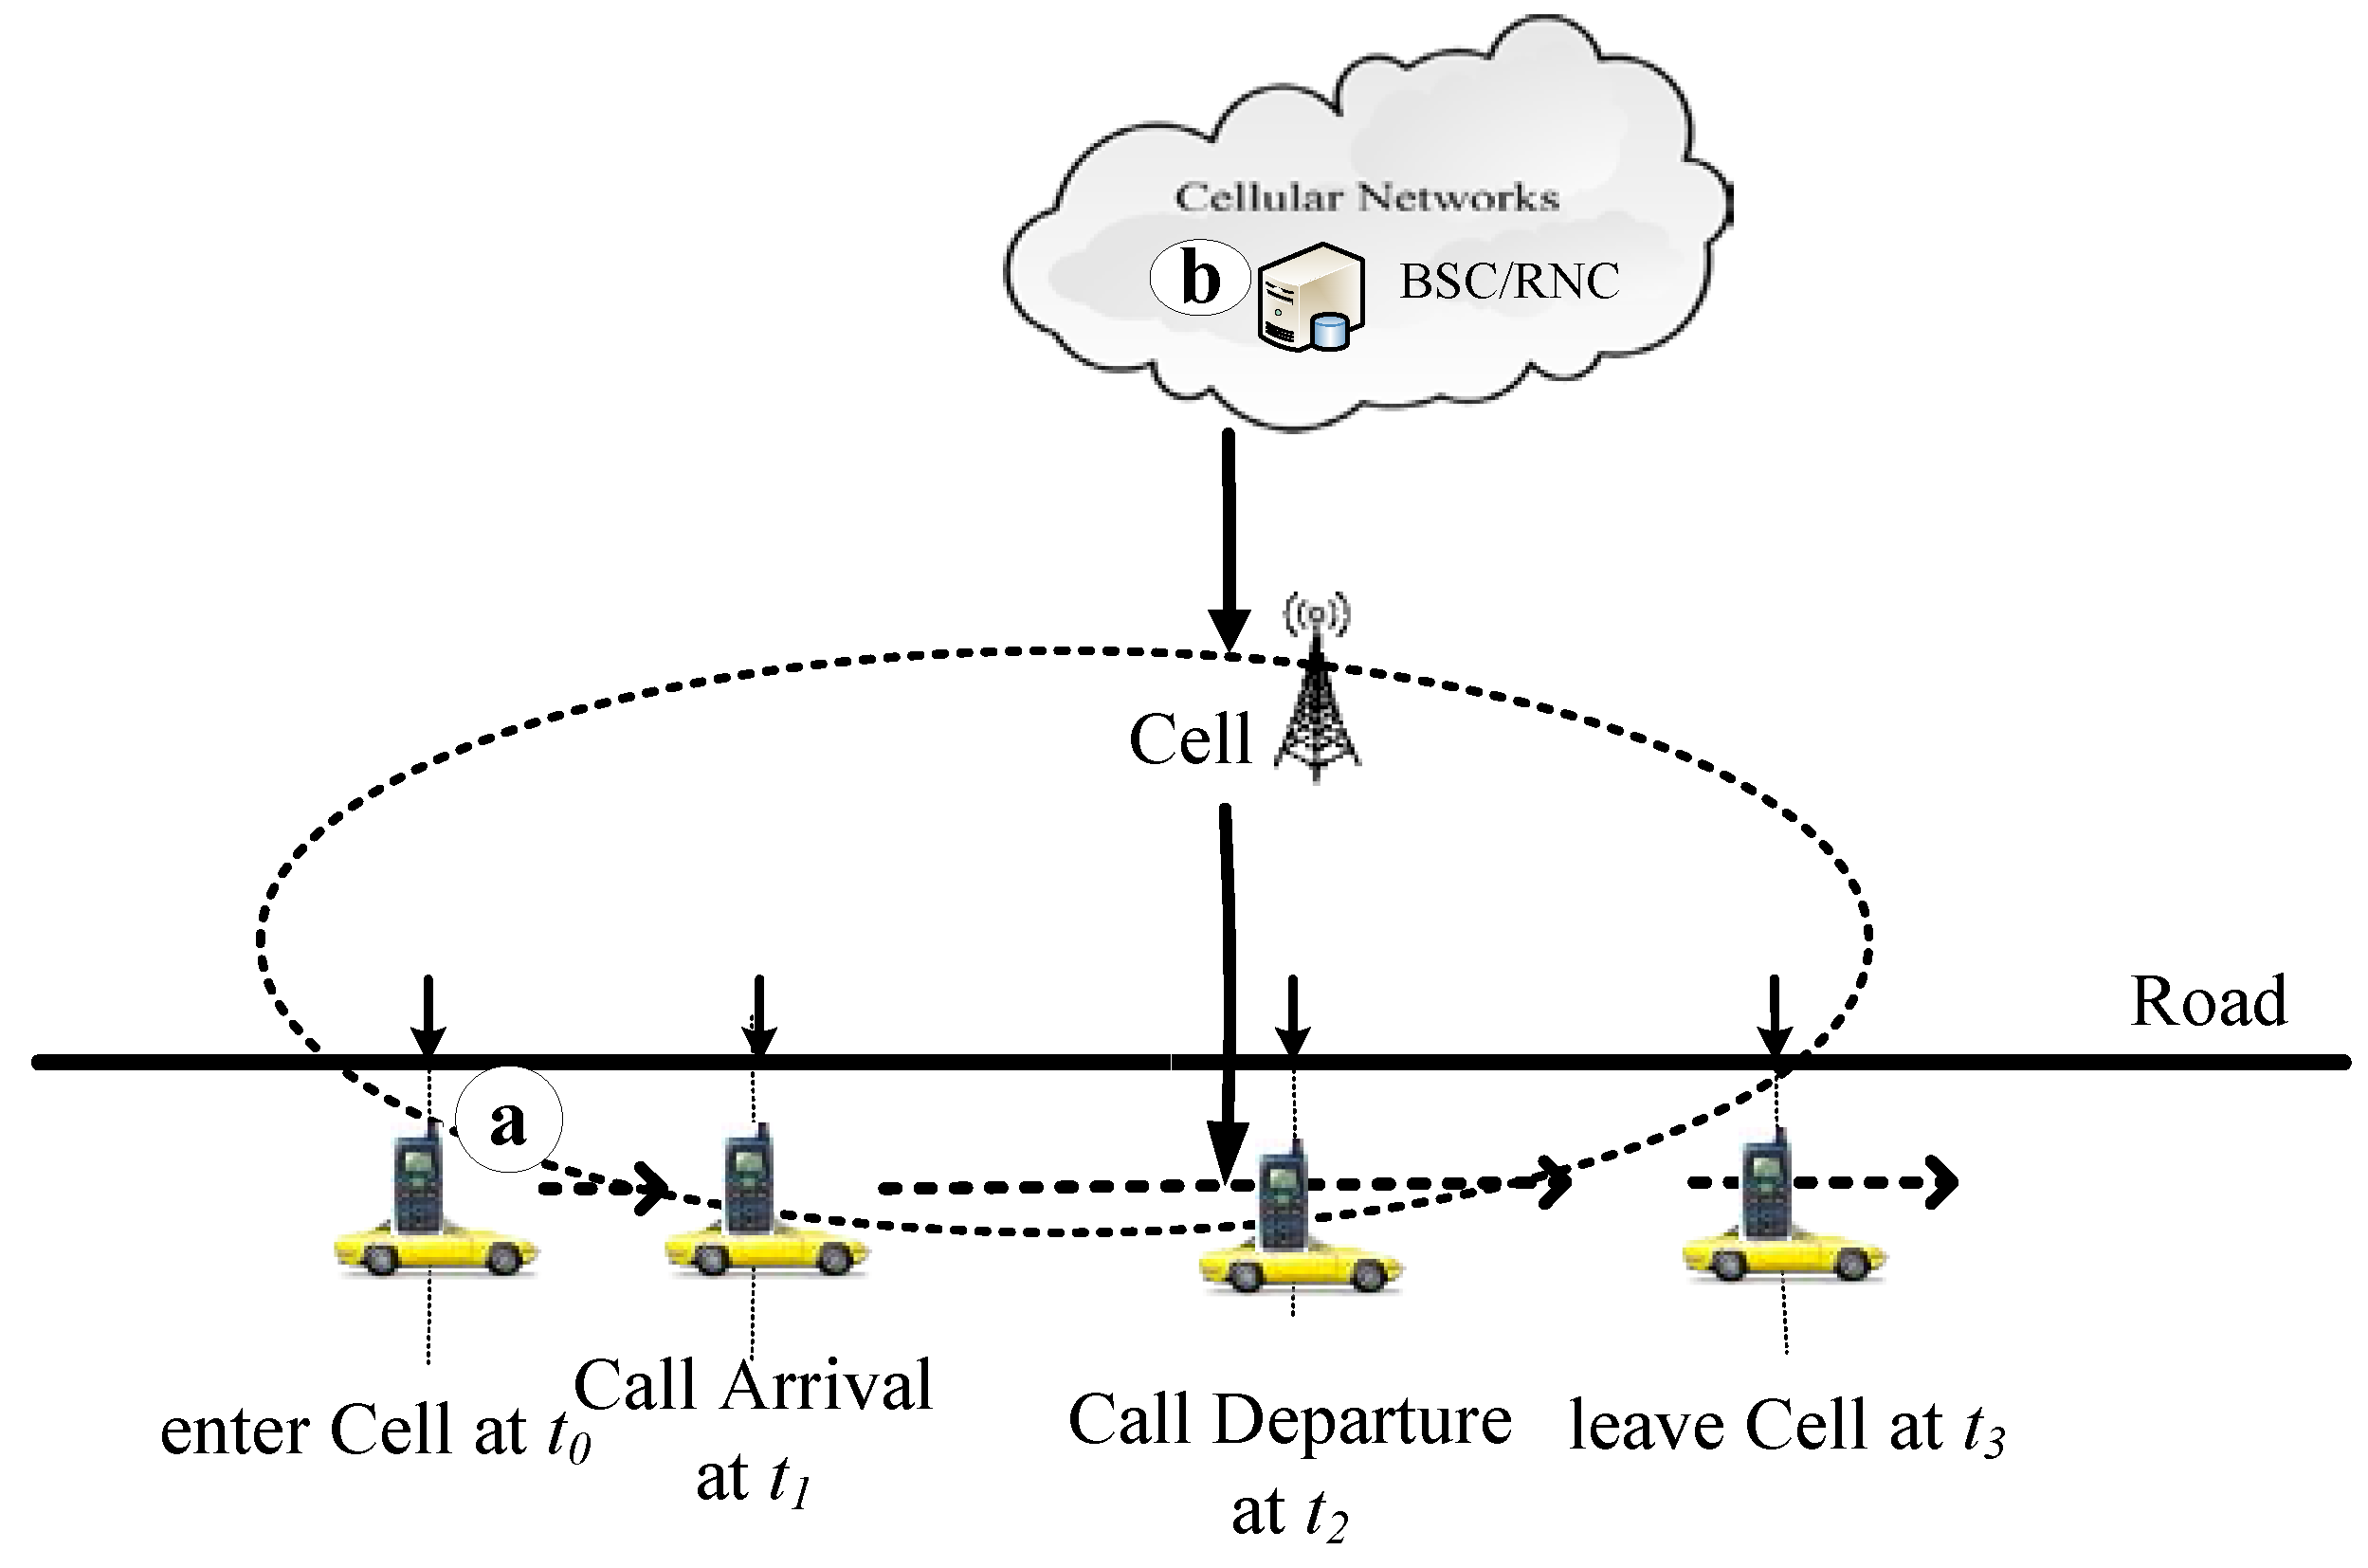
An MS (i.e., (a) in Figure 4) can perform a call in the service area (i.e., cell), which is provided by BSs or Node B in cellular networks (e.g., GSM and UMTS) (i.e., (b) in Figure 4) if the cell has a free channel. The scenario and timing diagrams of call arrival processes on the road segments covered by the specific Celli is showed in Figure 4 and Figure 5. The first call set-up at time t0 is performed by a MS (in Figure 5), and the MS keeps moving to the specific cell coverage at time t1 (in Figure 5). The second call set-up at time t2 is performed by the MS (in Figure 5) before leaving the specific cell coverage at time t3 (in Figure 5).
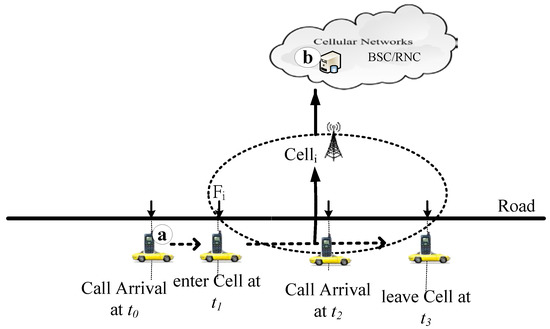
Figure 4.
The scenario diagram for vehicle movement and call arrivals on the road segment covered by the specific Celli [27,28,29,30,31,32,33].

Figure 5.
The timing diagram for call arrival on the road segment covered by the specific Celli [27,28,29,30,31,32,33].
This study assumes that the call inter-arrival time (t) is exponentially distributed with the mean 1/λ [26,27,28,29,30,31,32,33] to generate the Call Arrival. Because the distance of the cell coverage is li and the speed of the car is Vi, the time that the car moves from one side to the other side is li/Vi. This approach considers the MS that has twice the number of Call Arrivals, and the time entering the cell and leaving the cell to estimate the probability of Call Arrival. This study gets the number of Call Arrivals (Ai) on the road segments through traffic flow (Fi) multiplied by the probability of Call Arrival. It can be expressed as Formula (3) [27,28,29,30,31,32,33]:
3.2. The Number of Handover In (Ii)
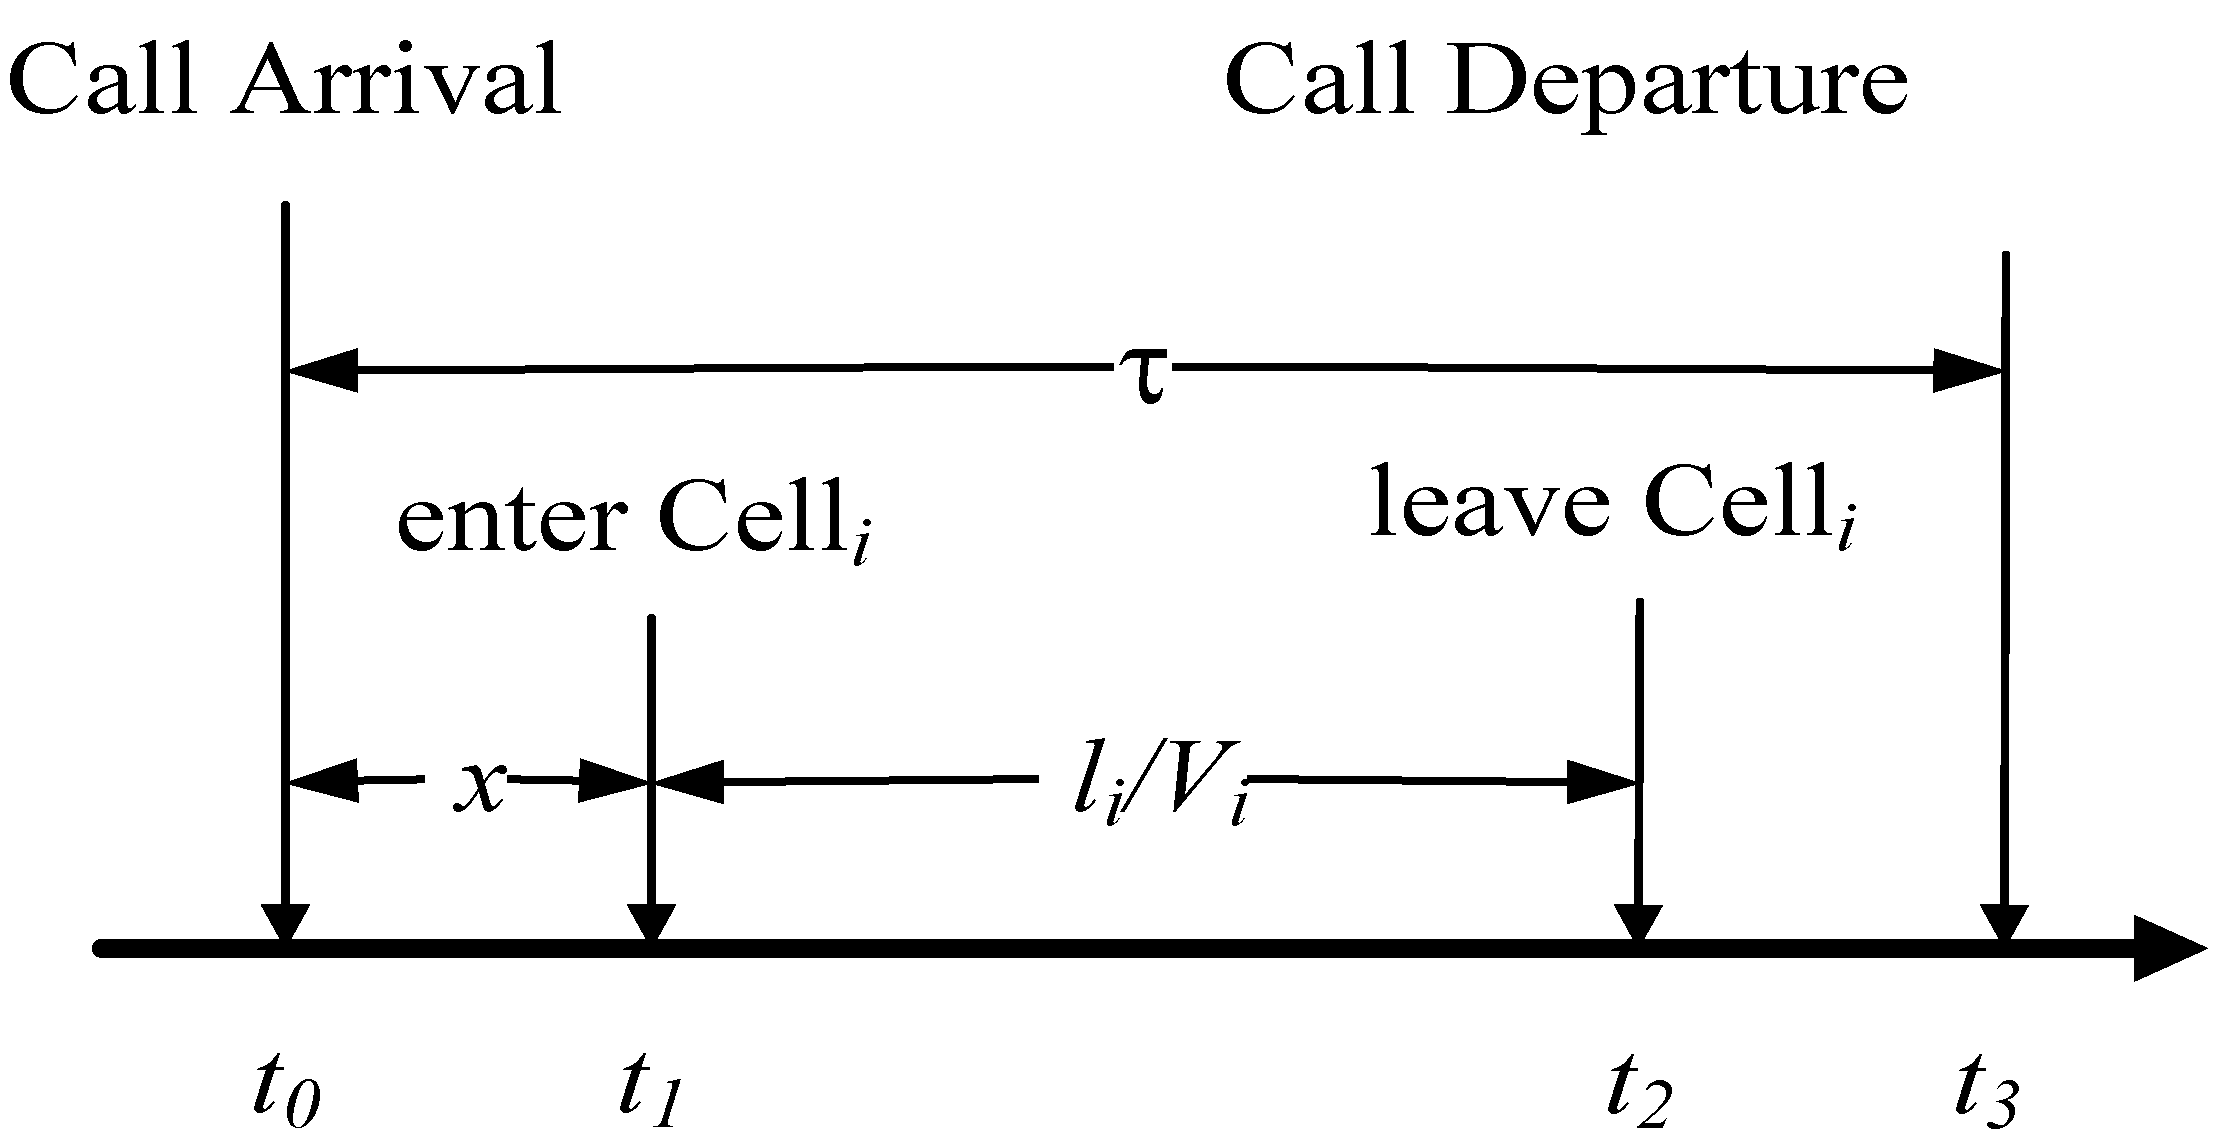
When a communicating MS (i.e., (a) in Figure 6) in the car moves from the source cell to the target cell, the handover procedure can be performed if the target cell has a free channel. There is a road covered by a set of cells and a communicating MS in a car on the road. For instance, Figure 6 and Figure 7 illustrate the scenario and timing diagrams for Handover In the specific Celli. A call is performed at time t0 by a MS (in Figure 7). Furthermore, the MS moves from Celli−1 to Celli at t1 (in Figure 7) and a free channel is allocated for the handover procedure of the MS by the BSC or RNC (i.e., (b) in Figure 6).
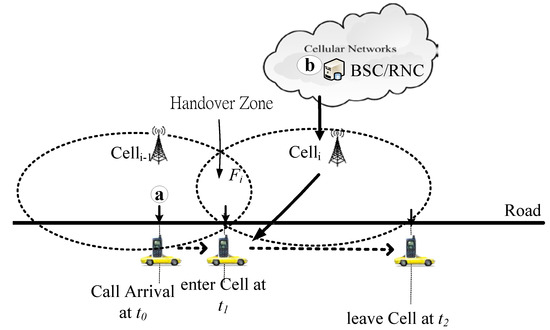
Figure 6.
The scenario diagram for vehicle movement and Handover In the specific Celli [27,28,29,30,31,32,33].
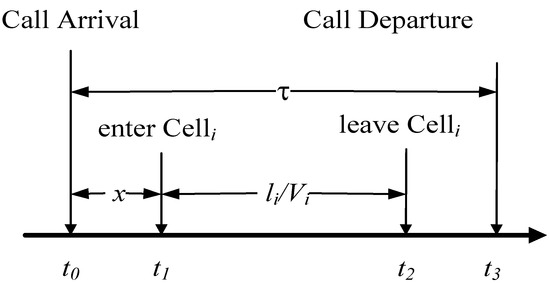
Figure 7.
The timing diagram for Handover In the specific Celli [27,28,29,30,31,32,33].
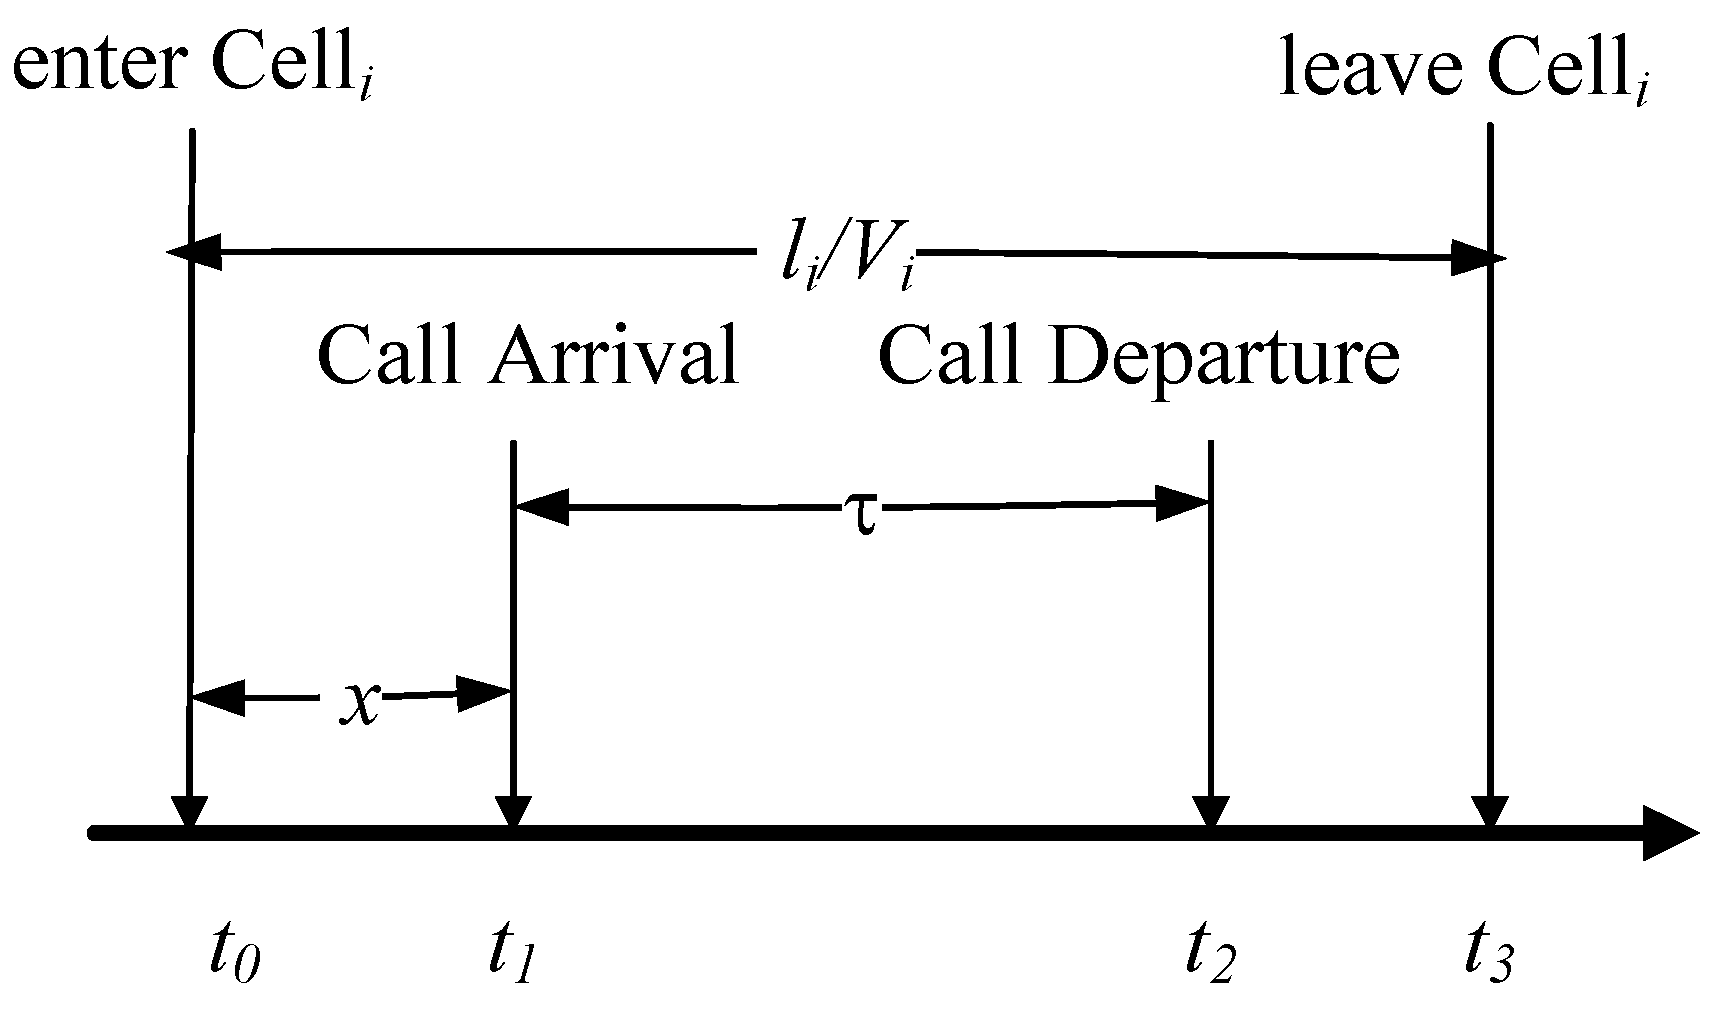
For estimating the number of Handover In (Ii), the call holding time (τ) is assumed to be exponentially distributed with the mean 1/μ [26,27,28,29,30,31,32,33]. In this study, the car flow and vehicle speed are assumed as Fi and Vi. Moreover, the distance of the cell coverage is li, so the time difference between entering Celli (i.e., t1) and leaving Celli (i.e., t2) is measured as li/Vi. The variable x is the time difference between call arrival (i.e., t0) and entering Celli (i.e., t1). When the call holding time (τ) is longer than the variable x, the handover procedure will be performed. Therefore, the number of Handover In (Ii) of Celli can be expressed as Formula (4):
3.3. The Number of Handover Out (Oi)
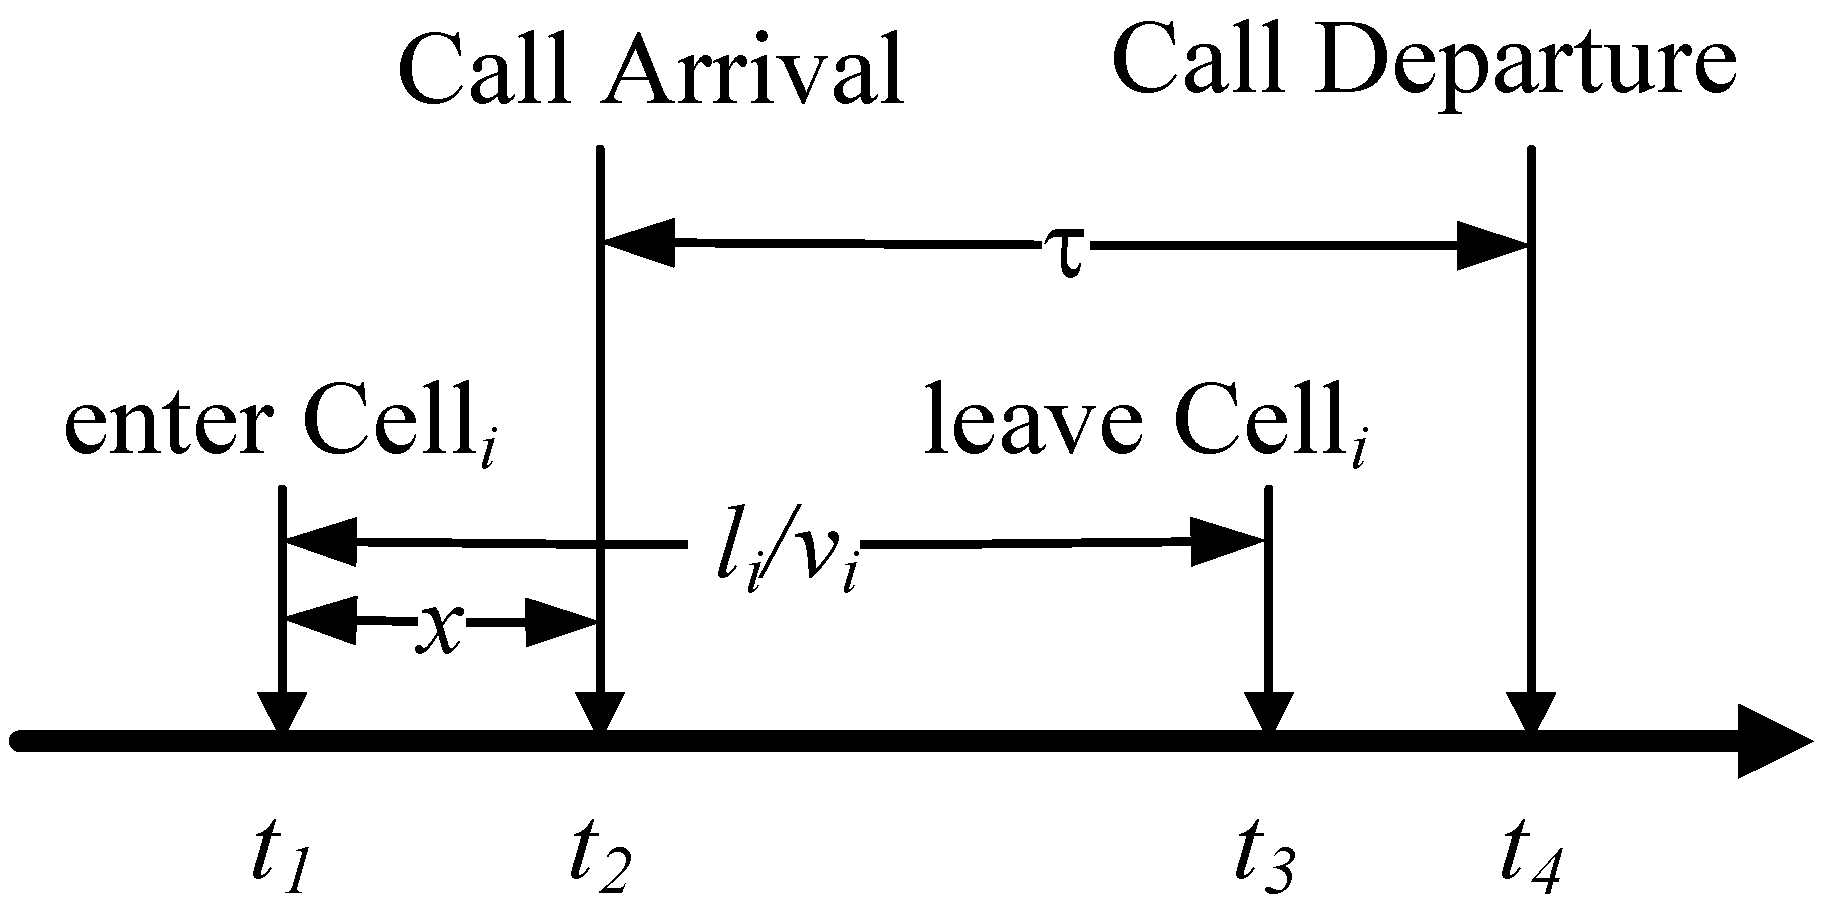
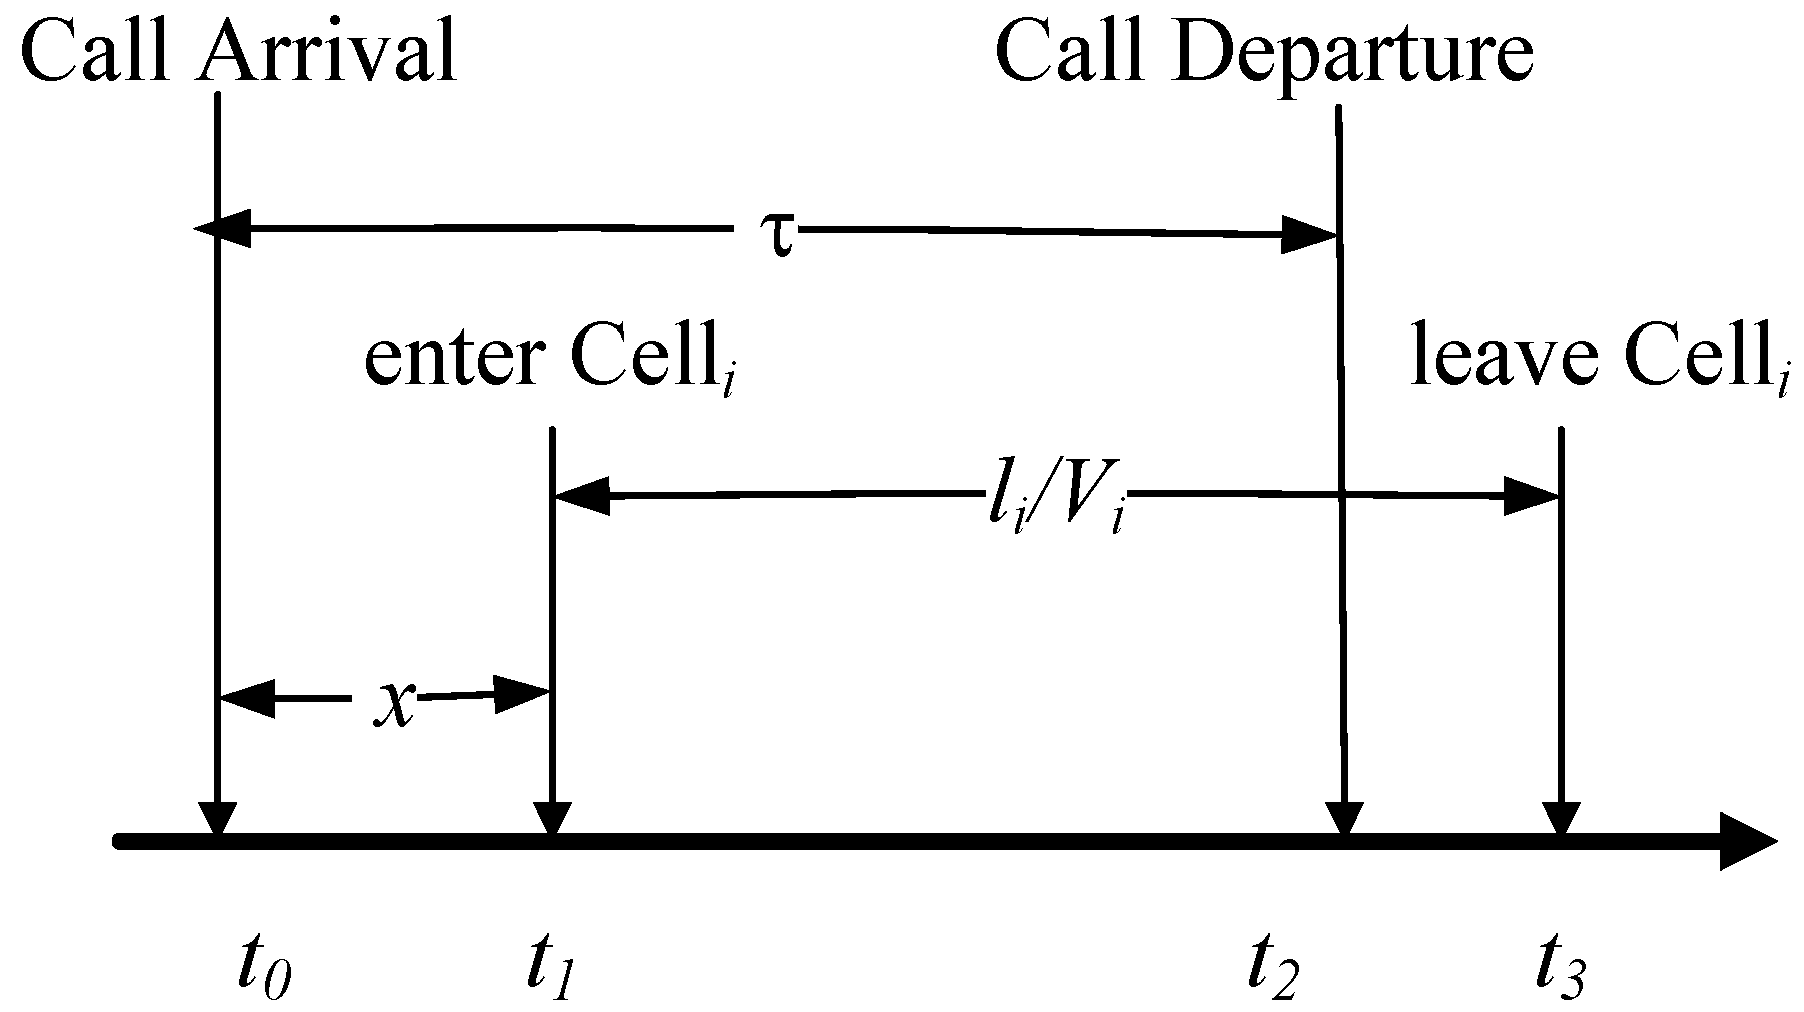
For estimating the number of Handover Out (), two cases including (1) Call Arrival and (2) Handover In are discussed and analyzed. For instance, when a communicating MS in the car leaves Celli, the procedure of Handover Out can be performed in Figure 7 and Figure 8. For the case of Call Arrival, a call is performed by a MS in Celli at t2 and the communicating MS leaves Celli at t3 (in Figure 8). Therefore, the number of Handover Out () can be estimated by Formula (5) in accordance with the probability of (τ > li/Vi) (in Figure 8). For the case of Handover In, a handover process is performed by a communicating MS in Celli at t1 when the MS enters Celli, and the communicating MS leaves Celli at t2 (in Figure 7). Therefore, the number of Handover Out () can be estimated by Formula (6) in accordance with the probability of (τ > x + li/Vi) (in Figure 7). Therefore, the number of Handover Out () is expressed as Formula (7):

Figure 8.
The timing diagram for Handover Out the specific Celli derived from Call Arrival [27,28,29,30,31,32,33].
3.4. The Number of Call Departures (Di)
For estimating the number of Call Departure (), two cases including (1) Call Arrival (in Figure 9 and Figure 10); and (2) Handover In (in Figure 11 and Figure 12) are discussed and analyzed. For the case of Call Arrival, a call is performed by a MS in Celli at t1 and the call departure of the MS is performed in Celli at t2 (in Figure 9 and Figure 10). In Case 1, the number of Call Departure is expressed as . For the case of Handover In, a handover process is performed by a communicating MS in Celli at t1 when the MS enters Celli, and the call departure of the MS is performed in Celli at t2 (in Figure 11 and Figure 12). In Case 2, the number of Call Departure is expressed as . Therefore, the number of Call Departure () is expressed as Formula (8). The scenario is called Call Departure derived from Handover In for Celli. Furthermore, Oi can be estimated by Formula (10) in accordance with Formula (7) and Formula (9):
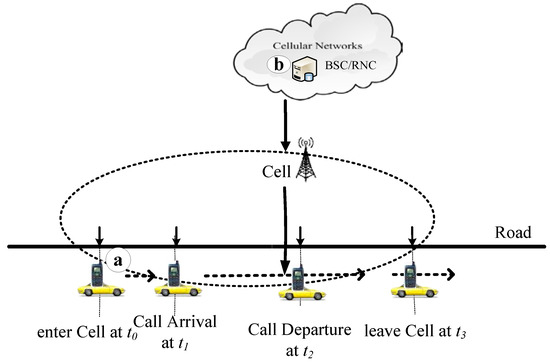
Figure 9.
The scenario diagram for vehicle movement and call departure in the specific Celli derived from call arrival [27,28,29,30,31,32,33].
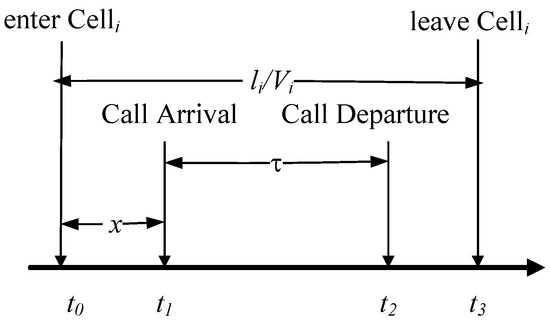
Figure 10.
The timing diagram for call departure in the specific Celli derived from call arrival [27,28,29,30,31,32,33].
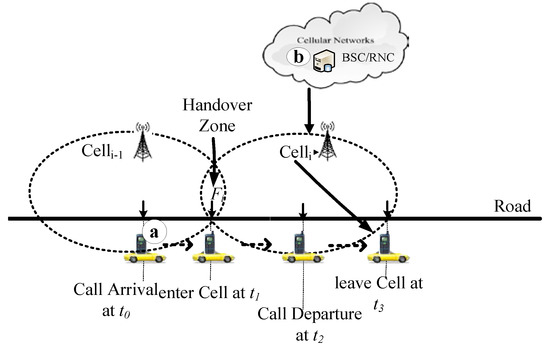
Figure 11.
The timing diagram for Call Departure in the specific Celli derived from Call Arrival [27,28,29,30,31,32,33].

Figure 12.
The timing diagram for call departure in the specific Celli derived from Handover In [27,28,29,30,31,32,33].
4. Numerical Analysis
This section investigates the communication behaviors of handovers and call arrivals by proposed model through numerical analysis. The input parameters are considered as follows:
- The variable li is the distance of the road segment covered by the cell i,
- the variable Vi which is the average speed of car,
- the variable Fi which is the car flow,
- the call inter-arrival time t (h) has exponential distribution with mean 1/λ,
- the call holding time τ(h) has exponential distribution with mean 1/μ.
The variable Ai is the count of call arrival per hour. The variable Oi is the count of Handover Out per hour. The variable Ii is the amount of Handover In. The variable Di is the amount of call department per hour. This study investigates the effects of traffic information and communication behaviors on the Ai and Oi.
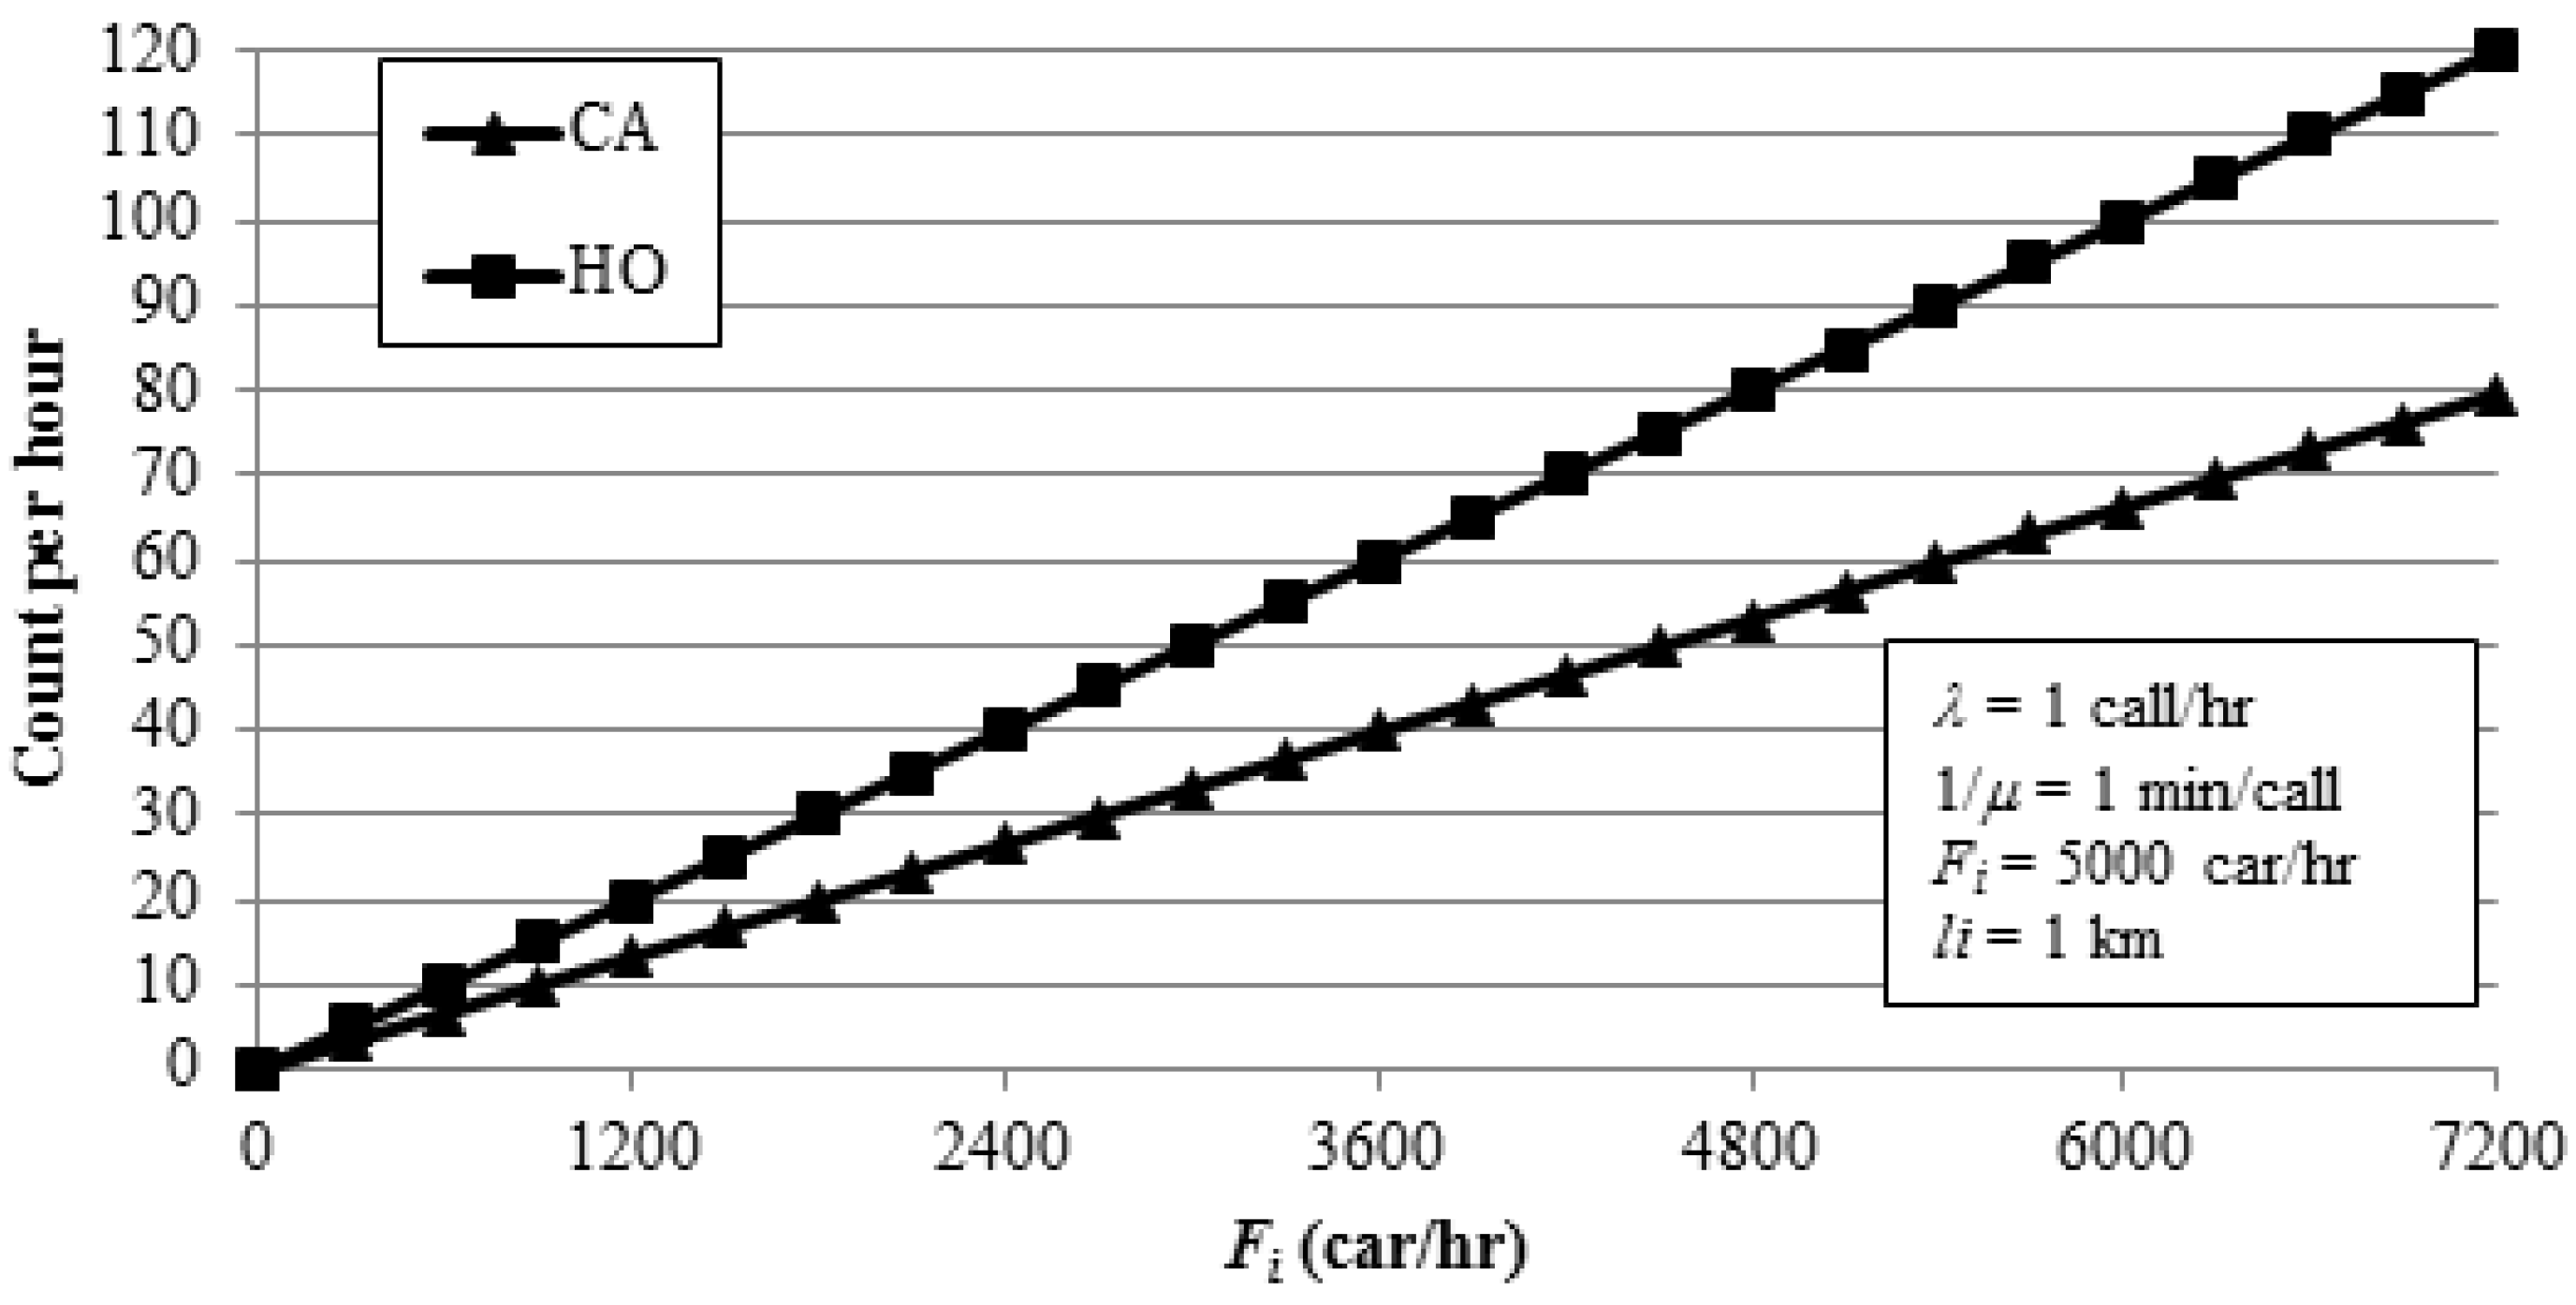
Effects of Fi on the Ai and Oi: Figure 13 shows that the numbers of Ai and Oi are increased in accordance with Fi. Several MSs are carried in Celli to generate the signals of call arrivals and handovers with traffic congestion. Therefore, the factor of car flow (Fi), which is important.
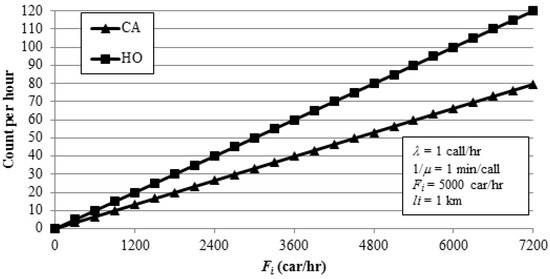
Figure 13.
Effect of Fi on the Ai and Oi.
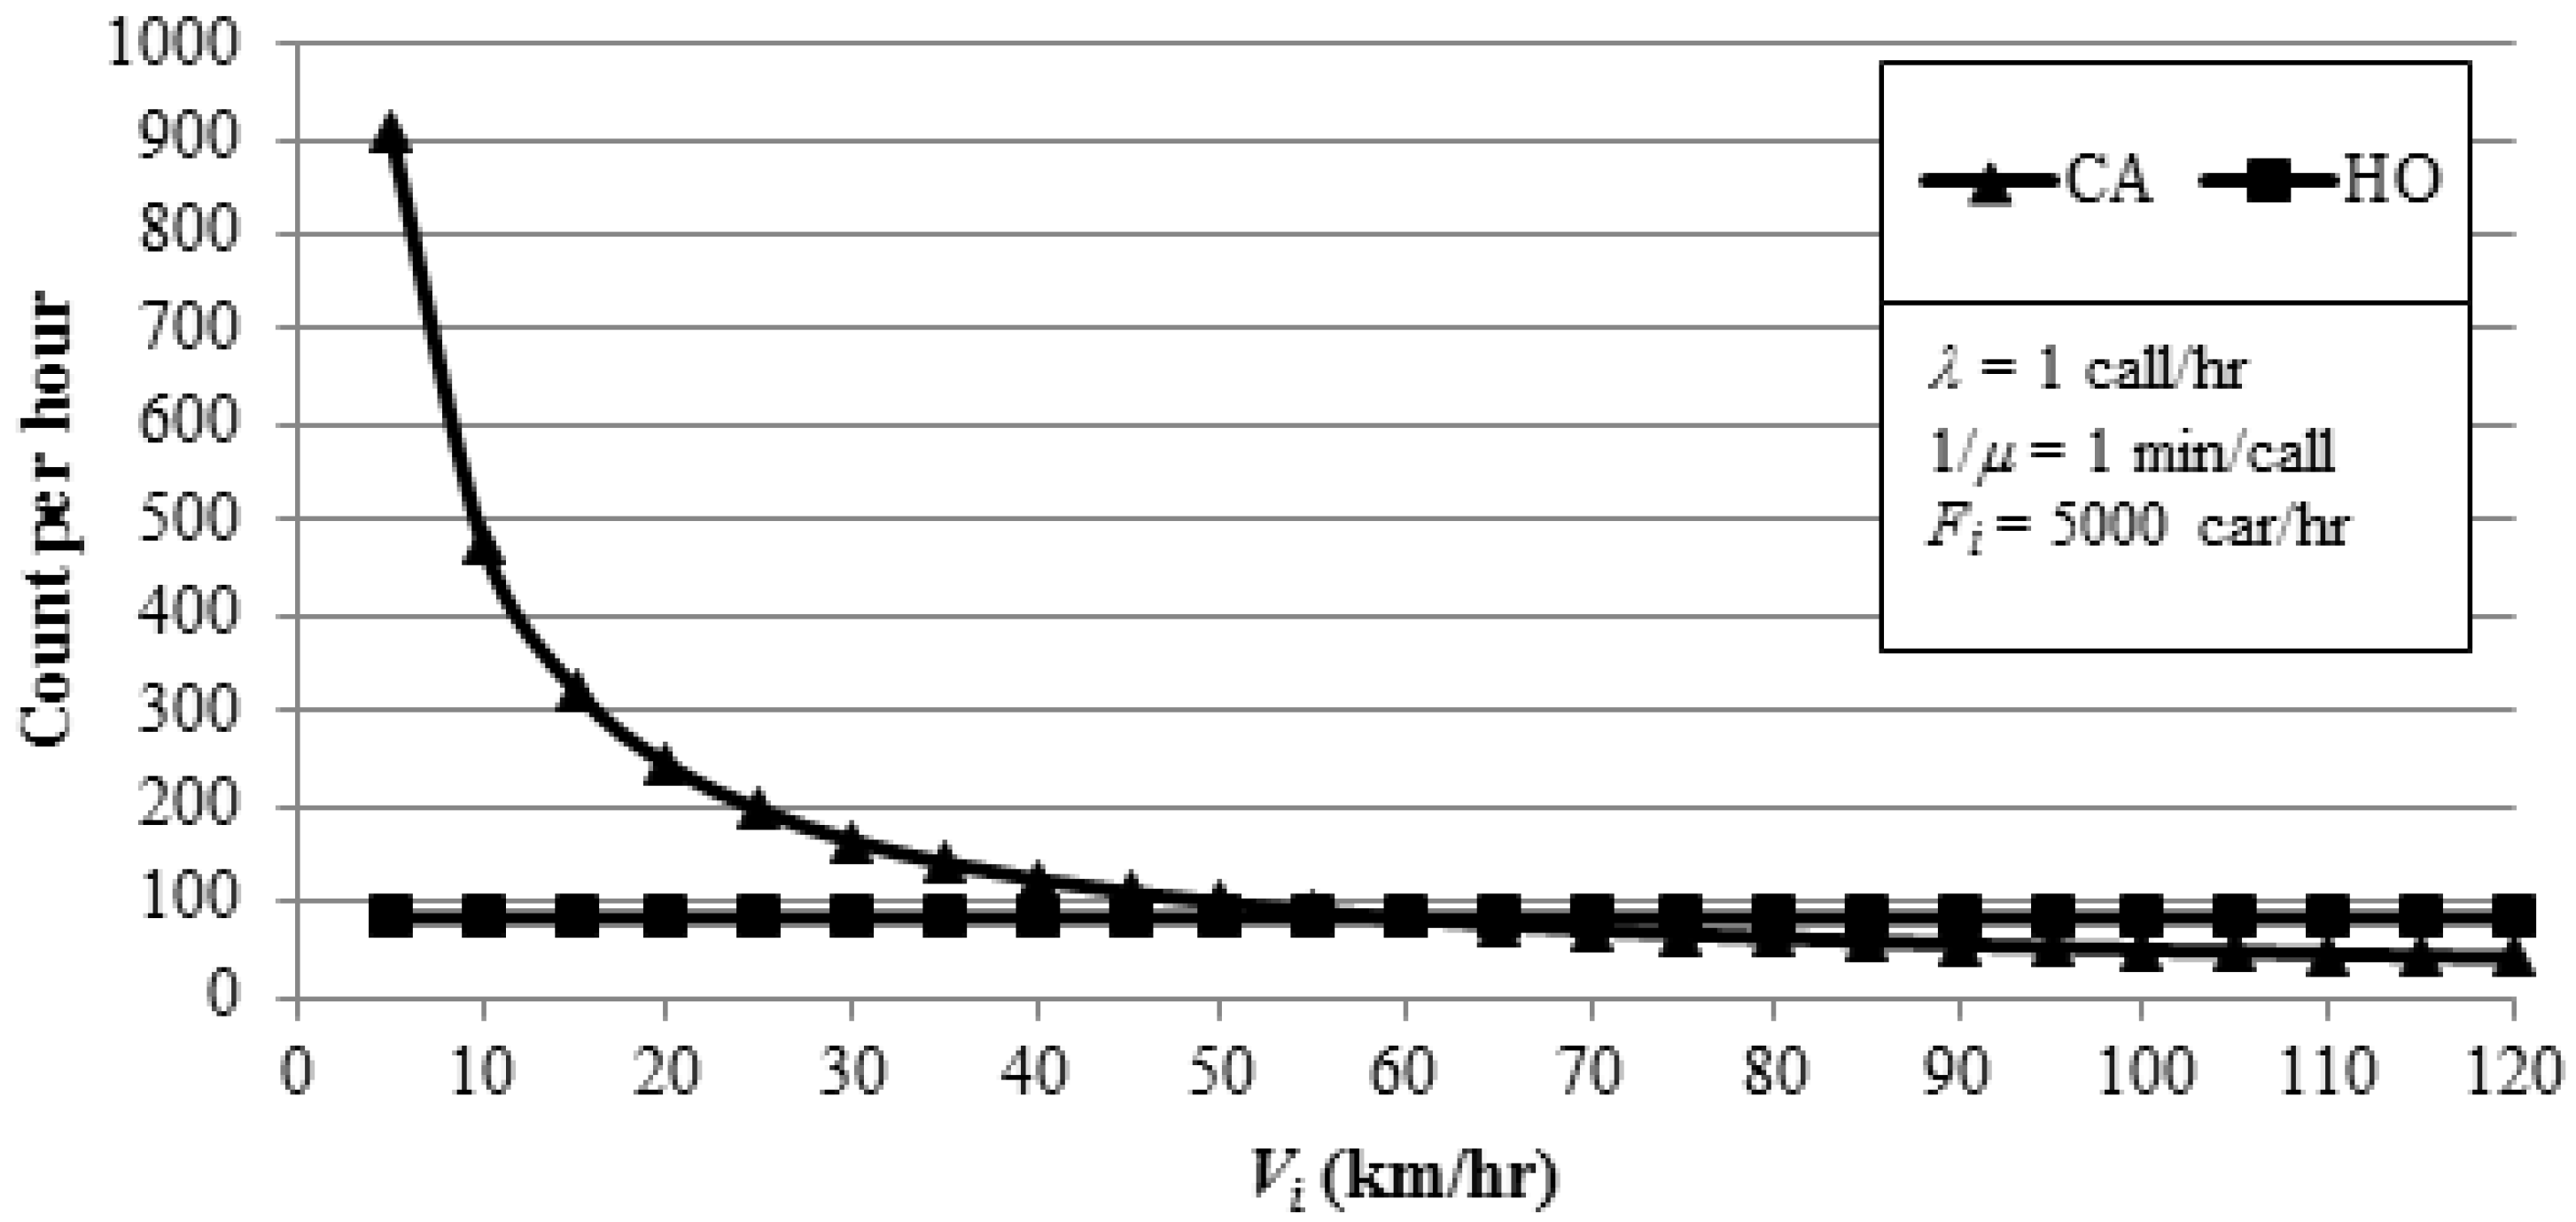
Effects of Vi on the Ai and Oi: Figure 14 shows that the number of Ai is decreased in accordance with Vi, but the number of Oi is not affected by Vi. This study focuses on the channel allocation for handover, so the factor of the average speed of car (Vi) is not important.

Figure 14.
Effect of Vi on the Ai and Oi.
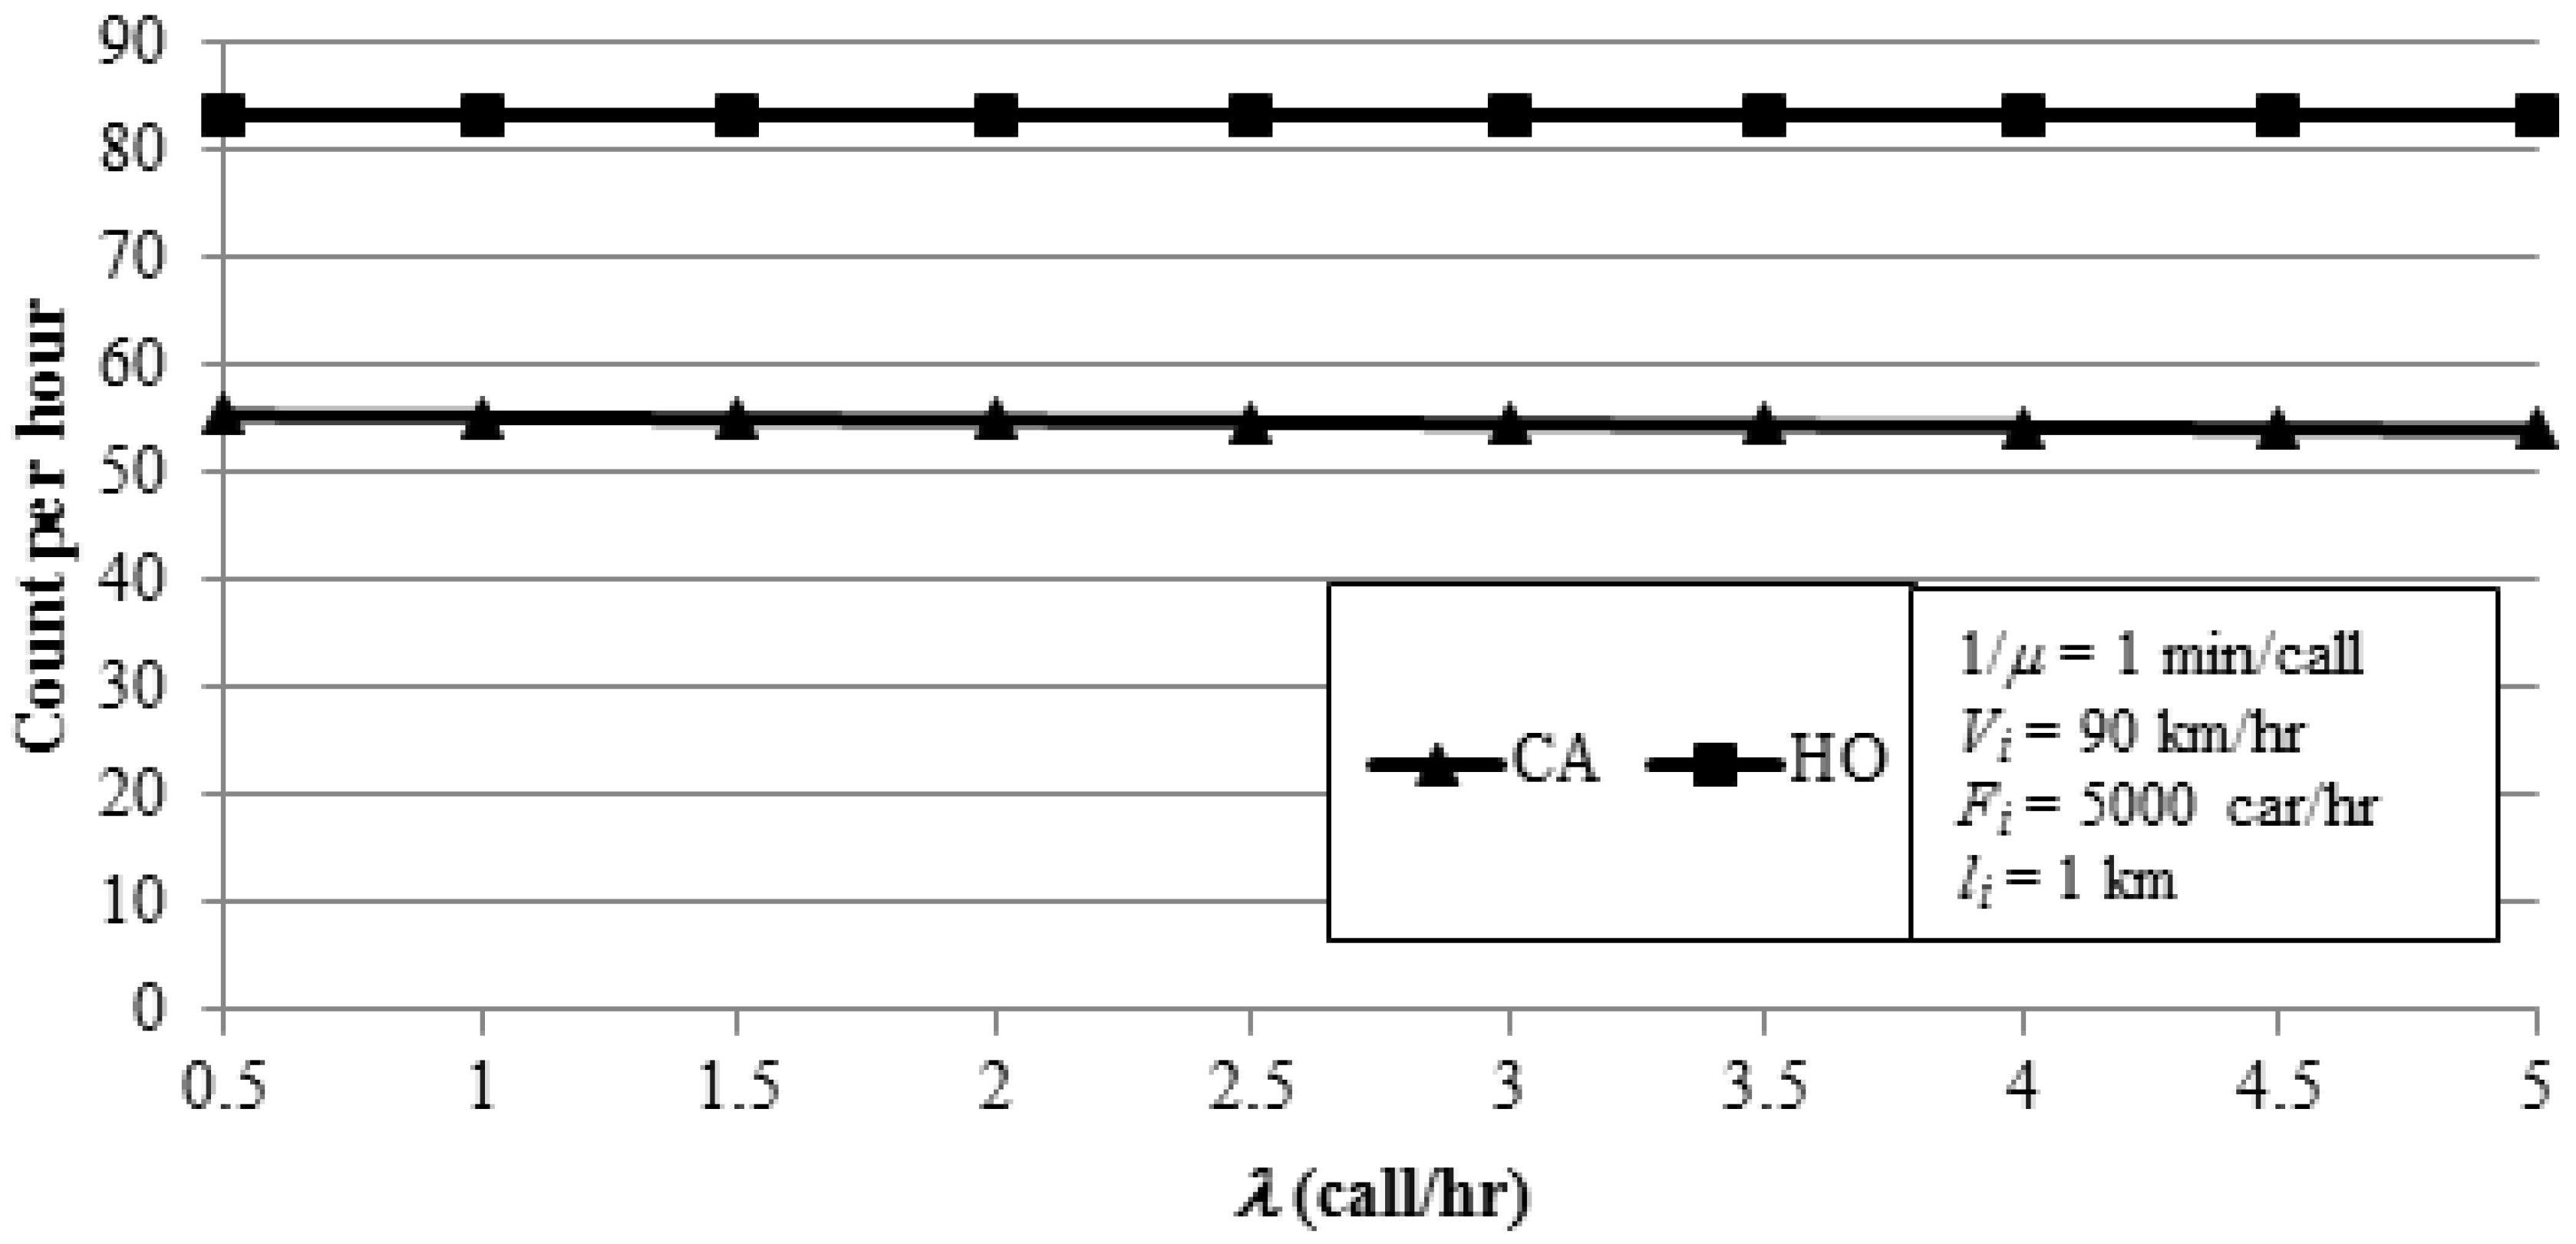
Effects of λ on the Ai and Oi: Figure 15 plots Ai and Oi against λ, which indicates that Ai and Oi are unchanged as λ increases. This phenomenon is explained as follows. When the call inter-arrival time (λ) increases, the influence of call inter-arrival time (λ) on Ai and HOC are invalid. Though Figure 15, the factor of call inter-arrival time (λ) is not important for channel allocations.
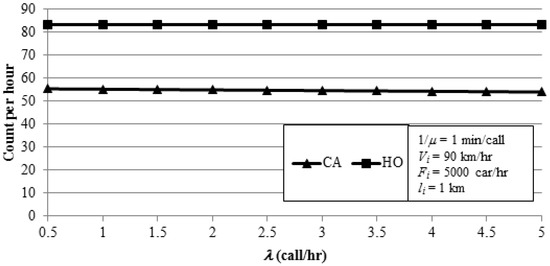
Figure 15.
Effect of λ on the Ai and Oi.
Effects of μ on the Ai and Oi: Figure 16 plots Ai and Oi against μ, which indicates that Ai is unchanged and Oi increases as call holding time (μ) increases. This phenomenon is explained as follows. When the call holding time (μ) increases, the amounts of handover become higher. In the other words, no matter how the call holding time (μ) changes, the influence of the call holding time (μ) on Oi is invalid. In Figure 16, the factor of the call holding time (μ) is important for channel allocations.
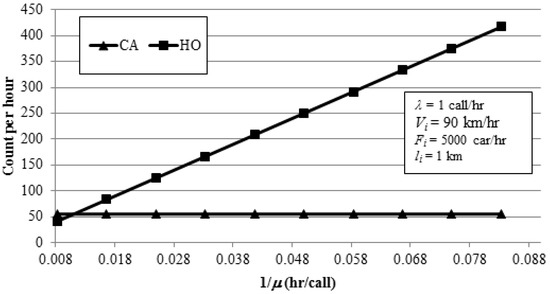
Figure 16.
Effect of μ on the Ai and Oi.
5. Simulation Analyses
Trace-driven experiments were designed and performed to analyze relationship of the traffic information and communication behaviors in cellular networks. For vehicle movement trace generation, this study simulated the highway scenario by VISSIM (V.5.20; Planung Transport Verkehr AG, Karlsruhe, Germany) and assigned the position of each cell and the position of the handover. The vehicle movement and MS communication traces are generated by a traffic simulation program VISSIM. This study considered a highway scenario that is characterized by the Wiedemann “psycho-physical” car-following model and lane changing model [34,35,36]. The conceptual development and limited available data can be considered by the Wiedemann model to generate traffic steam data for highways and freeways [27,28]. For MS communication trace generation, this study assumed that the distribution of call holding time is exponential with the mean 1/μ and the distribution of call inter-arrival time is exponential with the mean 1/λ [26,27,28,29,30,31,32,33]. The communications of each MS were simulated according to the assumptions. Finally, this study assumed that an MS is carried in a car, so the vehicle movement traces and MS communication traces were combined in accordance with car IDs (shown in Figure 17).
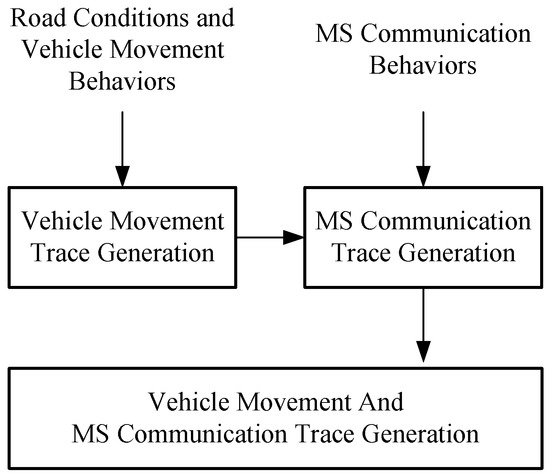
Figure 17.
The architecture of simulation [28].
5.1. Simulation Case Design and Performance Metrics
In experiments, this study designed two cases of simulations, which are the whole day simulation and the traffic accident simulation, respectively. Case 1 is the whole day simulation. This study obtained the peak and off-peak of traffic flow from this case. Through the variation of actual traffic flow, this study analyzed the use of channels and handover occurrence. Case 2 is the traffic accident simulation. This study simulated the vehicle movement and communication behavior before and after traffic accident. In Case 2, this study analyzed the surging amount of traffic flow and discussed the relation of traffic flow and the number of handovers.
5.1.1. Case 1: Whole Day
In Case 1, the traffic information is obtained from the actual VDs that were built on the 42 KM milepost on National Freeway No. 1 on 31 July 2008. This study used the real traffic information to simulate the vehicle movement and MS communication behaviors. The length of a three-lane highway is 10 km was considered in experimental environments. In this case, 10 cells were sequentially distributed on the 10-km length highway from 0 km to 10 km, and a 1 km length road segment could be covered by a cell. Therefore, 11 handover points were distributed on the 0 km length highway. Furthermore, 11 Data Collection Points (DCPs) were assumed to be located at these 11 handover points. When a car passed a DCP, the passing time was recorded. It means that the coverage area of Cell1 is the area between the first DCP1 and the second DCP2. In this case, this study obtained the traffic information for the whole day and analyzed the CBP during traffic peak hours and traffic off-peak hours.
5.1.2. Case 2: Traffic Congestion
This study designed a traffic accident to simulate the MS communication behavior and handover events in the situation of traffic congestion. This study observed the number of channels used in a cellular system during traffic congestion occurrence and ease. The setting of road environments is the same as Case 1. In Case 2, the parameters of road information and communication behaviors were assumed as these parameters in Case 1. However, the traffic flow was assumed as 5000 vehicles per hour in Case 2 for the estimation of traffic congestion. The desired speed of each vehicle was assumed between 85 and 120 km/h when the status of traffic condition is free flow. The total simulation time is 1.5 h. This study simulated a traffic accident that impacts two lanes on the road, and the mileage is between 5.05 and 5.35 km from simulation time from the 15th min to the 45th min. When vehicles go through this road segment, the average speed of car is dropped to 4–6 km/h. Until simulation time to the 45th min, the traffic accident is removed and the traffic conditions returns to a free flow.
5.1.3. Performance Metrics
In a cellular system, the CBP (Pi) in Celli is an important performance metric for measuring the quality of service. The CBP is denoted as Formula (11). The number of call block (Bi) divided by the number of the Handover In (Ii) in Celli. The probability represents the fraction of the number of handovers that are blocked:
5.2. Simulation Results and Analyses
In this section, this study introduced the simulation results and analysis. In the simulations, this study analyzed two cases that are for the whole day simulation and traffic accident simulations. Therefore, this study separately analyzed the results derived from both cases.
5.2.1. Case 1: Whole Day
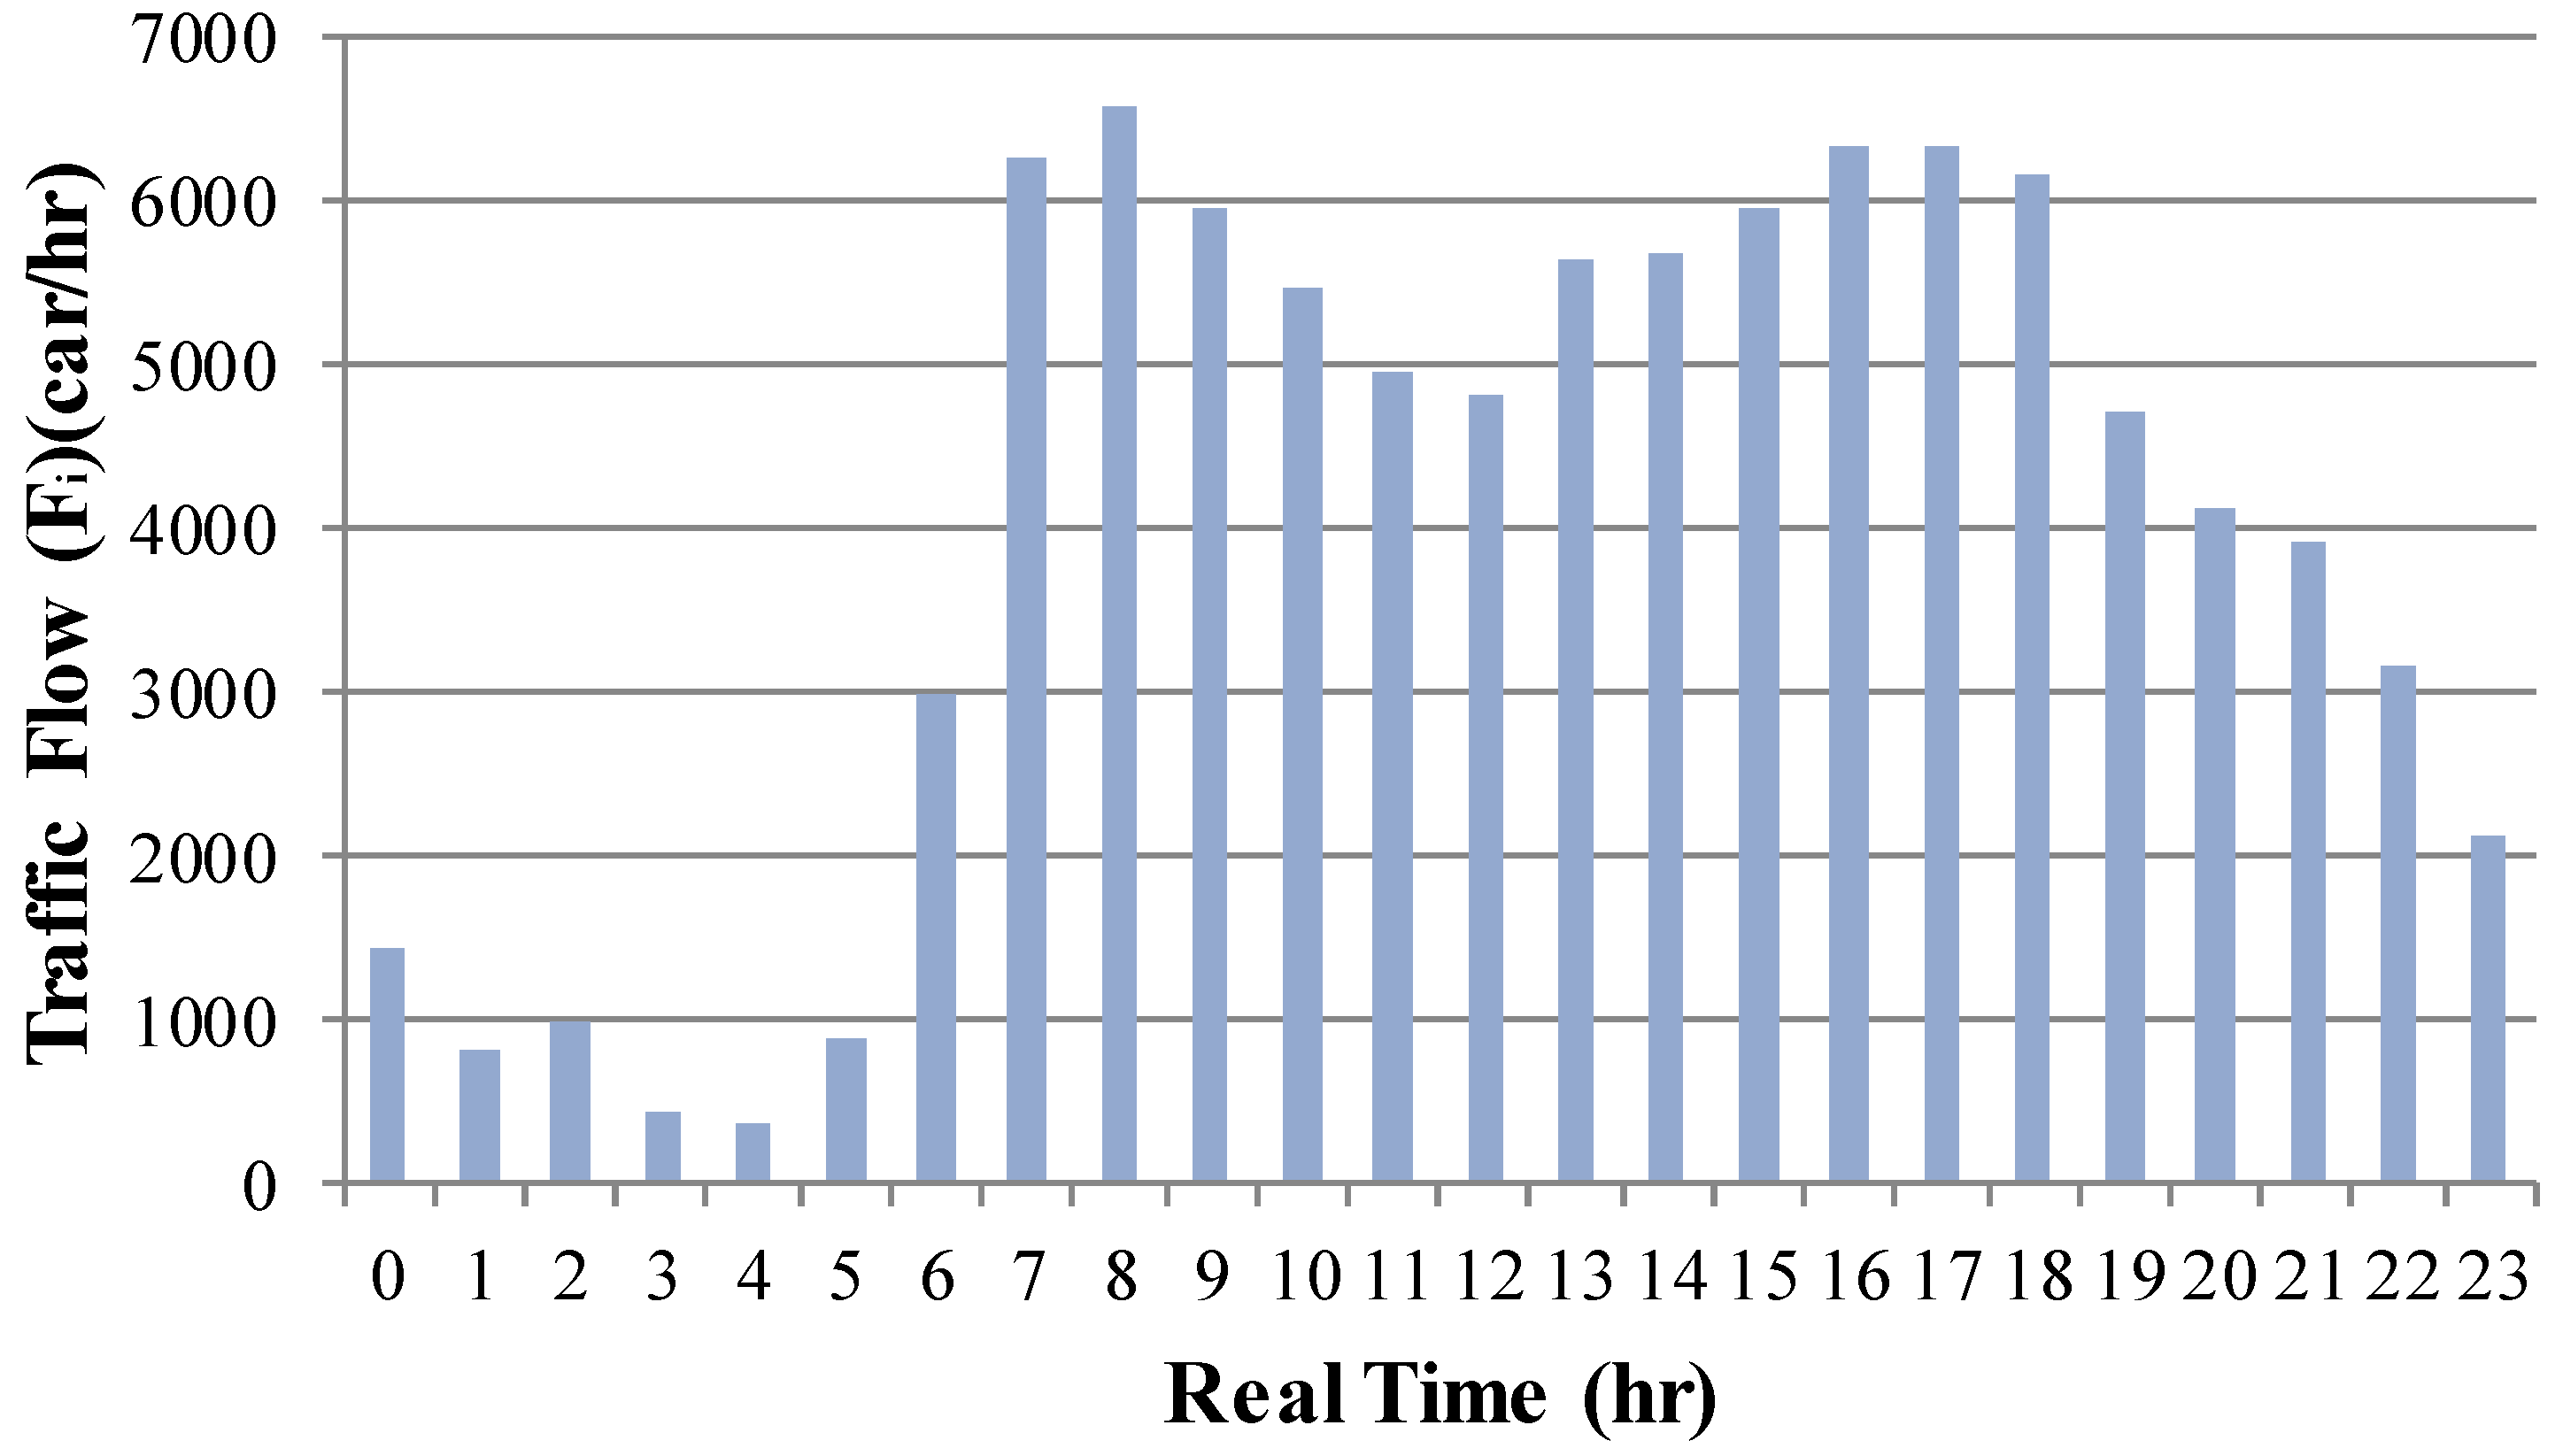
In the whole day simulation, this study simulated the traffic information (e.g., traffic flow and vehicle speed) in Cell6 in the whole day shown as Figure 18. In experiments, this study analyzed the relation of traffic flow and the number of Handover In (Ii) in each cell. This study observed the CBP (P6) in Cell6 during the traffic peak hour (i.e., 8:00 a.m.) and the traffic off-peak hour (i.e., 4:00 a.m.). In Figure 18, this study can discover that the minimum number of traffic flow is off-peak at 4:00 a.m. because the time is deep into the light in Taiwan. Figure 19 shows the number of Handover In (I6) in Cell6 for the whole day. In this situation, the number of Handover In (I6) is lower with the lower traffic flow. When the time is going into the morning, this study can discover that the maximum amount of traffic flow at 8:00 a.m. reaches the peak of the whole day. The number of Handover In (I6) is higher with the higher traffic flow during the traffic peak hour. These simulation results can prove that the number of handovers increase with the amount of traffic flow increase in Case 1. According to the simulation results, the proposed mechanism can dynamically allocate the channels to use the source of channels effectively.

Figure 18.
The traffic flow in Cell6 in a whole day.
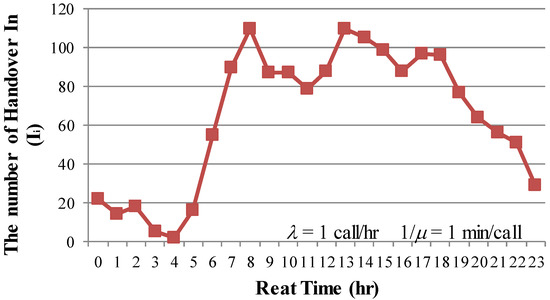
Figure 19.
The number of Handover In (I6) in Cell6 in a whole day.
5.2.2. Case 2: Traffic Congestion
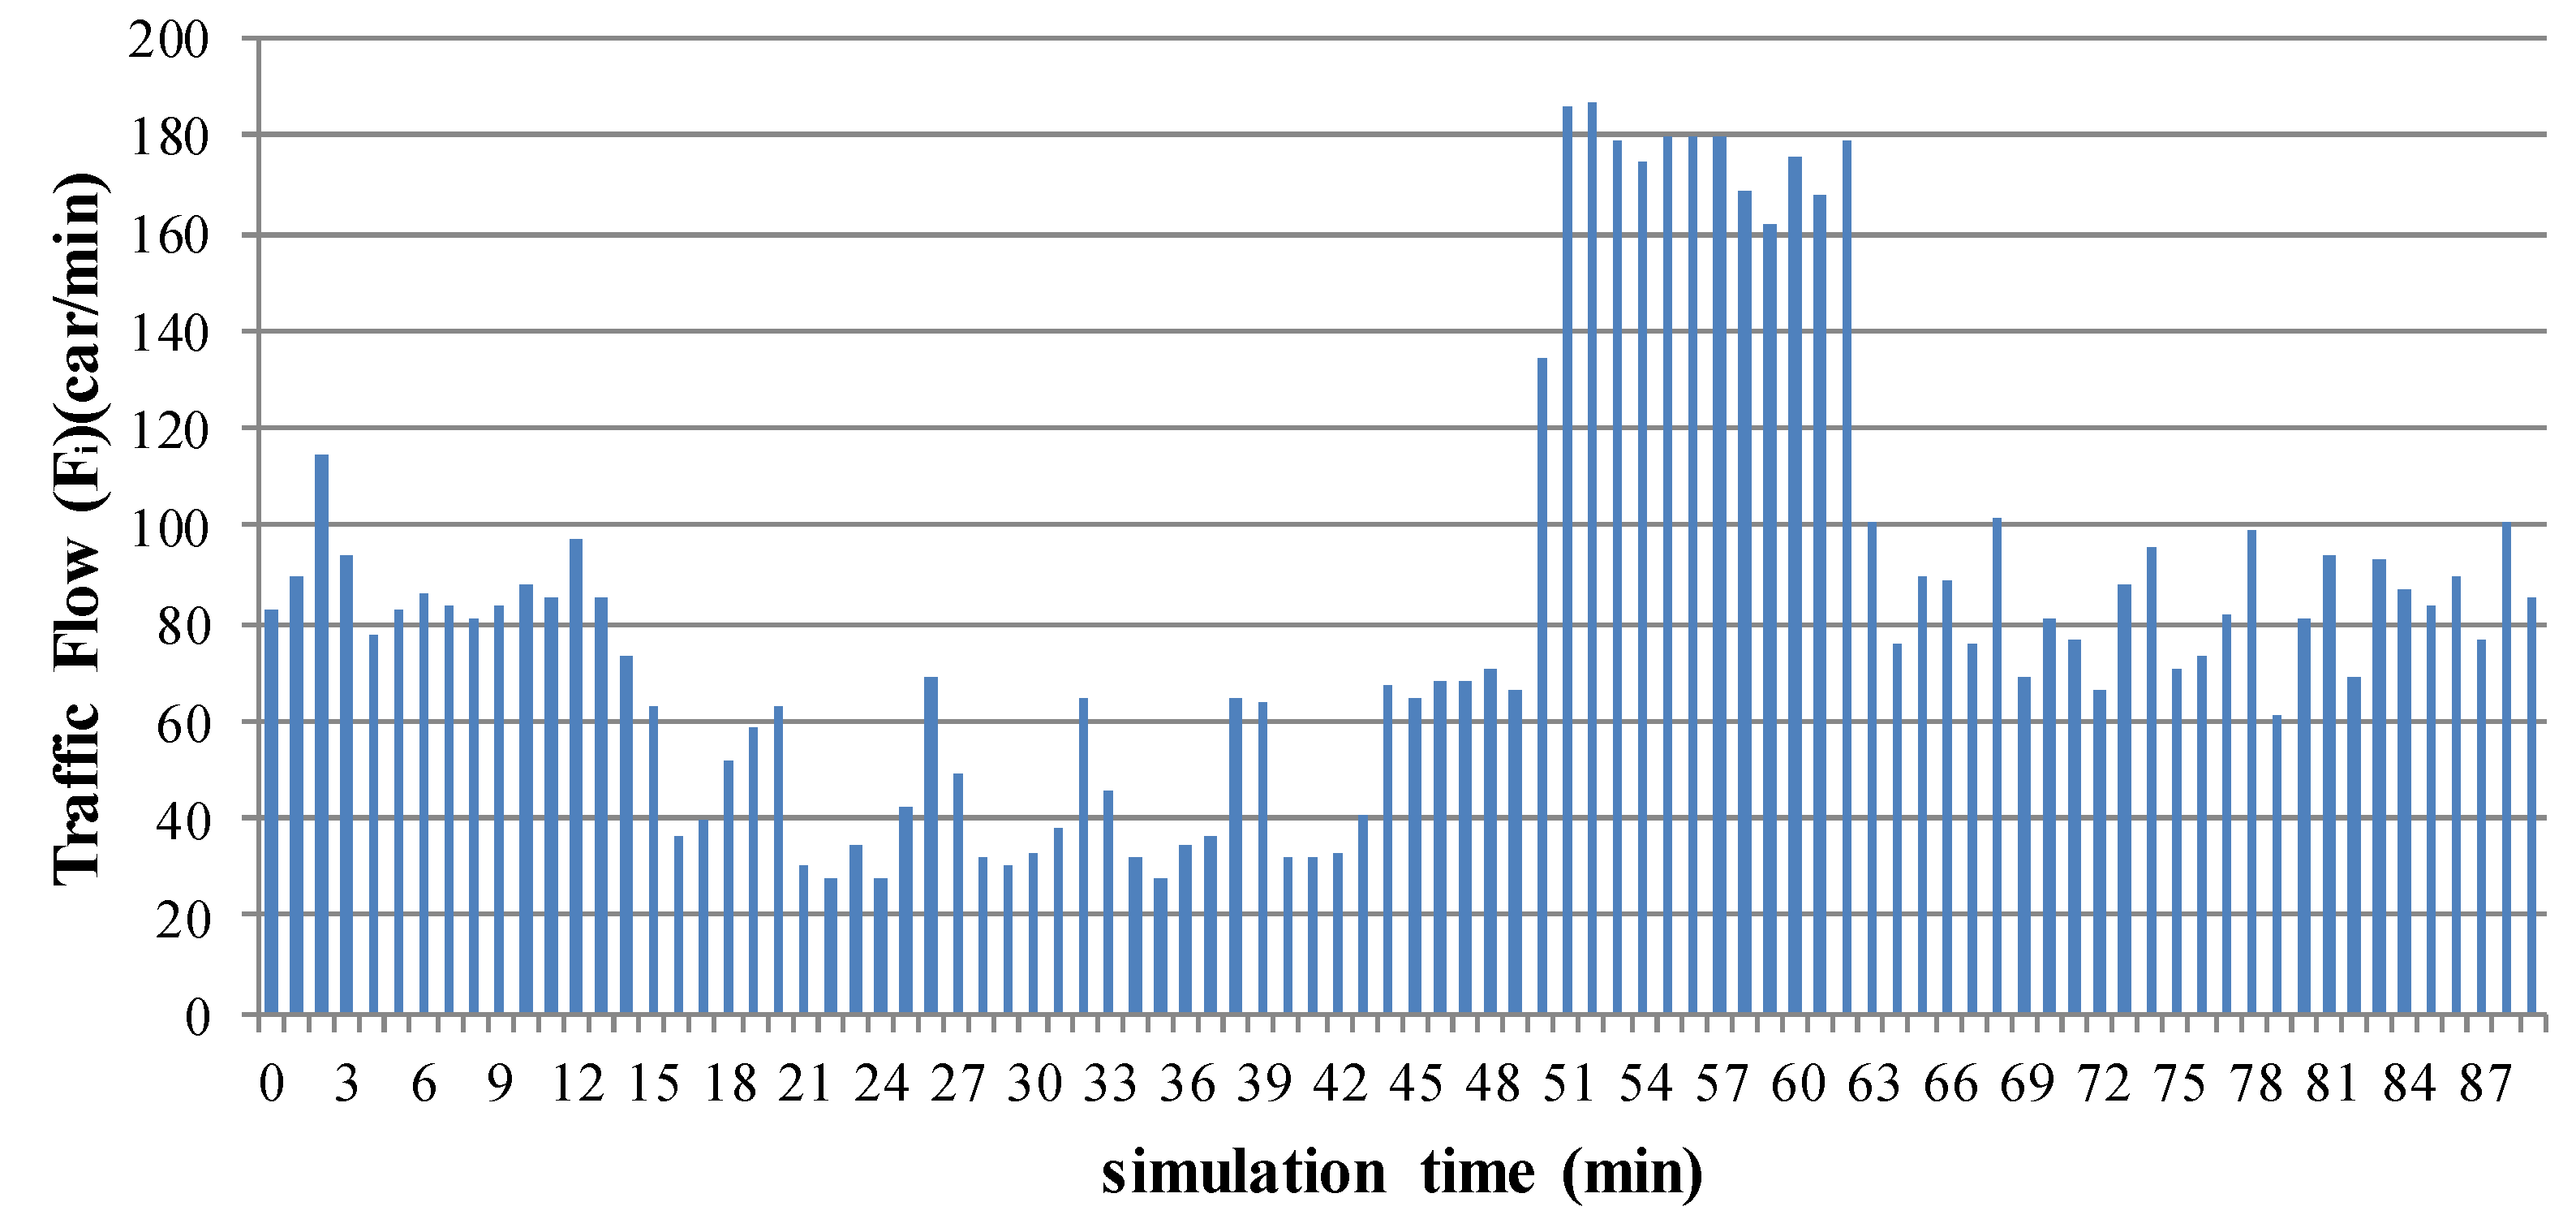
In the traffic accident simulation, this study analyzed the relation of the variability of traffic information and the number of Handover In (Ii). Figure 20 shows the traffic information in the simulation. At the simulation time 16th min, the traffic accident occurs at the mileage of 5.05 km in simulation, and the traffic jam occurs in Cell5. The cars move slowly and line up in Cell5, and they can’t go into the Cell6. For Cell6, the amount of traffic flow will drop substantially and the average vehicle speed also drops substantially after traffic accident occurrence. When the traffic accident is removed at the simulation time 45th min, the traffic condition will return to a free flow. Therefore, this study can discover that the amount of traffic flow increases rapidly when the traffic accident is removed. This study analyzed the number of Handover In (Ii) before and after the traffic accident occurrence.

Figure 20.
The traffic flow in Cell6.
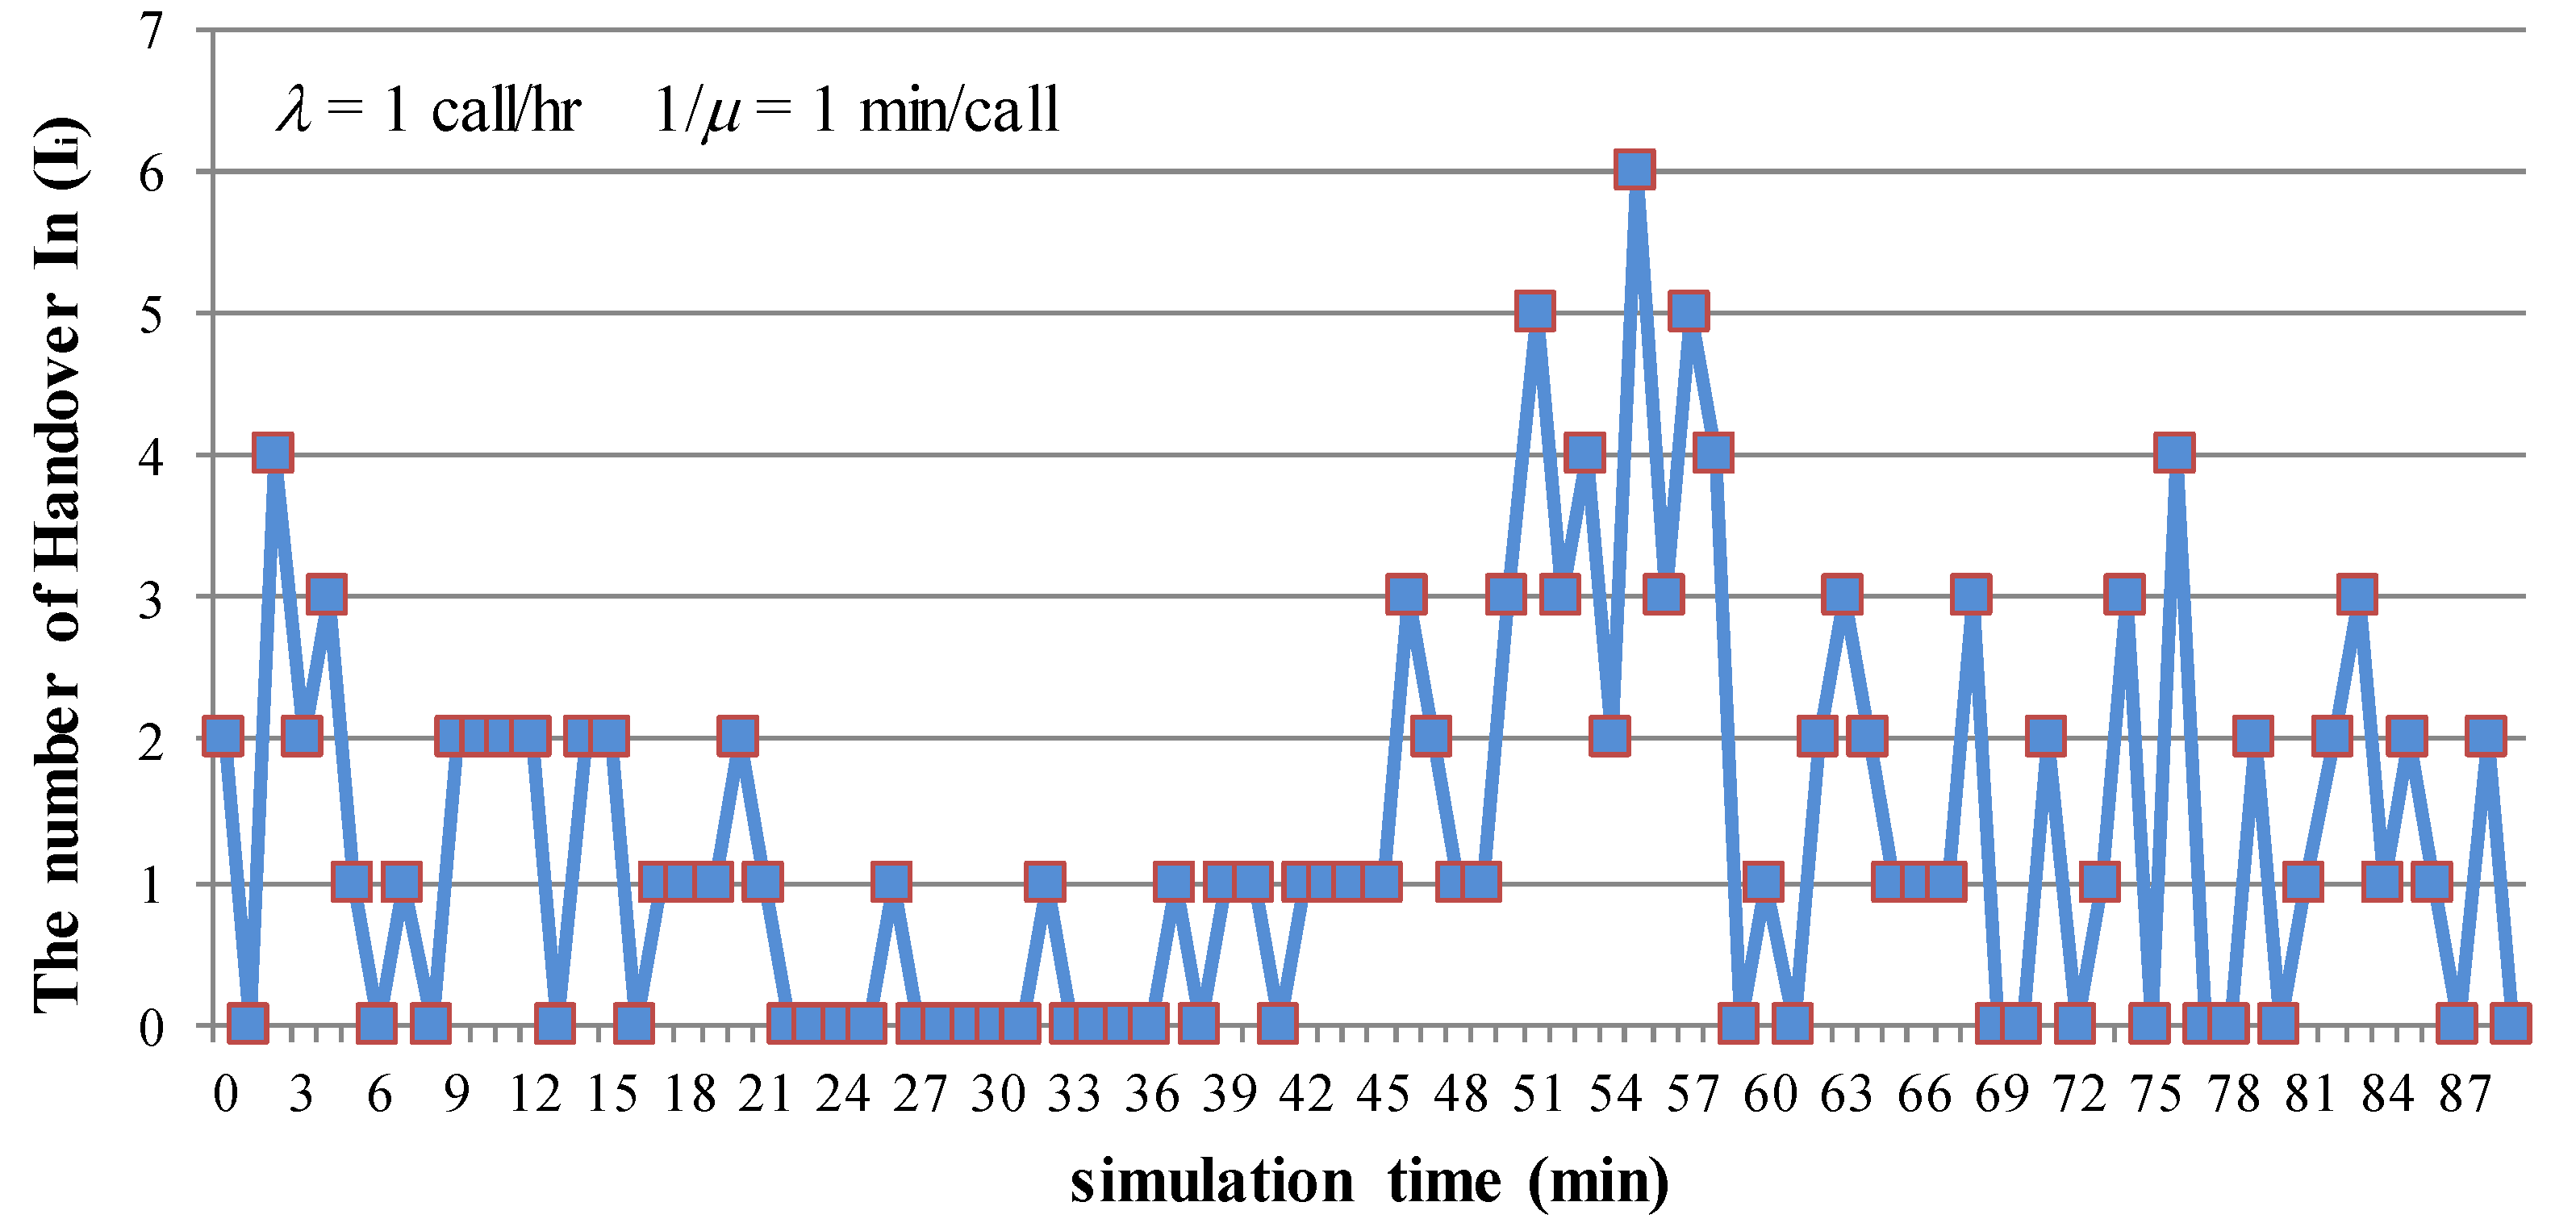
However, the traffic accidents impact the number of Call Arrival, Handover In, Handover Out, and Call Departures in cellular systems. If this study applies the traditional SCA mechanism to support the handover events in cellular system, it will waste the number in the dynamic environment and cause the higher CBP with the amount of traffic flow to increase rapidly. Figure 21 shows that the number of Handover In (I6) drops substantially during the traffic accident in Cell6 between the simulation time 16th min and the 45th min. The number of Handover In (I6) increases substantially in Cell6 when the traffic accident is removed at the simulation time 46th min.
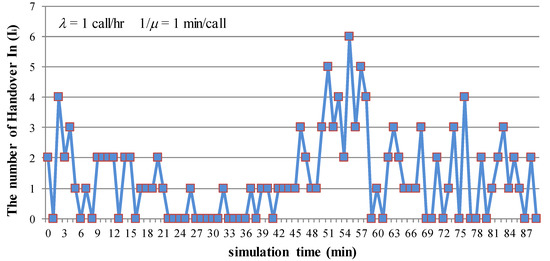
Figure 21.
The number of Handover Out (O6) in Cell6.
5.2.3. Comparisons between SCA and Proposed Mechanism
In this subsection, this study analyzed the CBPs that are derived from the traditional SCA mechanism and the proposed mechanism under the two cases. The CBP (Pi) is denoted as the number of the call blocks (Bi) divided by the number of handover In (Ii) in Celli. The traditional SCA mechanism doesn’t consider the specific channel propagation conditions. Katzela and Naghshineh define the parameter D and R [10], where D is the physical distance between the two cell centers equal to 1 km and the R is the radius of the cell equal to 0.5 km in this case. They only assumed that the distance (D/R) which depends on the cellular system environment is allowed to reuse the same channel in cells. Therefore, if the channel is allocated to Celli,, it cannot be reused in the same cell at the same time because of unacceptable co-channel interference. In SCA, the number of channels for handover events that are calculated by Formula (12) is equal to 2. Otherwise, in the proposed mechanism, the number of channels for Handover In in each cell is dynamically adjusted according to the traffic information in each cell. The comparison between SCA mechanism and the proposed mechanism is introduced as follows:
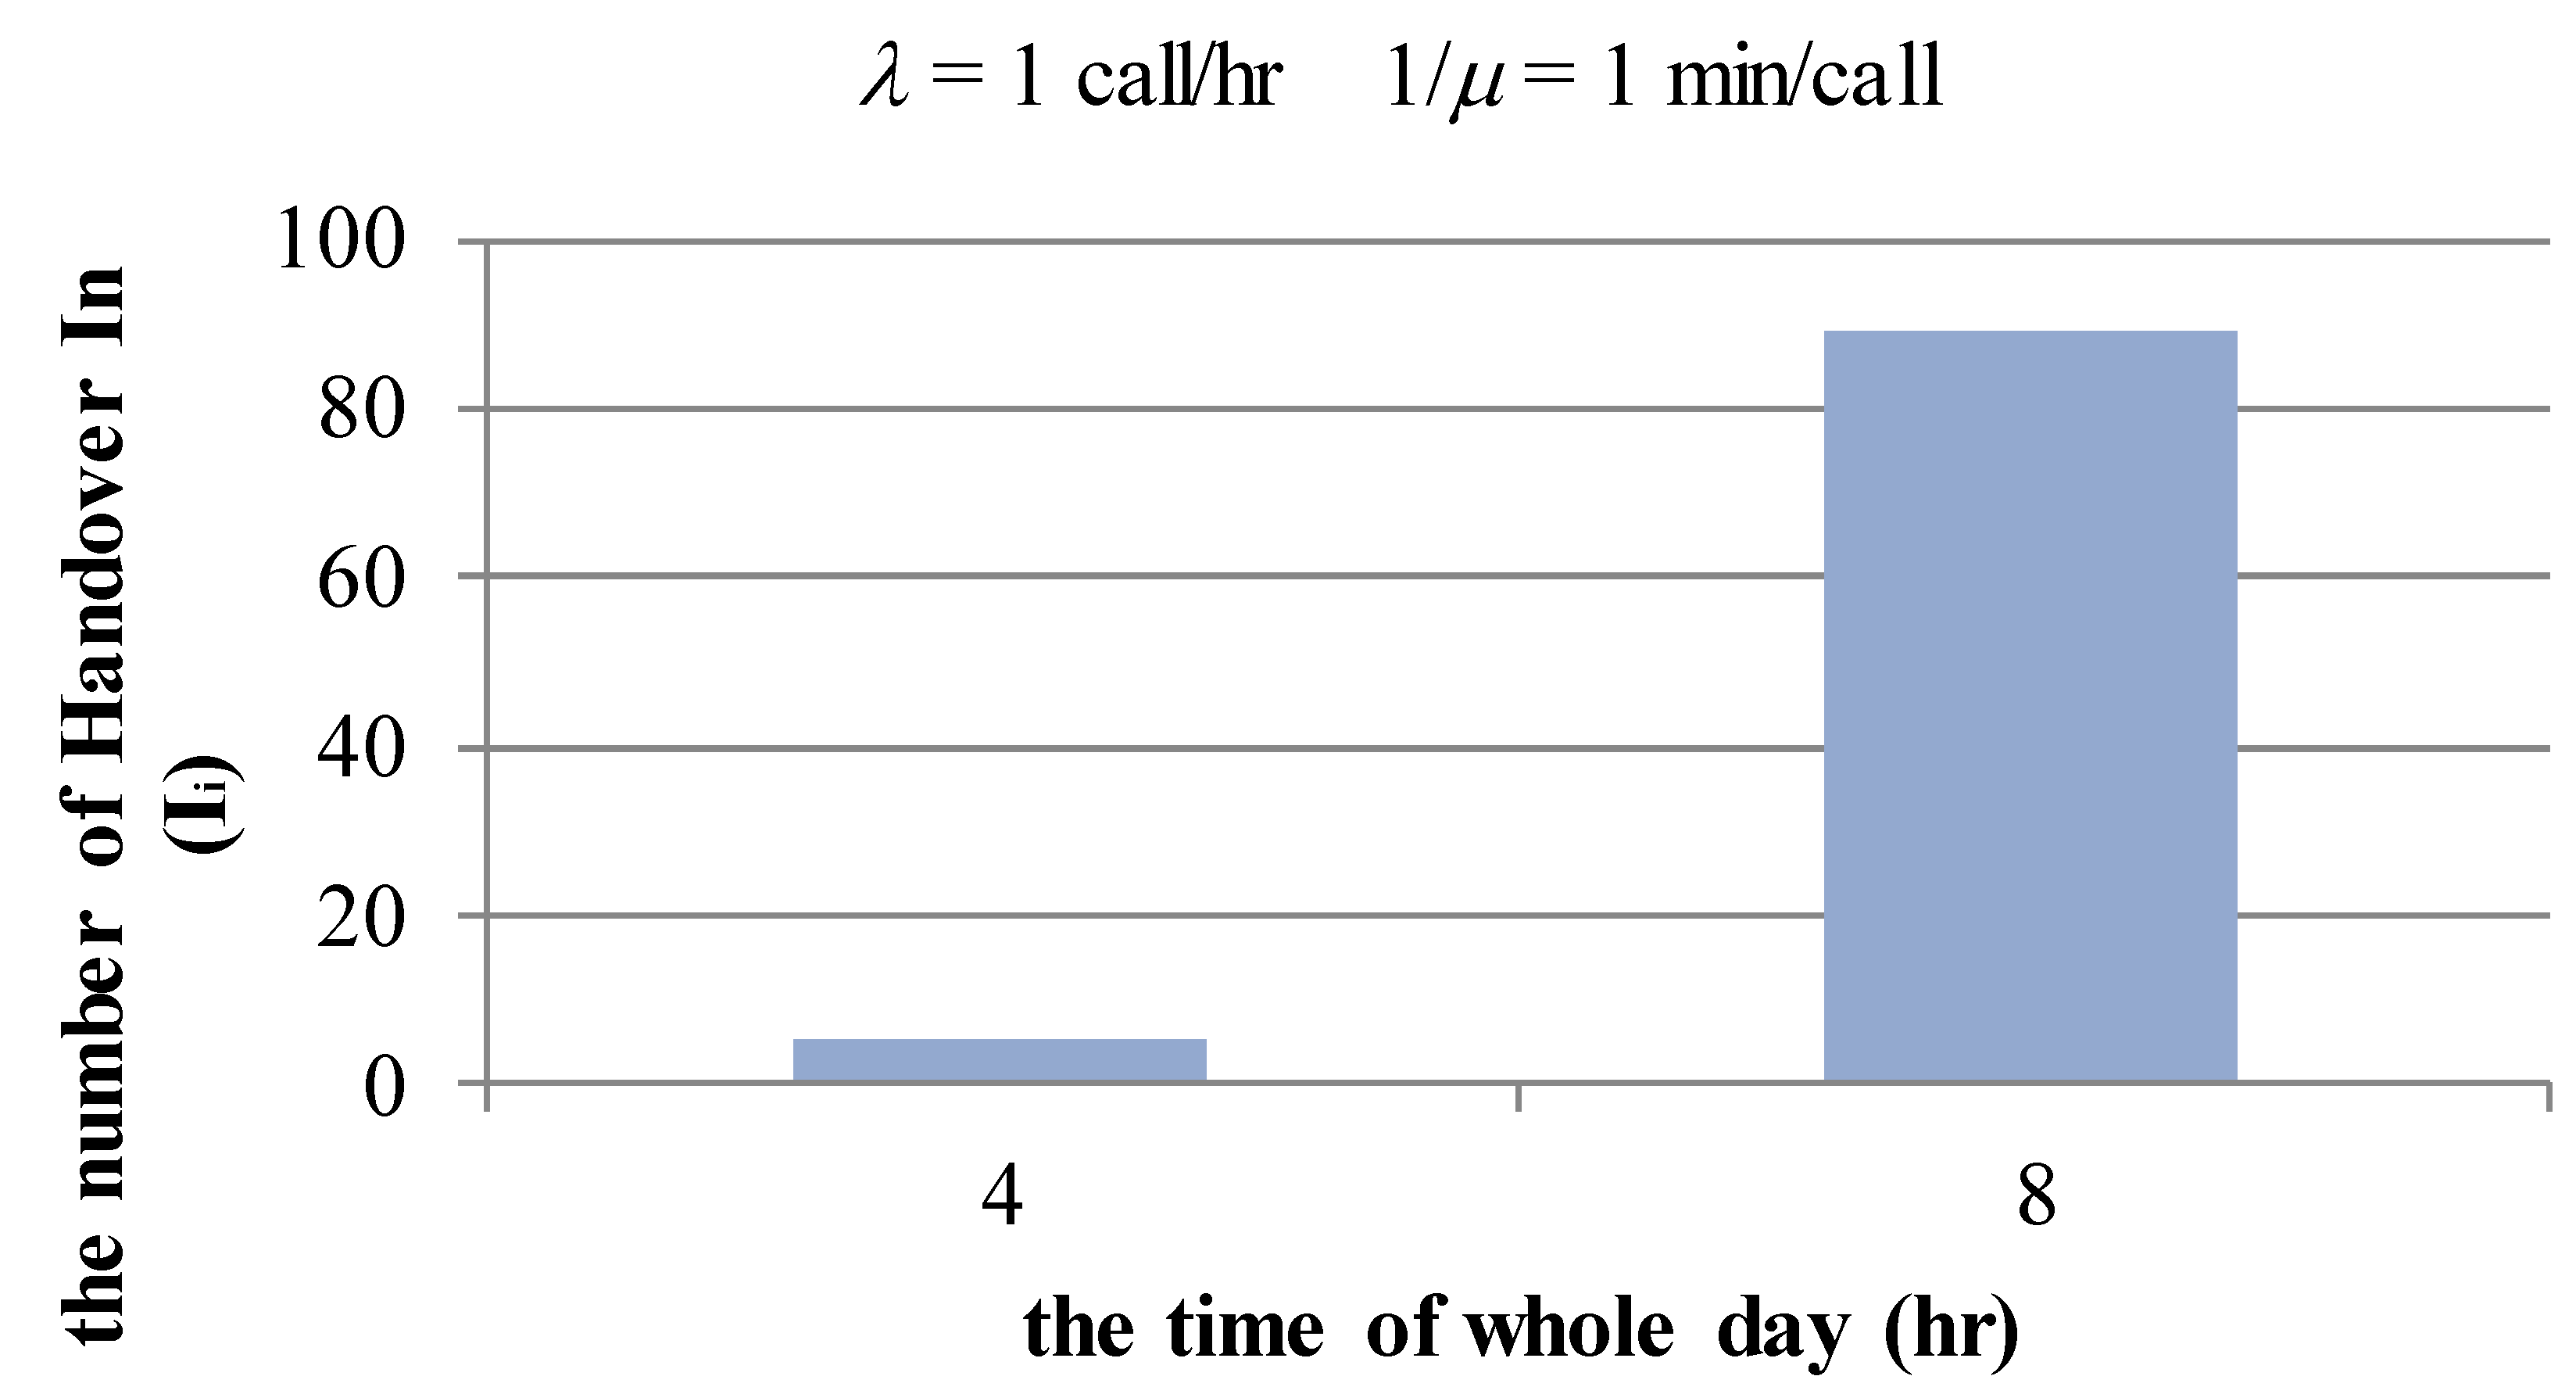
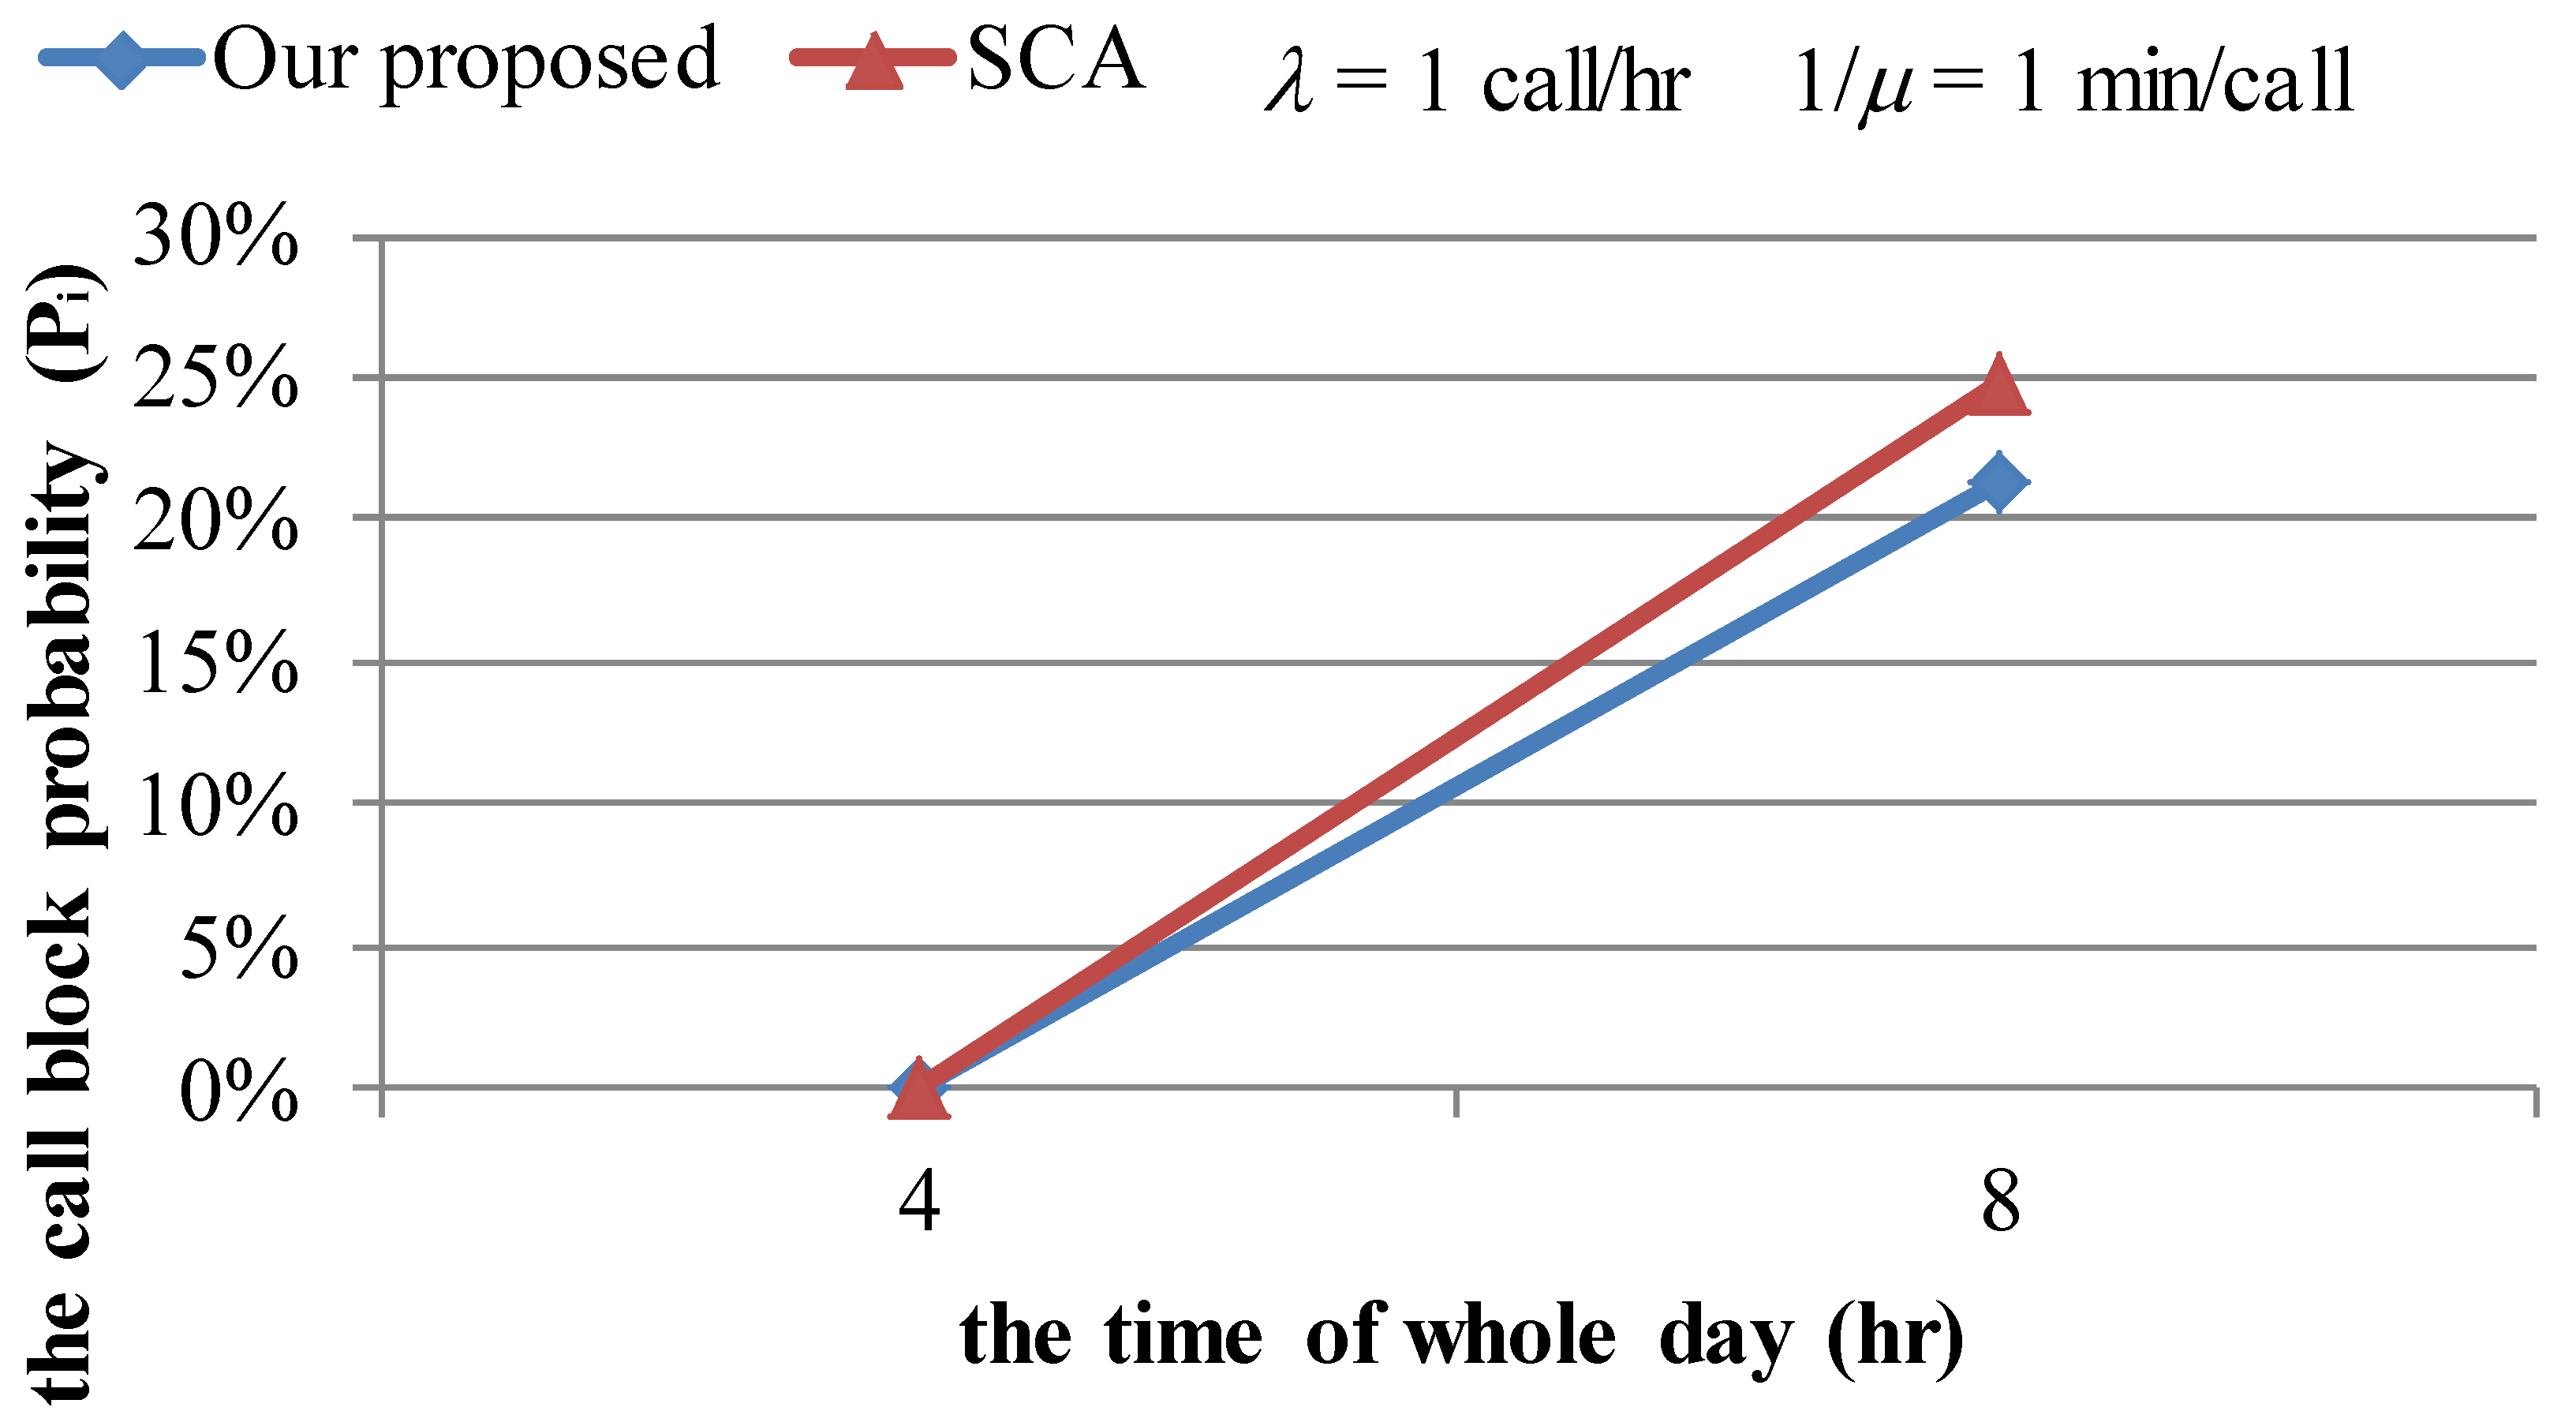
In Case 1, this study analyzed the numbers of Handover In (Ii) during peak hour and off-peak hour. Figure 22 shows that the minimum amount of traffic flow and the minimum number of Handover In (I6) in Cell6 are during 4:00 a.m. (i.e., off-peak hour). Otherwise, the maximum number of the traffic flow and the maximum number of Handover In (I6) in Cell6 are during 8:00 a.m. (i.e., peak hour). Figure 23 shows that the CBPs (P6) are derived by using SCA and the proposed mechanism in Cell6 during simulation time 4:00 a.m. and 8:00 a.m.. For Handover In events, the number of channels in the traditional SCA mechanism is set to 2 and the number of channels in the proposed mechanism is dynamically adjusted depending on the actual traffic information. Through Figure 23, this study can discover that the all CBPs in this case are less than 21.5% by using the proposed mechanism, which is better than using the SCA mechanism. The results indicate that the proposed mechanism is suitable for the normal case in real life.
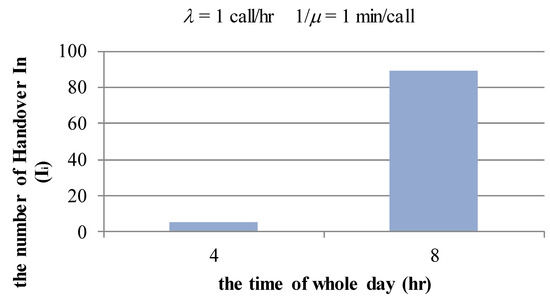
Figure 22.
The number of Handover In (I6) at 4:00 a.m. and 8:00 a.m. in Cell6.

Figure 23.
The CBPs (P6) are derived by SCA and the proposed mechanism during 4:00 a.m. and 8:00 a.m. in Cell6.
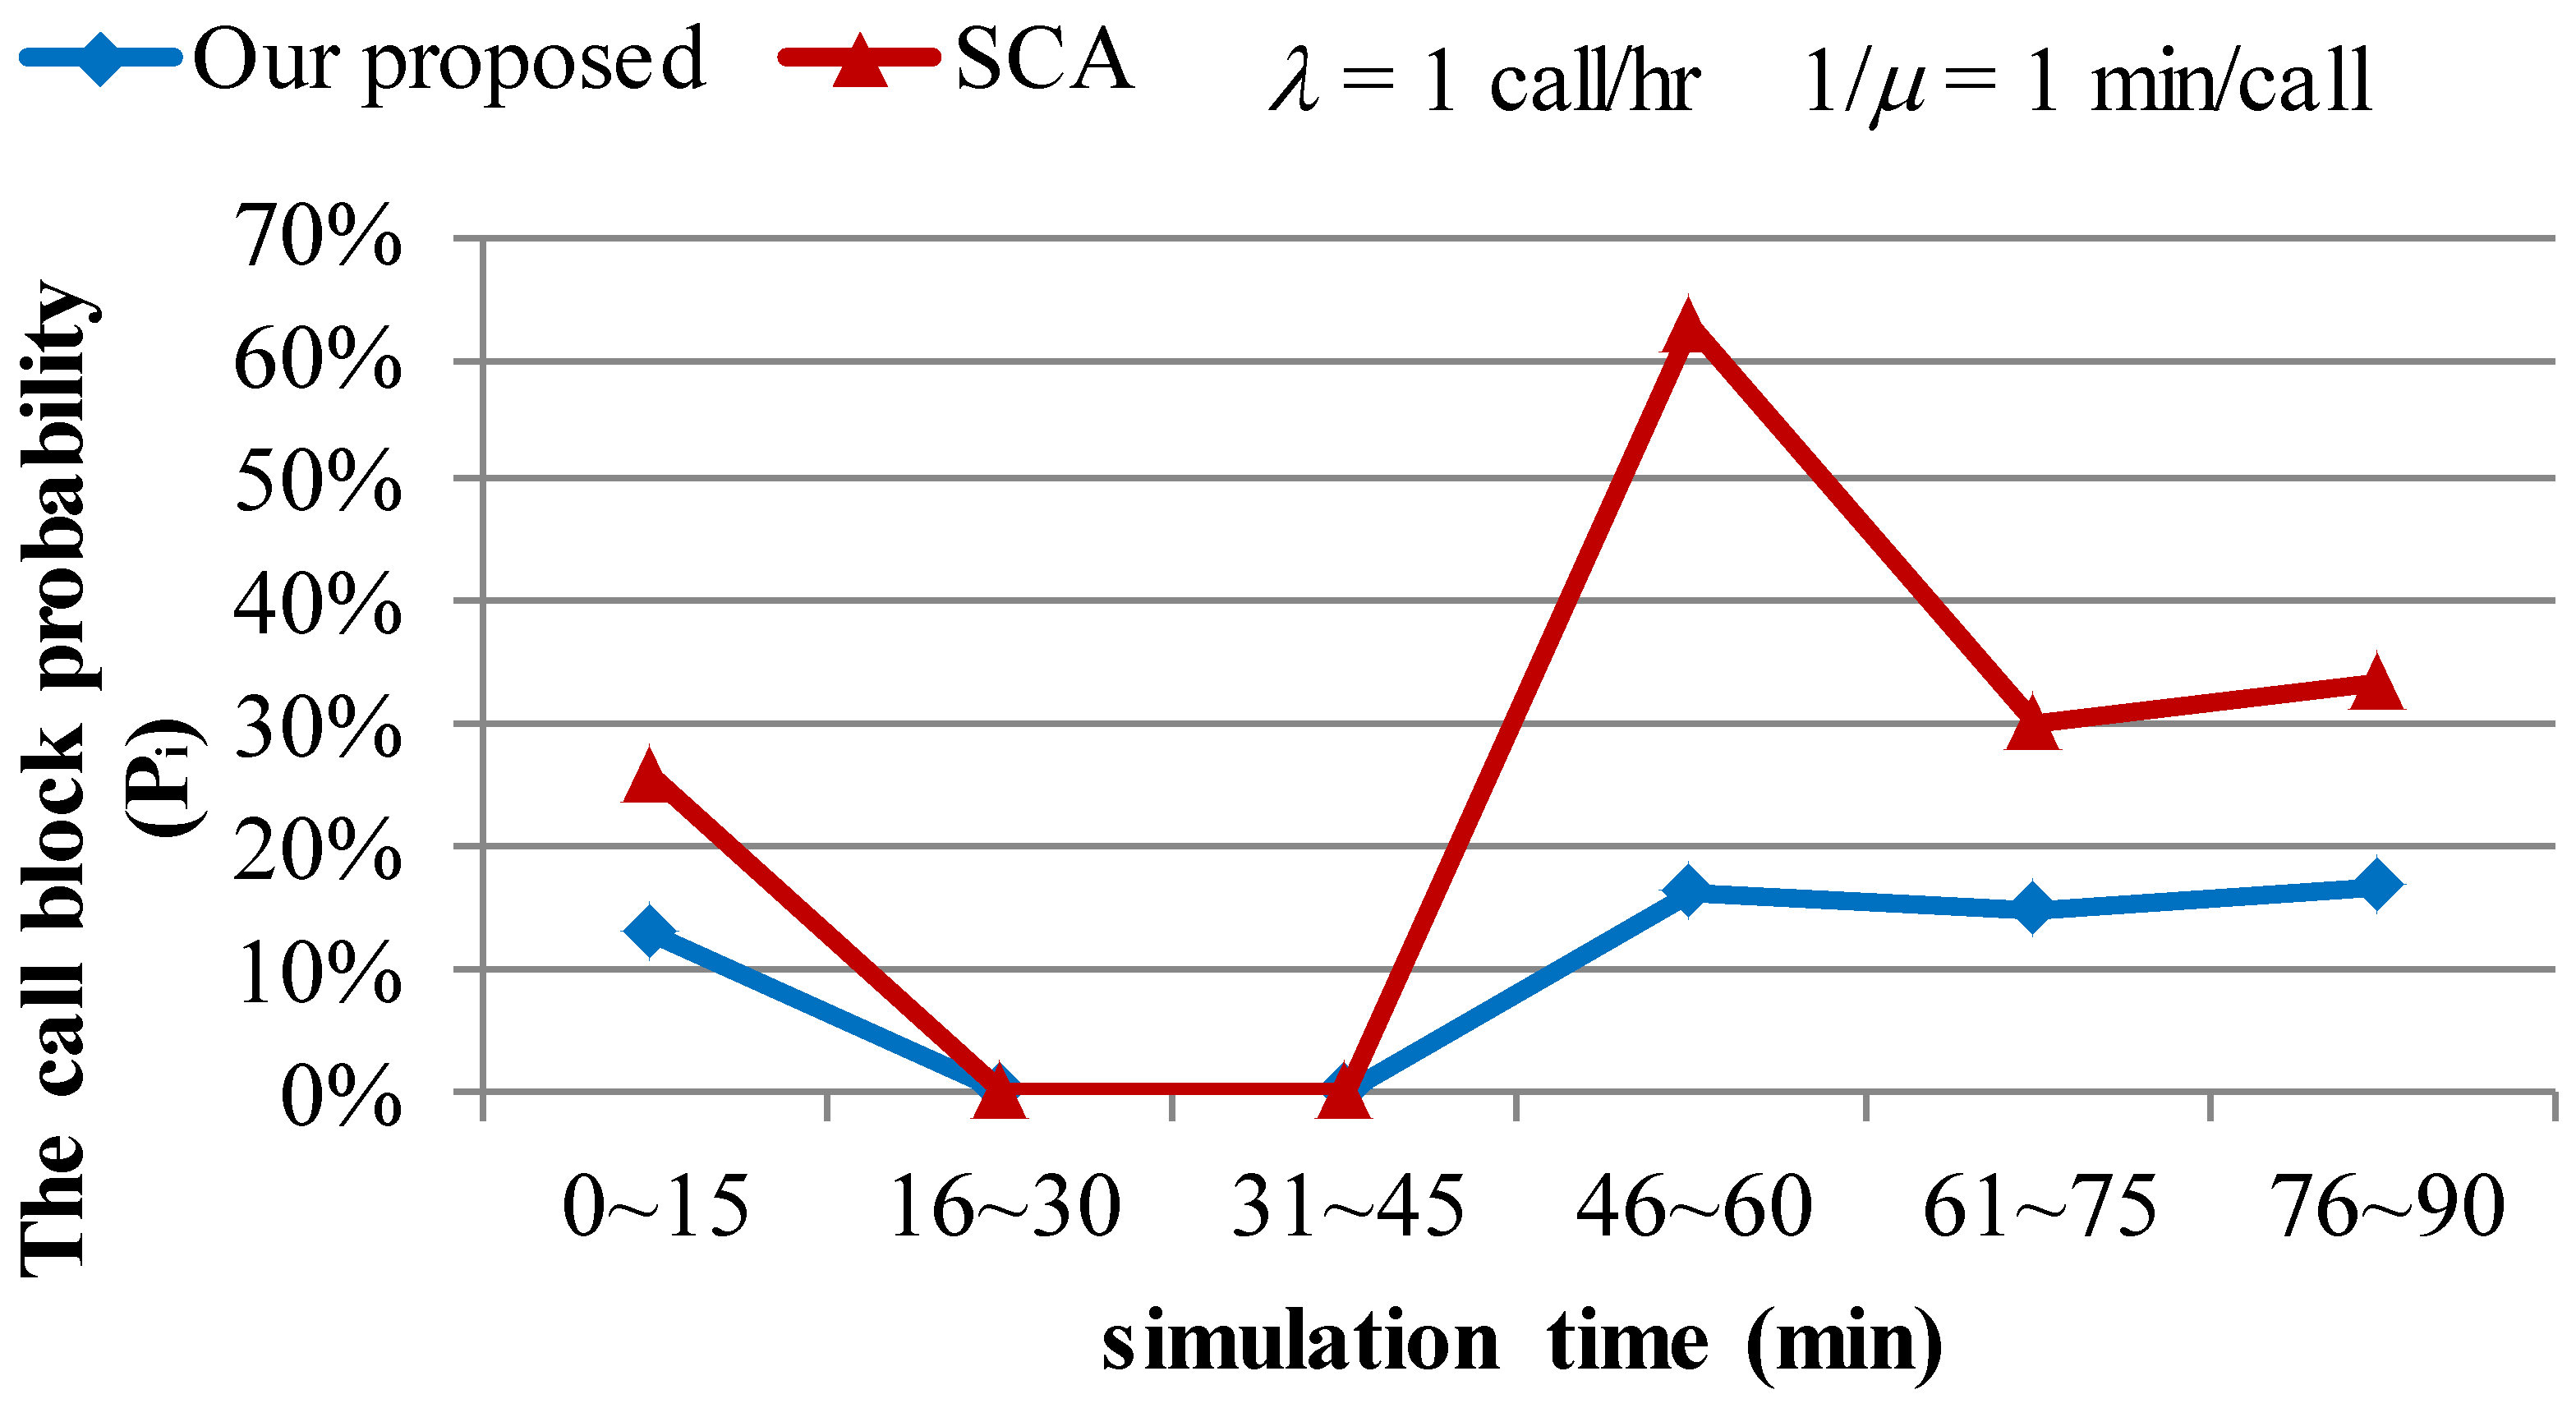
In Case 2, the traffic accident occurs at the mileage point from 5.05 to 5.35 km between the simulation time 15th and 45th min. This study analyzed the relation of the traffic information and the number of Handover In (I6) in Cell6 before and after the traffic accident occurrence. Through Figure 20 and Figure 21, this study can discover that the amount of traffic flow and the number of Handover In (I6) in Cell6 decrease rapidly when traffic accidents occur. Moreover, the number of Handover In (I6) in Cell6 dramatically increases when accidents are removed. Depending on the variation of traffic information, this study can expect that the number of Handover In (Ii) increases dramatically with the amount of traffic flow increase. Therefore, if the cellular system adopts the traditional SCA mechanism, it can’t afford the substantial increase of the number of channels for handover events, and it will cause the higher CBP. Figure 24 shows that the CBPs are derived by using the SCA mechanism and the proposed mechanism. This study can observe that the cars move slowly and line up in Cell5 and the amount of traffic flow is less in Cell6 when the traffic accident occurs between the simulation time 16th min and 45th min. During the traffic accident period in Cell6, this study discovered that the CBP derived by using the proposed mechanism and SCA mechanism have little difference because the amount of traffic flow and the number of handovers are rare. Otherwise, this study observed that the number of handovers dramatically increases with the amount of traffic flow increase when the traffic accidents are removed between the simulation time between the 46th and 60th min. The cellular system that adopts the proposed mechanism can dynamically adjust the number of allocating channels in each cell for handover events, and it can effectively avoid the call block when the amount of traffic flow increases. Otherwise, the cellular system that adopts the SCA mechanism can’t dynamically adjust the number of allocating channels in each cell for handover events, so using the SCA mechanism will cause the higher CBP. Through Figure 24, all CBPs in the scenario of traffic accidents are less than 16.5% by using the proposed mechanism that is better than using the SCA mechanism. The simulation results show that the fixed number of channels by using the SCA mechanism can’t be suited to the dynamic environment. Moreover, the mechanism can accurately predict the number of channels that are required for handover. Therefore, the proposed mechanism can decrease the number of CBPs effectively.
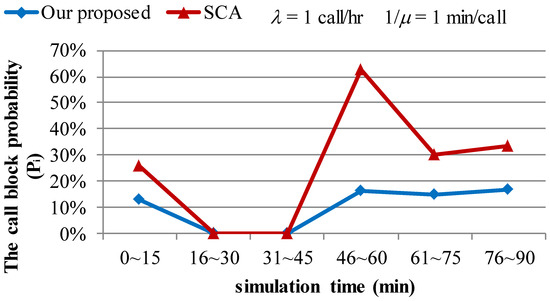
Figure 24.
The CBPs (P6) are derived by using SCA and the proposed mechanism in Cell6.
5.2.4. Discussions
In experiments, this study designed two cases to simulate the traffic information and communication behavior. Through the CBPs derived from Case 1 and Case 2, this study could discover that the CBPs of the cellular system adopting the proposed mechanism are always less than the traditional SCA mechanism. Therefore, the simulation results indicate that the proposed mechanism can allocate the number of channels more precisely than the SCA mechanism. In Case 2, the maximum CBP in a cellular system using the proposed mechanism is 16.28%, which is less than that using the SCA mechanism.
6. Conclusions
According to the proposed mechanism, this study can analyze the communication behavior and the status of traffic. Moreover, this study can adopt the information of traffic flow to solve the problem of channel allocation in PCS. Through the simulation results, this study obtained the results derived from the whole day simulation and the accident simulation, respectively. The simulation results show that all CBPs in the scenario of the whole day are less than 21.5% by using the proposed mechanism, which is better than using the SCA mechanism. Moreover, all CBPs in the scenario of traffic accidents are less than 16.5% by using the proposed mechanism, which is better than using the SCA mechanism. Therefore, if the cellular system adopts the proposed mechanism, it can provide better quality of service in PCS.
In this study, the highway in Taiwan is adopted in the simulation environment. The coverage of the cells is simpler than in the urban environment, and one car only has one MS. In the future, the simulation environment can change from the freeway to urban and one car can have multiple MSs.
Author Contributions
Chi-Hua Chen and Bon-Yeh Lin conceived and designed the experiments; Che-Hao Lei performed the experiments; Chi-Chun Lo and Che-Hao Lei analyzed the data; Chi-Hua Chen and Che-Hao Lei contributed reagents/materials/analysis tools; and Che-Hao Lei wrote the paper.
Conflicts of Interest
The authors declare no conflict of interest.
References
- Capone, A.; Redana, S. Call Admission Control Techniques for UMTS. In Proceedings of the IEEE 56th Vehicular Technology Conference, Atlantic City, NJ, USA, 7–11 October 2001. [Google Scholar]
- Chen, C.H.; Lin, B.Y.; Lin, C.H.; Liu, Y.S.; Lo, C.C. A Green Positioning Algorithm for Campus Guidance System. Int. J. Mobile Commun. 2012, 10, 119–131. [Google Scholar] [CrossRef]
- Lin, B.Y.; Chen, C.H.; Lo, C.C. A Novel Speed Estimation Method Using Location Service Events Based on Fingerprint Positioning. Adv. Sci. Lett. 2011, 4, 3735–3739. [Google Scholar] [CrossRef]
- Zhao, C.; Gan, L. Dynamic Channel Assignment for Large-Scale Cellular Networks Using Noisy Chaotic Neural Network. IEEE Trans. Neural Netw. 2011, 22, 222–232. [Google Scholar] [CrossRef] [PubMed]
- Fang, Y.; Zhang, Y. Call Admission Control Schemes and Performance Analysis in Wireless Mobile. IEEE Trans. Veh. Technol. 2002, 51, 371–382. [Google Scholar] [CrossRef]
- Del Re, E.; Fantacci, R.; Giambene, G. Handover and Dynamic Channel Allocation Techniques in Mobile Cellular Networks. IEEE Trans. Veh. Technol. 1995, 44, 229–237. [Google Scholar] [CrossRef]
- Esmailpour, A.; Nasser, N. Dynamic QoS-Based Bandwidth Allocation Framework for Broadband Wireless Networks. IEEE Trans. Veh. Technol. 2011, 60, 2690–2700. [Google Scholar] [CrossRef]
- Hoang, A.T.; Liang, Y.C.; Islam, M.H. Power Control and Channel Allocation in Cognitive Radio Networks with Primary Users’ Cooperation. IEEE Trans. Mob. Comput. 2010, 9, 348–360. [Google Scholar] [CrossRef]
- Jiang, H.; Rappaport, S. CBWL: A New Channel Assignment and Sharing Method for Cellular Communications Systems. In Proceedings of the IEEE 43th Vehicular Technology Conference, Secaucus, NJ, USA, 18–20 May 1993. [Google Scholar]
- Katzela, I.; Naghshineh, M. Channel Assignment Schemes for Cellular Mobile Telecommunication Systems: A Comprehensive Survey. IEEE Pers. Commun. 1996, 3, 10–31. [Google Scholar] [CrossRef]
- Sidi, M.; Starobinski, D. New Call Blocking versus Handoff Blocking in Cellular Networks. ACM J. Wirel. Netw. 1997, 3, 15–27. [Google Scholar] [CrossRef]
- Tekinay, S.; Jabbari, B. Handover and Channel Assignment in Mobile Cellular Networks. IEEE Commun. Mag. 1991, 29, 42–46. [Google Scholar] [CrossRef]
- Zhang, Y. Handoff Performance in Wireless Mobile Networks with Unreliable Fading Channel. IEEE Trans. Mob. Comput. 2010, 9, 188–200. [Google Scholar] [CrossRef]
- Everitt, D.; Manfield, A. Performance Analysis of Cellular Mobile Communication Systems with Dynamic Channel Assignment. IEEE J. Sel. Areas Commun. 1989, 7, 1172–1180. [Google Scholar] [CrossRef]
- Hong, D.; Rappaport, S.S. Traffic Model and Performance Analysis for Cellular Mobile Radio Telephone Systems with Prioritized and Nonprioritized Handoff Procedures. IEEE Trans. Veh. Technol. 1986, 35, 77–92. [Google Scholar] [CrossRef]
- Lin, Y.B.; Pang, A.C. Wireless and Mobile All-IP Networks; John Wiley & Sons: Hoboken, NJ, USA, 2005. [Google Scholar]
- Mac Donald, V.H. Advanced mobile phone service: The cellular concept. Bell Syst. Tech. J. 1979, 58, 15–41. [Google Scholar] [CrossRef]
- Lin, Y.B.; Sou, S.I. Charging for Mobile All-IP Telecommunications; John Wiley & Sons: Hoboken, NJ, USA, 2008. [Google Scholar]
- Sin, J.; Georganas, N. A Simulation Study of a Hybrid Channel Assignment Scheme for Cellular Land-Mobile Radio Systems with Erlang-C Service. IEEE Trans. Commun. 1981, 29, 143–147. [Google Scholar] [CrossRef]
- Zhang, M.; Yum, T.-S.P. Comparisons of channel-assignment strategies in cellular mobile telephone systems. IEEE Trans. Veh. Technol. 1999, 38, 211–215. [Google Scholar] [CrossRef]
- Kahwa, T.; Georganas, N. A Hybrid Channel Assignment Scheme in Large-Scale, Cellular-Structured Mobile Communication Systems. IEEE Trans. Commun. 1978, 26, 432–438. [Google Scholar] [CrossRef]
- Ngo, C.Y.; Li, V.O.K. Fixed channel assignment in cellular radio networks using a modified genetic algorithm. IEEE Trans. Veh. Technol. 1998, 47, 163–172. [Google Scholar] [CrossRef]
- Antonopoulos, A.; Verikoukis, C. Traffic-Aware Connection Admission Control Scheme for Broadband Mobile Systems. IEEE Commun. Lett. 2010, 14, 719–721. [Google Scholar] [CrossRef]
- Alsamhi, S.H.; Rajput, N.S. Implementation of call admission control technique in HAP for enhanced QoS in wireless network deployment. Telecommun. Syst. 2016, 63, 141–151. [Google Scholar] [CrossRef]
- Antonopoulos, A.; Verikoukis, C. Dynamic Call Admission Control for Enhanced GoS of UGS Connections during “Busy Hour” in WiMAX. Proceedings of International Conference on Mobile Lightweight Wireless Systems, Barcelona, Spain, 10–12 May 2010. [Google Scholar]
- Bolotin, V.A. Modeling Call Holding Time Distributions for CCS Network Design and Performance Analysis. IEEE J. Sel. Areas Commun. 1994, 12, 433–438. [Google Scholar] [CrossRef]
- Lin, B.Y.; Chen, C.H.; Lo, C.C. A Traffic Information Estimation Model Using Periodic Location Update Events from Cellular Network. Commun. Comput. Inf. Sci. 2011, 135, 72–77. [Google Scholar]
- Chang, H.C.; Chen, C.H.; Lin, B.Y.; Kung, H.Y.; Lo, C.C. Traffic Information Estimation Using Periodic Location Update Events. Int. J. Innov. Comput. Inf. Control 2013, 9, 2031–2041. [Google Scholar]
- Chen, C.H.; Chang, H.C.; Su, C.Y.; Lo, C.C.; Lin, H.F. Traffic Speed Estimation Based on Normal Location Updates and Call Arrivals from Cellular Networks. Simul. Model. Pract. Theory 2013, 35, 26–33. [Google Scholar] [CrossRef]
- Cheng, D.Y.; Chen, C.H.; Hsiang, C.H.; Lo, C.C.; Lin, H.F.; Lin, B.Y. The Optimal Sampling Period of a Fingerprint Positioning Algorithm for Vehicle Speed Estimation. Math. Probl. Eng. 2013, 2013, 306783. [Google Scholar] [CrossRef]
- Chang, M.F.; Chen, C.H.; Lin, Y.B.; Chia, C.Y. The Frequency of CFVD Speed Report for Highway Traffic. Wirel. Commun. Mob. Comput. 2015, 15, 879–888. [Google Scholar] [CrossRef]
- Wu, C.I.; Chen, C.H.; Lin, B.Y.; Lo, C.C. Traffic Information Estimation Methods from Handover Events. J. Test. Eval. 2016, 44, 656–664. [Google Scholar] [CrossRef]
- Lai, W.K.; Kuo, T.H.; Chen, C.H. Vehicle Speed Estimation and Forecasting Methods Based on Cellular Floating Vehicle Data. Appl. Sci. 2016, 6, 47. [Google Scholar] [CrossRef]
- Planung Transport Verkehr AG. VISSIM User Manual—V.5.20; Planung Transport Verkehr AG: Karlsruhe, Germany, 2009. [Google Scholar]
- Gomes, G.; May, A.; Horowitz, R. A Microsimulation Model of a Congested Freeway using VISSIM. Transp. Res. Rec. 2004, 1876, 71–81. [Google Scholar] [CrossRef]
- Higgs, B.; Abbas, M. Segmentation and Clustering of Car-Following Behavior: Recognition of Driving Patterns. IEEE Trans. Intell. Transp. Syst. 2015, 16, 81–90. [Google Scholar] [CrossRef]


© 2017 by the authors. Licensee MDPI, Basel, Switzerland. This article is an open access article distributed under the terms and conditions of the Creative Commons Attribution (CC BY) license (http://creativecommons.org/licenses/by/4.0/).