1. Introduction
Against the backdrop of the “dual carbon” goals, solar energy has attracted growing attention as a clean, efficient, and renewable resource. Its integration with transportation infrastructure has given rise to the concept of the solar road—a new type of pavement system that combines energy conversion, roadway functionality, and intelligent sensing in a single structure [
1,
2]. This technology embeds photovoltaic (PV) modules within the pavement layer, enabling on-site power generation and multifunctional surface integration. In addition to improving land-use efficiency, it holds strategic significance for the development of sustainable transportation systems [
3,
4,
5,
6]. In recent years, pilot projects have been implemented on pedestrian walkways, bicycle lanes, and landscaped park roads, demonstrating promising service performance and technical feasibility under light-traffic conditions [
7,
8,
9,
10,
11].
However, in continuous traffic environments, solar road panels are subjected to long-term complex vehicular loads coupled with environmental effects. Frequent occurrences of microcrack propagation, structural fatigue, and localized fracture have emerged as key bottlenecks restricting their large-scale engineering deployment. Field cases have shown that several PV highway pilot projects experienced extensive fracture, surface spalling, and a sharp drop in power generation efficiency within only a few months of operation [
12,
13,
14]—for example, the French “Wattway” solar road degraded rapidly [
15]: panels peeled, spalled and failed to reach expected output after 3 years. These failures reveal significant deficiencies in structural durability and mechanical adaptability. Fundamentally, solar road panels not only function as load-transferring elements but also serve as core power-generation units; thus, their structural degradation directly compromises the performance of the entire system. It is therefore imperative to investigate damage evolution and fatigue failure mechanisms at both the particle scale and the structural-unit scale, so as to provide a theoretical basis for structural optimization and service-life extension.
Existing studies have predominantly focused on aspects such as PV panel power-generation efficiency, surface skid resistance, and material configuration optimization [
16,
17,
18]. Some researchers have attempted to preliminarily evaluate the load-bearing capacity and failure modes of solar road panels through static loading tests or finite element simulations. For example, Northmore et al. [
19] employed Abaqus finite element modeling to evaluate the mechanical performance of prototype solar road panels on various structural foundations, demonstrating that panels capable of withstanding traffic loads can be designed, and that concrete foundations can substantially enhance the analyzed prototypes. Also, Hu et al. [
6] conducted a critical review of existing solar pavement structures, including “Wattway”, “SolaRoad”, etc., comparing electrical output losses, mechanical wear, and CO
2 savings across real and pilot installations, highlighting that many pilot installations underperform due to structure material degradation and environmental stresses. Zhou et al. [
20] investigated two PV pavement block types (grid block and hollow block) via finite element analysis, showing strong mechanical performance and identifying surface longitudinal deformation and maximum tensile stress at the center of the translucent panel’s underside as key indicators in mechanical response analysis. Rahman et al. [
21] conducted three-dimensional finite element simulations to assess real pavement and PV module performance under standard semi-trailer loads prior to actual installation, and found that the proposed model could sustain dynamic wheel loads without structural failure. In addition, in the experimental study by Coutu et al. [
22], prototypes were subjected to heavy-vehicle loading, freeze/thaw cycles, moisture absorption, shear testing, etc., and while many prototypes showed promising robustness, electrical failure (PV output dropping to zero) occurred under deformation or delamination well before ideal life expectancy under continuous load.
Nevertheless, systematic and in-depth investigations into the mechanical performance degradation and fatigue response of solar road panels under long-term loading remain scarce. In particular, the mechanisms of damage evolution, bonding failure, and overall strength degradation under varying structural configurations and loading conditions have yet to be clearly elucidated. Furthermore, since solar roads commonly adopt modular, unit-based assembly [
20,
23,
24], the mechanical behavior, stress-transfer pathways, and crack-propagation patterns of different unit shapes (e.g., square, rectangular, hexagonal) can vary significantly. The implications of these structural effects for fatigue resistance also warrant further clarification.
Considering that solar roads predominantly operate in long-term traffic environments, the loads experienced by panel structures are typically characterized by repeated, slow compressive stresses. In such cases, high-frequency dynamic load models are not fully representative. To better replicate the in-service fatigue evolution process, this study proposes a static loading-path-based fatigue equivalence simulation method. By applying different loading rates to emulate the cumulative effects of vehicular loads, the fracture behavior and strength degradation of panels with representative geometric shapes are systematically evaluated under various fatigue conditions, while avoiding the distortions and numerical instabilities that high-frequency excitations may introduce. This approach not only balances computational stability and physical realism, but also offers a more practical framework for analyzing the mesoscopic mechanisms of fatigue behavior.
Therefore, the main objective of this study is to establish a particle-based discrete element model to systematically investigate the fatigue damage evolution of solar road panels under long-term loading, with particular emphasis on (i) quantifying strength degradation through a new index system, (ii) clarifying the influence of structural configuration and loading rate on fatigue resistance, and (iii) developing a predictive model to support service-life estimation and design optimization.
2. Materials and Methods
2.1. Selection of Solar Road Panel Structures and Material Properties
A typical solar road panel consists of three main components [
19]: an upper high-strength photovoltaic glass surface layer, a middle flexible bonding layer, and a bottom composite base layer. This integrated structure exhibits high load-bearing capacity and environmental adaptability, and large-scale pavement installation is achieved through modular assembly (
Figure 1) [
25]. To facilitate fatigue performance simulation, this study adopts a simplified modeling strategy in which the solar road panel is equivalently abstracted as a single structural unit for numerical analysis. This approach effectively avoids uncertainties arising from the complexity of detailed features (e.g., interlayer delamination, fixation methods) and highlights the dominant influence of geometric configuration and overall material properties in fatigue response.
In the modeling process, all panel models are kept consistent in terms of overall dimensions, volume, and boundary conditions while differing only in geometric configuration. Three representative forms are considered: square, hexagonal, and rectangular. This design enables a clear comparison of how geometric features influence differences in fatigue response, thereby providing a basis for optimizing panel configurations in engineering applications.
Regarding material parameter settings, the panel is treated as an isotropic, linear elastic material with uniform physical and mechanical parameters, including density, elastic modulus, Poisson’s ratio, and degradation indices required for fatigue analysis. Considering that solar road structures commonly employ a composite shell enclosing the photovoltaic core, glass fiber-reinforced polymer (GFRP)—a material widely used in engineering—was selected as the representative material. Its elasticity and toughness meet the service requirements of solar road applications. Although real panels are typically multilayer composite systems, in the preliminary fatigue analysis they are simplified into homogeneous equivalent units. This not only reduces the number of degrees of freedom and improves simulation efficiency, but also minimizes dispersion errors introduced by material parameter variability, thereby enhancing the physical interpretability of the results. By replacing conventional high-frequency dynamic loading with controlled static loading rates, this study highlights the equivalent effect of loading rate on structural response. This strategy enables the simplified model to effectively capture stiffness degradation, crack propagation, and failure mechanisms under repeated loading, while maintaining consistency in total energy input.
2.2. Geometric Configurations and Discrete Element Model Development
Geometric configuration has a significant influence on fatigue performance. Considering both structural fatigue characteristics and engineering feasibility, this study selects three representative geometries—square, hexagonal, and rectangular—for modeling and comparative analysis. The panel thickness is uniformly set to 50 mm, while horizontal dimensions are chosen within the range of 300–600 mm based on practical pavement applications. Fatigue performance under these three geometries is compared to reveal their respective failure modes and dominant failure-controlling factors, as illustrated in
Figure 2. In addition, to investigate the influence of unit shape and assembly patterns on the mechanical behavior of solar road PV panels, a discrete element method (DEM) is employed to develop computational models. Three types of PV panel units—square, hexagonal, and rectangular—are constructed (
Figure 3). The DEM simulations are used to analyze particle breakage behavior and overall structural stability of the panels under loading conditions.
2.3. Fatigue Loading Scheme and Parameter Settings
To scientifically evaluate the fatigue response characteristics of solar road panels over their service life, this study develops an equivalent fatigue loading path based on a static loading approach. Multiple loading rate scenarios and representative panel geometries are designed to systematically investigate the mechanical degradation behavior of panels under different loading conditions. Given that, in actual service, solar road structures are predominantly subjected to repeated low-speed compressive stresses, conventional high-frequency dynamic load models are not fully applicable to such structures. Therefore, this study adopts an innovative strategy in which static loading rates are used to emulate the cumulative effects of fatigue, thereby avoiding the adverse numerical and physical effects that high-frequency excitations may induce.
- (1)
Loading Method Design
Fatigue loading is applied in the form of uniaxial compression in the vertical direction, implemented in the PFC3D 6.0 model through displacement-controlled loading at different rates. The loading path follows a linear displacement profile, gradually increasing load to replicate the repeated compaction effects of vehicular loads on solar panels. This method enables effective capture of the processes of microcrack initiation, propagation, and ultimate failure, facilitating subsequent modeling of fatigue damage evolution.
- (2)
Loading Rate Parameters
To simulate a range of fatigue effect intensities, five loading rates are considered: 0.1 m/s, 0.05 m/s, 0.01 m/s, 0.005 m/s, and 0.001 m/s, covering scenarios from rapid to extremely slow loading. These rates correspond to different equivalent loading cycle intervals, with lower rates allowing simulation of more pronounced microstructural damage accumulation. For each loading rate, the total number of loading steps is fixed at 10,000 to maintain comparable total energy input across cases, ensuring the validity of comparative analysis.
- (3)
Unit Configurations and Geometric Parameters
Three representative panel geometries are selected for modeling and loading analysis: square (side length 500 mm), hexagonal (side length 310 mm), and rectangular (length 707 mm, width 354 mm). All three share the same cross-sectional area and closely match the dimensions commonly used in real-world solar pavement systems. Differences in force-transfer paths, boundary responses, and crack-propagation directions among these geometries provide structural diversity for identifying fatigue response mechanisms.
- (4)
Boundary and Contact Conditions
During loading, the bottom of the panel is modeled as a fixed rigid boundary, while a constant-rate displacement load is applied from the top. The panel’s lateral sides are left free to replicate the vertical cyclic loading experienced under real road conditions. A frictional contact model is used between the panel and the loading platen to represent realistic load-transfer mechanisms, enabling visualization of interface slip and localized fracture phenomena during loading.
The resulting outputs form the basis for constructing a fatigue life model, supporting the definition of functional failure and the fitting of fatigue degradation laws. In PFC3D 6.0, the micro-parameters are calibrated against macroscopic experimental data [
25]. In this study, numerical back-analysis [
26] is employed to ensure that the macroscopic mechanical response of the model is consistent with the behavior of the actual material. Detailed computational parameters are provided in
Table 1 [
1].
2.4. Calculation Conditions
To investigate in depth the fatigue response characteristics of solar road panels under different loading rates, a static loading approach is adopted in this study. By setting various loading rates to equivalently simulate the fatigue process, and combining these with different panel geometries, a series of numerical simulation tests are conducted. The detailed simulation scenarios are listed in
Table 2. For all cases, the panel thickness is fixed at 50 mm. Loading is applied in the form of uniaxial vertical compression, with the loading surface positioned at the top of the model. Displacement-controlled loading at the designated rates is used to achieve static compression for each rate level. The bottom boundary is fixed, while the four lateral boundaries are set as free in order to best replicate the stress conditions experienced by panels in actual road applications. Throughout the simulations, the force–displacement response, damage evolution, and crack propagation behavior of the material are monitored under each loading rate. These observations are then used to evaluate the fatigue sensitivity and fatigue resistance of the different panel designs.
3. Results
3.1. Fatigue Response Characteristics of Different Structural Forms
Under identical loading conditions, solar road panels with different geometric configurations exhibited markedly distinct fatigue response behaviors.
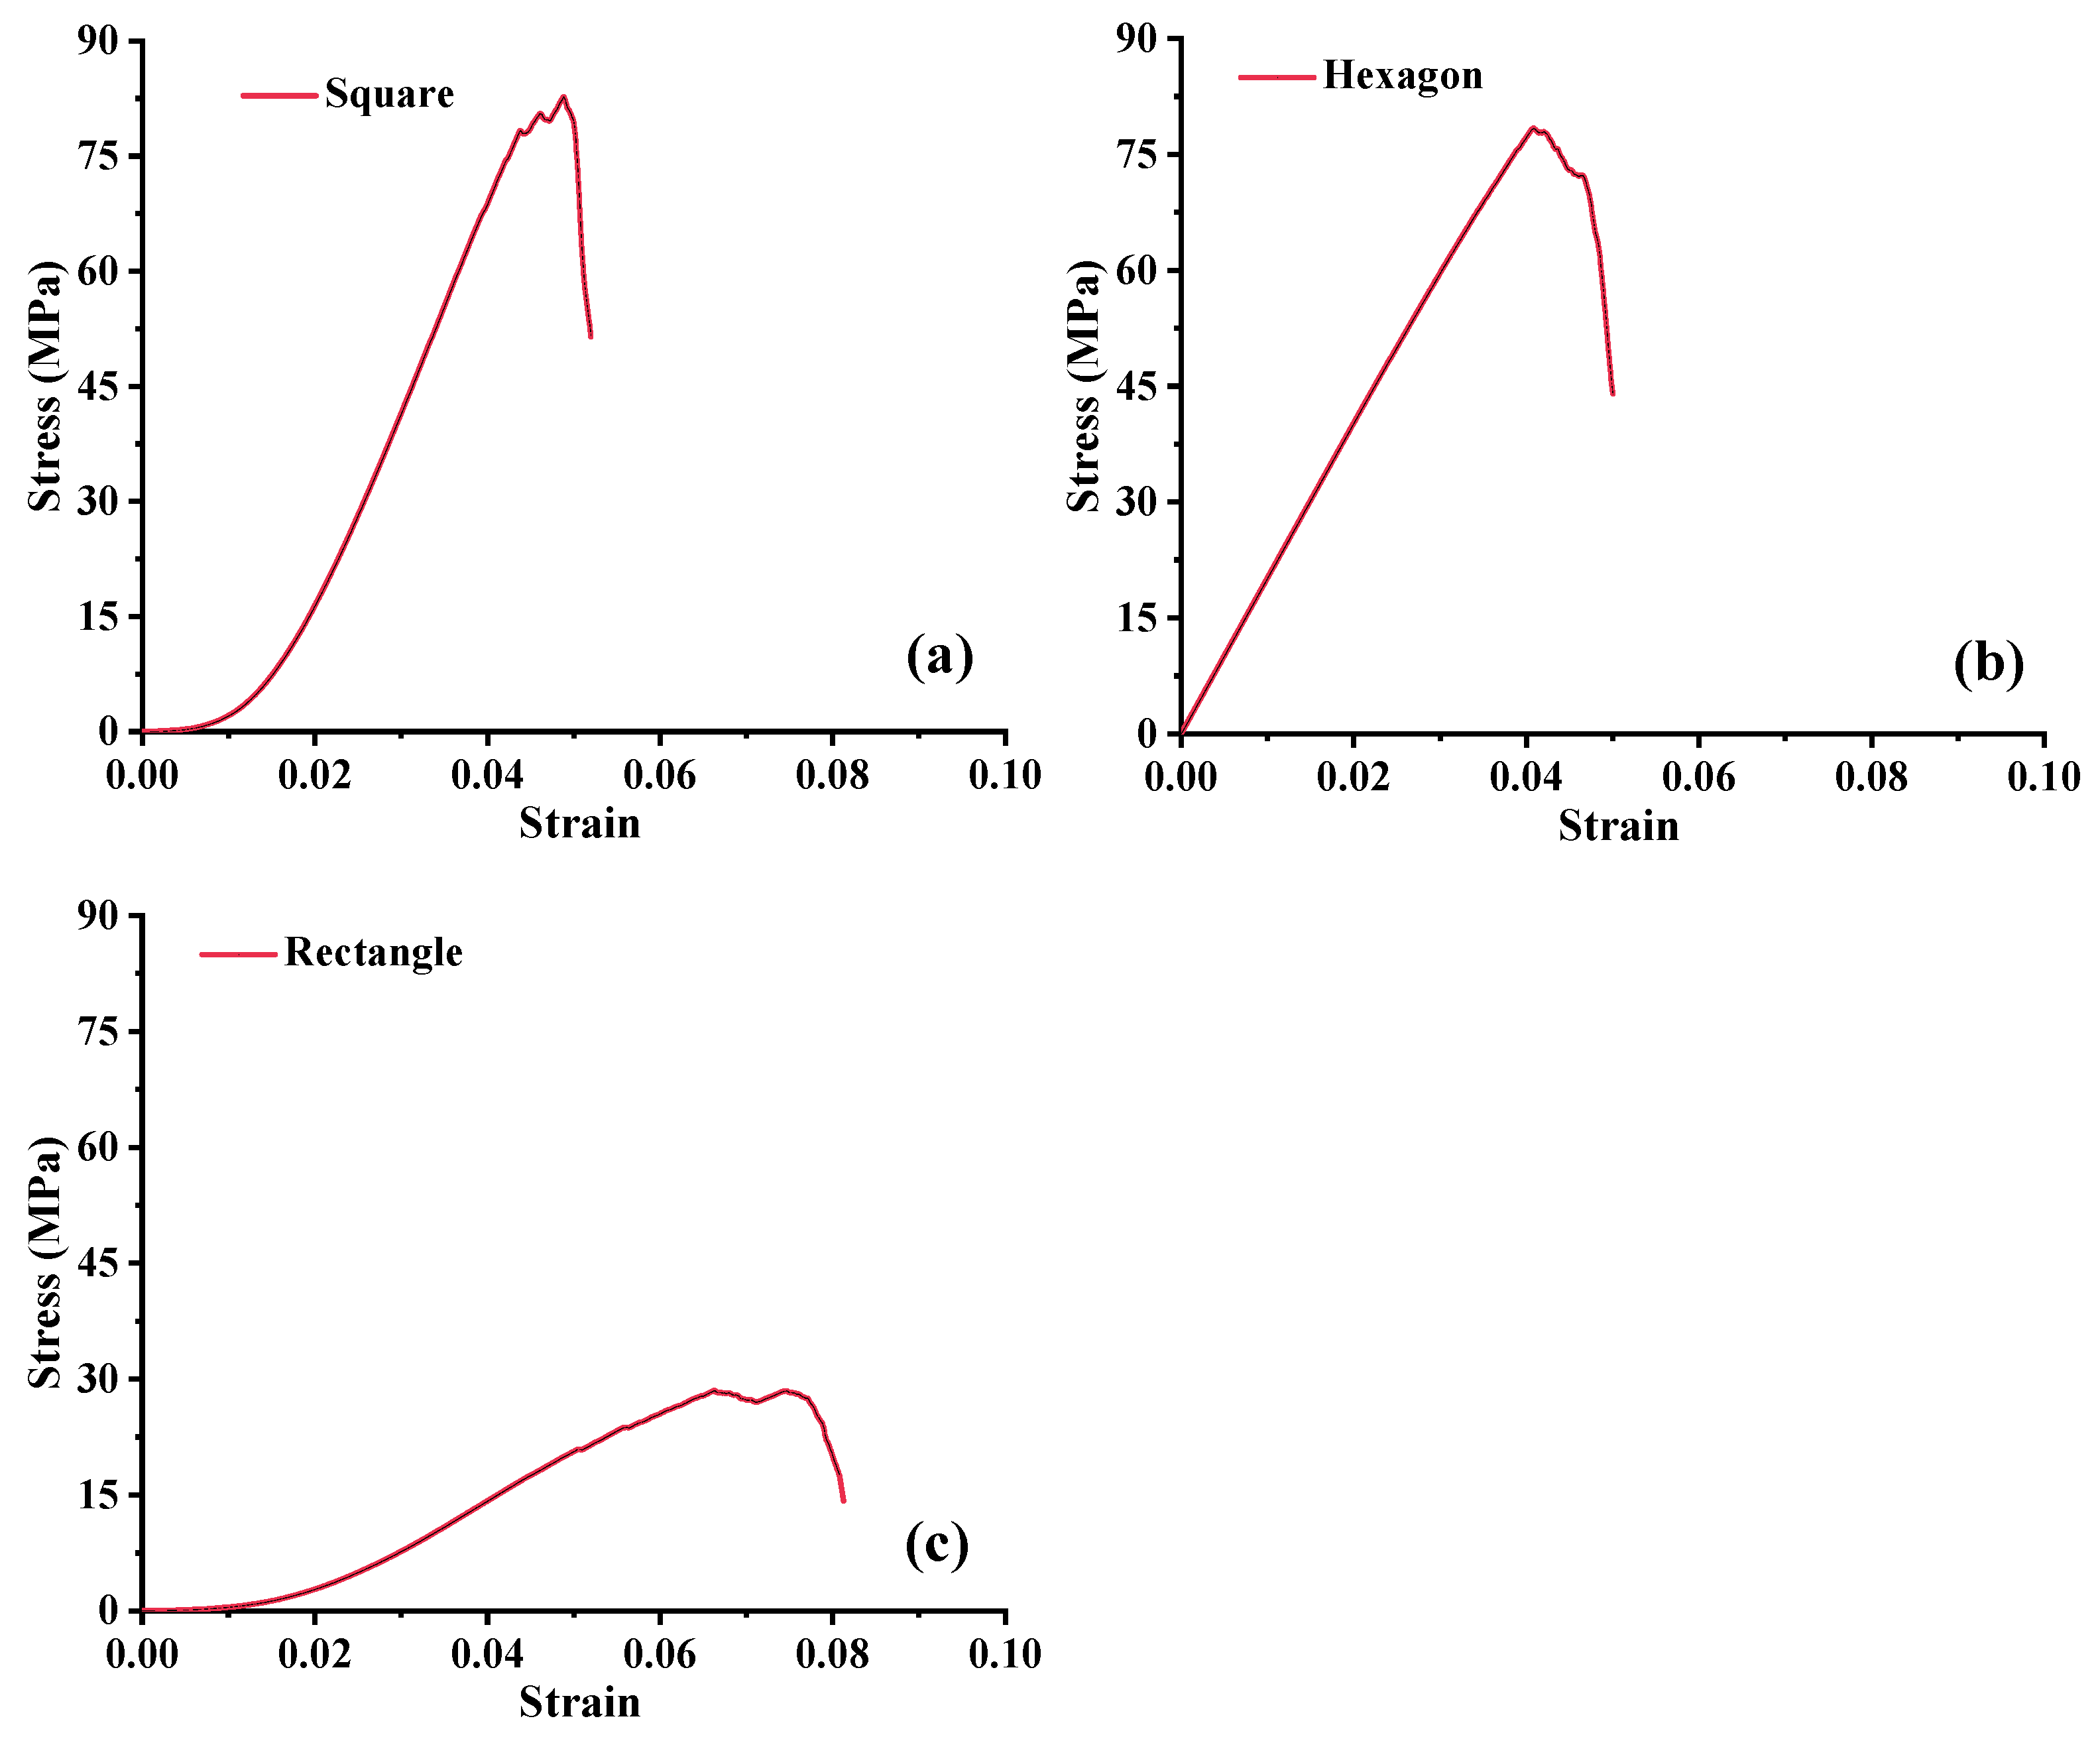
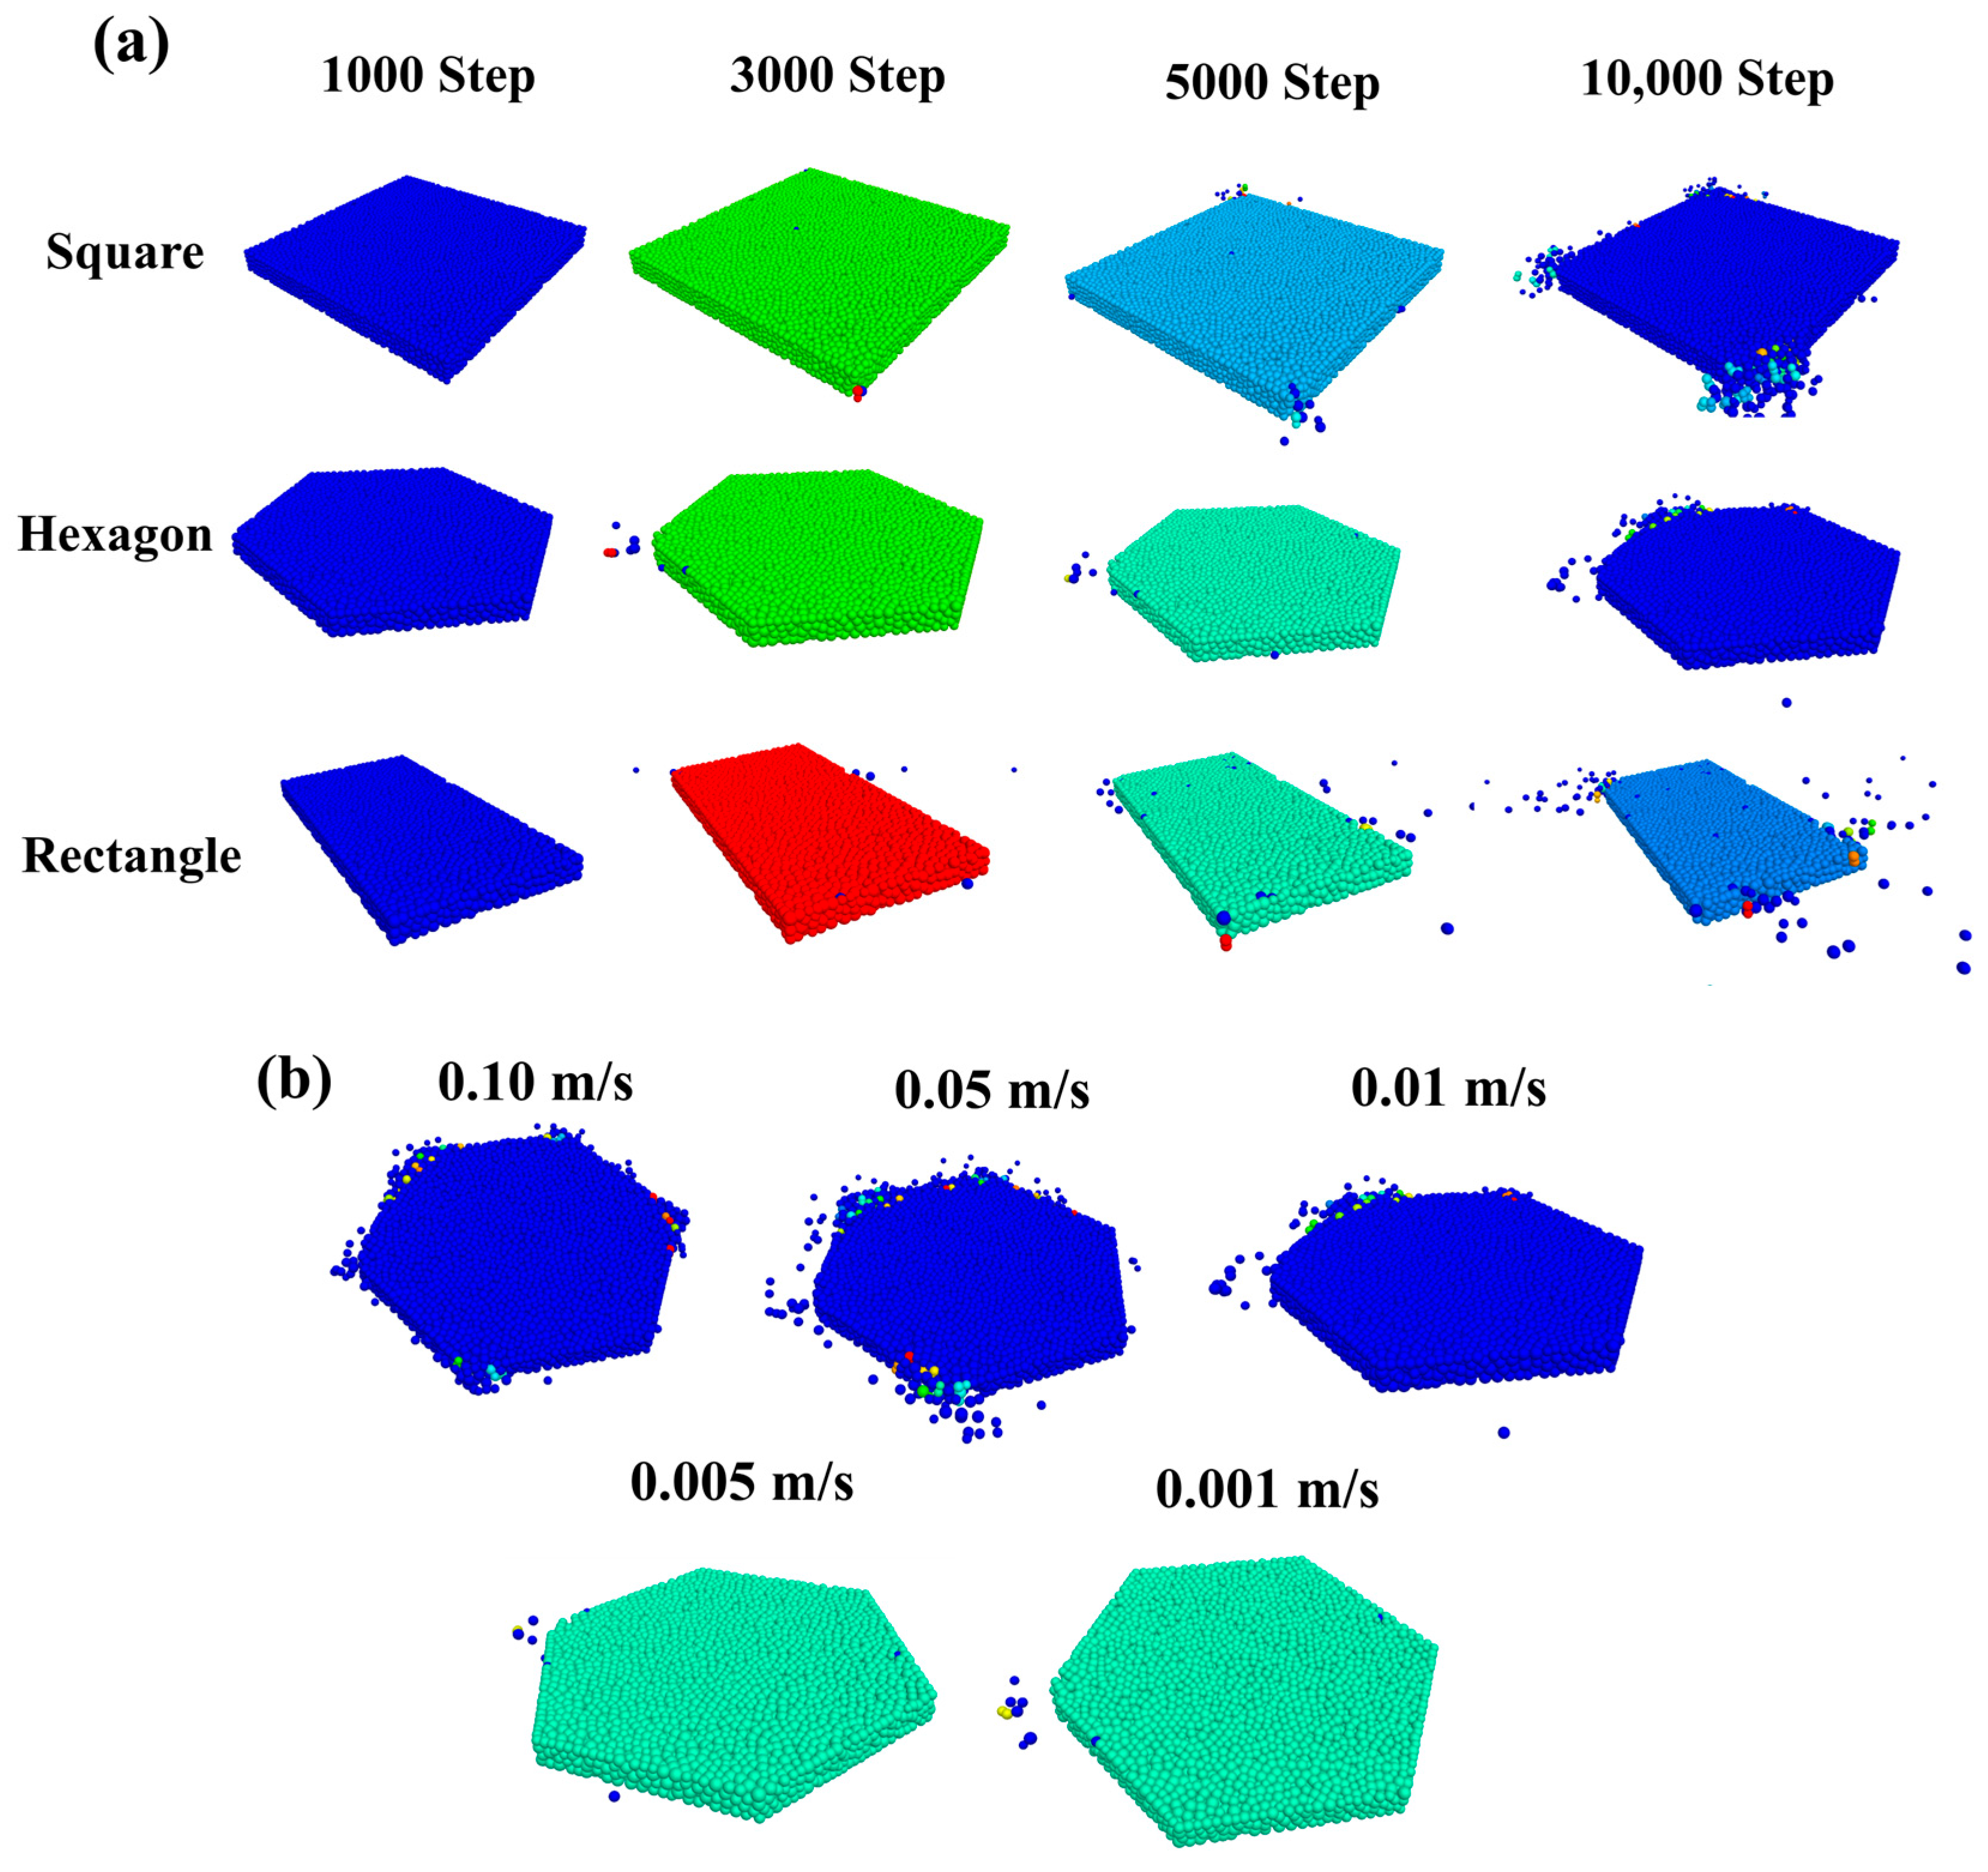
Figure 4 presents the particle displacement cloud maps for the three panel types. From the deformation patterns, it can be observed that the square panel exhibited the smallest particle displacement, with deformation concentrated mainly at the corners, while maintaining overall structural integrity. The hexagonal panel showed intermediate deformation, with particle motion radiating outward from the loading zone, indicating a certain degree of load coordination. In contrast, the rectangular panel displayed the most severe particle displacement, with pronounced stress concentrations and particle ejection occurring particularly at the loading zone edges and along the longitudinal direction. The corresponding stress–strain curves (
Figure 5) further confirm these differences: the curve for the square panel is smooth, with the highest peak stress (75 MPa), indicating excellent load-bearing capacity and delayed failure characteristics. The hexagonal panel showed a slightly lower peak stress, while the rectangular panel’s curve rose sharply in the early stage but dropped rapidly thereafter, demonstrating typical fatigue instability. Its maximum load-bearing capacity was only 28.61 MPa. For comparison, previous experimental studies [
19,
25] reported that square-format solar road panels typically exhibit a maximum load-bearing capacity of around 50 MPa, lower than their material’s ultimate strength (69 MPa). In this study, the simulated square panel reached 75 MPa, approaching the ultimate strength—attributable to the idealized conditions of the numerical simulations.
Quantitatively,
Table 3 summarizes the evolution of cumulative plastic strain at different loading stages for each panel type. With increasing timesteps, all three geometries exhibited continuous accumulation of plastic strain, but the rate and magnitude varied substantially. In the initial stage (100–1000 steps), the hexagonal panel showed the smallest cumulative plastic strain (0.06–0.62%), reflecting strong early-stage fatigue resistance. However, in the mid-to-late stages, the square panel’s strain accumulation rate slowed markedly, and by 10,000 steps, its cumulative plastic strain (5.20%) was comparable to that of the hexagonal panel (5.07%). In contrast, the rectangular panel consistently exhibited the highest cumulative plastic strain throughout loading, with a growth magnitude significantly exceeding the other two geometries, indicating the poorest structural stability under fatigue loading.
The underlying cause of these differences lies in the influence of geometry on force-chain distribution, stress transmission paths, and local damage-propagation behavior. The square configuration, with its symmetry and strong boundary constraints, fosters a stable inter-particle force network during loading, delaying crack initiation and propagation. The hexagonal, honeycomb-like geometry has strong early-stage stress dispersion capacity but, in later stages, experiences stress re-concentration due to localized particle slip and boundary degradation, leading to gradual strain accumulation. The rectangular geometry exhibits weaker stiffness in the loading direction, resulting in unstable longitudinal force chains, which promote stress concentration, particle destabilization, and rapid crack coalescence, culminating in accelerated structural failure.
Overall, structural geometry has a pronounced influence on the fatigue resistance and failure evolution of solar road panels. Among the three configurations, the square panel demonstrates the most favorable fatigue performance, combining superior deformation control with strong strength retention, making it the preferred design choice for future engineering applications.
3.2. Mechanisms of Fatigue Response Under Different Loading Rates
The fatigue response of solar road panels under load is influenced not only by their structural geometry but also by the loading rate, which plays a key role in determining deformation patterns, strength retention, and damage evolution. Using the hexagonal solar panel as an example,
Figure 6 illustrates the spatial distribution of particle displacement under five loading rates (0.10 m/s, 0.05 m/s, 0.01 m/s, 0.005 m/s, and 0.001 m/s). The loading zone is located in the central vertical loading area of the panel, corresponding to the region directly beneath the upper loading wall. Overall, as the loading rate decreases, the range of particle displacement expands, and deformation gradually propagates from the loading zone toward the panel edges. Under high loading rates (0.10 m/s and 0.05 m/s), particle motion is mainly confined to the vicinity of the loading zone, with displacement highly concentrated and the boundary regions remaining stable, reflecting a stronger structural constraint and rigid response. When the loading rate is reduced to 0.01 m/s, evident particle sliding and ejection occur in the edge zones, indicating that slower loading promotes energy accumulation and release, thereby driving stress redistribution outward. At the lowest rate of 0.001 m/s, although some sliding remains in the central region, the overall displacement distribution becomes more uniform, and particle ejection at the edges is less pronounced than at 0.01 m/s. This suggests that at extremely low loading rates, stress is more fully transmitted and released, suppressing the outward propagation of local damage. These results demonstrate that loading rate not only affects the rigidity retention of the panel but also governs its damage evolution pathway: higher loading rates induce localized and concentrated damage, whereas lower loading rates facilitate gradual stress diffusion, leading to more pronounced fatigue responses in the edge regions.
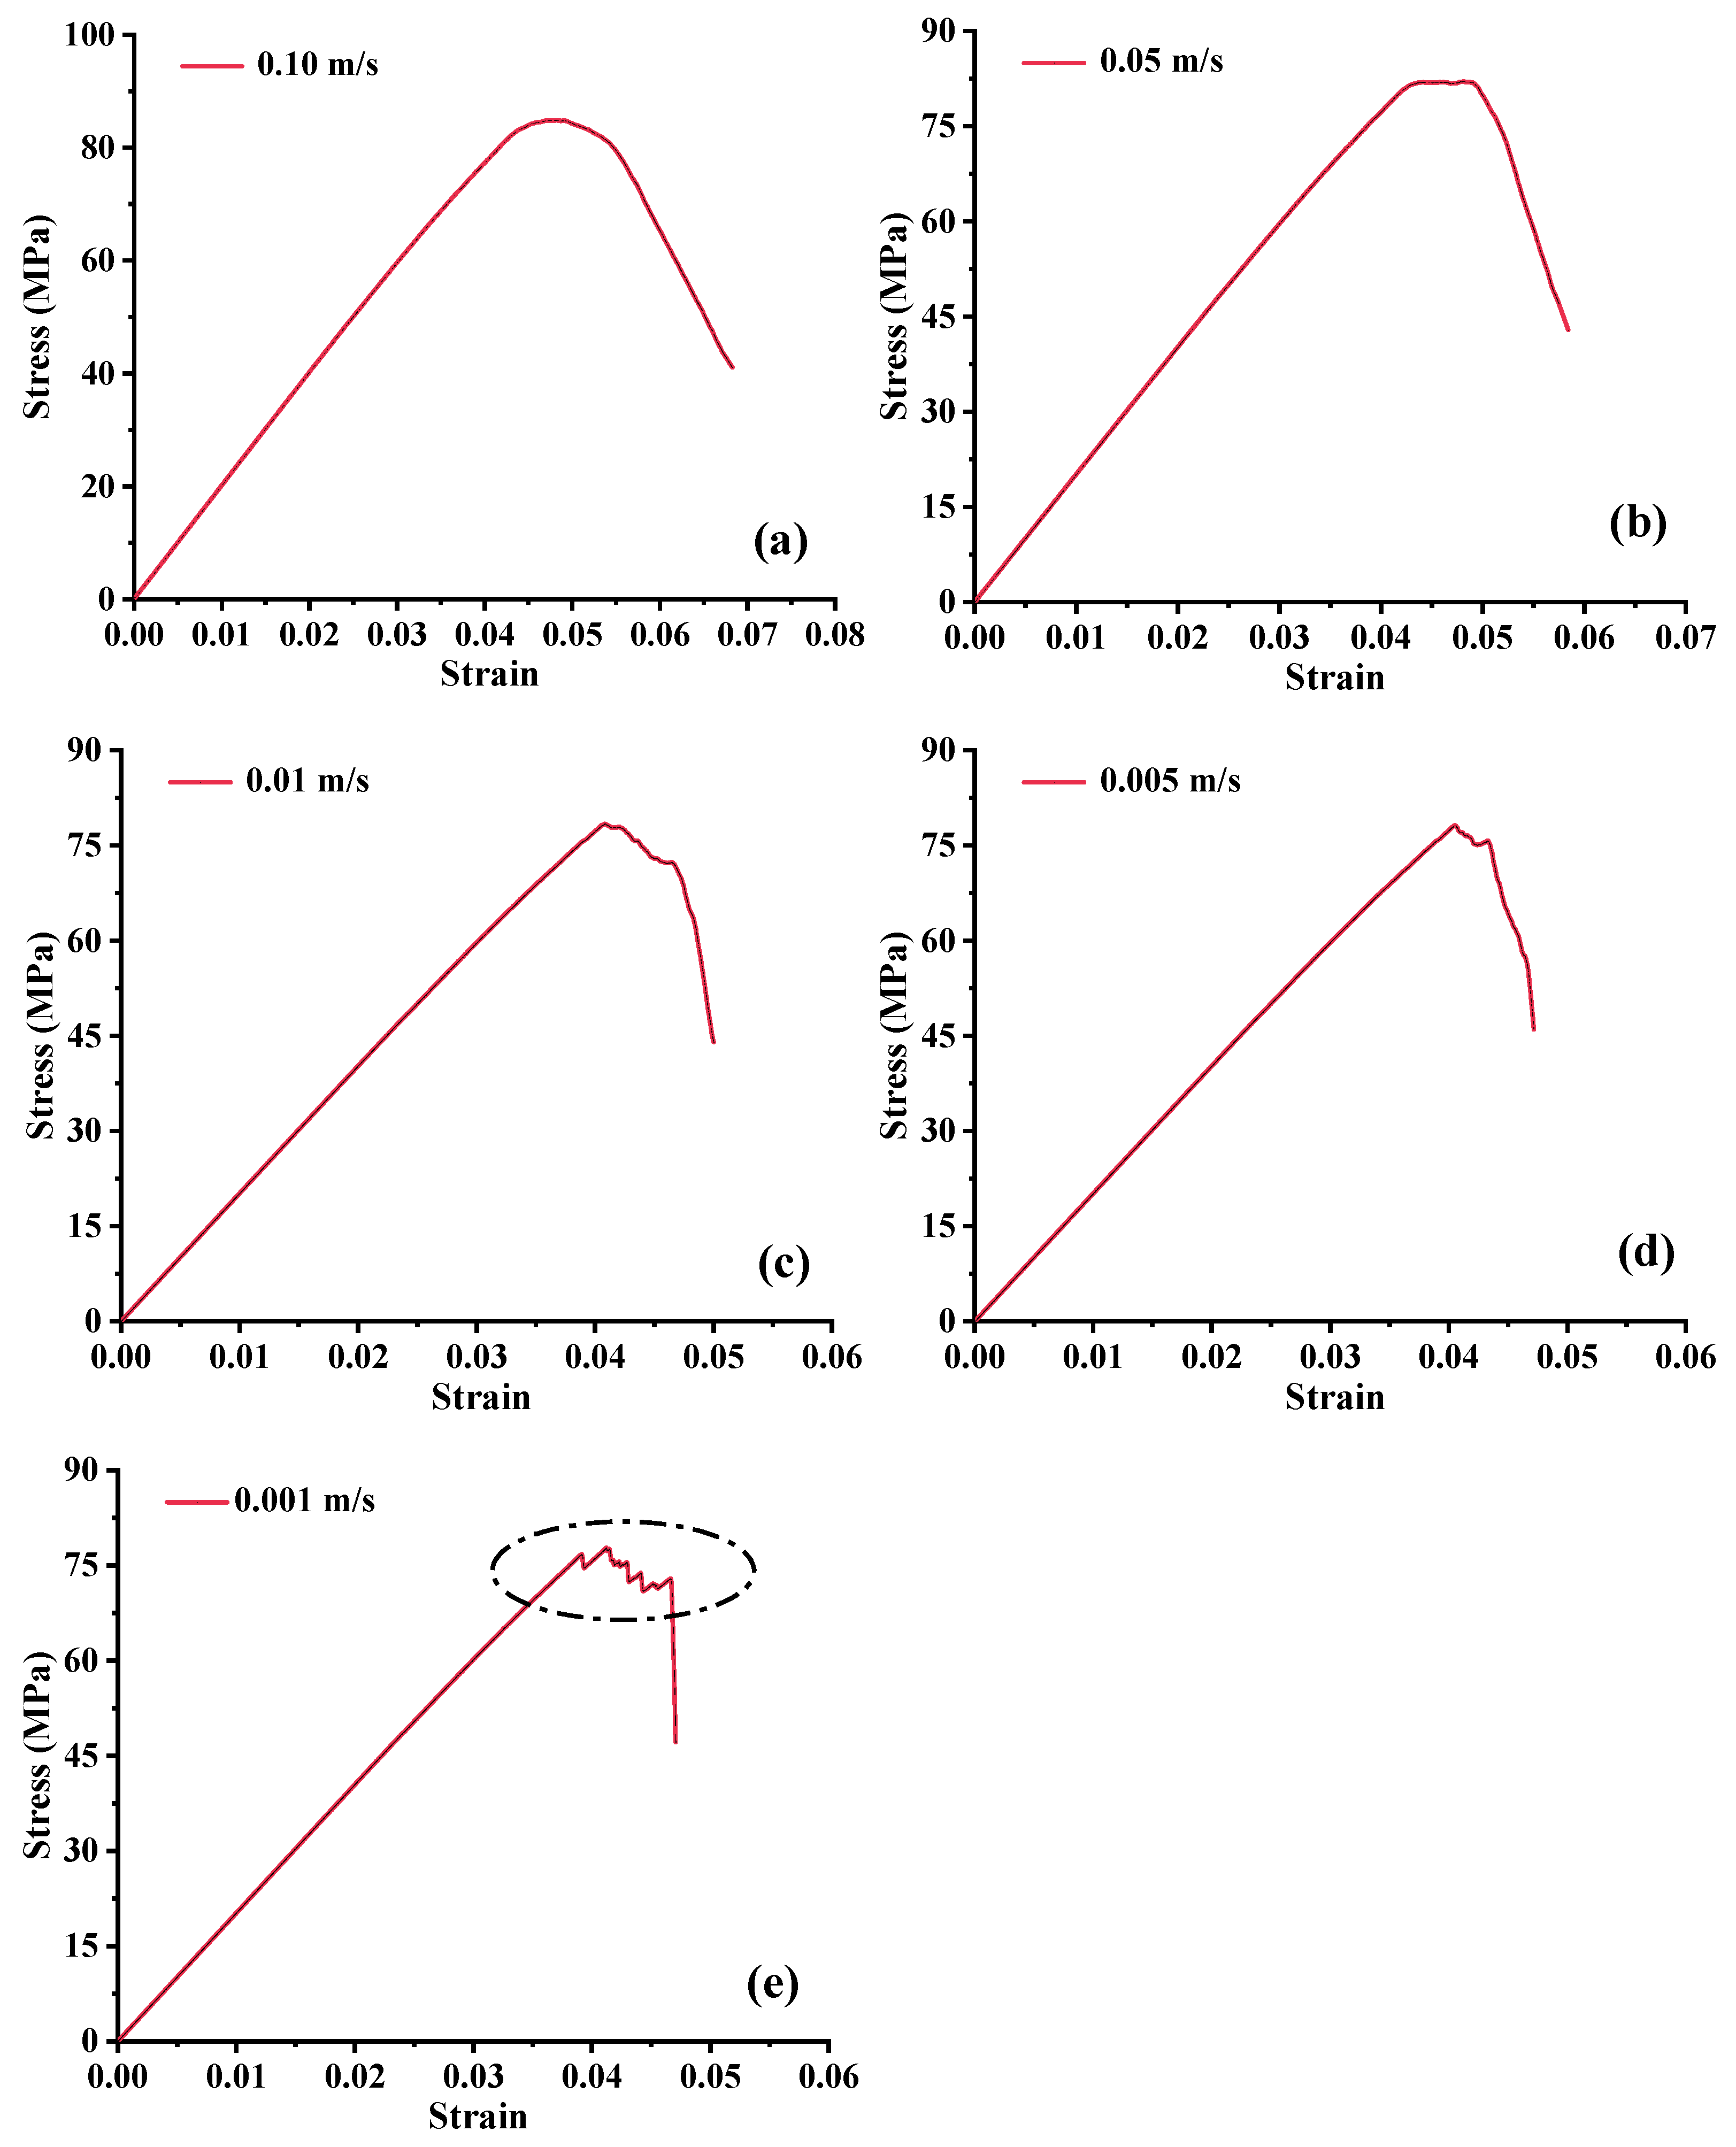
Figure 7 shows the stress–strain curves for each loading rate. The results reveal a pronounced rate dependence in strength response: higher loading rates produce higher peak stresses, faster strain development, and steeper curve slopes, indicating greater strength retention and reduced plastic lag effects. Conversely, at the lowest rate (0.001 m/s), the stress–strain curve exhibits fluctuations, noticeable declines in terminal stress, and even stress plateaus or sudden instability, reflecting poor structural stability (
Figure 7e).
Additionally, quantitative insights can be drawn from the cumulative plastic strain data in
Table 4. In the early stage of loading (<3000 steps), higher loading rates result in a faster increase in plastic strain. However, in the mid-to-late stages, the growth rate of cumulative strain under lower loading rates—particularly 0.001 m/s—gradually surpasses that of the higher rates. By 10,000 steps, although the absolute strain value at 0.001 m/s (4.71%) remains slightly lower than that at 0.01 m/s (5.07%), the relative increase from 3000 to 10,000 steps is more pronounced. The comparison with 0.01 m/s is meaningful because, despite being one order of magnitude higher in rate, it yields a similar final strain value. This highlights that the accumulation of plastic strain at extremely low rates is governed by time-dependent effects and stress relaxation, which can eventually offset the kinetic advantage of higher rates and promote delayed global damage. The observed rate-dependent behavior can be attributed to differences in particle contact restructuring and energy dissipation modes under coupled stress–time effects. Under high-rate loading, the shorter interaction times between particles lead to rapid stress concentration and release, causing localized failure but insufficient structural reconfiguration to drive large-scale fatigue degradation. In low-rate loading, prolonged particle interaction facilitates microcrack propagation and linkage, while cumulative contact fatigue effects become more pronounced, promoting widespread force-chain degradation and structural instability. Excessively low rates may also induce quasi-static creep behavior, further accelerating plastic deformation.
In summary, loading rate exerts a dual regulatory effect on the fatigue response of solar panels: higher rates suppress global damage but increase the likelihood of localized impact-type failure, whereas lower rates improve load coordination but promote cumulative damage and strength decay. Therefore, both load frequency and panel geometry should be considered in structural design and fatigue life assessment, and the loading rate should be controlled within an optimal range to enhance long-term service performance and fatigue resistance.
3.3. Evolution of Bond Fracture and Particle Breakage
Under loading, bond fracture and particle breakage constitute one of the core manifestations of fatigue damage evolution in solar road panels [
18].
Figure 8 illustrates the progression of particle breakage and bond failure under different structural configurations and loading rates, while
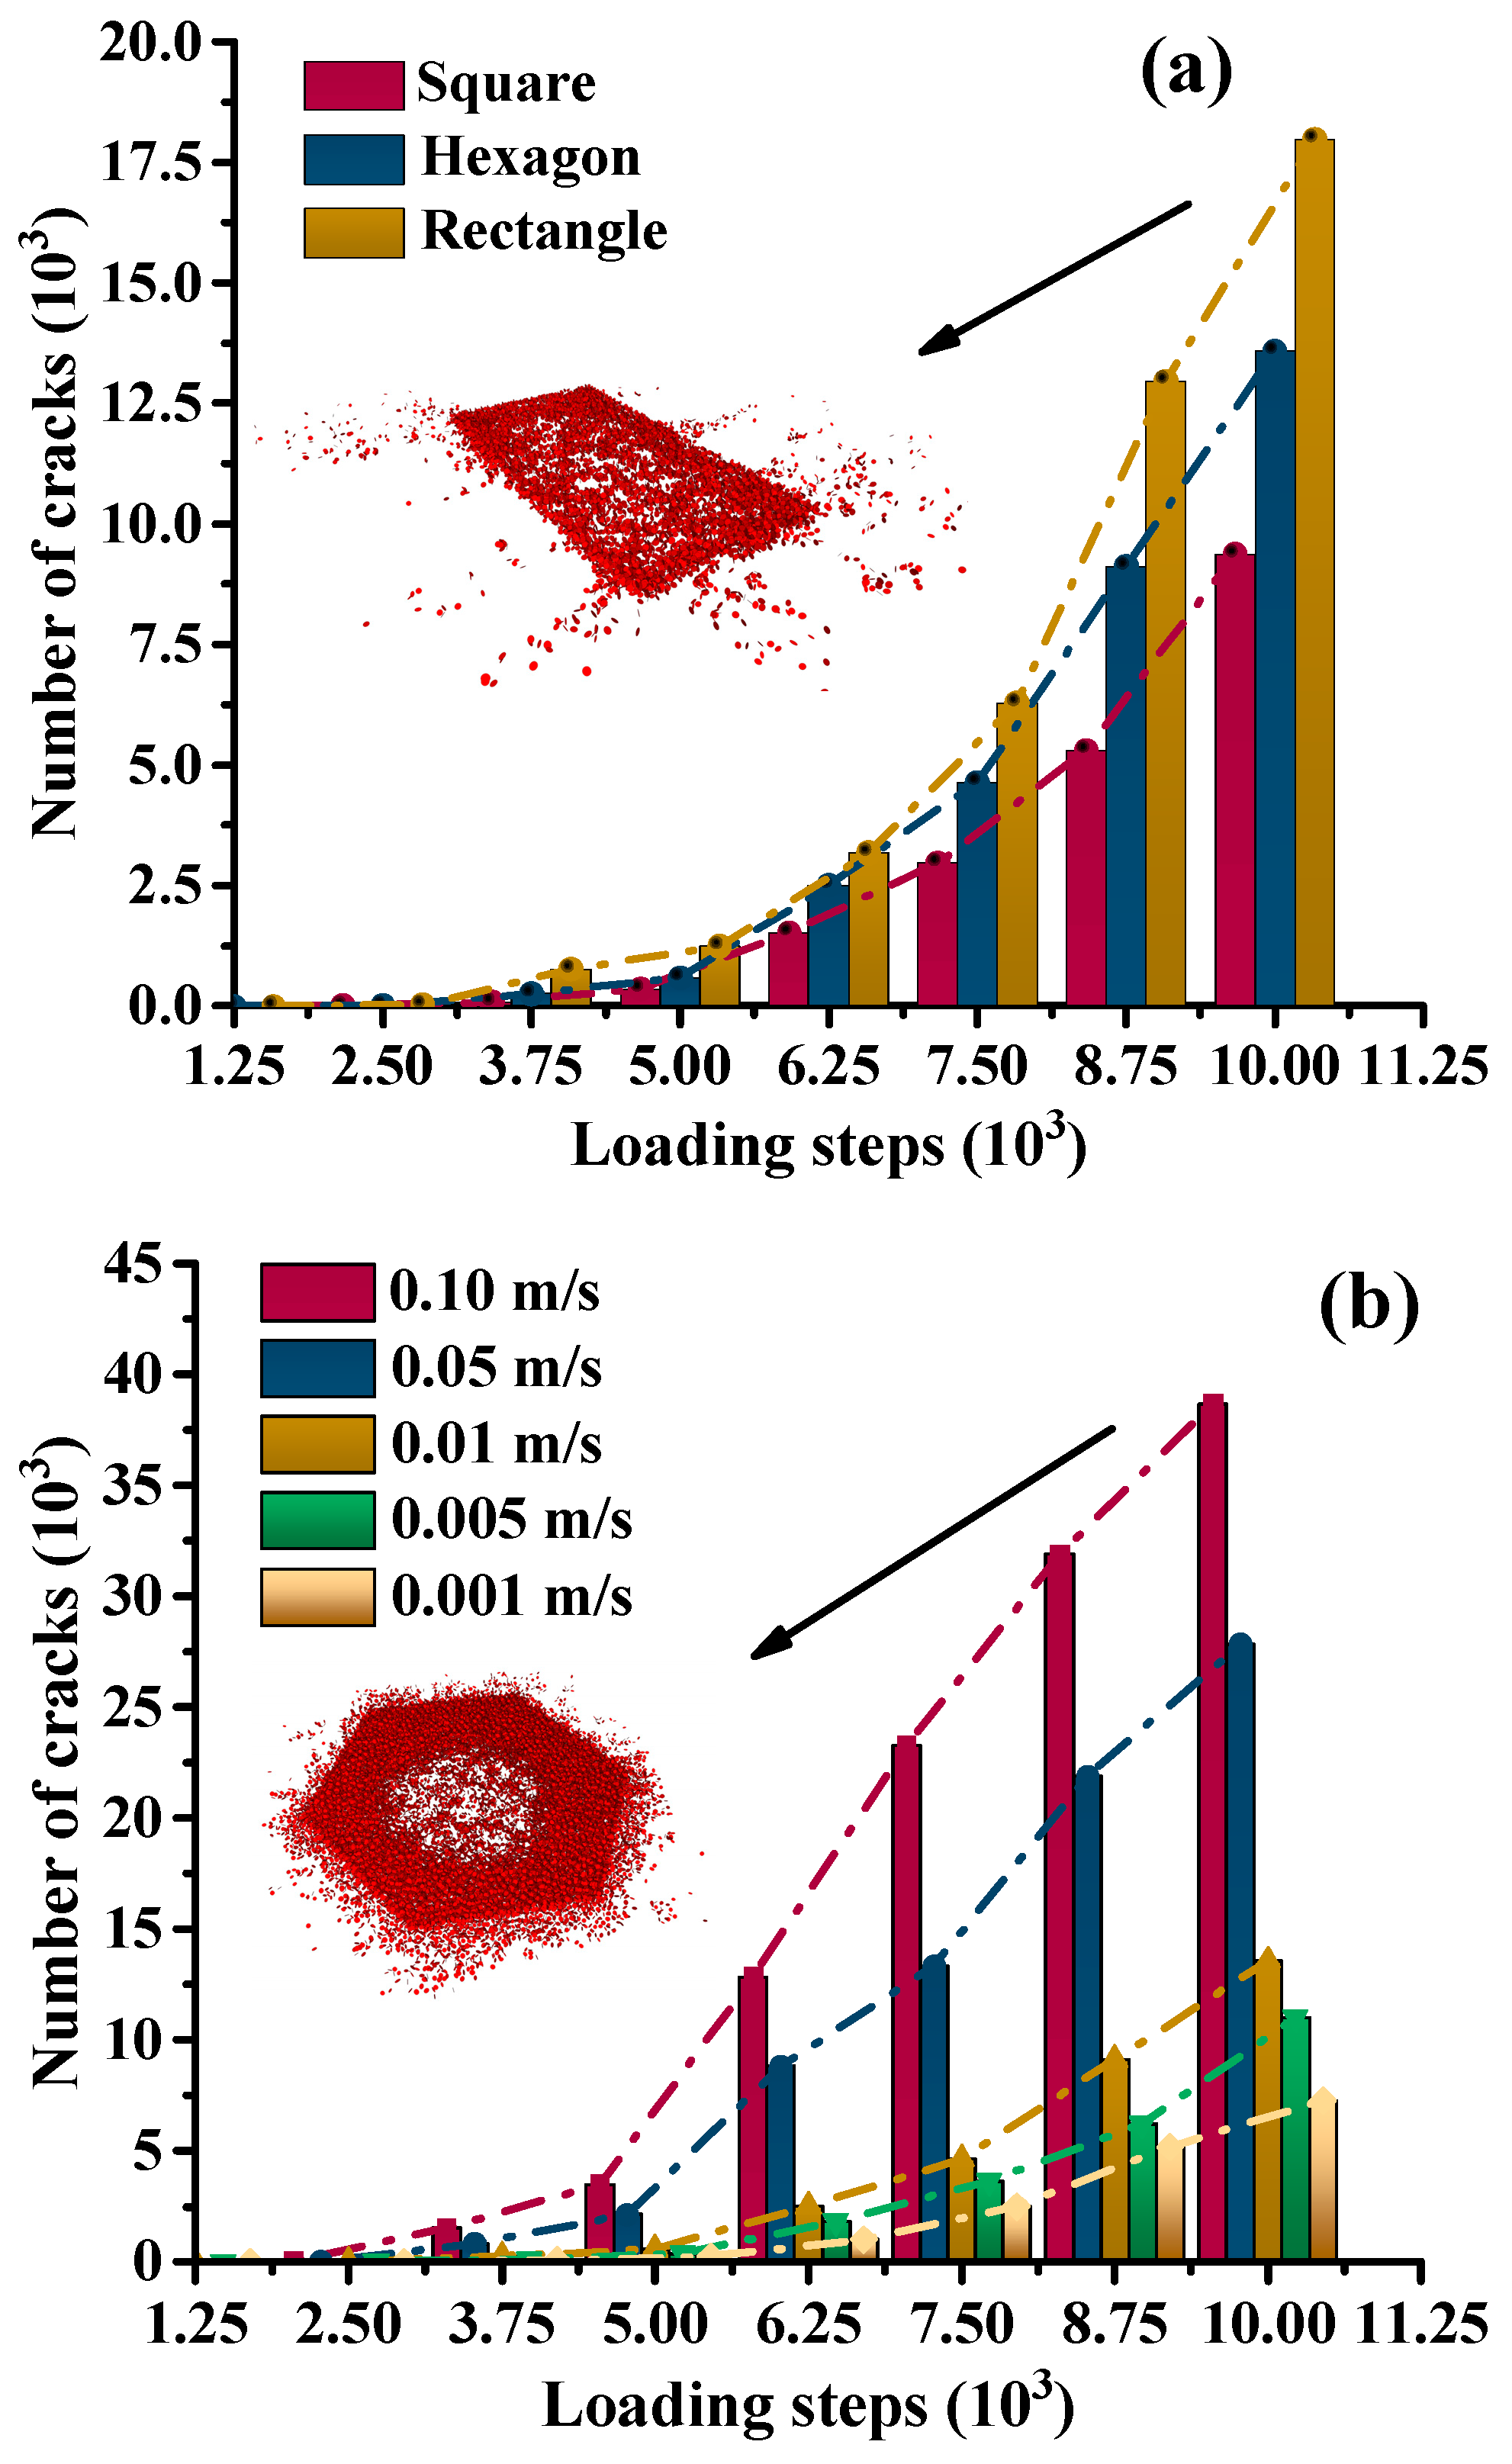
Figure 9 quantitatively captures the variation trends in fracture counts over time. As shown in
Figure 8, all panel types exhibit noticeable particle breakage and bond failure during loading, with the damaged zones expanding from the loading center toward the edges. Among them, the rectangular structure shows the most severe particle dispersion, with fracture points densely concentrated at both ends along the loading direction, indicating poor structural stability and pronounced stress concentration effects. The square structure also experiences breakage, but primarily within the core loading zone, with limited edge damage, reflecting stronger overall crack resistance. The hexagonal structure displays moderate breakage, with damage spreading in multiple directions, suggesting some degree of force-chain reconfiguration.
From a quantitative perspective,
Figure 9 presents the evolution of bond fracture counts with loading steps for different structural forms and loading rates.
Figure 9a shows that fracture counts for all three structures follow an exponential growth trend as loading progresses, but with distinct growth rates. At 10,000 steps, the rectangular structure reaches the highest cumulative fracture count (17,978), followed by the hexagonal structure, while the square structure records the lowest (9366), further confirming the differences in their ability to suppress microcrack propagation.
Figure 9b reveals that loading rate also significantly affects fracture evolution: at a high loading rate of 0.10 m/s, the fracture count is the highest and grows rapidly, whereas lower loading rates result in fewer fractures and a more gradual increase. For instance, at 10,000 steps, the fracture count exceeds 38,000 at 0.10 m/s but is only around 8000 at 0.001 m/s.
The underlying mechanism can be attributed to differences in the response and failure modes of the bonded particle structure under loading disturbances [
27]. On the one hand, the structural form determines the stress transmission paths and fracture patterns. The geometric symmetry of the square structure facilitates uniform stress distribution throughout the panel, dispersing the load across bonds and making it more difficult to form continuous crack propagation chains. In contrast, the rectangular structure experiences pronounced stress concentration along the loading axis, causing localized bonds to exceed their strength limits and rapidly coalesce into through-cracks, triggering extensive fracture. On the other hand, loading rate influences both the duration of stress acting on bonds and the failure mode. At high rates, abrupt load changes impose stronger impact forces on bonds, limiting the ability of the structure to dissipate energy and leading to rapid damage accumulation; at low rates, bonds have more time to adapt to the loading process, allowing more energy to be dissipated through gradual microcrack development and deformation, which helps to control the extent of fracture.
In summary, the evolution of bond fracture in solar road panels is jointly governed by structural geometry and loading rate. Square configurations and low loading rates are more effective in suppressing crack propagation and bond failure, thereby enhancing the fatigue durability of the panel. Consequently, future design optimization should prioritize geometries with strong symmetry and well-constrained boundaries, combined with loading rate ranges tailored to service conditions, in order to control bond damage progression and extend structural lifespan.
3.4. Fatigue Damage and Strength Degradation Characteristics
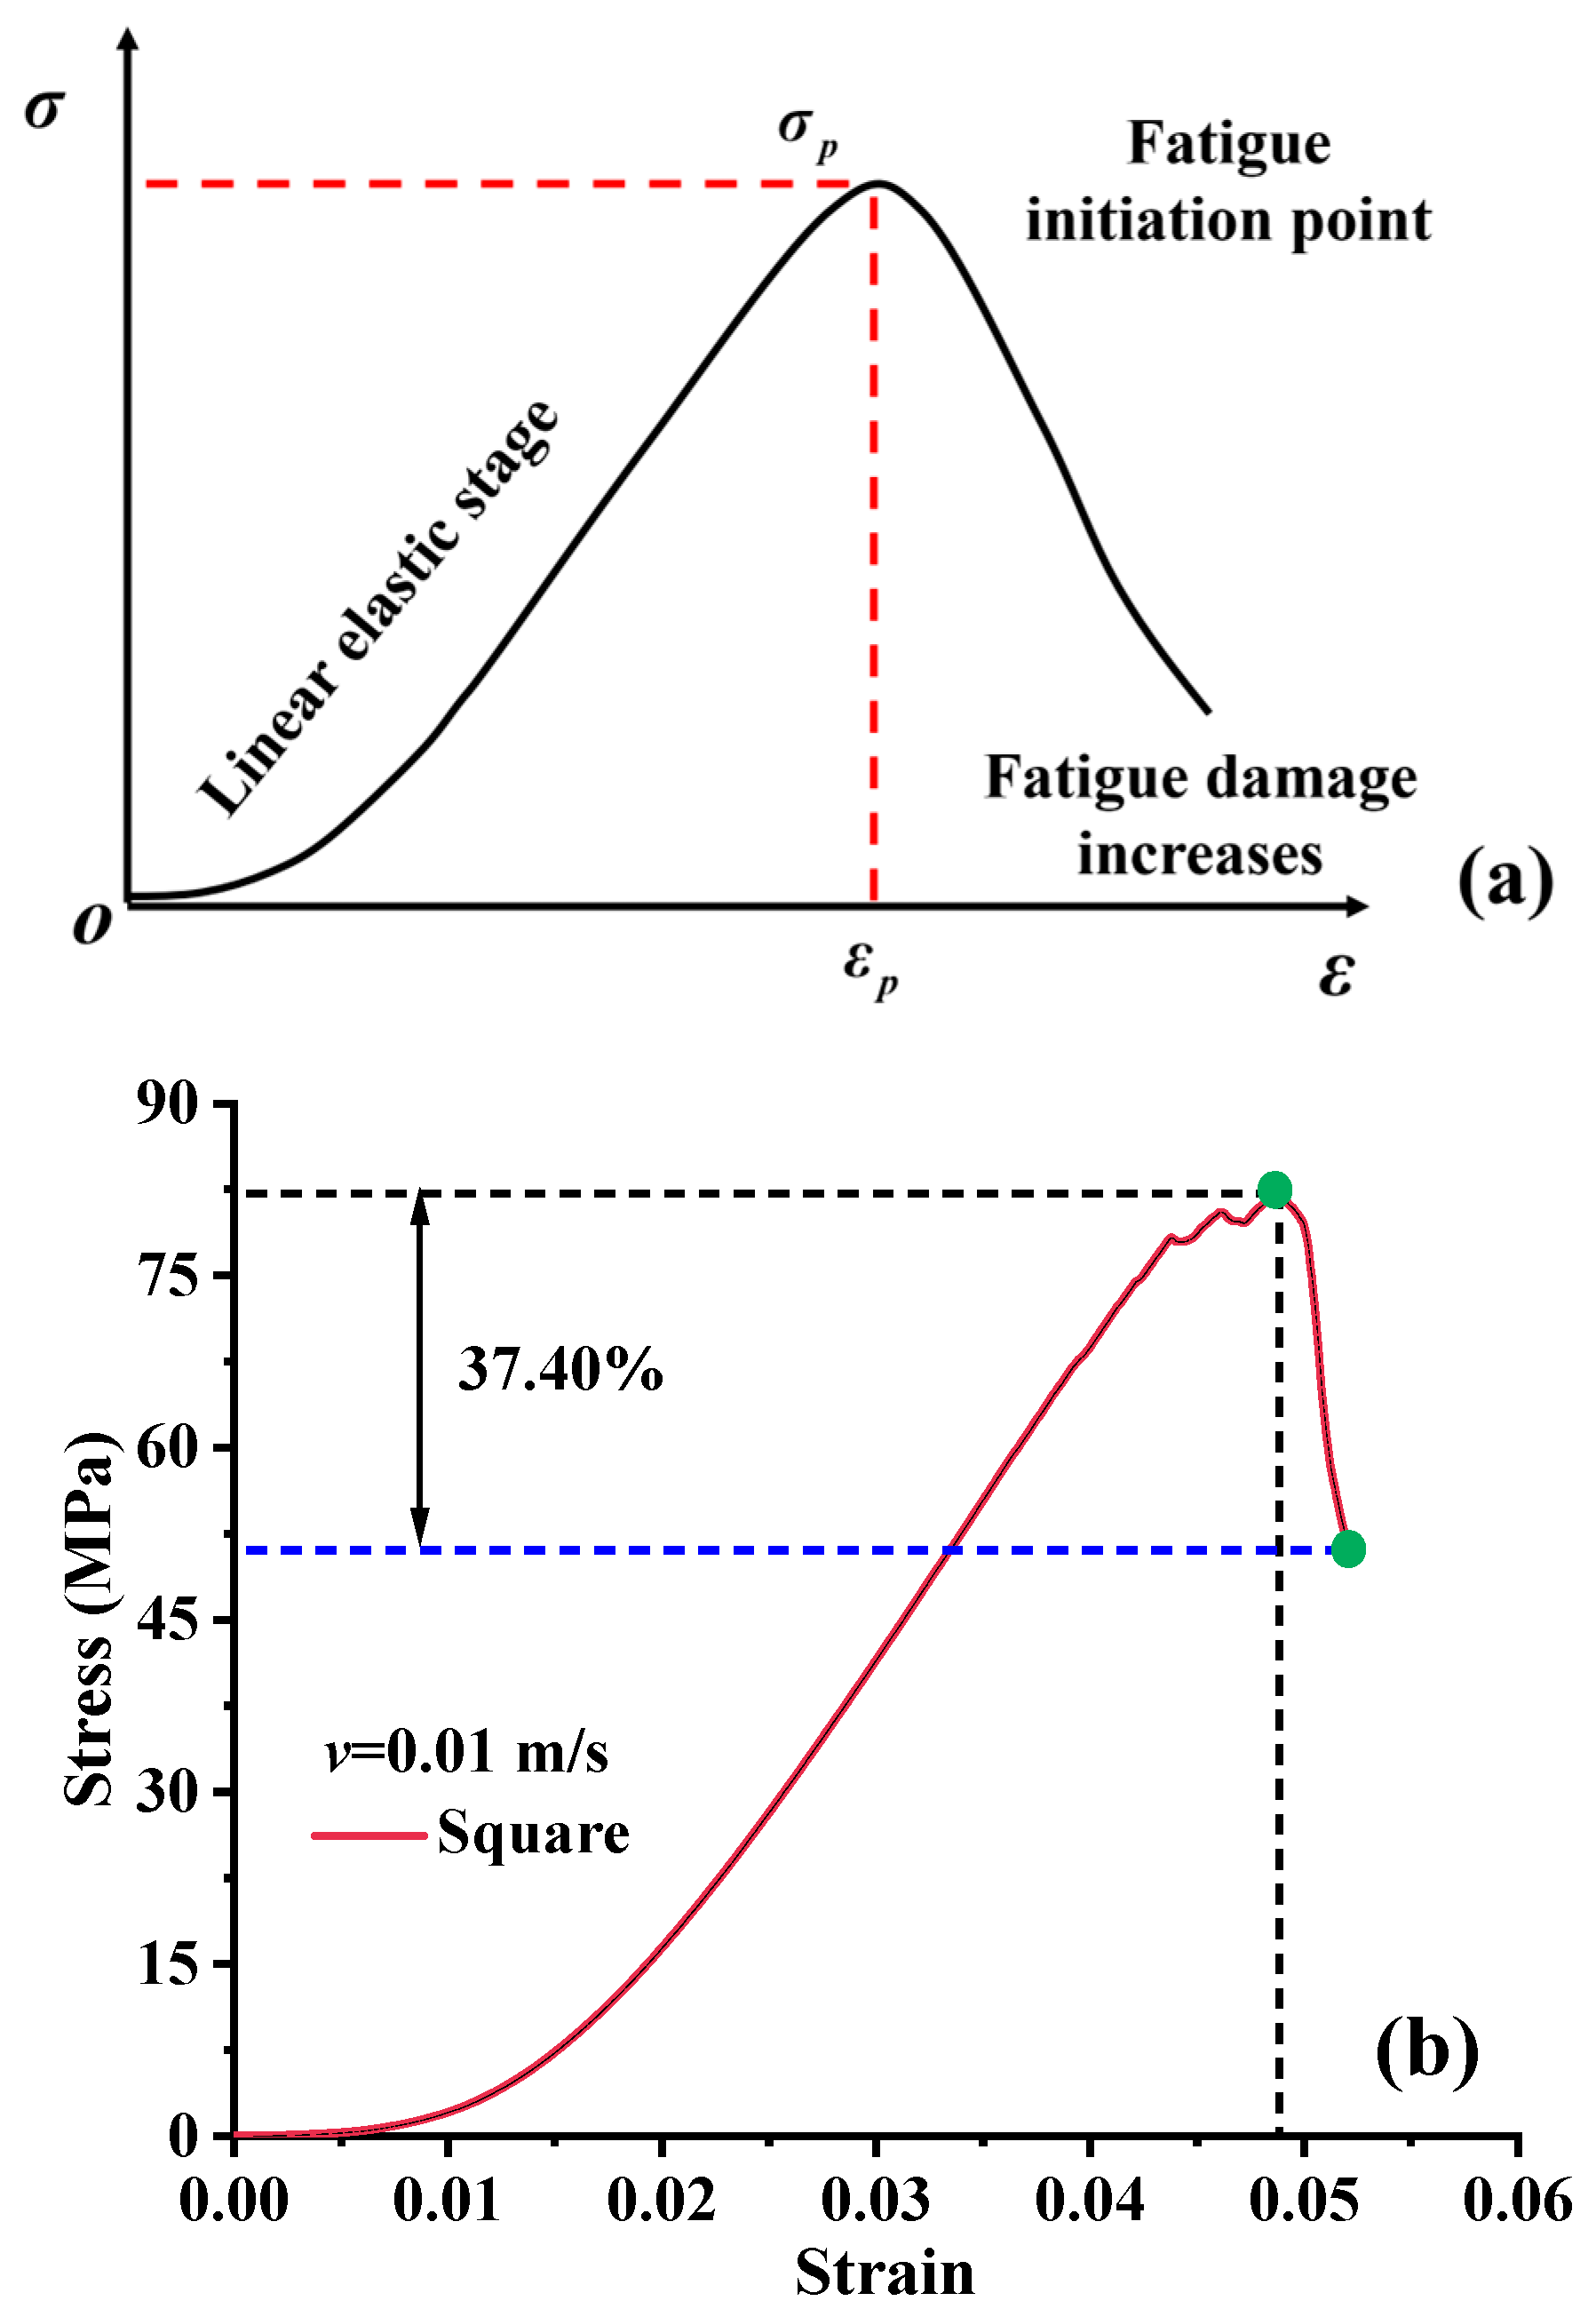
To accurately characterize the fatigue damage evolution of solar road panels under quasi-static loading, this study uses the peak point of the stress–strain curve during a single loading cycle as a key criterion. By extracting characteristic numerical indicators from the curve, a structural damage identification system and a fatigue evaluation framework are established. As shown in
Figure 10 (example: square panel, loading rate 0.01 m/s), the panel initially exhibits a linear elastic response, where stress and strain maintain an approximately proportional relationship. Stress growth then slows, eventually reaching a peak stress, after which a pronounced decline is observed. This drop indicates that particle contacts or bonded interfaces inside the structure begin to fail; strain continues to increase but the load-bearing capacity decreases, marking the onset of the damage evolution phase.
- (1)
Fatigue Damage Threshold
Structural deterioration during fatigue can be identified and quantified from characteristic changes in the stress–strain curve [
28]. In this study, the strain at the peak stress in the static stress–strain curve, denoted as
εp, is defined as the fatigue initiation point. Beyond this point, stress reduction signifies the development of significant internal damage, including bond loosening or cracking, leading to a damage-dominated stage:
- (2)
Fatigue Evaluation Indicators
To quantify the fatigue durability of the panels under various conditions, the strength degradation rate
Rσ is defined to characterize the reduction in load-bearing capacity from the peak state to final instability:
where
σf is the stress at the end of loading (e.g., at maximum strain), and
σp is the peak stress. In general,
Rσ ≥ 0.3 indicates significant softening, implying that the structure can no longer meet load-bearing requirements.
Figure 11a compares
Rσ across different geometries at the same loading rate (0.01 m/s). The square panel exhibits the lowest degradation rate (37.40%), while the rectangular panel shows the highest (50.13%). This indicates that geometric configuration has a pronounced effect on fatigue durability: the more complex the boundary shape and the less symmetric the internal structure, the stronger the stress concentration effect and the higher the susceptibility to fatigue failure.
Figure 11b shows the influence of loading rate on
Rσ for the hexagonal structure. With increasing loading rate,
Rσ rises markedly—from 39.40% at 0.001 m/s to 51.75% at 0.10 m/s. This demonstrates that loading rate is a critical kinetic factor in fatigue damage evolution. Higher loading rates intensify internal inertial responses and accelerate local microcrack growth, thereby reducing the material’s capacity for energy dispersion and ultimately causing earlier and more severe fatigue failure.
In order to quantify this trend, nonlinear regression analysis was conducted between loading rate and
Rσ. The results indicate that their relationship follows an exponential form, which is expressed as Equation (3) and illustrated in
Figure 12. Equation (3) is therefore established as an empirical expression obtained from regression analysis of the experimental data rather than from theoretical derivation. With a goodness of fit
R2 = 0.935, indicating high predictive accuracy. This model provides a practical theoretical basis for estimating fatigue life and optimizing structural design under various loading conditions, particularly in service environments with sudden vehicular load changes or frequent thermal expansion–contraction cycles.
where
v is the loading rate.
In summary, fatigue damage evolution in solar road panels is jointly governed by geometric configuration and the dynamic characteristics of external loading. By establishing a strength degradation–based evaluation framework, it is possible to rapidly assess the fatigue state and predict the remaining service life of panels. Specifically, given the expected loading rate of service conditions, the corresponding strength degradation rate Rσ can be calculated using the exponential regression model (Equation (3)). By comparing the predicted Rσ with a defined critical degradation threshold (e.g., Rσ ≥ 0.3), the remaining number of cycles before the panel reaches unacceptable damage can be estimated. This stepwise approach provides a practical methodology to quantitatively predict service life under various loading rates and geometric configurations, thereby supporting maintenance planning and structural optimization.
4. Discussion
Based on the comprehensive analysis of fatigue response characteristics, fracture mechanisms, and strength degradation trends, it is evident that the service stability of solar road panels is influenced by the coupled effects of structural configuration, loading dynamics, and local material damage evolution. To enhance long-term performance and fatigue resistance, a coordinated approach involving structural optimization, load management, and material modification is recommended. The following strategies are proposed for practical engineering applications:
- (1)
Optimal structural configuration to enhance geometric stability and stress distribution. Results indicate that geometric form is a critical determinant of fatigue performance. Square panels exhibit superior strength retention and crack-suppression capacity due to their symmetric boundaries and balanced stress paths. In contrast, rectangular panels show pronounced stress concentration along the loading direction, leading to bond failure and particle instability. Therefore, in practical solar road systems, panels with high geometric symmetry and stable boundary constraints, such as square or hexagonal forms, are preferable to delay force chain degradation and damage propagation. Additionally, reinforcing ribs or buffer zones along panel edges can further enhance crack resistance.
- (2)
Controlled loading rate to mitigate fatigue accumulation and localized impact damage. Loading rate exerts a dual effect on fatigue response. High rates suppress global deformation and enhance stiffness response but may induce localized impact damage, whereas low rates improve structural coordination but increase the risk of delayed damage and stress relaxation. Therefore, it is recommended to tailor loading conditions according to traffic frequency and environmental disturbances. For areas with frequent heavy vehicle traffic, extremely low-speed loading should be avoided, and partitioned sub-layers or cushioning layers can reduce local impact risk. In lighter-load or intermittent zones, a broader loading rate range may be permissible to extend service life.
- (3)
Optimized bonding properties and particle composition to improve fracture toughness and energy dissipation. Fatigue failure in solar panels is primarily driven by the coupled evolution of bond breakage and particle fracture. Bond strength and interparticle toughness govern micro-instability and crack propagation. Based on fracture evolution analysis, incorporating high-toughness polymer-modified binders and enhancing interparticle bonding can improve structural ductility and crack resistance. Additionally, optimizing particle gradation by increasing the proportion of medium-sized particles can establish a more stable particle force chain network, reducing microcrack connectivity and enhancing overall fatigue durability.
- (4)
Strength degradation-based predictive modeling for life assessment and structural monitoring. The strength degradation index Rσ and its associated exponential predictive model (Equation (3)) provide quantitative guidance for fatigue-resistant design. Embedding sensors or online monitoring devices to track stress responses, coupled with predictive modeling, enables real-time fatigue assessment and early identification of potential failure risks. These insights can inform material selection, structural layout, and maintenance scheduling, promoting a transition from passive maintenance to “intelligent self-sensing and active regulation” for solar road systems.
In summary, enhancing fatigue performance requires a synergistic approach integrating structural optimization, loading control, and material modification, supplemented by predictive modeling and real-time monitoring to ensure long-term, safe, and stable service.


