Abstract
Within the framework of Dexter’s theory, we calculate the energies of the Stark levels of Yb3+-Yb3+ paired centers in lithium niobate doped with Yb3+ ions (LiNbO3:Yb3+) crystal, considering the interaction of optical electrons of ytterbium ions forming the paired center. The calculated Stark level energies are shown to correspond well with the observed cooperative luminescence wavelengths.
1. Introduction
The lattice structure of the LiNbO3 (LN) crystal, belonging to the space group R3c (C3v), consists of chains of trigonally distorted octahedrons aligned along the crystallographic optical axis. The rhombohedral unit cell contains four formula units, with lattice constants at room temperature of a = 5.1483 Å and c = 13.8631 Å [1]. In the LN crystal lattice, trivalent rare-earth (RE3+) impurity ions can predominantly occupy the positions of Li+ ions or replace Nb5+ ions at Li+ sites (anti-sites), ensuring charge compensation [2,3]. The location and local symmetry of RE3+ impurity ions in the LN lattice have been extensively studied using electron paramagnetic resonance (EPR) spectroscopy (see, for example, [4,5,6,7]). Specifically, studies [6] have demonstrated that RE3+ ions occupy octahedral sites with either C3 or C1 local symmetry. Furthermore, the research in [7] confirmed the presence of Yb3+-Yb3+ paired centers in the LN crystal matrix, with an interionic distance of 3.1 Å.
Thus, in the LN crystal lattice, in addition to single impurity centers, paired centers (dimers) can form due to the close proximity of RE3+ ions. These paired centers influence both the spectroscopic properties (such as cooperative luminescence) and the kinetic characteristics of the LN crystal [8]. Experimental and theoretical studies on cooperative luminescence (CL) in Yb-doped crystals have been conducted in [9,10,11,12,13,14,15]. Notably, [9] investigated cooperative luminescence in LN:x%Yb3+ (x = 0.7%, 1.2%, and 4%) crystals at 12 K under 920 nm excitation. Analysis of the experimental data revealed that approximately 10.4% of Yb3+ ions in the LN matrix form paired Yb3+-Yb3+ centers, where one Yb3+ ion resides at a Li+ site and the other at a Nb5+ site. Cooperative luminescence (CL) was observed in Li₆Y(BO3)3:x%Yb3+ (x = 1, 5, 20) crystals within the 526–476 nm wavelength range at temperatures of 6–300 K, under both continuous and pulsed excitation at 972.3 nm [10]. In [11], the effects of cooperative luminescence and absorption in Yb-doped fibers (YFs) were extensively studied under continuous excitation at 980 nm. It was shown that Yb3+ ion pairs significantly influence both the nonlinear transmittance of YF at λex = 980 nm and the relaxation dynamics of the excited Yb3+ state. In [12], blue emission was observed in Yb3+-activated Y4Al2O9 crystals (10 at.%) under infrared site-selective laser excitation. A detailed analysis of the absorption and emission spectra, along with measurements of emission intensity dependence on excitation power and relaxation time, confirmed that CL is responsible for the observed emission. Similarly, in [13], UV emission was detected in Yb3+:CaF2 upon near-IR excitation. The UV emission intensity exhibited a cubic dependence on pump power, while the luminescence lifetime was approximately one-third that of isolated Yb3+ ions. The observed spectral features matched the self-convoluted spectra of three individual Yb3+ ions, confirming that the UV emission originates from the cooperative luminescence of three Yb3+ ions. CL also plays a role in sensitization within the Yb/Tb system, where energy transfer occurs from the excited states of Yb3+ ion pairs to Tb3+ ions [14].
In this study, we employ Dexter’s theory to calculate the Stark level energies of Yb3+-Yb3+ paired centers in LN, explicitly accounting for the interaction of optical electrons between the ytterbium ions forming the paired center.
2. Materials and Methods
Within the framework of Dexter’s theory [15], we assume that the interaction between impurity ions in an RE3+-RE3+ paired center is significantly weaker than the interaction between the crystal field (CF) and an individual RE3+ ion. Consequently, the Hamiltonian for the RE3+-RE3+ paired center can be expressed as follows:
where and are the Hamiltonians for single Yb3+ ions, numbered with indices “a” and “b”, () is the Hamiltonian of the interaction of an optical electron with its own nuclear core, is the CF Hamiltonian. Thus,
where and ( and are the energies (wave functions) of the and μth Stark states of “a” and “b” ytterbium ions, respectively. Representing the electron wave functions of a paired center as a product of one-electron wave functions of ions “a” and “b”, , for the eigenvalues of Hamiltonian (1), we obtain
where and are the radius vectors of the optical electrons of ions “a” and “b” (Figure 1).
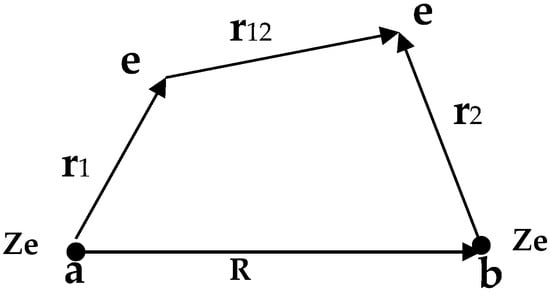
Figure 1.
Yb3+-Yb3+ paired center: e and Ze are electron and nuclear charges.
We will consider the Coulomb interaction of the optical electrons of “a” and “b” ions with each other. Then,
where is the distance between the nuclei of ions “a” and “b”.
Expanding the right-hand side of (4) in a series in the powers of and and moving to spherical coordinates and , we obtain
where the following notations are introduced,
where , , is the spherical function, and is the Clebsch–Gordan coefficient. Using (5) and (7), we represent the third term of Formula (3) in the form
In this case, due to the selection rules, the non-zero contributions are given by the terms . At the same time, the term can be discarded, since taking it into account leads to a uniform shift in energy levels.
3. Results
Within the weak crystal-field (CF) approximation, the wave functions of the Stark levels for a single RE3+ center, expressed in the LSJM representation, take the form
where are the Hartree–Fock radial wave functions of the RE3+ ion, the explicit form of which for RE3+ ions is given in [16], are the numerical coefficients, L, S, and J are the orbital, spin, and total angular momenta, and M is the projection of the total angular momentum. Thus, calculating the matrix elements in Equation (8) reduced to calculation matrix elements that are diagonal in S, L, and J,, where summation is performed over the equivalent optical electrons of the RE3+ ion. By applying the Wigner–Eckart theorem [17] and transitioning to unit tensor operators , we obtain the following:
The given matrix element is calculated using the Racah scheme [17,18].
In (10) and (11), the following notations are introduced: N is the number of equivalent electrons (holes) of an unfilled electron shell, represents the 6j symbols, is the fractional parentage coefficient of Racah, the numerical values of which for pn, dn, and fn electron shells are tabulated in [19], and is the average value of the radius vector of the optical electron of the impurity ion.
For Yb3+ ions, the reduced matrix elements, calculated using Formula (11), are equal to , , , , , . The average values of the radius vector of the optical electron of the Yb3+ ion are given in [16]: , , .
4. Discussion
As is well known, the ground electronic configuration (4f13) of the Yb3+ ion comprises an eight-fold degenerate ground-state manifold, 2F7/2, and a six-fold degenerate excited-state manifold, 2F5/2. The crystal field (CF) splits these manifolds into four and three Kramers doublets, respectively. The spectroscopic properties of LN:Yb crystals with varying impurity ion concentrations were thoroughly investigated in [2,20,21,22]. Specifically, in [20], the wave functions of the Stark states of the Yb3+ ion were constructed within the LSJM representation using the weak CP approximation (12), as detailed below.
As a result of the interaction (4), the Kramers states and of individual Yb3+ ions forming a paired center become mixed, giving rise to seven four-fold and twenty-one eight-fold degenerate states , The energies of these states are determined by the expression (3). The values of the energy levels of the paired center Yb3+-Yb3+ calculated using the above formulas are shown in Table 1. As shown in Table 1, the energy levels of the Yb3+-Yb3+ center are clustered into three distinct regions (last column of Table 1), 0–1545.9 cm−1, 10,376.3–11,479.5 cm−1, and 20,753.5–21,415 cm−1, separated by approximately 9000 cm−1. The energy separation between levels within each group ranges from approximately 100 to 300 cm−1. Consequently, the levels (1,5) and (5,5) are metastable, allowing for possible luminescence under appropriate excitation conditions. To facilitate comparison with experimentally observed cooperative luminescence wavelengths [9], Table 2 presents the transition wavelengths from the metastable level (5,5), calculated based on the data in Table 1. It is evident that the calculated values closely match the measured wavelengths, with an accuracy comparable to the spectral line widths .

Table 1.
Energy levels of the paired center Yb3+-Yb3+ in LN.
Table 2.
Calculated and measured values of the wavelengths of CL at 12 K.
It should be noted that to reconstruct the cooperative luminescence spectrum, , of the Yb3+-Yb3+ dimer, the self-convolution of the spectrum,, of an individual Yb3+ ion is used:
It is evident that when using the luminescence spectrum of Yb3+ in the infrared region (900–1200 nm), the cooperative luminescence spectrum, calculated using Equation (13), falls within the visible wavelength range (450–600 nm), as observed in [10,11,12,13,14].
For LN:Yb at low temperatures, this corresponds to transitions from level (5,5) to levels (i, j), where i, j = 1, 2, 3, and 4 (Table 2). However, the absorption and emission spectra of the Yb3+ ion theoretically include lines in the Long-Wave Infrared (LWIR) region, originating from transitions between Stark levels within the same multiplet. However, due to strong phonon suppression, these lines are so weak that they remain experimentally unobservable and are therefore neglected when analyzing the spectra of individual Yb3+ centers. However, incorporating these transitions into in the calculation using Equation (13) results in the appearance of an additional set of lines in the infrared region (10,376.3–11,479.5 cm−1, Table 1). Notably, the numerous additional lines observed in the infrared absorption and luminescence spectra of Yb3+-containing materials (e.g., [2,13,23]) may also originate from transitions between the energy levels of Yb3+-Yb3+ paired centers.
It is worth noting that at sufficiently high concentrations of paired centers, the absorption spectrum contains lines in the wavelength range of 460–480 nm [11]. However, to our knowledge, no experimental studies have been conducted to measure the absorption of LN: Yb3+ crystals in this spectral region.
5. Conclusions
Considering the interaction of optical electrons within the impurity ion paired center significantly alters the energy-level structure, distinguishing three groups of levels in the regions 0–1545.9 cm−1, 10,376.3–11,479.5 cm−1, and 20,753.5–21,415 cm−1, separated by approximately 9000 cm−1. Within each group, the energy spacing between levels ranges from approximately 100 to 300 cm−1. As shown in Table 1, the energy spectrum of the Yb3+-Yb3+ paired center includes two metastable levels, (5,1) and (5,5), which are separated from the nearest lower level by energy gaps of 8830.4 cm−1 and 9274 cm−1, respectively. The presence of the metastable level (5,1) enables the excitation of the (5,5) level when pumped at a wavelength of 955 nm through two mechanisms: reabsorption from the (1,5) level
and cross-relaxation transition according to the scheme
The calculated and observed wavelengths of cooperative luminescence at low temperatures [11] show a satisfactory agreement, with an accuracy of ∆λ~1 ÷ 1.5 nm (Table 2).
Notably, the cooperative luminescence spectrum of the Yb3+-Yb3+ paired center is determined by the self-convolution of the luminescence spectrum of a single Yb3+ ion (Equation (13)). In this approach, the spectra of single centers in the infrared (IR) region are used, which is a reasonable assumption. Consequently, only lines in the visible region are observed, corresponding to transitions from the (5, k) (k = 5, 6, and 7) levels to the levels (j, i) (i, j = 1, 2, 3, and 4) levels. However, considering that the absorption and emission spectra of the Yb3+ ion theoretically also contain lines in the Long-Wave Infrared (LWIR) region due to Stark intra-manifold transitions, self-convolution should also yield lines in the IR region. These lines are caused by transitions from the (5, k) (k = 5, 6, and 7) levels to the (j, i) (j = 1, 2, 3, 4 and i = 5, 6, 7) levels or from the (j, i) (j = 1, 2, 3, 4 and i = 5, 6, 7) levels to the (j, i) (i, j = 1, 2, 3, and 4) levels (Table 1).
Additionally, we note that the weakly intense lines observed in the low-temperature emission and absorption spectra of a single Yb3+ center (see, for example, [15,22,23]) may originate from transitions between the (1,5) level and lower Stark levels, as well as from transitions of the type (1,1) → , at .
Author Contributions
Conceptualization, G.D. and E.K.; methodology, G.D.; software, N.B.; validation, E.K., M.B. and M.A.; investigation, N.K., M.B. and M.A.; data curation, N.K. and N.B.; writing—original draft preparation, E.K. and G.D.; writing—review and editing, E.K. and G.D. All authors have read and agreed to the published version of the manuscript.
Funding
The research was supported by the Higher Education and Science Committee of MESCS RA (research project 25ASPU-PHYS-CON-I-1C).
Data Availability Statement
Data is contained within the article.
Conflicts of Interest
The authors declare no conflict of interest.
References
- Abrahams, S.C.; Reddy, J.M.; Bernstein, J.L. Ferroelectric lithium niobate. 3. Single crystal X-ray diffraction study at 24 °C. J. Phys. Chem. Solids 1966, 27, 997–1012. [Google Scholar] [CrossRef]
- Tsuboi, T.; Kaczmarek, S.M.; Boulon, G. Spectral properties of Yb3+ ions in LiNbO3 single crystals: Influences of other rare-earth ions, OH− ions, and γ-irradiation. J. Alloys Compd. 2004, 380, 196–200. [Google Scholar] [CrossRef]
- Bonardi, C.; Magon, C.J.; Vidoto, E.A.; Terrile, M.C.; Bausa, L.E.; Montoya, E.; Bravo, D.; Martin, A.; Lopez, F.J. EPR spectroscopy of Yb3+ in LiNbO3 and Mg:LiNbO3. J. Alloys Compd. 2001, 323–324, 340–343. [Google Scholar] [CrossRef]
- Bodziony, T.; Kaczmarek, S.M.; Hanuza, J. EPR and optical studies of LiNbO3:Yb and LiNbO3:Yb, Pr single crystals. J. Alloys Compd. 2008, 451, 240–247. [Google Scholar] [CrossRef]
- Dong, H.-N.; Wu, S.-Y.; Zhang, W.-C. Theoretical investigation of EPR parameters for two trigonal Yb3+ centers in LiNbO3 and LiNbO3: MgO crystals. J. Phys. Chem. Solids 2003, 64, 695–699. [Google Scholar] [CrossRef]
- Malovichko, G.; Grachev, V. EPR, ENDOR, and optical-absorption study of Cr3+ centers substituting for niobium in Li-rich lithium niobate crystals. Phys. Rev. B 2000, 62, 7779–7789. [Google Scholar]
- Malovichko, G.; Bratus, V.; Grachev, V.; Kokanyan, E. Electron paramagnetic resonance and electron-nuclear double resonance of nonequivalent Yb3+ centers in stoichiometric lithium niobate. Phys. Stat. Sol. (b) 2009, 246, 215–255. [Google Scholar] [CrossRef]
- Stoffel, M.; Rinnert, H.; Kokanyan, E.; Demirkhanyan, G.; Demirkhanyan, H.; Aillerie, M. Green up-converted luminescence in (Er3+-Yb3+) co-doped LiNbO3 crystals. Opt. Mater. 2016, 57, 79–84. [Google Scholar] [CrossRef]
- Montoya, E.; Espeso, O.; Bausa, L.E. Cooperative luminescence in Yb3+:LiNbO3. J. Lumin. 2000, 87–89, 1036–1038. [Google Scholar] [CrossRef]
- Lengyel, K.; Tichy-Rács, É.; Timpmann, K.; Vielhauer, S.; Romet, I.; Kovács, L.; Corradi, G.; Butkus, R.; Vengris, M.; Grigonis, R.; et al. Cooperative luminescence of Yb3+ ion pairs in Li6Y(BO3)3:Yb single crystals. J. Lumin. 2021, 230, 117732. [Google Scholar] [CrossRef]
- Kir’yanov, A.V.; Barmenkov, Y.O.; Martinez, I.L.; Kurkov, A.S.; Dianov, E.M. Cooperative luminescence and absorption in Ytterbium-doped silica fiber and the fiber nonlinear transmission coefficient at λ = 980 nm with a regard to the Ytterbium ion-pairs’ effect. Opt. Express 2006, 14, 3981–3992. [Google Scholar] [CrossRef] [PubMed]
- Kaczkan, M.; Malinowski, M.; Suchocki, A.; Turczyński, S. Cooperative luminescence of Yb3+ ions in multisite YAM crystal. J. Lumin. 2024, 265, 120162. [Google Scholar] [CrossRef]
- Qin, W.P.; Liu, Z.Y.; Sin, C.N.; Wu, C.F.; Qin, G.S.; Chen, Z.; Zheng, K.Z. Multi-ion cooperative processes in Yb3+ clusters. Sci. Appl. 2014, 3, e193. [Google Scholar] [CrossRef]
- Knighton, R.C.; Soro, L.K.; Francés-Soriano, L.; Rodríguez-Rodríguez, A.; Pilet, G.; Lenertz, M.; Platas-Iglesias, C.; Hildebrandt, N.; Charbonnière, L.J. Cooperative Luminescence and Cooperative Sensitisation Upconversion of Lanthanide Complexes in Solution. Angew. Chem. Int. Ed. 2022, 61, e202113114. [Google Scholar] [CrossRef]
- Dexter, D.L. Cooperative optical absorption in solids. Phys. Rev. 1962, 126, 1962–1967. [Google Scholar]
- Freeman, A.J.; Watson, R.E. Theoretical Investigation of Some Magnetic and Spectroscopic Properties of Rare-Earth Ions. Phys. Rev. 1962, 127, 2058–2075. [Google Scholar] [CrossRef]
- Judd, B.R. Matrix elements of tensor operators for the electronic configurations fn. Proc. Phys. Soc. 1959, 74, 330–339. [Google Scholar] [CrossRef]
- Racah, G. Theory of complex spectra IY. Phys. Rev. 1949, 76, 1352–1365. [Google Scholar] [CrossRef]
- Nielson, C.W.; Köster, G.F. Spectroscopic Coefficients for pn, dn and fn Configurations; MIT Press: Cambridge, UK, 1963; p. 248. [Google Scholar]
- Montoya, E.; Lorenzo, A.; Bausa, L.E. Optical characterization of LiNbO3: Yb3+ crystals. J. Phys. Condens. Matter 1999, 11, 311–320. [Google Scholar] [CrossRef]
- Demirkhanyan, H.G.; Demirkhanyan, G.G.; Babajanyan, V.G.; Kostanyan, R.B.; Kokanyan, E.P. Spectral line intensities of Yb3+ ion in LiNbO3 crystals. J. Contemp. Phys. 2008, 43, 13–18. [Google Scholar] [CrossRef]
- Kallel, T.; Yahyaoui, M.; Amdouni, S.; Fakhfakh, R.; Aissa, A.B.; Abdallah, I.M.; Hussein, L.F. Optical properties of LiNbO3 crystals doped with Yb3+ ions. Opt. Pura Apl. 2021, 54, 1–11. [Google Scholar] [CrossRef]
- Demirkhanyan, G.; Patrizi, B.; Kostanyan, R.; Li, J.; Pirri, A.; Feng, Y.; Xie, T.; Wu, L.; Vannini, M.; Becucci, M.; et al. Evidence of two Yb3+ crystallographic sites occupancy in Y3Al5O12 ceramics from an in depth spectroscopic analysis. J. Solid State Chem. 2022, 316, 12357. [Google Scholar] [CrossRef]
Disclaimer/Publisher’s Note: The statements, opinions and data contained in all publications are solely those of the individual author(s) and contributor(s) and not of MDPI and/or the editor(s). MDPI and/or the editor(s) disclaim responsibility for any injury to people or property resulting from any ideas, methods, instructions or products referred to in the content. |
© 2025 by the authors. Licensee MDPI, Basel, Switzerland. This article is an open access article distributed under the terms and conditions of the Creative Commons Attribution (CC BY) license (https://creativecommons.org/licenses/by/4.0/).