Abstract
In crab pond environments, obstacles such as long aerobic pipelines, aerators, and ground cages are usually sparsely distributed. Automatic feeding boats can navigate while avoiding obstacles and execute feeding tasks along planned paths, thus improving feeding quality and operational efficiency. In large-scale crab pond farming, a single feeding operation often fails to achieve the complete coverage of the bait casting task due to the limited boat load. Therefore, this study proposes a multi-voyage path planning scheme for feeding boats. Firstly, a complete coverage path planning algorithm is proposed based on an improved genetic algorithm to achieve the complete coverage of the bait casting task. Secondly, to address the issue of an insufficient bait loading capacity in complete coverage operations, which requires the feeding boat to return to the loading wharf several times to replenish bait, a multi-voyage path planning algorithm is proposed. The return point of the feeding operation is predicted by the algorithm. Subsequently, the improved Q-Learning algorithm (I-QLA) is proposed to plan the optimal multi-voyage return paths by increasing the exploration of the diagonal direction, refining the reward mechanism and dynamically adjusting the exploration rate. The simulation results show that compared with the traditional genetic algorithm, the repetition rate, path length, and the number of 90° turns of the complete coverage path planned by the improved genetic algorithm are reduced by 59.62%, 1.27%, and 28%, respectively. Compared with the traditional Q-Learning algorithm, average path length, average number of turns, average training time, and average number of iterations planned by the I-QLA are reduced by 20.84%, 74.19%, 48.27%, and 45.08%, respectively. The crab pond experimental results show that compared with the Q-Learning algorithm, the path length, turning times, and energy consumption of the I-QLA algorithm are reduced by 29.7%, 77.8%, and 39.6%, respectively. This multi-voyage method enables efficient, low-energy, and precise feeding for crab farming.
Keywords:
feeding boat; complete coverage path planning; improved genetic algorithm; I-QLA; multi-voyage operation Key Contribution:
1. To address issues such as a high repetition rate, numerous turns, and omissions in traditional complete coverage path planning, the traditional genetic algorithm is improved in terms of population initialization, fitness function, and genetic operators. 2. Due to the limited bait capacity of feeding boats in large ponds, making it difficult to achieve complete coverage feeding tasks with a single feeding operation, the traditional Q-Learning algorithm is improved from the aspects of direction, reward function, and exploration rate. The proposed multi-voyage path planning method can significantly improve operational efficiency and reduce the energy consumption of feeding boats, thereby providing a scientific feeding solution for crab farming.
1. Introduction
The Chinese mitten crab is highly favored by Chinese consumers due to its delicious taste, and is therefore widely farmed in China []. The task of feeding river crabs is a heavy yet crucial part of the breeding process, with feed costs accounting for more than 70% of the total farming expenditure. Therefore, whether the bait feeding technique is scientific and reasonable is one of the most significant factors affecting the benefits of river crab farming []. Currently, crab farming is predominantly conducted in ponds ranging from 10 to 20 acres, but in places like Xinghua, Sihong, and other regions in China, there are often large ponds of 30 to 80 acres. During the peak growth period of the crabs, about 5–8 kg of feed per acre is required. An unmanned boat carrying a full load of 70 kg of bait cannot meet the feeding requirements of the crabs in large and medium-sized ponds in a single feeding operation. The feeding boat must return to the wharf multiple times to refill the bait and then continue its mission until all feeding operations are completed. Path planning is an important factor in saving energy consumption of autonomous feeding boats. How to carry out complete coverage feeding with optimal routes under the premise of meeting feeding demands, as well as how to determine the return points and related paths during the return voyage are key problems that need to be solved urgently.
At present, the research and development of unmanned agricultural machinery has become a hot trend, and various path planning algorithms are widely applied in various agricultural scenarios [,,,]. With regard to the complete coverage path planning algorithm, Choset et al. [] proposed the cow-farming unit decomposition method, which scans the working area with a straight line, divides the area based on the boundary points of obstacles, and then sequentially covers and traverses each connected sub-area. Dong and Zhang [] proposed a distributed collaborative complete coverage path planning (CCPP) algorithm based on a heuristic method. The algorithm planned the collision-free complete coverage paths in different directions. Kong et al. [] proposed the improved MCD coverage algorithm to realize the task through partition coverage and integrated the jump point search strategy to optimize the RRT algorithm, achieving 100% coverage of the operation area []. Wu et al. [] proposed a complete coverage path planning algorithm based on an A* improved bionic neural network to reduce the repeated coverage rate and energy consumption of the global path. Zhang et al. [] proposed an improved A* algorithm to solve the mowing path problem in orchards. By weighting the heuristic function and introducing the turning cost, the convergence speed of the algorithm was improved. Xu et al. [] proposed a complete coverage neural network algorithm, which effectively avoids deadlock issues by integrating the improved A* algorithm, making it suitable for complex environments.
The aforementioned path planning algorithms display a great pathfinding advantage in complete coverage path planning. However, these algorithms exhibit poor adaptability when performing local path planning in unknown, complex, dynamic environments. In contrast, reinforcement learning algorithms, with their strengths in dynamic planning, local obstacle avoidance, and strong robustness, have been widely applied in the field of unmanned boat path planning. Zhou et al. [] adopted a new Q-table initialization method based on the Q-Learning algorithm and dynamically adjusted the exploration rate based on gradient changes. The stability and adaptability of the algorithm were improved. Bo et al. [] introduced the flower pollination algorithm to improve the Q-Learning algorithm and realized effective navigation and rapid obstacle avoidance in complex environments. In order to address the issues of the low search efficiency and slow convergence speed of robot path planning in an unknown environment, Li et al. [] proposed an adaptive Q-Learning algorithm guided by a virtual target. Fang et al. [] proposed a fusion algorithm that combines an improved ant colony algorithm with an improved Q-Learning algorithm. The pheromone matrix of the improved ant colony algorithm was fused with the Q matrix of the Q-learning algorithm, and the learning rate and exploration rate were dynamically adjusted to complete the efficient search of the global path.
Furthermore, Xing et al. [] proposed an optimization method based on the ant colony algorithm for the coverage search task of multiple UAVs. During the execution of the coverage task, due to the limited energy carried by the UAVs, the artificial potential field method was introduced to plan the return path. Liu et al. [] performed point-to-point autonomous navigation by fuzzy PID control and a path control algorithm in order to solve the charging problem of the feeding boat when the battery was insufficient, and realized dynamic obstacle avoidance of the unmanned boat by laser radar and image recognition technology. Hu [] proposed a complete coverage path planning method for agricultural drones. In view of the limitations of battery life and medication quantity during the spraying operation of drones, the sparrow search algorithm was introduced to plan the return path. Huang et al. [] proposed an autonomous flight operation path planning algorithm, introducing different supply methods and continuation modes for multiple consumables in multi-field scenarios, thereby further optimizing the operational path. By setting supply points, Li et al. [] reasonably allocated the return points and corresponding payloads for each flight of the UAV and effectively reduced the energy consumption by adjusting the flight route and payload.
Currently, most research on multi-voyage path planning primarily focuses on the planning of single return paths and does not address corresponding endurance strategies. In this study, the operating environment for the feeding boat is medium-sized to large ponds. During the process of a complete coverage feeding operation, due to insufficient bait supply, it is necessary to return multiple times to the loading wharf for bait replenishment. Therefore, a solution for multi-voyage return endurance path planning is proposed in this study. The planned non-collision optimal return and endurance paths not only ensure safety but also reduce energy consumption.
The main contributions of this study are as follows:
- (1)
- A complete coverage path planning method based on an improved genetic algorithm is proposed, introducing a continuous grid, complete coverage population initialization method, and redesigning the fitness function and genetic operators to plan a complete coverage path with low path repetition and coverage of all grids.
- (2)
- The I-QLA is proposed to perform the multi-voyage path planning for the feeding boat. The reward function is redesigned, and the exploration rate is dynamically adjusted to balance the relationship between exploration and exploitation, accelerating convergence speed and planning the optimal return path with the shortest distance and fewer turns.
- (3)
- It is proved that the improved genetic algorithm can improve the performance of complete coverage path planning in terms of the path repetition rate, path length and number of turns, and the I-QLA can improve the performance of return path planning in training time, path length, and number of turns.
2. Materials and Methods
2.1. Feeding Boat Design
The crab farming feeding boat is mainly composed of floating bodies, paddle wheels, a navigation module, control module, bait and medication dispensing devices, and underwater cameras. Its working modes include manual and automatic. Remote control instructions are issued through an APP to initiate cruising operations and implement precise feeding. The overall structure is shown in Figure 1. The main technical parameters of the feeding boat are shown in Table 1.
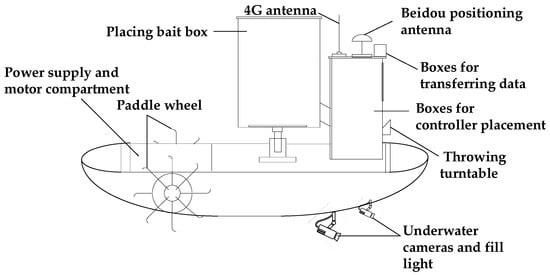
Figure 1.
Structural diagram of the feeding boat for crab farming.

Table 1.
Technical parameters of the feeding boat for crab farming.
A brief description of each component is as follows:
- (1)
- To balance the weight of the hull, the power compartment is placed at the bow, the heavier bin is installed near the middle of the hull, and the control compartment is located at the stern. A double floating structure is adopted, ensuring the stability and reliability of the working boat and facilitating maintenance.
- (2)
- The paddle wheel drive method is used for the feeding boat, because in crab farming ponds where large areas of aquatic plants need to be grown, compared to propeller propulsion, paddle wheel propulsion is less likely to get entangled in aquatic plants, preventing motor blockage and damage to the motor and propeller. Additionally, when the paddle wheel propels the boat forward, it stirs up water splashes, increasing the dissolved oxygen content in the water. The paddle wheel has a radius of 30 cm, and adjusting the speed of the left and right paddle wheel motors can control the speed and heading of the feeding boat.
- (3)
- The weight sensors are equipped at the bottom of the bait box to obtain the remaining bait weight in real time. A control motherboard is loaded in the controller box, which includes major modules such as an STM32 processor, IMU (Inertial Measurement Unit) module, navigation and positioning module, 4G communication module, serial communication module, power management module, and motor drive module.
- (4)
- An LBF-C200TB4 underwater camera is installed at the bottom of the hull to capture images of the underwater environment. The image target recognition technology is employed to integrate the identified mitten crab distribution and positioning data, thereby generating a mitten crab distribution density map. Subsequently, the bait density formula map is obtained, which is a prerequisite for precise crab baiting [].
2.2. Algorithm Selection
This study aims to achieve full-coverage feeding across entire pond environments containing static obstacles such as aerators, long aerobic pipelines, and ground cages. The path planning involved in this study consists of two stages: one is full-coverage path planning, which completes the full-coverage feeding task, and the other is return path planning, which solves the problem of insufficient energy or bait that needs to be replenished. The comparison of commonly used path planning algorithms in these two stages is shown in Table 2.

Table 2.
Path planning algorithms comparison.
For full-coverage path planning, considering the full coverage and low repetition requirements of the research objectives, an improved genetic algorithm was adopted to complete the full-coverage task. Based on the research environment and objectives, the population initialization method was improved on the basis of traditional genetic algorithms, and an improved genetic operator was used to generate a full-coverage feeding path by combining actual working parameters. The specific introduction of the improved genetic algorithm used for full-coverage path planning can be found in Section 3.4.
For return route planning, algorithms such as A* and RRT have disadvantages such as high computational complexity and poor real-time performance, making it difficult to cope with dynamic changes and complex scenarios. Q-Learning and other reinforcement learning algorithms are more suitable for solving problems with dynamic adaptability and real-time updates. The Q-Learning algorithm not only enables path planning in unknown environments but also has a natural advantage in path planning by perceiving environmental information through pre-training in known environments and quickly planning collision-free optimal paths. Therefore, based on the environmental characteristics of this study, the Q-Learning algorithm was chosen for improvement to complete the multi-voyage path planning task. Three key enhancements were implemented to optimize path planning for round-trip endurance missions: (1) extending the exploration mechanism from four to eight directions; (2) designing a refined reward structure to guide policy convergence; and (3) developing a dynamically adjustable exploration rate to balance exploitation–exploration trade-offs. The specific introduction of the multi-voyage path planning algorithm based on the improved Q-Learning algorithm can be found in Section 3.5.
2.3. Overall System Architecture
In addressing the challenge of complete coverage operations in large-scale crab farming ponds, the limited bait carrying capacity of the operation boats necessitates multiple return trips for replenishment and endurance operations. This study adopts an improved genetic algorithm as the basic framework for the complete coverage path planning of the feeding boats, aiming to find the shortest and collision-free complete coverage path from the starting point to the destination. A continuous grid complete coverage path initialization method is proposed for population initialization, which subjects the fitness function to the dual constraints of path length and number of turns. Additionally, the crossover and mutation genetic operators are optimized. An elite retention strategy is implemented to plan the complete coverage operation paths for the feeding boats.
Due to the limited bait carrying capacity of the feeding boat, a single operation alone cannot complete the entire feeding task for the pond. Therefore, this study predicts return points according to the planned operation path, the total amount of loaded bait, and the expected bait consumption for each grid area of the pond. The I-QLA algorithm is proposed to plan the optimal path from the return point to the wharf. The feeding boat is mapped to an agent. In conditions where the environment is unknown, the agent continuously exchanges state–action information with the environment. Through trial and error, repeated exploration, and learning, the agent solves for the optimal strategy, effectively planning a short and less turning path. Among them, the precise feeding during the operation of the feeding boat is based on the distribution of river crab density in the pond, setting the feeding density of different pond area grids, and then automatically adjusting the feeding amplitude and flow rate on the operation path according to the set value in order to achieve the precise feeding effect of on-demand distribution of bait according to the distribution density of river crabs. The overall system architecture of path planning in this study is shown in Figure 2.
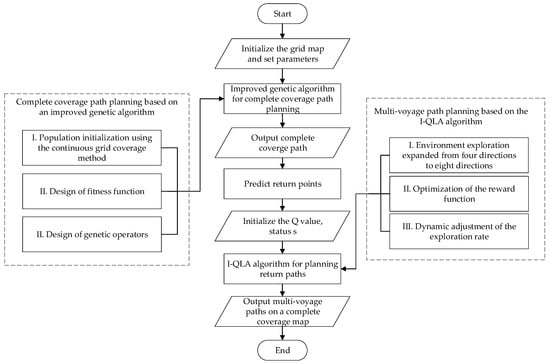
Figure 2.
System architecture diagram.
3. Multi-Voyage Operation Path Planning for Feeding Boats
3.1. Environment Modeling
Environment modeling is a crucial step in path planning, helping the algorithm find optimal path that meets multiple constraints. In conventional crab farming ponds, there are often obstacles such as long aerobic pipelines, aerators, fences, and ground cages. Therefore, when modeling the environmental map, comprehensively considering environmental information and whether the working boat can use the map to complete the feeding operation task is necessary. Figure 3 shows a classic crab farming pond located in Xinghua City, Jiangsu Province, China. The pond is approximately 280 m long and 140 m wide, and the image was collected using the DJI Elf 4 drone from the DJI brand in Shenzhen, China. This pond serves as the basis for the actual experimental environment and environmental model studied in this study.
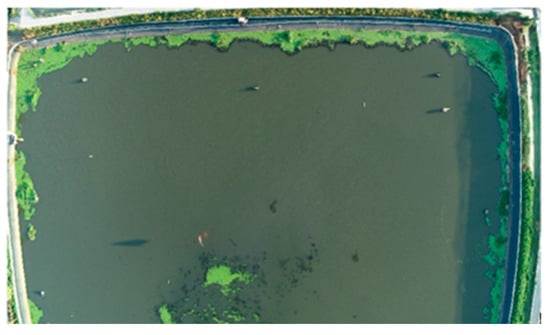
Figure 3.
A classic crab farming pond.
Common methods for environmental map modeling include the visibility graph method [], topological mapping method [], and grid mapping method []. For the crab farming pond environment studied in this study, since the working boat uses satellite navigation and positioning, it requires more accurate location and environmental information. The grid mapping method can adjust the grid size based on the size of the working boat, the range of operation, and the safe operating distance. Moreover, this study employs an improved genetic algorithm for complete coverage path planning, and the use of a grid can facilitate chromosome coding []. Therefore, the grid mapping method is adopted to model the geographical environment of the pond.
In the grid map, the areas where the feeding boat can reach and operate are set as white with a value of 0, and the grids occupied by obstacles are set as black with a value of 1 []. The numbered grid map can be conveniently represented as a matrix in computer programming. When the grid operation state changes, it is only necessary to update the corresponding value of the feasible grid in the matrix to reflect the change.
The feeding boat primarily performs the feeding operations on the surface of the pond, and it can be considered that the operation in this area is completed when the feeding boat travels through the grid. The overall size of the grid map is determined by the vertices of the pond boundary, and the entire grid map consists of N × M unit grids [], where N and M can be obtained using Equation (1):
where is the horizontal coordinate of the cell, is the vertical coordinate of the cell, is the distance between the travels of the feeding boat, and is used to round up.
Based on the sparse distribution characteristics of obstacles such as elongated aerobic pipelines and ground cages in actual crab ponds, a model of the experimental pond is constructed on the basis of the actual experimental pond. Because the grid edge length is 7 m, the constructed grid map consists of 40 by 20 unit grids, as shown in Figure 4, where the green line segment represents the boundary of the pond, and the green grid represents obstacles.

Figure 4.
Rasterized map process. (a) Grid map of the pond; (b) grid map with obstacles and irregular boundaries. The green grid represents obstacles.
Unlike ground agricultural machinery operations, working boats in pond environments cannot touch or cross boundaries. Therefore, the grid-based representation of irregular pond boundaries can significantly affect the coverage of the planned path. As shown in Figure 4a, each vertex of the pond is connected to form the pond boundary, and the grids outside the connecting lines are considered obstacle areas. However, if the grids on the connecting lines are directly set as obstacle areas, the operation omission rate will greatly increase during actual feeding, failing to achieve precise feeding. Therefore, the grid center point discrimination method is used in this study to determine whether the grids on the boundary lines are obstacle areas. The gridded map is shown in Figure 4b, where the white area represents the water area that the feeding boat needs to cover during operations, and the green area represents the pond boundary and the obstacle areas.
3.2. Energy Consumption Model of Feeding Boats
Based on the data and nonlinear fitting results of the cruise energy consumption test of the feeding boat at a 0° turning angle, 90° turning angle, and 180° turning angle, the optimal model formula is determined by comparison, and the energy consumption model is obtained.
- (1)
- A 0° turning angle
The energy consumption model at a 0° angle is represented by Equation (2). The coefficient of determination of this model is 0.999, indicating high accuracy.
- (2)
- A 90° turning angle
The energy consumption model at a 90° angle is represented by Equation (3). The coefficient of determination of this model is 0.988, which meets the usage requirements.
- (3)
- A 180° turning angle
The energy consumption model at a 180° angle is represented by Equation (4). The coefficient of determination of this model is 0.998, which can well represent the energy consumption at a 180° angle.
3.3. Evaluation Indicators
The several important indicators for measuring the complete coverage path planning operation of feeding boats are as follows:
- (1)
- Coverage repetition rate
The coverage repetition rate refers to the percentage of the area that the working boat travels repeatedly during the complete coverage cruising and baiting operation compared to the total area of the operation region. It is inevitable that the feeding boat will pass through some areas repeatedly when it performs the feeding operation. The coverage repetition rate is calculated in the grid-based model, as shown in Equation (5).
where is the coverage repetition rate, represents the total number of driving grids, represents the total number of obstacle grids, and indicates the total number of grid maps.
- (2)
- Path length
Path length is not only an important optimization objective in path planning algorithms but also a direct quantitative indicator for evaluating the quality of a path. Path length directly reflects the distance that the feeding boat needs to travel from the return point to the wharf. A shorter path typically implies higher efficiency and less energy consumption.
- (3)
- Number of turns
The number of turns is a significant evaluation metric for assessing the complexity and feasibility of a path. During the cruising process of the feeding boat, reducing the number of turns can simplify control strategies, lower execution complexity, and thereby enhance system stability and reliability. From the perspective of resource consumption, frequent turning increases energy consumption and may lead to higher wear and maintenance costs.
- (4)
- Energy consumption
Energy consumption is another important indicator for measuring the performance of full-coverage operation paths. Combined with the energy consumption model of the feeding boat in Section 3.2, the functional relationship of energy consumption is shown below.
The energy consumption of straight-line driving is
where is the speed of the boat, is the total weight of the boat, and is determined by Equation (2).
The energy consumption of turning driving is
where the turning energy consumption and are determined by Equation (3) and Equation (4), respectively.
3.4. Complete Coverage Path Planning Based on Improved Genetic Algorithm
3.4.1. Complete Coverage Traversal Method
The current main methods for complete coverage path planning in ponds with obstacles include random [], back-and-forth [], and spiral approaches []. Different methods have varying requirements for the operation of the boat and the characteristics of the working area. In view of the characteristics of crab farming ponds where the main obstacles are elongated aeration pipes, this study performs complete coverage path planning for the feeding boat in the pond by combining the back-and-forth method with an improved genetic algorithm.
3.4.2. Improvement Directions for the Genetic Algorithm
To address the issue of complete coverage path planning in crab farming ponds using traditional genetic algorithms, three improvements are proposed: a continuous grid complete coverage path initialization method is proposed for population initialization; the fitness function is constrained by both the path length and number of turns; and the design of crossover and mutation genetic operators is conducted.
- (1)
- Improved population initialization
Before using genetic algorithms for path planning, encoding the grid map is necessary []. In this study, a combination of two-dimensional and one-dimensional coordinates is used for map encoding, as shown in Figure 5, where the white area represents the passable area and the green area represents the obstacle area. The one-dimensional coordinates on the grid can be obtained from two-dimensional coordinates by Equation (8). The utilization of one-dimensional coordinates can reduce the encoding length, making it easier for computer programming and computation.
where represents the complementary operation, means rounding down, and is derived from Equation (1).
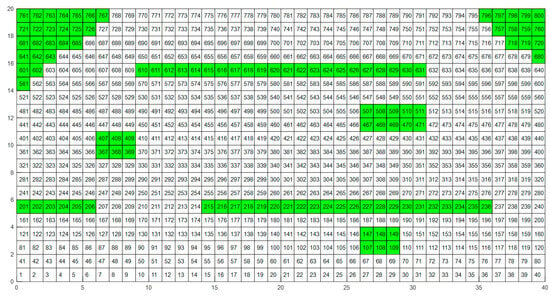
Figure 5.
Grid map coding. The white area represents the passable area and the green area represents the obstacle area.
In this study, the chromosomes of the genetic algorithm are encoded using a one-dimensional decimal sequence. Each gene of a chromosome corresponds to a grid number in the grid map, and the sequence of grid numbers corresponding to the chromosome represents the complete coverage path of the working boat. In this study, a continuous grid complete coverage path initialization method is proposed to initialize the population. Firstly, to initialize the population, a random search is required to determine the chromosomes, covering the grids in one direction. When encountering a boundary or obstacle, another direction is randomly chosen for coverage, eventually forming a set of chromosomes. Secondly, during the random search, ensuring the continuity of the path is necessary. This can be achieved by preprocessing the feasible grids. By determining whether the neighboring grids are feasible, the connected grids of each feasible grid are recorded. Random searches for the next traversal grid are conducted among the connected grids, thereby ensuring the continuity of the path.
The above optimizations for population initialization can reduce ineffective chromosomes during initialization, thereby improving the convergence speed and computational efficiency of the algorithm. The sizes of the population can be defined according to the specific requirements of the application, and this study sets the initial population size to 20.
- (2)
- Design of the fitness function
During the optimization process of genetic algorithms, an evaluation the quality of the solutions and selection of the better ones for preservation are necessary. The fitness function serves as this evaluation metric and is an essential basis for the genetic operations and updates within the algorithm. It influences the convergence effect and speed of the algorithm. The selection operation generally selects the best individual as the parent of the next generation according to the fitness function.
In path planning, genetic algorithms commonly use path length as a constraint for the fitness function. However, considering that the feeding boat in this study performs feeding operations in a pond, even if the path lengths are the same, energy consumption may vary due to factors such as turning. Therefore, this study improves the fitness function to make it subject to the dual constraints of path length and number of turns, as shown in Equation (9).
where is the total path length, is the total number of 90° turns, is the total number of 180° turns, is the weight coefficient for path length, is the weight coefficient for the 90° turning angle, is the weight coefficient for the 180° turning angle, and .
According to the energy consumption model Equations (2)–(4) constructed in Section 3.2, the proportional coefficients are , and . Assuming that the total weight of the boat is 170 kg and the cruising speed is 1.0 m/s, through the energy consumption model, it can be obtained that path length coefficient = 0.17, 90° turning coefficient = 0.33, and 180° turning coefficient = 0.5.
- (3)
- Design of the genetic operator
Designing appropriate genetic operators can ensure population diversity, eliminate less adapted individuals, and retain those with high fitness, ultimately achieving the search for the optimal solution.
- (a)
- Crossover operator
This study employs an improved two-point crossover method. The crossover probability for individuals involved in the crossover changes adaptively. When the fitness of a chromosome is less than the average fitness of the population, its crossover probability is increased to enhance the possibility of mixing and variation with other chromosomes. Conversely, when the fitness of a chromosome is greater than the average fitness of the population, its crossover probability is set to a smaller value to preserve its excellent genes. The specific formula for calculating the individual crossover probability is shown in Equation (10):
where is the initial crossover rate, is the fitness value of the individual, is the average fitness of the population, and is the maximum fitness of the population.
The chromosomes involved in the crossover are paired and a random interval (a, b) is generated between each pair of chromosomes, where a is greater than 0 and b is less than the number of genes in the chromosome. The genes in the interval are crossed, and the value of this interval can fix the start and end points of the genes to avoid gene deletion. After the crossover operation is completed, the chromosomes with cross changes are checked. For grids that do not meet the path continuity, find a connected path in the preprocessed connectivity data of the grids and insert it into the grid chromosome.
- (b)
- Mutation operator
Mutation operation is another method to increase population diversity with a good local optimization ability, which can expand the search space of the algorithm and avoid the algorithm falling into prematurity []. In this study, we design an adaptive mutation probability that can change according to the fitness value of the population. When the fitness of a chromosome is greater than the average fitness of the population, its mutation probability is set to a smaller value to reduce the probability of excellent individuals being destroyed by mutation operations. When the fitness is less than the average fitness of the population, the mutation probability is increased to enhance the population diversity. The calculation formula of the improved mutation probability is shown in Equation (11):
where is the initial crossover rate.
After selecting the chromosomes to be modified according to the above probability, the mutation interval (a, b) is generated for each chromosome as the location of the mutation operation. Then, a new path within the interval is generated using random search, ensuring path continuity and complete coverage. Finally, the new path is inserted into the interval (a, b).
In this study, the termination condition is determined by the number of iterations. Specifically, a maximum number of iterations is predefined. When this limit is reached, the genetic algorithm terminates and outputs the optimal complete coverage path with the highest fitness value. The flowchart of the improved genetic algorithm for complete coverage path planning using grid encoding is shown in Figure 6, where G represents the actual number of iterations.
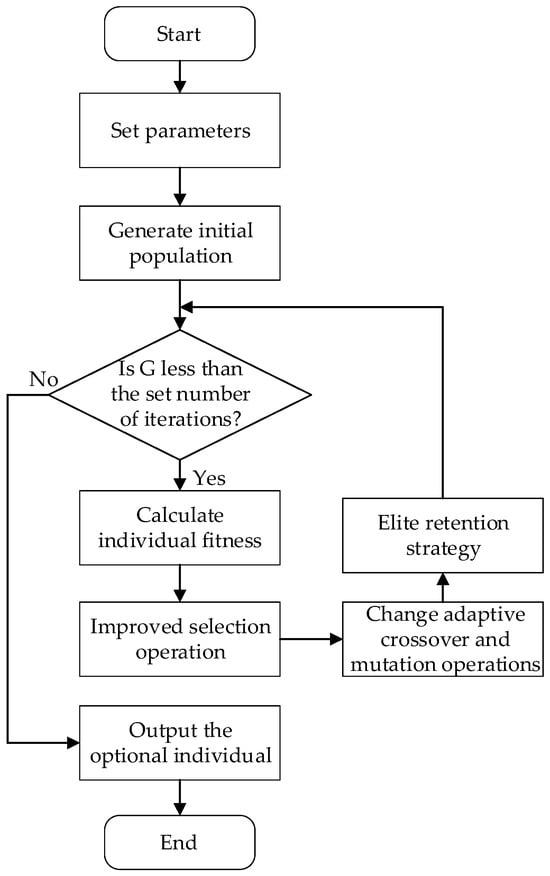
Figure 6.
Flow chart of the improved genetic algorithm for complete coverage path planning.
The specific steps of the improved genetic algorithm are as follows.
Step 1. Set the population number, iteration times, and initial crossover mutation probability.
Step 2. Randomly generate the initial population.
Step 3. Calculate the fitness value of each individual in the population.
Step 4. Perform the improved crossover and mutation operations.
Step 5. Implement the elitist preservation strategy.
Step 6. Iterate Steps 3 to 5 until the termination condition is satisfied, and then output the results.
3.5. Multi-Voyage Path Planning Based on I-QLA
3.5.1. Return Point Prediction
- (1)
- Prediction of the return point after bait depletion
Predicting the return point while the feeding boat is cruising along a predetermined route is fundamental to multi-voyage operation planning. After employing an improved genetic algorithm to plan the complete coverage operation paths for the feeding boat, the boat will follow these paths for feeding operations. Due to the limited load capacity of feeding boats, multi-voyage operations are required to complete the feeding task for the entire pond. Unlike drone replenishment points, the replenishment points for the feeding boat are fixed and unchanging.
As shown in Figure 7, each area of the breeding pond is subdivided into numerous grids, and each grid is fed using the variable feeding device according to a given value. The system records the weight of the bait at the start of the cruise and subsequently accumulates the bait weight consumed by each grid until the initial weight of the bait is depleted. The location where the bait is exhausted is the required return point, as indicated by the red dot E in Figure 7.
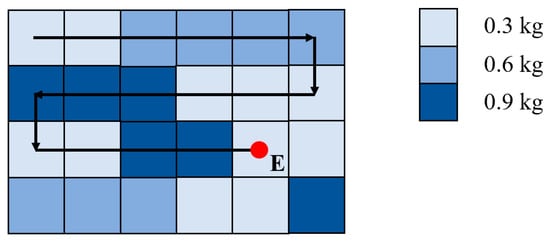
Figure 7.
Return point prediction.
Therefore, when the feeding boat is conducting a cruising and feeding operation, the remaining bait after the operation to the step is shown in Equation (12):
where represents the total weight of loaded bait, is the bait consumption per unit grid operation, and is the weight of remaining bait.
If is set to 0, the number of operation steps m when the bait is exhausted can be calculated from the above formula.
- (2)
- Prediction of the return point after energy depletion
According to the cruise energy consumption model established in the previous text, the energy consumption of step is
where is the turning angle, and when , it indicates that the boat is traveling at a constant speed in a straight line. When is 90 ° and 180 °, it represents the angle at which the feeding boat turns, and represents the speed at which the boat turns. Assuming that the weight of bait in a grid area remains constant, is the total weight of bait and the hull after the completion of the previous area’s operation. The energy consumption of the feeding boat from step 1 to step k on a route can be accumulated as follows:
If the energy at the beginning of the cruise of the feeding boat is , then after steps of operation, the remaining energy can be expressed as follows:
To ensure a smooth return of the boat, ensuring that the remaining energy is greater than the energy required for the return and leaving a certain margin are necessary. The feeding boat must return to dock for recharging when its remaining battery falls below 10% of . From Equation (15), the maximum number of operational steps required to ensure that the feeding boat has sufficient power to return can be calculated. By comparing this number of steps with the number of steps required to exhaust the bait, the smaller number of steps can be taken as the return point, which can meet the dual limitations of bait and energy.
3.5.2. Q-Learning Algorithm
The Q-Learning algorithm is one of the reinforcement learning algorithms, formulated as a Markov decision process. It can solve for optimal policies under unknown environmental conditions by continuously trying, exploring, and learning. Compared with A*, RRT, and other algorithms, the Q-Learning algorithm can not only realize the path planning of an unknown environment but also achieve effective perception of known environments through pre-training, and quickly plan the optimal path without collision, which has a natural advantage in path planning [].
The Q-Learning algorithm comprises five fundamental elements: the agent, environment, state, action, and reward. Its learning framework is shown in Figure 8. The agent is capable of self-learning through the continuous exchange of state and action information with the environment. The algorithm is based on the idea of dynamic programming, guiding the agent to select the optimal action in each state by continually updating the Q-value []. The formula for updating the Q-value is given by Equation (16):
where is the discount rate, is the learning rate, is the state of the agent at time , is the action selected by the agent in the state , is the reward for taking action at state , is the next action after executing the action , and is the maximum potential future reward obtained when the agent reaches state after taking action .
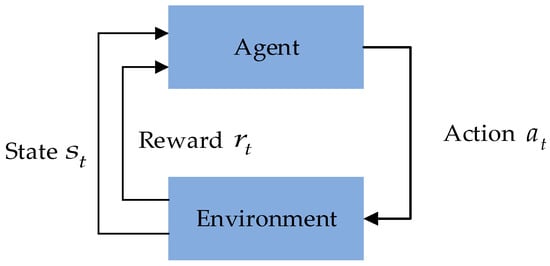
Figure 8.
Q-Learning algorithm learning framework.
In the traditional Q-Learning algorithm, the -greedy strategy is adopted when selecting an action. A value of the greedy factor being closer to 1 indicates that the agent is more inclined to explore the environment by randomly selecting actions. As approaches 0, the agent is more likely to choose the action with the highest Q-value. The operation process of the traditional Q-Learning algorithm is as follows:
- (1)
- Initialize the Q-table.
- (2)
- At each time step t, the agent observes the current state and selects an action to execute according to an -greedy strategy.
- (3)
- After executing the action , the agent reaches the next state and receives the reward .
- (4)
- The Q value is updated in the Q-table according to Equation (16).
- (5)
- Repeat Steps (2)–(4) until the maximum number of iterations is reached or the Q value converges.
3.5.3. Q-Learning Algorithm Improvement
This study proposes several improvements to the Q-Learning algorithm for planning the return path of a feeding boat, mapping the agent to the feeding boat. Firstly, the traditional four-direction exploration is extended to eight-direction exploration, increasing the number of available step sizes. Secondly, in order to balance the relationship between exploration and utilization, a dynamic adjustment function is introduced with the iteration count as the independent variable, dynamically adjusting the exploration rate to favor exploration in the early stages and utilization in the later stages. Finally, by incorporating multiple penalties in the redesigned reward function, the convergence speed of the algorithm is accelerated.
- (1)
- Add diagonal direction exploration
In general, the movement directions of the agent are limited to four directions: up, down, left and right. To better align with actual map environments and reduce path length, the original four directions are expanded to eight directions by adding the four diagonal directions, upper left, upper right, lower left, and lower right, as shown in Figure 9. The path length for moving one grid in a straight direction is set to 1, while moving one grid diagonally results in a path length of 1.414. Given that ponds often have complex terrains and numerous obstacles, changing the algorithm to eight directions can provide more movement options and greater flexibility, enabling the feeding boat to effectively explore paths in the environment, find better routes to avoid obstacles, and reach the target point.
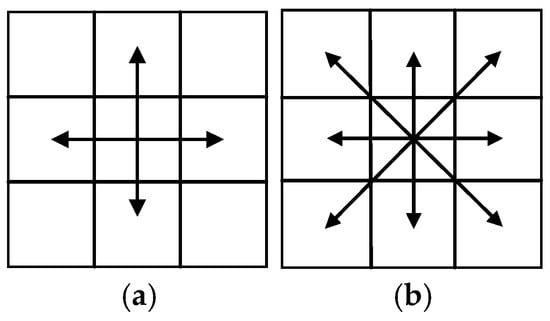
Figure 9.
Direction exploration diagram. (a) Four direction diagram; (b) eight direction diagram.
- (2)
- Refine the reward function mechanism
The design of reward function plays a guiding role for the feeding boat. The traditional reward mechanism only includes rewards for going straight, encountering obstacles, and reaching the target point. In this study, a refined reward mechanism is adopted. During the movement of the feeding boat, a corresponding reward value is set for each step, which helps to minimize the influence of misleading rewards. More detailed feedback information is provided to guide the feeding boat to learn so that it can converge to the optimal strategy more quickly. The improved reward mechanism includes the following aspects:
- (a)
- Set a reward of 10 for reaching the target point, because the goal is to reach the target position, which has the highest priority and is therefore significantly higher than other rewards. Based on previous research, the maximum target reward range for standard Q-Learning algorithms is usually 5–15, and so we set this value to 10 to effectively balance convergence speed and stability.
- (b)
- Set a penalty of −8 for encountering obstacles, based on the principle of safety priority, with strong punishment to prevent collisions, set as the punishment with the highest absolute value. Through practical testing, it has been found that the maximum reward punishment ratio (maximum reward absolute value/maximum punishment absolute value) is most suitable between 1.2 and 1.5, which can avoid the bias of reward dominance or punishment dominance. The maximum reward punishment ratio for this study is 1.25, which meets the requirements.
- (c)
- Set a reward of 3 for straight walking and a penalty of −4 for turning. Considering that the energy consumption of turning movement increases during actual operation, a penalty of −4 is imposed for turning and a reward of 3 for straight movement, with a difference of 7 between them. This encourages straight-line movement, reduces unnecessary turns, and does not excessively inhibit exploration, effectively promoting smooth paths and reducing energy consumption.
- (d)
- Give a penalty of −1 for hitting the map boundaries and standing still. During the actual training process, the feeding boat will collide with the map boundary. Therefore, in order to accelerate the convergence speed and reduce such a collision, the mild penalty −1 is given when colliding with the boundary.
- (e)
- Give a penalty of −3.5 for encountering an obstacle while moving diagonally. As shown in Figure 10, the black area represents obstacles, and the arrow indicates the direction of the boat’s movement. Due to the limitation of the operating width of the feeding boat, it is easy to collide with an obstacle in diagonal movement. Due to the fact that encountering an obstacle while moving diagonally is between vertical collision and turning and has a certain degree of repairability, a penalty of −3.5 is imposed to discourage this situation.
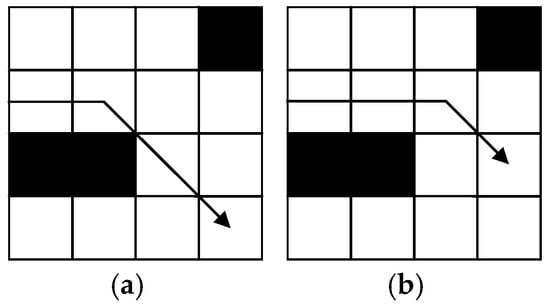 Figure 10. Diagram of obstacles encountered when moving diagonally. (a) Before improvement; (b) after improvement.
Therefore, the modified reward function R is shown in Equation (17):
- (3)
- Dynamic adjustment of the exploration rate
The traditional Q-Learning algorithm adopts an -greedy strategy, where (0, 1) represents the exploration factor. If the value of is too large, the feeding boat will continuously explore the environment, leading to slow convergence. Conversely, if the value of is too small, the feeding boat may rely too much on existing knowledge to choose the action with the highest Q-value, potentially falling into a local optimum due to insufficient learning about the unknown environment. Therefore, achieving a good balance between exploring unknown environments and utilizing known information, and allowing to change dynamically as the training progresses will help the feeding boat efficiently achieve optimal path planning in unknown environments.
To balance the exploration and utilization, this study proposes a dynamic adjustment function , as shown in Equation (18):
where is the number of iterations.
The value of dynamic adjustment factor gradually decreases as the number of iterations increases. When the algorithm iterates more than 2500 times, the value of remains constant at 0.1. The modified dynamic adjustment function allows the algorithm to fully explore the environment in the early stages. As the number of iterations increases, the exploration rate gradually decreases, and the feeding boat becomes more inclined to utilize the known environmental information. This approach accelerates the convergence speed of the algorithm while avoiding falling into local optima.
With the above three optimizations, the I-QLA algorithm can be implemented, and the specific process is described in Algorithm 1.
| Algorithm 1 I-QLA |
|
1 Initiate Q-table to zero
2 While n < episode 3 Select a starting point ; 4 While goal is not reached 5 Choose an action from based on obtained from the dynamic adjustment function in Equation (18); 6 Take action and observe reward and state ; 7 Update Q-table according to Equation (16); 8 Move the state to the next state ; 9 end 10 end |
4. Simulation and System Test
4.1. Simulation Step
To verify the feasibility of the proposed algorithm, the complete coverage path planning of the rasterized map is carried out first. The path generated by the improved genetic algorithm is compared with the traditional genetic algorithm to comprehensively evaluate the advantages in solving the problem of complete coverage path planning. Secondly, for the complete coverage path planned by the improved genetic algorithm, multiple return points are predicted. Finally, the I-QLA is adopted to plan multi-voyage paths. To evaluate the feasibility and generalization ability of the algorithm, ablation experiments are first performed to evaluate the contribution of each improvement to the overall performance. In addition, four groups of grid environments are generated to verify the performance of the I-QLA algorithm, with obstacle grids in each group accounting for 10%, 15%, 20%, and 25% of the total grid cells.
4.2. Simulation and Result Analysis
4.2.1. Complete Coverage Path Planning Simulation
This section evaluates the complete coverage path planning using the traditional genetic algorithm and the improved genetic algorithm, with the grid map modeled in the previous environment. The specific algorithm simulation parameters are as follows: the population size for the genetic algorithm is 20, the number of iterations is 200, the initial crossover probability , and the initial mutation probability .
The simulation results of the traditional genetic algorithm and the improved genetic algorithm are shown in Figure 11, where the green area represents the obstacle area, the red line represents the planned path, and the yellow area represents the repetition range. The simulation comparison data are shown in Table 3 From the simulation comparison results, it can be seen that the total path length of the traditional genetic algorithm is 704 grids, with 15 repeated grids, a path repetition rate of 2.13%, 125 turns at 90 degrees, and 6 turns at 180 degrees. Compared to the traditional genetic algorithm, the path repetition rate, the total path length, the number of 90° turns, and the number of 180° turns planned by the improved genetic algorithm are reduced by 59.62%, 1.27%, 28%, and 50%, respectively. Therefore, the improved genetic algorithm has a lower path repetition coverage rate, reducing unnecessary repeated exploration, and significantly reduces energy consumption.

Figure 11.
Simulation results of the traditional and improved genetic algorithms performed in irregular areas with obstacles. (a) Traditional genetic algorithm; (b) improved genetic algorithm.

Table 3.
Comparison of single simulation results for complete coverage path planning.
Figure 12 illustrates the fitness function curves of the traditional genetic algorithm and the improved genetic algorithm. The results show that the traditional genetic algorithm reaches its optimal fitness value at the 138th generation, while the improved genetic algorithm achieves its optimal fitness value at the 107th generation. Therefore, it can be concluded that the improved genetic algorithm exhibits a superior convergence speed and a higher fitness value than the traditional genetic algorithm.
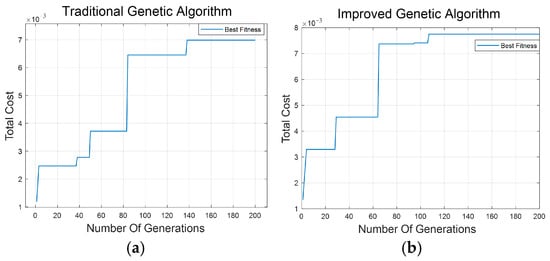
Figure 12.
Population evolution curves for the traditional and improved genetic algorithms. (a) Traditional genetic algorithm; (b) improved genetic algorithm.
Due to the randomness involved in the initial population generation and various operators of the genetic algorithm, this study conducts 20 simulation tests and takes the average values as the final experimental result. The performance comparison between the traditional genetic algorithm and the improved genetic algorithm is shown in Table 4. It can be seen that the optimal path average coverage rate obtained by the improved genetic algorithm is significantly better than that of the traditional genetic algorithm. The average fitness is increased to value , and the optimal average fitness value exhibits a 24.1% reduction. The improvement of the fitness function for optimizing turning angles is led to a reduction of 26.07% in the number of 90° turns and a reduction of 49.25% in the number of 180° turns. In actual operation, this can significantly save operation time and energy consumption.

Table 4.
Comparison of multiple simulation results for complete coverage path planning.
4.2.2. I-LQA for the Return Path Planning Simulation
The initial energy of the feeding boat is 100%, and the initial bait of the feeding boat is 70 kg. According to the equations presented in Section 3.5.1, we can calculate multiple return points, as shown in Figure 13. The red point (0, 0) represents the loading wharf, and the remaining blue points 1–5 are the return points. In this section, return points 3 and 4 are selected for multi-voyage simulation experiments. The Q-Learning algorithm parameters are shown in Table 5.
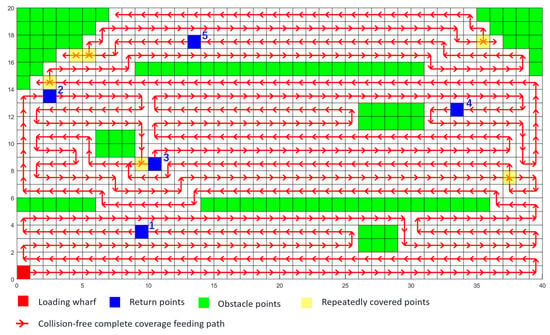
Figure 13.
Diagram of predicted return points.

Table 5.
Q-Learning algorithm parameters.
- (1)
- Ablation experiment
In this section, the Q-Learning algorithm is divided into two stages. First, training is conducted on a pre-set grid map. Second, using the trained Q-table, a path from the return point to the loading wharf is generated within this grid map. In this section, ablation experiments are conducted to compare the performance of the proposed I-QLA algorithm with five other Q-Learning-based algorithms, and all algorithms were trained for 3000 episodes.
QL denotes the traditional Q-Learning algorithm; TQL indicates the algorithm modified for eight-direction exploration; TRQL refers to the algorithm modified for eight-direction exploration and the improved reward function; TEQL signifies the algorithm modified for eight-direction exploration and an improved exploration rate; TREQL stands for the algorithm modified for eight-direction exploration, reward function, and exploration rate; and I-QLA represents the algorithm improved for eight-direction exploration, reward function, exploration rate, and avoiding collisions with obstacles during diagonal movements. The simulation results of path planning for various algorithms are shown in Figure 14, and the performance comparison is shown in Table 6.
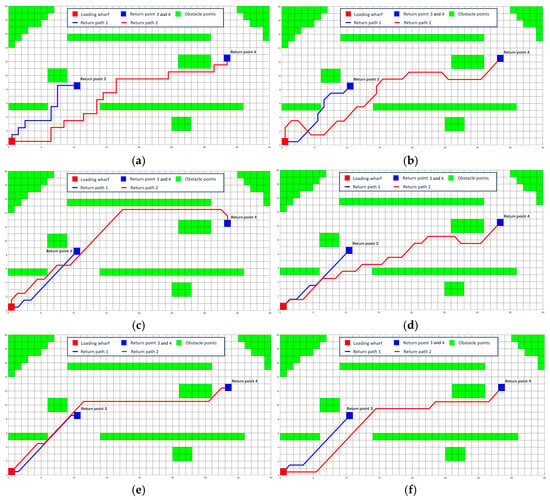
Figure 14.
Simulation diagram of six kinds of algorithms for return path planning. (a) QL; (b) TQL; (c) TRQL; (d) TEQL; (e) TREQL; (f) I-QLA.

Table 6.
Comparison of path planning simulation results.
As shown in Figure 14 and Table 6, the I-QLA algorithm is significantly optimized in terms of path length, number of turns, training time, and optimal number of iterations compared to the other five algorithms. Moreover, the diagonal movement of I-QLA does not collide with obstacles. Compared to the traditional Q-Learning algorithm, the average path length, average number of turns, average training time and average number of iterations of the I-QLA are reduced by 20.84%, 74.19%, 48.27%, and 45.08%, respectively.
- (2)
- Simulation of complex terrain path planning
To verify the effectiveness of the I-QLA algorithm, simulations are conducted on more complex maps containing obstacles. The experimental parameters are the same as those used previously. The path planning simulation results for maps with different proportions of obstacles are shown in Figure 15, and the performance comparison is shown in Table 7.
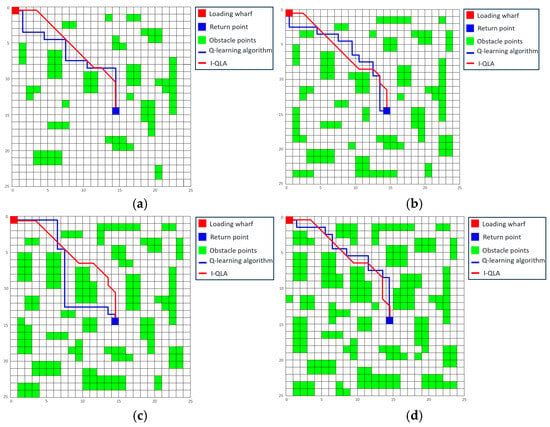
Figure 15.
Simulation diagram of four kinds of algorithms for return path planning: (a) 10% obstacles, (b) 15% obstacles, (c) 20% obstacles, and (d) 25% obstacles.

Table 7.
Comparison of path planning simulation results with different obstacle maps.
4.3. System Test
To further verify the applicability of the proposed algorithm in the actual environments, the crab pond environment path planning experiment is performed. The automatic feeding boat used in the experiment was developed by our research group, as shown in Figure 16a. The experimental location is a crab breeding pond in Xinghua City, Jiangsu Province, China, as shown in Figure 16b.

Figure 16.
Real map of feeding boats and crab ponds. (a) Automatic feeding boat; (b) real crab pond environment.
The map data of the crab breeding pond is obtained by the drone and transmitted to the DJI mapping platform, which can generate a pond environment map with longitude and latitude coordinates. Through coordinate transformation technology, the latitude and longitude coordinates are converted into plane coordinates to construct a two-dimensional pond environment map. In the Python 3.10 platform (PSF, Holland), the two-dimensional map information is imported, and the I-QLA algorithm is run to plan the return path for the feeding boat. After the path planning is completed, the relevant data is uploaded to the cloud server and sent to the boat controller through the 4G module. The Huada Beidou TAU1308 navigation module and MPU9255 geomagnetic sensor module (InvenSense, Sunnyvale, California, USA) are adopted to obtain real-time information, and the boat is controlled to perform the return operation through the path tracking algorithm.
The path planning ability of Q-Learning algorithm and I-QLA algorithm in a real environment was verified, and Figure 17 shows the experimental results for the return path planned by the traditional Q-Learning algorithm and I-QLA algorithm, the path planning experimental results are shown in Table 8.
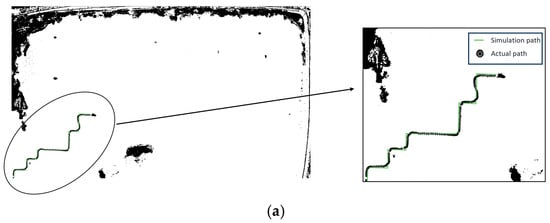
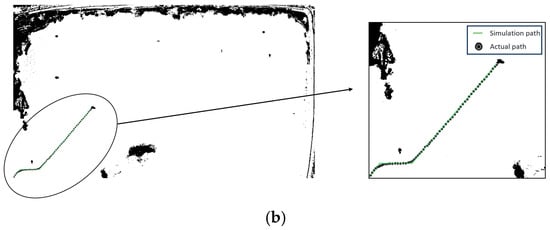
Figure 17.
The experimental results of the traditional Q-Learning algorithm and I-QLA algorithm. (a) The return path of the traditional Q-Learning algorithm; (b) the return path of the I-QLA algorithm.

Table 8.
The path planning experimental results in an actual crab pond environment.
The experimental results show that compared with the Q-Learning algorithm, the I-QLA algorithm reduces the planned path length, number of turns, and energy consumption by 29.7%, 77.8%, and 39.6%, respectively. Energy consumption is measured by the consumed battery electricity. This indicates that the I-QLA algorithm can plan shorter and less turning multi-voyage return paths, and reduce the energy consumption of the feeding boat in practical situations.
5. Conclusions
In this study, we propose the I-QLA algorithm for multi-voyage path planning to address the path planning issue of large-scale aquaculture ponds where the boat needs to return to the wharf multiple times to replenish bait and continue operations due to insufficient onboard bait. Compared to other path planning algorithms, the proposed method is superior in the following aspects:
- (1)
- An improved genetic algorithm is employed to plan a complete coverage operation path. Compared to the traditional algorithm, the repeated coverage and path length of the complete coverage path planned by the improved genetic algorithm are reduced.
- (2)
- To address the issue of multiple returns for replenishment during operations due to insufficient feed, we propose a multi-voyage path planning method. By introducing a new reward function and dynamic exploration rate to improve the Q-Learning algorithm (I-QLA), the problems of slow convergence speed and the difficulty of balancing exploration and exploitation in traditional algorithms are solved. Furthermore, the multiple optimal return paths are planned by the I-QLA algorithm. After each return trip and refilling, the feeding boat resumes its original path to the return point and continues working until the pond is fully covered.
- (3)
- Compared to the traditional Q-Learning algorithm, the simulation results show that the I-QLA algorithm reduces the path length, the number of turns, and the training time by 20.84%, 74.19%, and 48.27%, respectively. The system test shows that the I-QLA algorithm reduces the path length, the number of turns, and energy consumption by 29.7%, 77.8%, and 39.6%, respectively. The I-QLA algorithm ensures shorter path planning while reducing the training time and improving operational efficiency.
In conclusion, the multi-voyage path planning method can effectively solve the practical problem of large-scale aquaculture ponds where the feeding boat needs multiple replenishments due to insufficient bait or energy. However, the experimental environment in this study remains relatively constrained, as factors like wind speed/direction, water currents, and sensor instability were not accounted for. Future research should validate the algorithm against these environmental perturbations to strengthen its robustness.
In future work, we plan to apply dynamic programming to the Q-Learning algorithm to meet the requirements of more complex aquaculture environments. For the precise feeding problem in this study, we also plan to elevate it to the level of trajectory planning and optimization in the future. In addition to planning the feeding operation path based on the distribution density of river crabs in the pond, we also need to construct a feeding boat bait distribution model and plan the feeding boat casting amplitude, flow rate, route speed, and other operating parameters to achieve a more precise feeding effect. Furthermore, we propose to conduct robustness testing and algorithmic enhancements under challenging conditions, including strong hydrodynamic disturbances, GPS signal loss, and sensor drift, to mitigate interference impacts. This will improve the system’s stability, reliability, and adaptability, ultimately enabling its deployment across diverse intelligent unmanned vessels in marine and fluvial environments.
Author Contributions
Conceptualization, Y.S.; methodology, P.G.; software, J.S.; formal analysis, Y.S.; investigation, Z.Z.; data curation, P.G.; resources, Z.Z.; writing—original draft preparation, Y.S.; writing—review and editing, J.S.; visualization, Y.W.; supervision, D.Z.; project administration, D.Z.; funding acquisition, Y.S. All authors have read and agreed to the published version of the manuscript.
Funding
This research was funded by the National Natural Science Foundation of China (Grant No. 62173162); Jiangsu Provincial Agricultural Machinery Research, Manufacturing, Promotion, and Application Integration Pilot Project (JSYTH14); the Priority Academic Program Development of Jiangsu Higher Education Institutions (Grant No. PAPD-2022-87).
Institutional Review Board Statement
Not applicable.
Data Availability Statement
The original contributions presented in this study are included in the article. Further inquiries can be directed to the corresponding author.
Conflicts of Interest
The authors declare no conflicts of interest.
Correction Statement
This article has been republished with a minor correction to the Data Availability Statement. This change does not affect the scientific content of the article.
References
- Huang, X.; Du, L.; Li, Z.; Xue, J.; Shi, J.; Tahir, H.; Zou, X. A visual bi-layer indicator based on mulberry anthocyanins with high stability for monitoring Chinese mitten crab freshness. Food Chem. 2023, 411, 135197. [Google Scholar] [CrossRef]
- Sun, Y.; Chen, Z.; Zhao, D.; Zhan, T.; Zhou, W.; Ruan, C. Design and Experiment of Precise Feeding System for Pond Crab Culture. Trans. Chin. Soc. Agric. Mach. 2022, 53, 291–301. [Google Scholar]
- Jin, Y.; Liu, J.; Xu, Z.; Yuan, S.; Li, P.; Wang, J. Development status and trend of agricultural robot technology. Int. J. Agric. Biol. Eng. 2021, 14, 1–19. [Google Scholar] [CrossRef]
- Zhong, W.; Yang, W.; Zhu, J.; Jia, W.; Dong, X.; Ou, M. An Improved UNet-Based Path Recognition Method in Low-Light Environments. Agriculture 2024, 14, 1987. [Google Scholar] [CrossRef]
- Chen, T.; Xu, L.; Anh, H.S.; Lu, E.; Liu, Y.; Xu, R. Evaluation of headland turning types of adjacent parallel paths for combine harvesters. Biosyst. Eng. 2023, 233, 93–113. [Google Scholar] [CrossRef]
- Lu, E.; Xu, L.; Li, Y.; Tang, Z.; Ma, Z. Modeling of working environment and coverage path planning method of combine harvesters. Int. J. Agric. Biol. Eng. 2020, 13, 132–137. [Google Scholar] [CrossRef]
- Choset, H. Coverage of known spaces: The boustrophedon cellular decomposition. Auton. Robot. 2000, 9, 247–253. [Google Scholar] [CrossRef]
- Dong, Q.; Zhang, J. Distributed cooperative complete coverage path planning in an unknown environment based on a heuristic method. Unmanned Syst. 2024, 12, 149–160. [Google Scholar] [CrossRef]
- Kong, T.; Gao, H.; Chen, X. Full-Coverage Path Planning for Cleaning Robot Based on Improved RRT. Comput. Eng. Appl. 2024, 60, 311–318. [Google Scholar]
- Huang, Z.; Hu, L.; Zhang, Y.; Huang, B. Research on security path based on improved hop search strategy. Comput. Eng. Appl. 2021, 57, 56–61. [Google Scholar]
- Wu, N.; Wang, R.; Qi, J.; Wang, Y.; Wen, G. Efficient Coverage Path Planning and Underwater Topographic Mapping of an USV based on A*-Improved Bio-Inspired Neural Network. IEEE Trans. Intell. Veh. 2024, 10, 1101–1116. [Google Scholar] [CrossRef]
- Zhang, M.; Li, X.; Wang, L.; Jin, L.; Wang, S. A Path Planning System for Orchard Mower Based on Improved A* Algorithm. Agronomy 2024, 14, 391. [Google Scholar] [CrossRef]
- Xu, P.; Ding, Y.; Luo, J. Complete Coverage Path Planning of an Unmanned Surface Vehicle Based on a Complete Coverage Neural Network Algorithm. J. Mar. Sci. Eng. 2021, 9, 1163. [Google Scholar] [CrossRef]
- Zhou, Q.; Lian, Y.; Wu, J.; Zhu, M.; Wang, H.; Cao, J. An optimized Q-Learning algorithm for mobile robot local path planning. Knowl. Based Syst. 2024, 286, 111400. [Google Scholar] [CrossRef]
- Bo, L.; Zhang, T.; Zhang, H.; Yang, J.; Zhang, Z.; Zhang, C.; Liu, M. Improved Q-learning Algorithm Based on Flower Pollination Algorithm and Tabulation Method for Unmanned Aerial Vehicle Path Planning. IEEE Access 2024, 12, 104429–104444. [Google Scholar] [CrossRef]
- Li, Z.; Hu, X.; Zhang, Y.; Xu, J. Adaptive Q-learning path planning algorithm based on virtual target guidance. Comput. Integr. Manuf. Syst. 2024, 30, 553–568. [Google Scholar]
- Fang, W.; Liao, Z.; Bai, Y. Improved ACO algorithm fused with improved Q-Learning algorithm for Bessel curve global path planning of search and rescue robots. Robot. Auton. Syst. 2024, 182, 104822. [Google Scholar] [CrossRef]
- Xing, S.; Chen, X.; Wang, W.; Xue, P. Multi-UAV coverage optimization method based on information map and improved ant colony algorithm. Ordnance Ind. Autom. 2024, 43, 84–91+96. [Google Scholar]
- Liu, Y.; Yang, X.; Chu, H. Design and implementation of control system for autonomous cruise unmanned ship. Manuf. Autom. 2022, 44, 127–131. [Google Scholar]
- Hu, X. A Research on Full Coverage Path Planning Method for Agricultural UAVs in Mountainous Areas; Guizhou Minzu University: Guiyang, China, 2022. [Google Scholar]
- Huang, X.; Tang, C.; Tang, L.; Luo, C.; Li, W.; Zhang, L. Refill and recharge planning for rotor UAV in multiple fields with obstacles. Trans. Chin. Soc. Agric. Mach. 2020, 51, 82–90. [Google Scholar]
- Li, J.; Luo, H.; Zhu, C.; Li, Y.; Tang, F. Research and Implementation of Combination Algorithms about UAV Spraying Planning Based on Energy Optimization. Trans. Chin. Soc. Agric. Mach. 2019, 50, 106–115. [Google Scholar]
- Zhao, D.; Cao, S.; Sun, Y.; Qi, H.; Ruan, C. Small-sized efficient detector for underwater freely live crabs based on compound scaling neural network. Trans. Chin. Soc. Agric. Mach. 2020, 51, 163–174. [Google Scholar]
- Lv, T.; Zhou, W.; Zhao, C. Improved Visibility Graph Method Using Particle Swarm Optimization and B-Spline Curve for Path Planning. J. Huaqiao Univ. 2018, 39, 103–108. [Google Scholar]
- Wu, H.; Zhang, G.; Hong, Z. Evolutionary Tree Road Network Topology Building and the Application of Multi-Stops Path Optimization. Chin. J. Comput. 2012, 35, 964–971. [Google Scholar] [CrossRef]
- Ouyang, X.; Yang, S. Obstacle Avoidance Path Planning of Mobile Robots Based on Potential Grid Method. Control Eng. China 2014, 21, 134–137. [Google Scholar]
- Chen, G.; Song, Y. Application of improved genetic algorithm in mobile robot path planning. Comput. Appl. Softw. 2023, 40, 302–307. [Google Scholar]
- Shang, G.; Liu, J.; Han, J.; Zhu, P.; Chen, P. Research on Complete Coverage Path Planning of Gardening Electric Tractor Operation. J. Agric. Mech. Res. 2022, 44, 35–40. [Google Scholar]
- Sun, G.; Su, Y.; Gu, Y.; Xie, J.; Wang, J. Path planning for unmanned surface vehicle based on improved ant colony algorithm. Control Des. 2021, 36, 847–856. [Google Scholar]
- Wang, Q.; Yang, J. Path planning of multiple AUVs for cooperative mine countermeasure using internal spiral coverage algorithm. Comput. Meas. Control 2012, 20, 144–146. [Google Scholar]
- Zelinsky, A. A Mobile Robot Navigation Exploration Algorithm. IEEE Trans. Robot. Autom. 1992, 8, 707–717. [Google Scholar] [CrossRef]
- Zhao, H.; Mou, L.; Sun, H.; Jiang, B. Research on Full Coverage Path Planning of Mobile Robot. Comput. Simul. 2019, 36, 298–301. [Google Scholar]
- Bai, X.; Yuan, Z.; Zhou, W.; Zhang, Z. Application of hybrid genetic algorithms in robot path planning. Modul. Mach. Tool. Autom. Manuf. Technol. 2023, 11, 15–19. [Google Scholar]
- Roy, R.; Mahadevappa, M.; Kumar, C.S. Trajectory path planning of EEG controlled robotic arm using GA. Procedia Comput. Sci. 2016, 84, 147–151. [Google Scholar] [CrossRef]
- Low, E.S.; Ong, P.; Cheah, K.C. Solving the optimal path planning of a mobile robot using improved Q-learning. Robot. Auton. Syst. 2019, 115, 143–161. [Google Scholar] [CrossRef]
- Konar, A.; Goswami, I.; Singh, J.S.; Jain, C.L.; Nagar, K.A. A deterministic improved Q-learning for path planning of a mobile robot. IEEE Trans. Syst. Man Cybern. Syst. 2013, 43, 1141–1153. [Google Scholar] [CrossRef]
Disclaimer/Publisher’s Note: The statements, opinions and data contained in all publications are solely those of the individual author(s) and contributor(s) and not of MDPI and/or the editor(s). MDPI and/or the editor(s) disclaim responsibility for any injury to people or property resulting from any ideas, methods, instructions or products referred to in the content. |
© 2025 by the authors. Licensee MDPI, Basel, Switzerland. This article is an open access article distributed under the terms and conditions of the Creative Commons Attribution (CC BY) license (https://creativecommons.org/licenses/by/4.0/).