Article

Immune Response Analysis of Head Kidney in Large Yellow Croaker (Larimichthys crocea) Following Nocardia seriolae Infection

1
School of Marine Sciences, Ningbo University, Ningbo 315211, China
2
Key Laboratory of Aquacultural Biotechnology, Ministry of Education, Ningbo University, Ningbo 315211, China
3
Collaborative Innovation Center for Zhejiang Marine High-Efficiency and Healthy Aquaculture, Ningbo University, Ningbo 315211, China
4
Zhejiang Institute of Freshwater Fisheries, Huzhou 313001, China
*
Author to whom correspondence should be addressed.
Fishes 2025, 10(4), 167; https://doi.org/10.3390/fishes10040167
Submission received: 4 March 2025 / Revised: 4 April 2025 / Accepted: 7 April 2025 / Published: 8 April 2025
(This article belongs to the Section Fish Pathology and Parasitology)

Abstract

The large yellow croaker (Larimichthys crocea), one of the most economically valuable marine fish species in China, suffers significant economic losses in aquaculture due to infectious diseases caused by marine pathogens, such as Nocardia seriolae. The pathogenic mechanisms underlying N. seriolae infection in L. crocea and the host immune responses remain inadequately characterized. To investigate the molecular mechanisms of this infection, we conducted transcriptome sequencing on the head kidney tissues of L. crocea at 1, 3, 7, and 14 days post-infection with N. seriolae. In total, 421, 1052, 3215, and 2459 upregulated genes, along with 1853, 1777, 3718, and 3134 downregulated genes were identified, respectively. KEGG enrichment analysis revealed that differentially expressed genes were predominantly associated with immune and metabolic pathways. Notably, pathways involved in Toll-like receptor signaling, ECM–receptor interaction, cytokine–cytokine receptor interaction, and focal adhesion were significantly enriched, highlighting an immune response to N. seriolae infection in L. crocea. In addition, significant enrichment of the citrate cycle (TCA cycle) and oxidative phosphorylation pathways in metabolic processes suggests an upregulated ATP synthesis to meet the heightened energy demand associated with the immune response to infection. These findings contribute to a deeper understanding of the immune defense mechanisms in the head kidney of L. crocea against N. seriolae infection and elucidate aspects of N. seriolae pathogenicity.
Key Contribution: We conducted a transcriptomic analysis of the head kidney in L. crocea infected with N. seriolae, identifying differentially expressed genes and enriched pathways associated with the infection response. This study provides valuable insights into the molecular mechanisms underlying the fish immune response to N. seriolae infection.

1. Introduction

The large yellow croaker (Larimichthys crocea), a member of the order Perciformes, family Sciaenidae, and genus Larimichthys [1], is a warm-water species predominantly distributed across the southern Yellow Sea, East China Sea, and northern South China Sea. This species is of considerable economic importance in marine aquaculture [2]. Overfishing in the 1970s led to a sharp decline in L. crocea populations. However, with governmental support beginning in the 1980s, aquaculture efforts expanded significantly. By the 1990s, advancements in artificial breeding techniques established a robust industry, making L. crocea the most extensively cultured marine fish species in China. It currently holds the highest global production in fry, farming scale, and adult yield, positioning it among eight major advantageous export aquaculture products in China [3,4]. Despite industry growth, the increasing scale of L. crocea aquaculture has been accompanied by outbreaks of diseases caused by pathogens such as Vibrio harveyi, Pseudomonas plecoglossicida, and Nocardia seriolae, resulting in substantial economic losses. Among these, N. seriolae represents a significant threat due to a limited understanding of its pathogenic mechanisms and challenges in effective prevention and control.
N. seriolae is a Gram-positive, facultative intracellular pathogen that infects a range of marine fish species, including L. crocea, Trachinotus ovatusand, and Lateolabrax japonicas, as well as freshwater species such as Channa argus and Micropterus salmoides [5,6]. This opportunistic pathogen is prone to outbreak in high-density aquaculture environments, often triggered by poor water quality and reduced host immunity. Infection typically occurs through compromised skin or gill tissues, resulting in clinical manifestations, including multiple white nodules in internal organs and skin ulcers [7,8]. Characterized by a prolonged incubation period, N. seriolae infection presents as a chronic disease that is often asymptomatic in early stages, complicating detection and control efforts, with conventional antibiotic therapies proving largely ineffective.
RNA sequencing technology enables the identification of gene expression levels under various treatment conditions, offering particular value for non-model organisms. In recent years, RNA sequencing has become widely applied in studying diseases in aquatic animals [9]. Given the complex and protracted nature of bacterial infections in fish, transcriptome sequencing provides a comprehensive transcriptomic dataset, facilitating the in-depth analysis of differentially expressed genes and their functions. This approach offers valuable insights into pathogenesis and immune response mechanisms following pathogen infection.
The head kidney, as the primary immune organ in teleost fish, plays an essential role in the development, differentiation, and proliferation of immune cells [10]. To elucidate the pathogenic mechanisms of N. seriolae infection in L. crocea and its immune responses, we collected head kidney tissues from both uninfected and N. seriolae-infected L. crocea at 1, 3, 7, and 14 days post-infection (dpi) for transcriptome sequencing. This analysis allowed us to assess gene expression changes across infection stages, investigating the interaction mechanisms between N. seriolae and L. crocea and providing a reference framework for further research on N. seriolae control strategies.

2. Materials and Methods

2.1. L. crocea and N. seriolae

Healthy L. crocea were obtained from Tongzhao Village, Ningbo City, Zhejiang Province, with an average weight of 50–60 g and a length of 15–18 cm. The fish were acclimated for 7 days in a recirculating aquaculture system (RAS) with continuous aeration and were fed twice daily at 2% of their total body weight, with feeding halted 24 h prior to infection experiments. N. seriolae cultures were maintained in our laboratory, initially stored at −80 °C. Bacteria were streaked onto trypticase soy agar (TSA) plates and incubated at 28 °C for 5–7 days. The resulting bacterial culture was homogenized in sterile PBS to prepare a bacterial suspension.

2.2. Infection Experiment

Healthy L. crocea were randomly assigned to two groups: an infection group and a control group, with 60 fish per group. The bacterial suspension was prepared at an LD50 concentration of 5.99 × 10⁶ CFU/mL in sterile PBS. The infection group received 500 μL of the bacterial suspension via intraperitoneal injection, while the control group was administered an equivalent volume of sterile PBS using the same route. Throughout the 14-day observation period, water temperature was maintained at 27 ± 1 °C, pH at 7.5–8.0, dissolved oxygen levels above 6.0 mg/L, and salinity at 25–30‰. Fish were fed twice daily at 2% of their total body weight, with a 50% water exchange performed daily.

2.3. Sample Collection

Before sampling, L. crocea were anesthetized with MS-222 (100 mg/L, Sigma-Aldrich, St. Louis, MO, USA) until reaching a state of immobility, characterized by reduced opercular movement (~3 min). To minimize contamination, both the fish surface and dissection instruments were sterilized with 75% ethanol prior to tissue collection. Head kidney tissues were collected from both the control and infection groups at 1, 3, 7, and 14 dpi and immediately frozen in liquid nitrogen. Additionally, tissues from the liver, spleen, head kidney, and trunk kidney were fixed in 4% paraformaldehyde for 24 h for subsequent histopathological examination.

2.4. Total RNA Extraction, Library Construction, and Sequencing

Total RNA was extracted from head kidney tissues using Trizol reagent (Invitrogen, Waltham, MA, USA). RNA concentration and purity were evaluated with a NanoDrop spectrophotometer, and integrity was assessed by agarose gel electrophoresis and an Agilent 2100 Bioanalyzer (Agilent Technologies, Santa Clara, CA, USA). Following quality confirmation, mRNA was enriched from total RNA using Oligo dT magnetic beads. Fragmentation was followed by synthesis of first-strand cDNA using random hexamer primers, with second-strand cDNA synthesized subsequently. Library preparation included end repair, A-tailing, adapter ligation, fragment selection, amplification, and purification steps. The library concentration was initially quantified with a Qubit 2.0 Fluorometer, diluted to 1.5 ng/μL, and insert size was confirmed using an Agilent 2100 Bioanalyzer. Quantitative real-time PCR (qRT-PCR) was conducted to determine the effective concentration of the library (>1.5 nM) to ensure library quality. Libraries passing quality control were pooled according to effective concentration and sequencing specifications for Illumina sequencing.

2.5. RNA Sequencing Data Processing and Analysis

The raw sequencing data contained a minor proportion of reads with sequencing adapters or low quality. To ensure data integrity and reliability, the raw data were filtered to remove reads containing adapters, ambiguous bases (N), and low-quality bases (Qphred ≤ 5 across more than 50% of the read length). Clean reads were subsequently aligned to the reference genome using HISAT2 software (version 2.0.5) to obtain positional information. Transcript assembly was conducted with StringTie software (version 2.2.0), which utilizes network flow algorithms and supports de novo assembly when necessary. Newly assembled transcripts were annotated using databases such as Pfam, SUPERFAMILY, GO, and KEGG. To confirm experimental reliability and validate sample selection, correlation analysis of gene expression levels and principal component analysis (PCA) were performed. Correlation analysis, based on FPKM values of all genes across samples, was visualized as a heatmap to illustrate inter-group differences and consistency within replicates. PCA, applied to evaluate both inter-group differences and within-group replicates, used linear algebra methods for dimensionality reduction, extracting principal components from the extensive set of gene variables. The raw data have been deposited at the NCBI Sequence Read Archive under the accession number SUB14871298.

2.6. Identification and Analysis of Differentially Expressed Genes (DEGs)

Following the assessment of gene expression levels to identify DEGs, statistical analyses were conducted to isolate genes with significant expression changes across conditions and to link these to specific gene functions. Differential expression analysis was performed using DESeq1.20.0, applying thresholds of log2 (FoldChange) ≥ 1 and padj ≤ 0.05 to identify significant DEGs. Functional enrichment analysis was then used to categorize hundreds to thousands of genes, proteins, or other molecules into specific pathways, simplifying the complexity of data interpretation. Enrichment analysis annotated DEGs using the GO and KEGG databases, with subsequent GO functional enrichment and KEGG pathway enrichment analyses conducted using clusterProfiler 3.8.1.

2.7. Quantitative Real-Time PCR (qPCR) Analysis

To assess the reliability and accuracy of the transcriptome data, eight immune-related DEGs were selected for qPCR validation. Gene-specific primers were designed using the NCBI primer-BLAST tool (https://www.ncbi.nlm.nih.gov/tools/primer-blast, accessed on 10 August 2024), with primer sequences detailed in Table A1. Primer validation was performed by running PCR followed by agarose gel electrophoresis to assess primer dimer formation. Serial dilutions of cDNA were used to generate melt curve plots, and only primers with an efficiency greater than 98% were used for subsequent qPCR experiments. QPCR assays were conducted on a Roche LightCycler 480 system using 2× Universal Blue SYBR Green qPCR SuperMix (Servicebio, Wuhan, China). The qPCR cycling program consisted of an initial denaturation at 95 °C for 30 s, followed by 40 cycles of denaturation at 95 °C for 15 s, annealing at 57 °C for 10 s, and extension at 72 °C for 30 s, concluding with a melt curve analysis. Each reaction was performed in triplicate, using β-actin as the reference gene. Relative expression levels were calculated using the 2−ΔΔCt method, and statistical analysis was conducted using GraphPad Prism 10.0.

3. Results

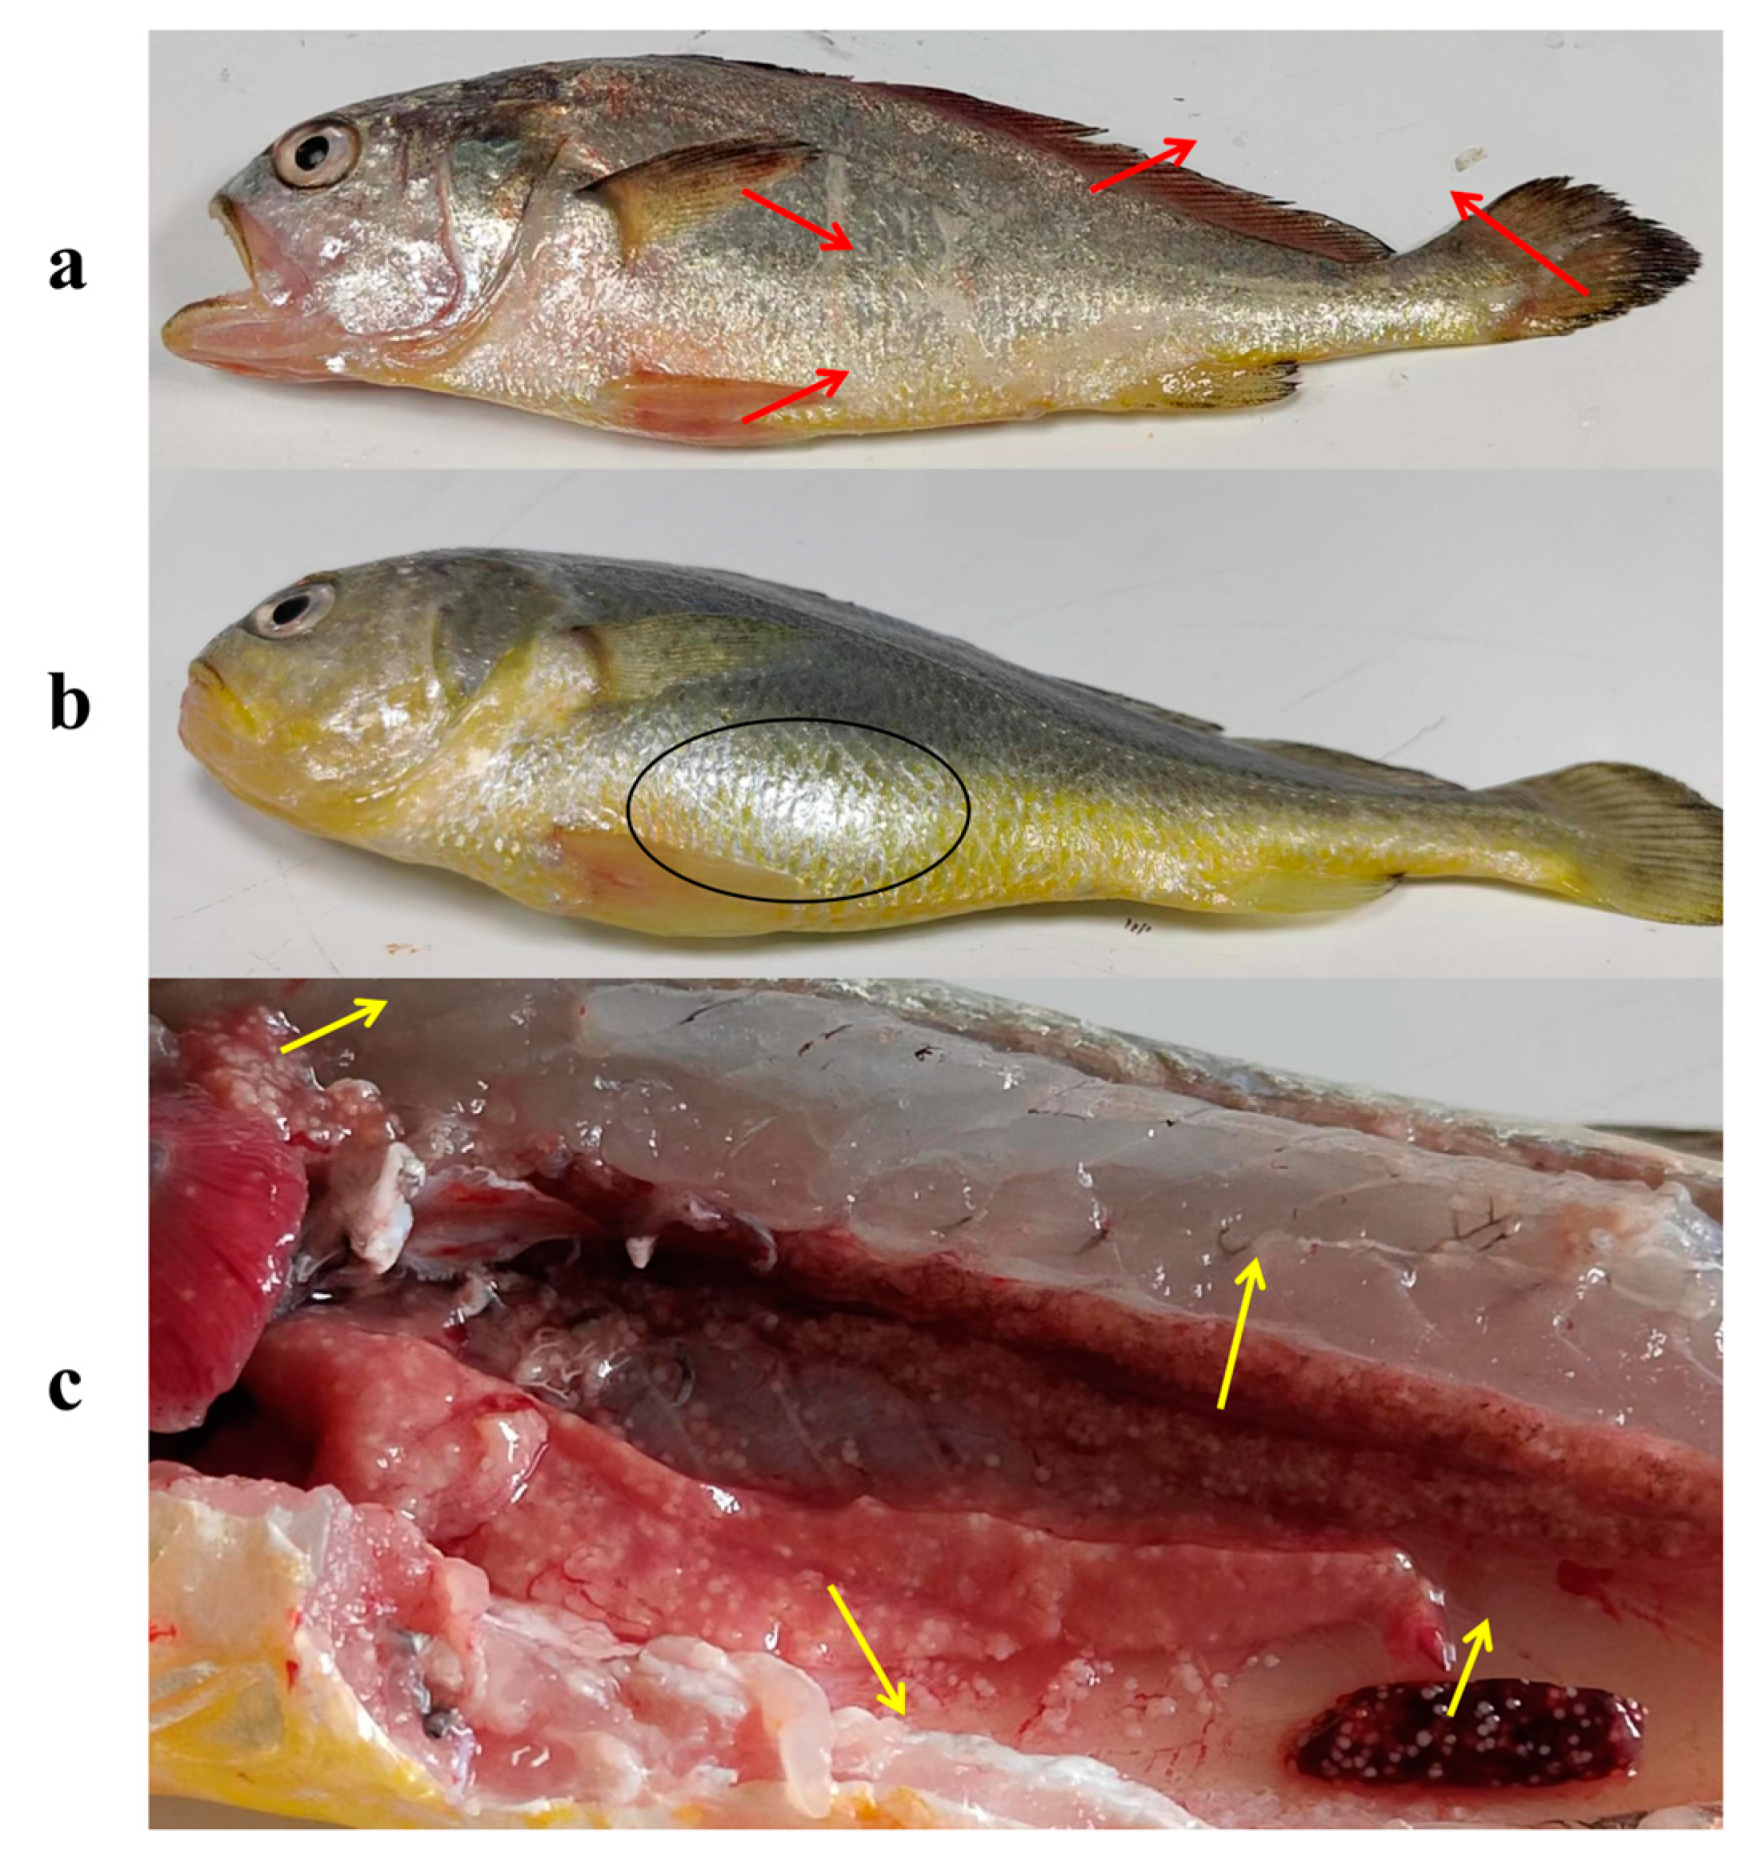
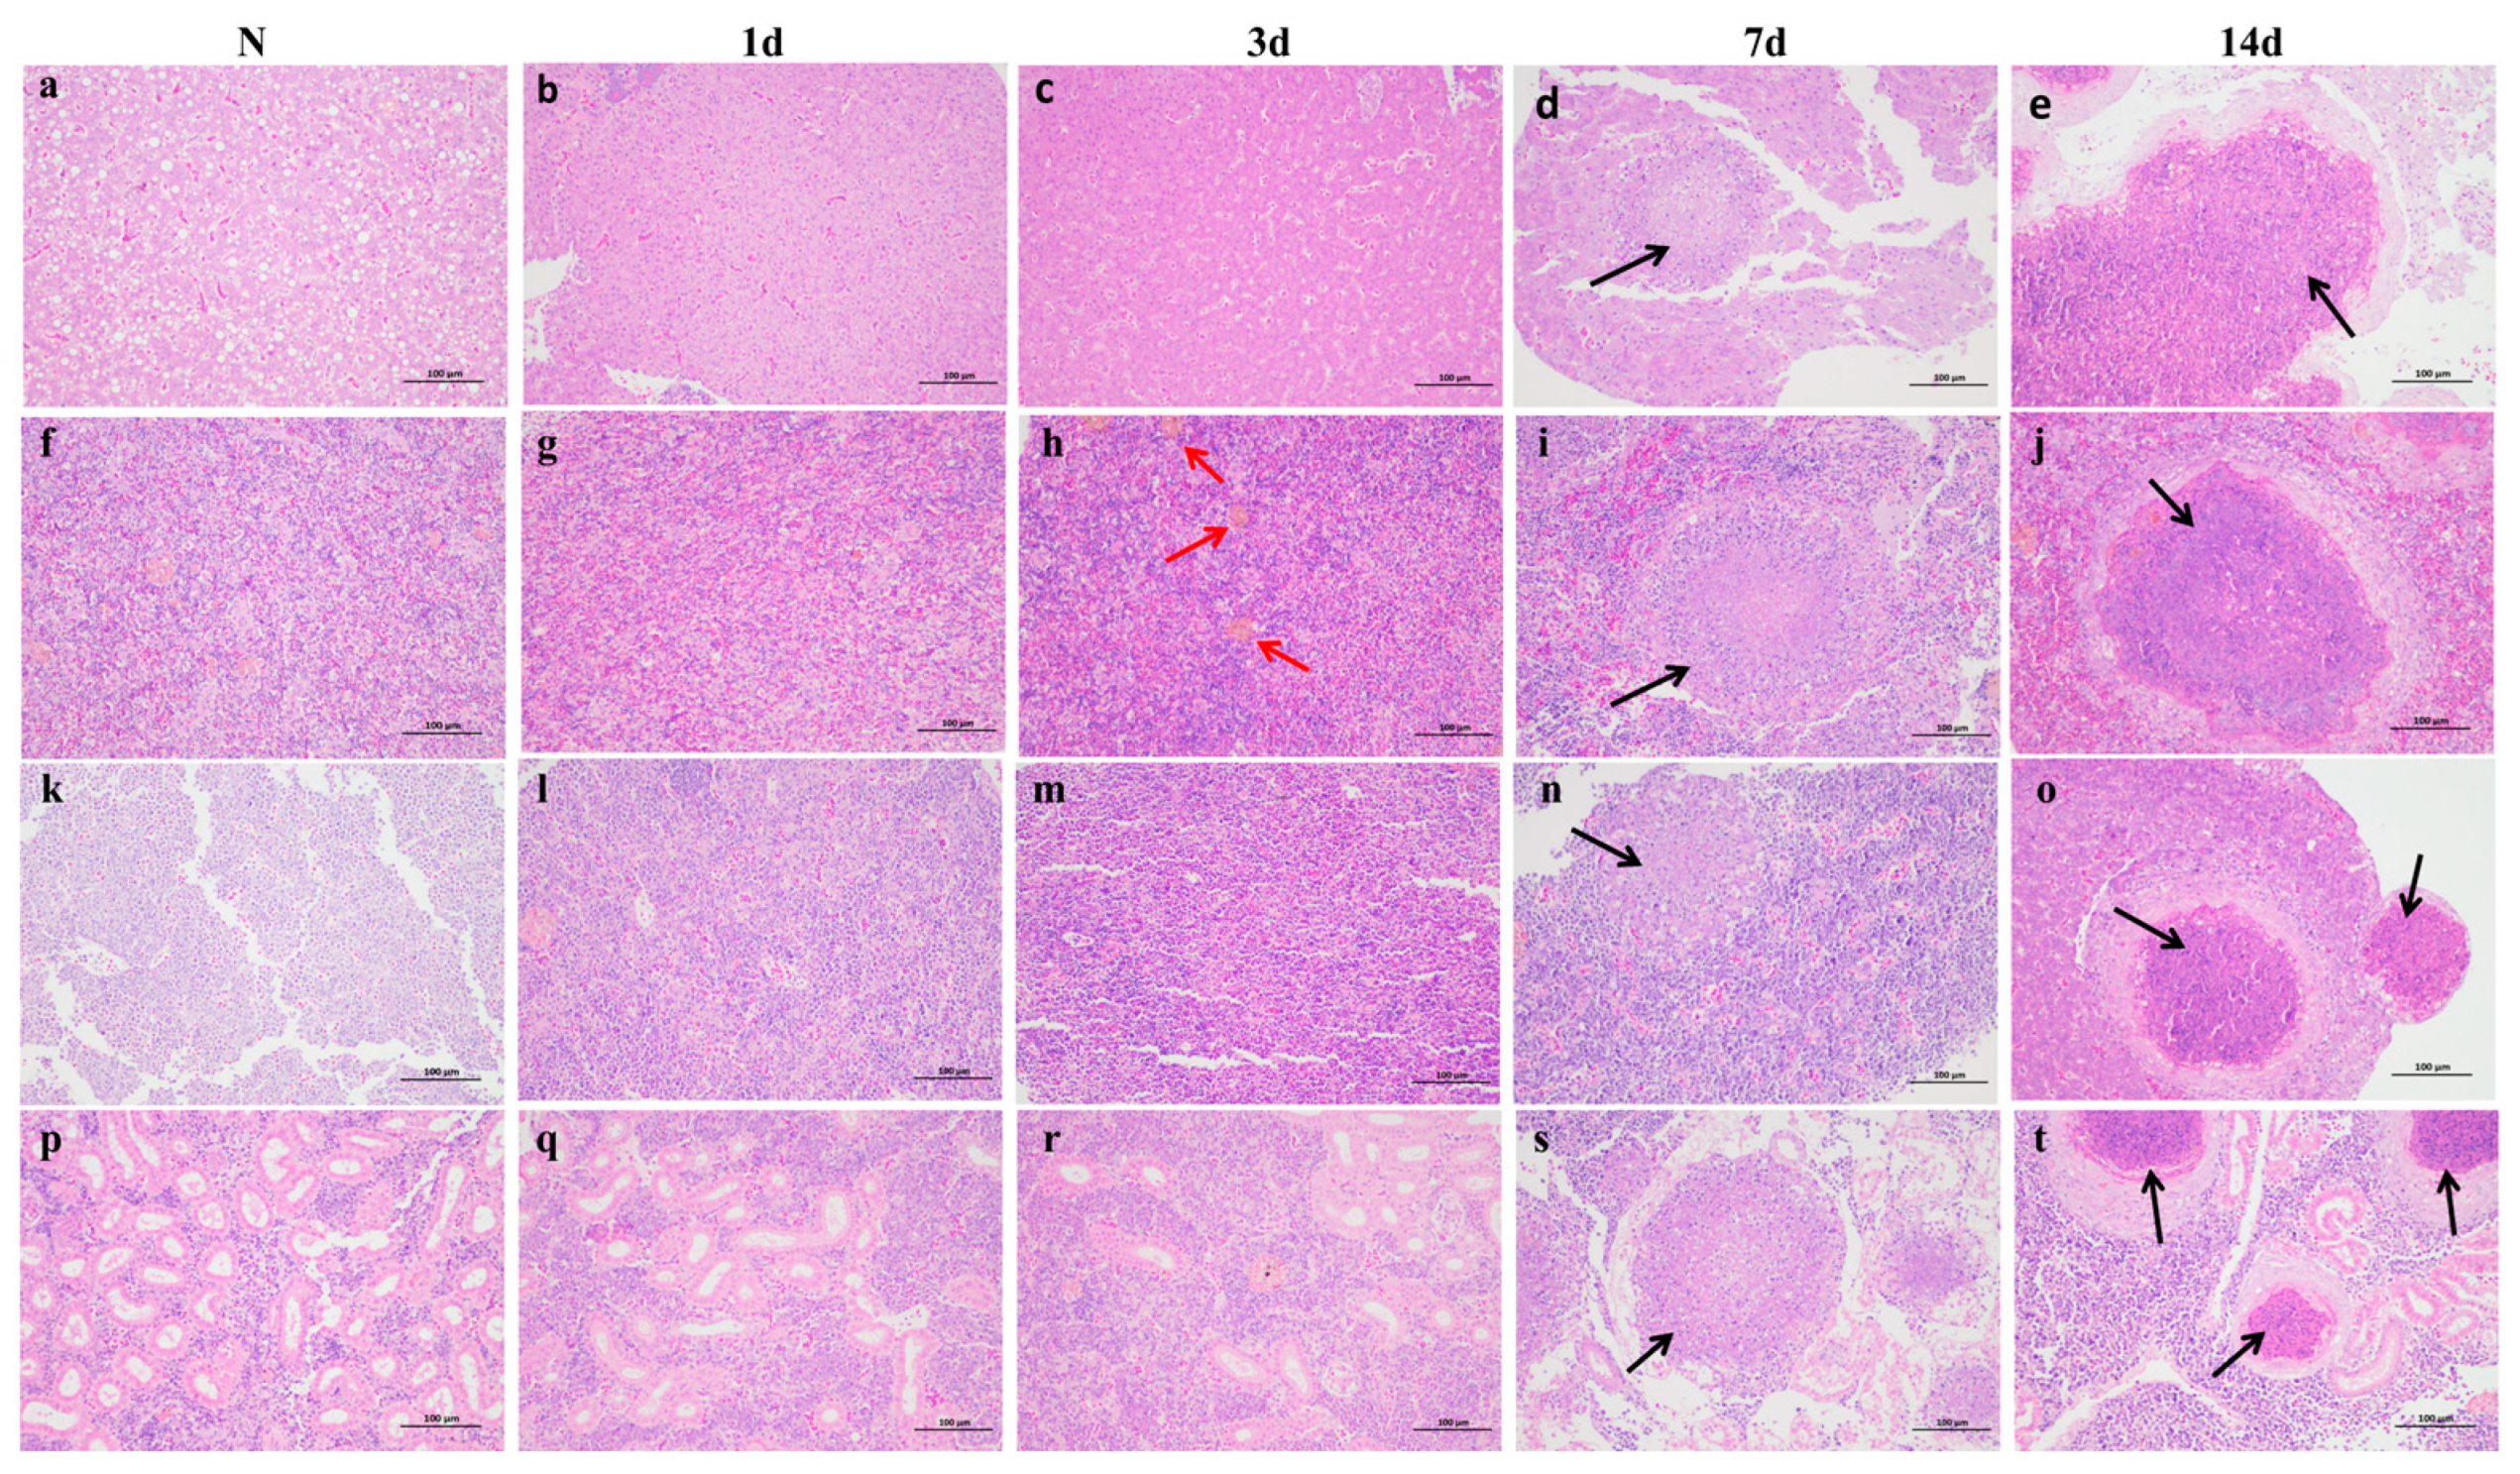
3.1. Clinical Symptoms and Histopathological Observations

Infected L. crocea initially displayed non-specific symptoms, including lethargy and reduced appetite. As the infection advanced, external bleeding and ulcerations developed, accompanied by hemorrhaging in the fins (Figure 1a) and abdominal swelling (Figure 1b). Post-mortem analysis revealed numerous white nodules in the liver, spleen, and kidney tissues (Figure 1c). Histopathological analysis revealed progressive lesion development in the liver, spleen, head kidney, and trunk kidney over the infection course. At 1 and 3 dpi, hepatocyte deformation with indistinct boundaries was observed, spleen tissues displayed hemorrhage and hemosiderin deposition, and kidney cells showed a decrease in number with associated bleeding. At 7 dpi, granulomatous nodules began forming in these organs, characterized by a fibrous connective tissue layer and a small number of lymphocytes. At 14 dpi, these nodules became larger, well demarcated, and more abundant, encapsulated by an outer layer of lymphocytes and fibrous connective tissue (Figure 2).

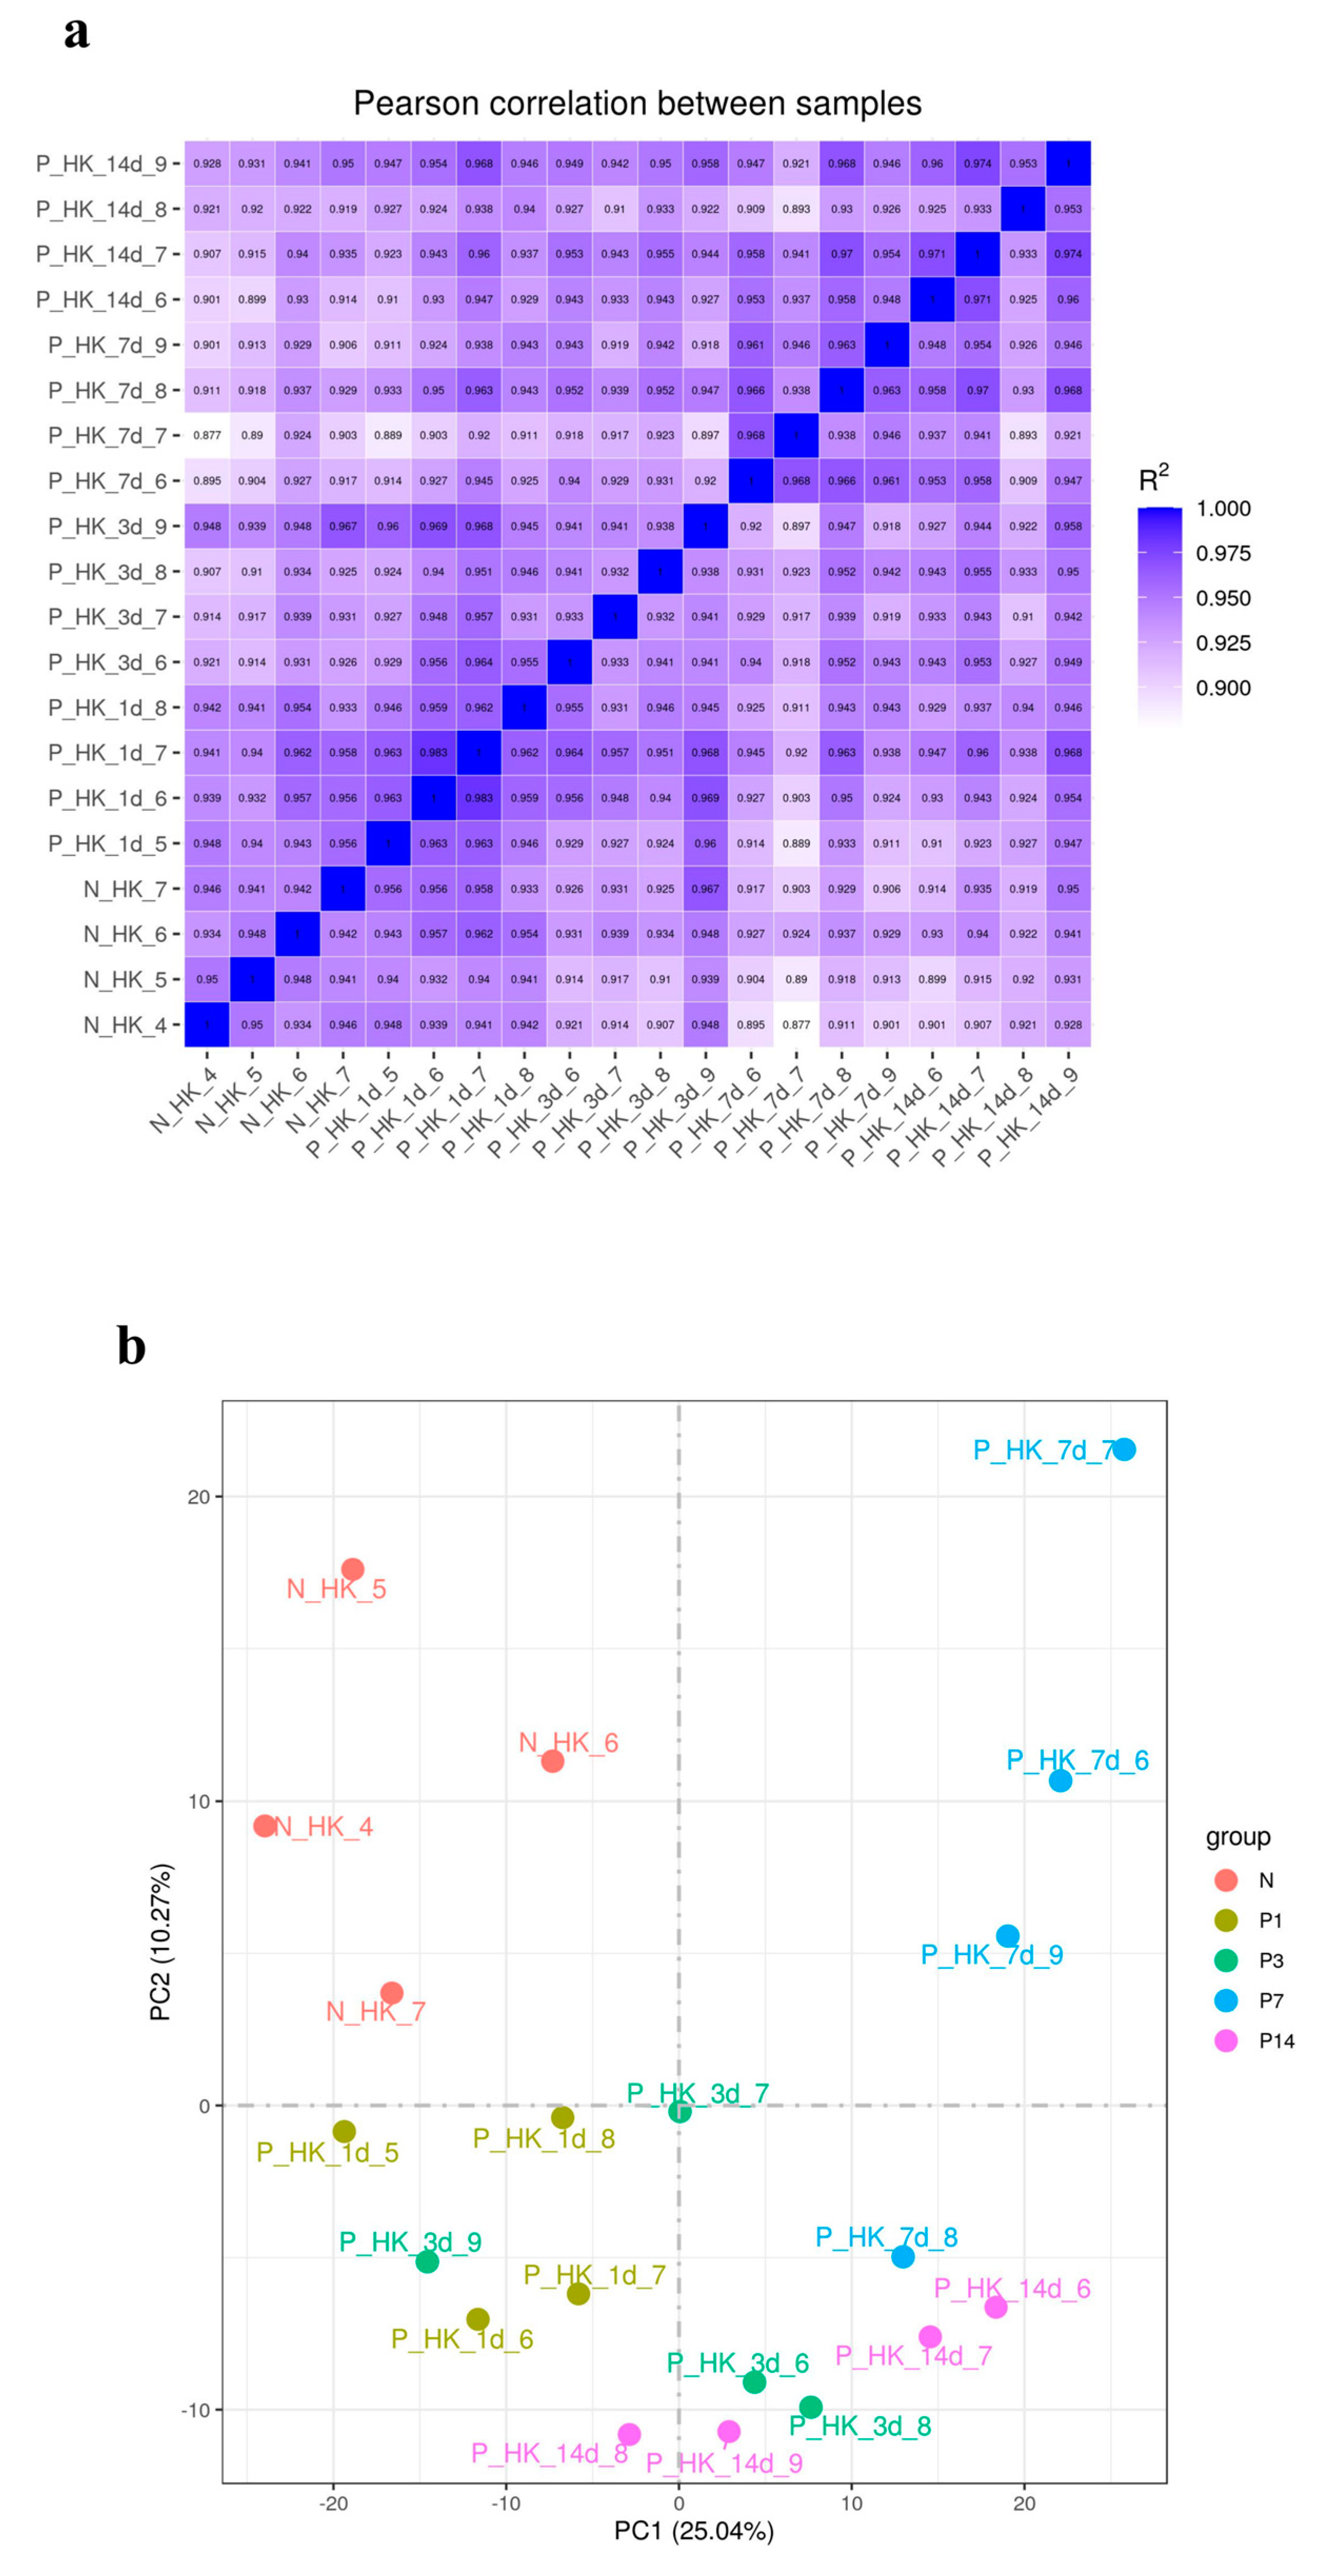
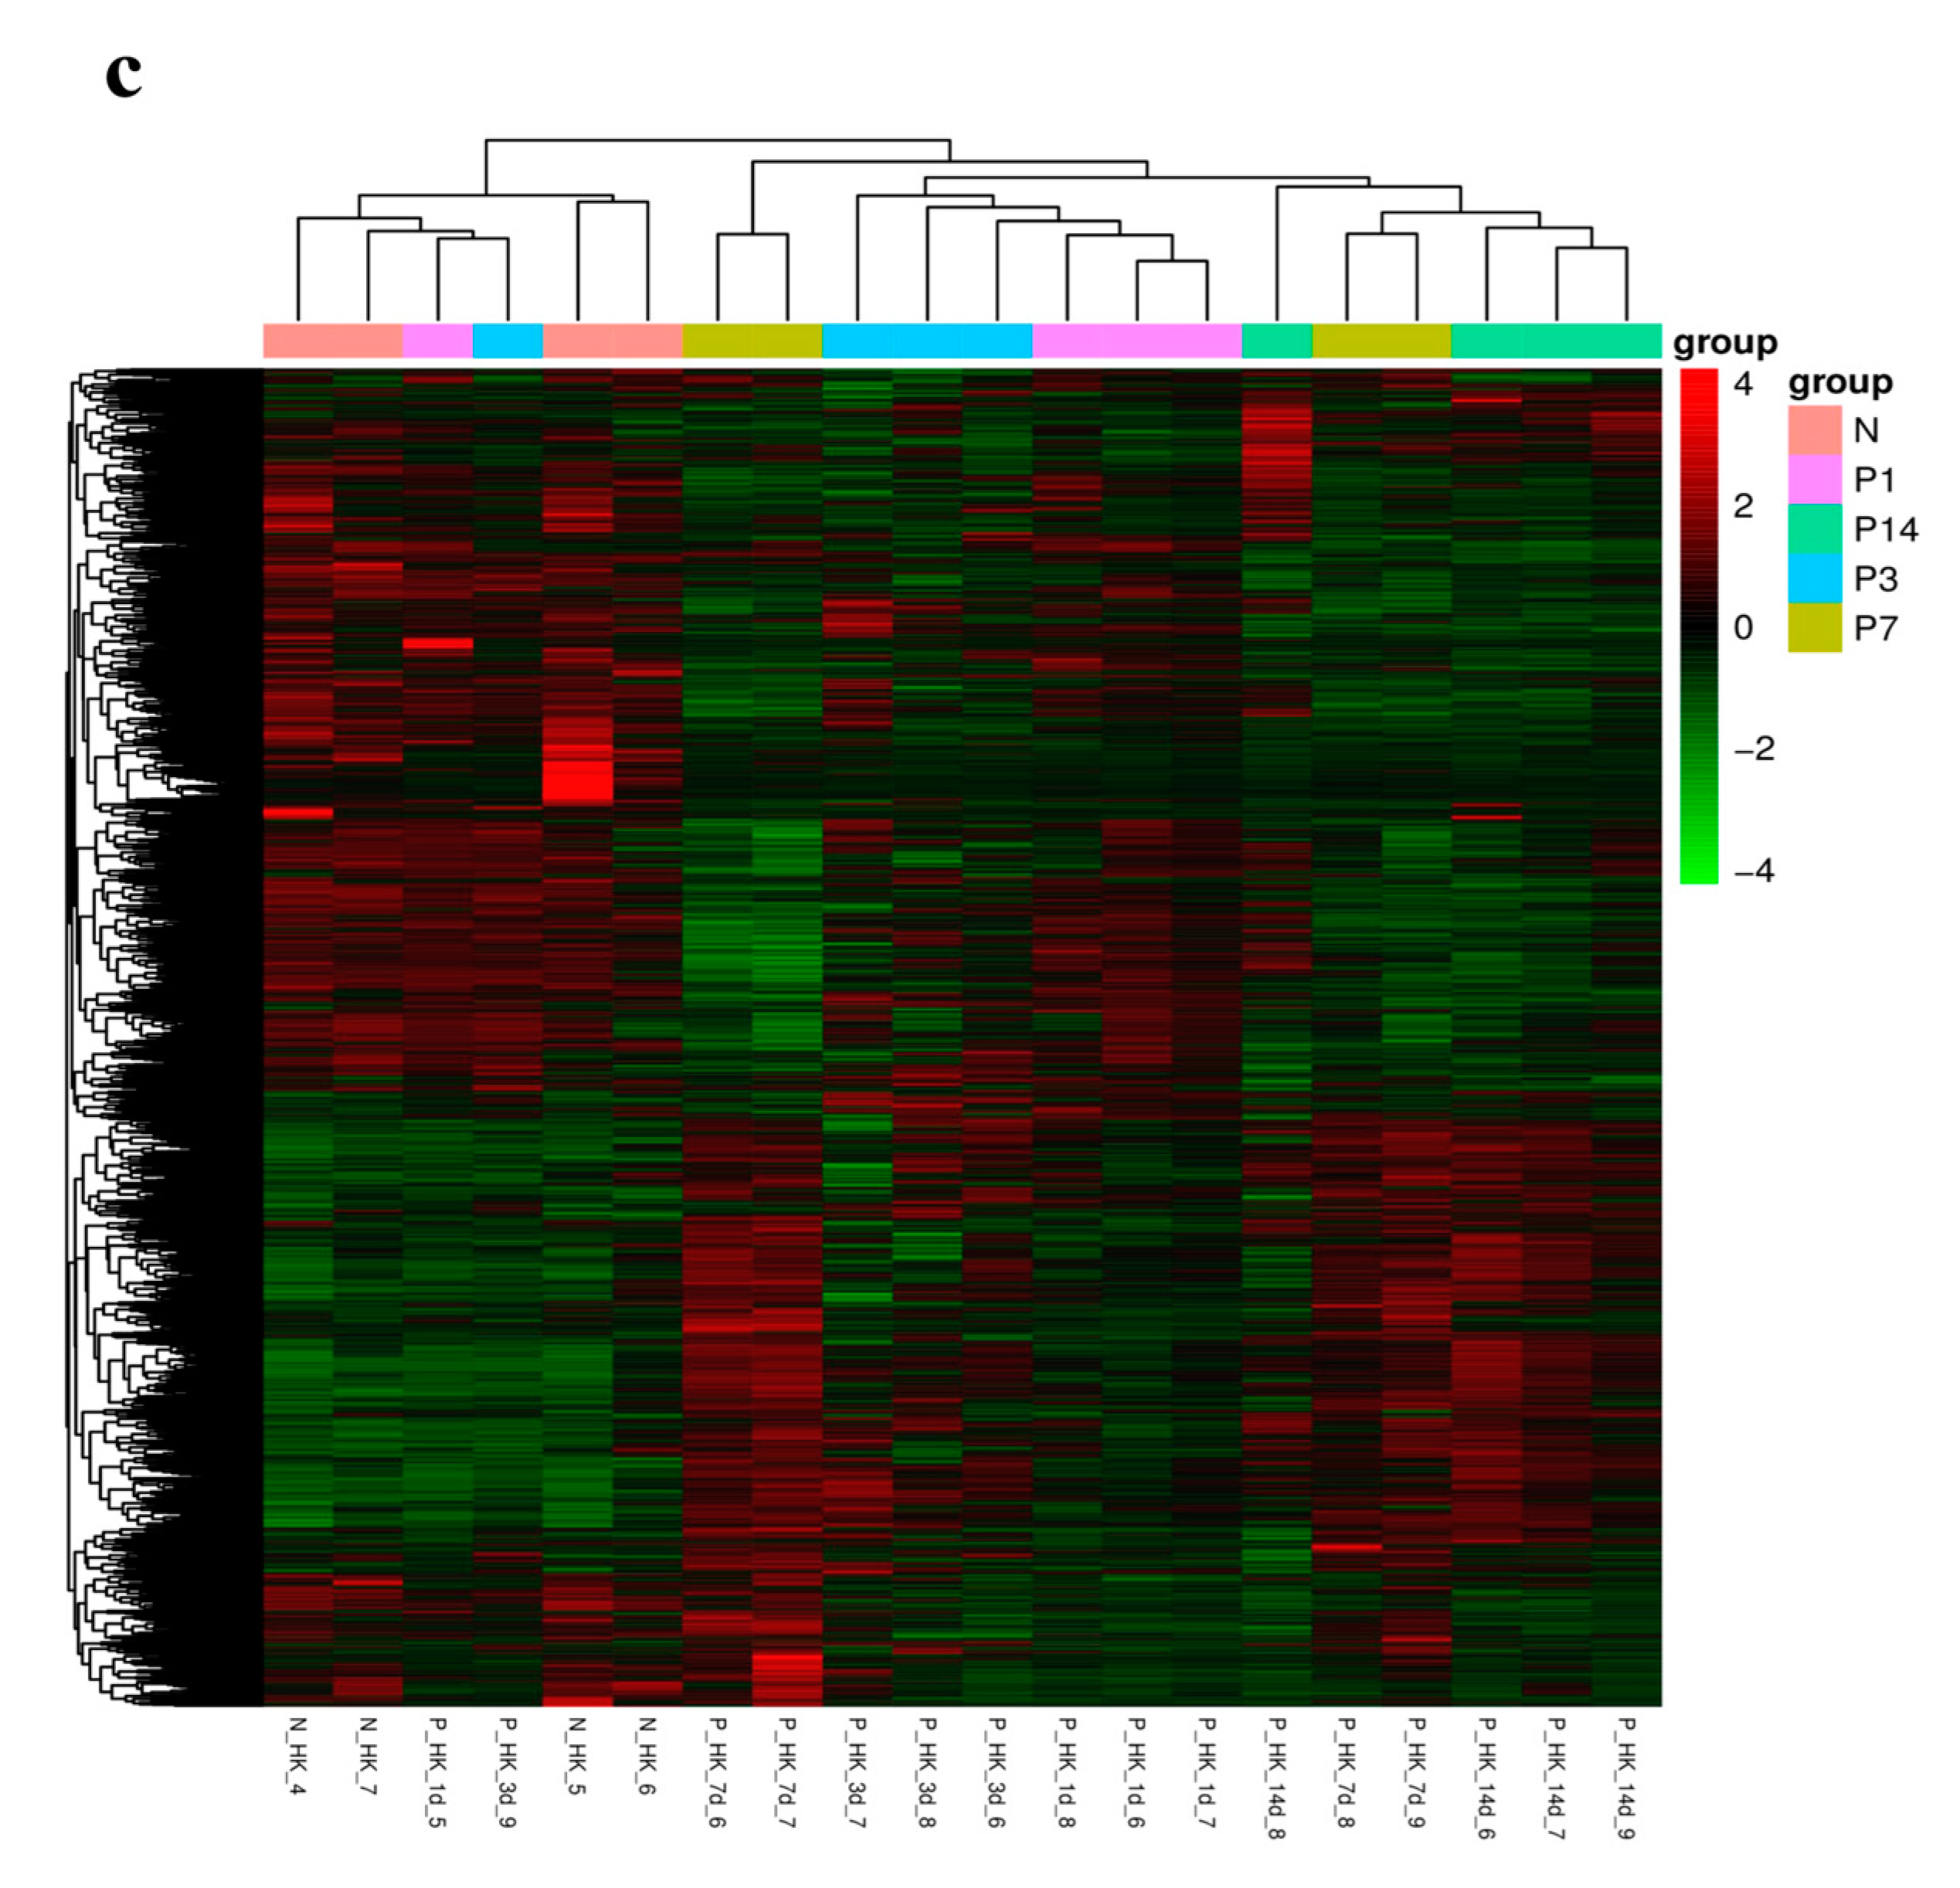
3.2. RNA Sequencing and Transcriptome Assembly

After filtering raw data, checking sequencing error rates, and examining GC content distribution, clean reads were obtained for further analyses. Quality assessment of sequencing data from the control and infection groups showed Q20 base percentages above 97.51%, Q30 base percentages above 93.16%, and GC content ranging from 45.81% to 48.6%, with sequencing error rates under 1%. Clean reads for the control group and head kidney tissues at 1, 3, 7, and 14 dpi totaled 41,182,671, 46,961,273, 45,076,950, 44,184,500, and 44,862,975, respectively (Table A2). These metrics confirm that the sequencing data quality is appropriate for subsequent transcriptome analysis. Correlation coefficients based on FPKM values of all genes were calculated to evaluate gene expression correlations among samples, visualized in a heatmap (Figure 3a). PCA and differential gene clustering further highlighted substantial inter-group differences between the control and infection groups, with high reproducibility within each group (Figure 3b,c).

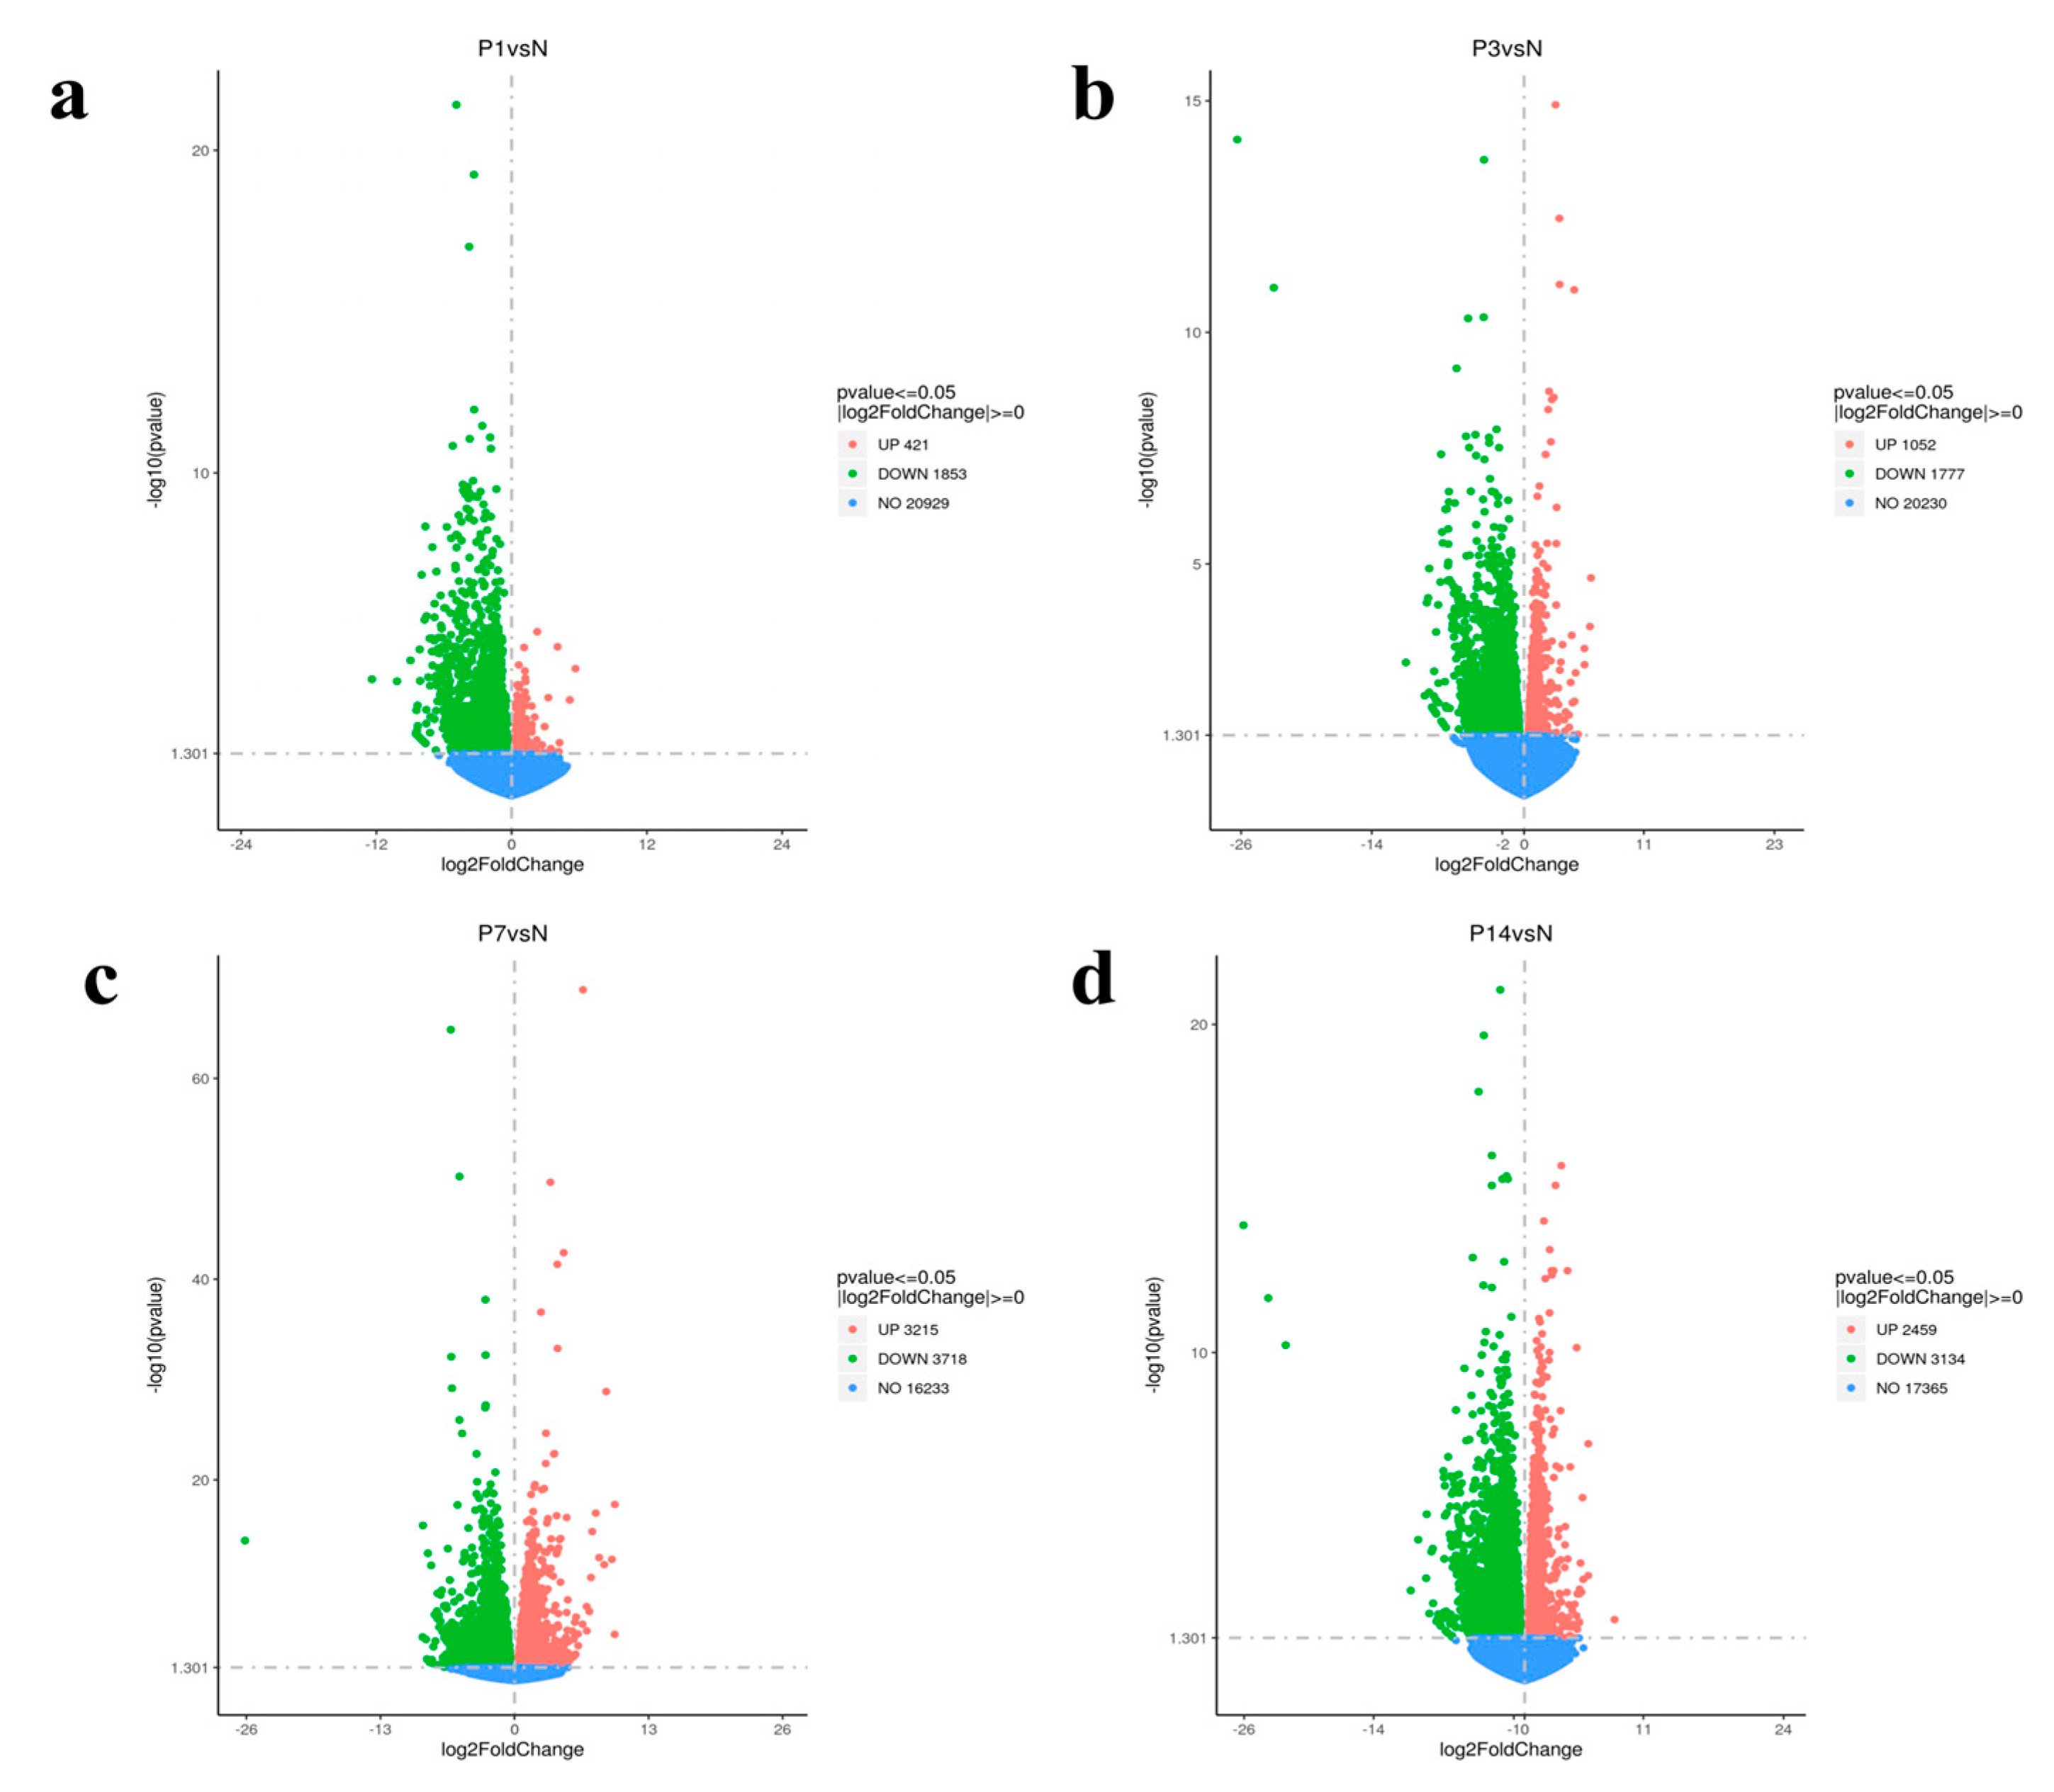
3.3. Identification of Differential Expression Gene

Transcriptome analysis of head kidney tissues infected with N. seriolae revealed a total of 17,629 DEGs across the four infection time points, with 7147 upregulated and 10,482 downregulated genes. In comparison to the control group (N), the P1 (1 dpi) group exhibited 421 upregulated and 1853 downregulated genes (Figure 4a), the P3 (3 dpi) group had 1052 upregulated and 1777 downregulated genes (Figure 4b), the P7 (7 dpi) group showed 3215 upregulated and 3718 downregulated genes (Figure 4c), and the P14 (14 dpi) group presented 2459 upregulated and 3134 downregulated genes (Figure 4d). The progressive increase in DEG numbers suggests a time-dependent immune activation in response to N. seriolae challenge.

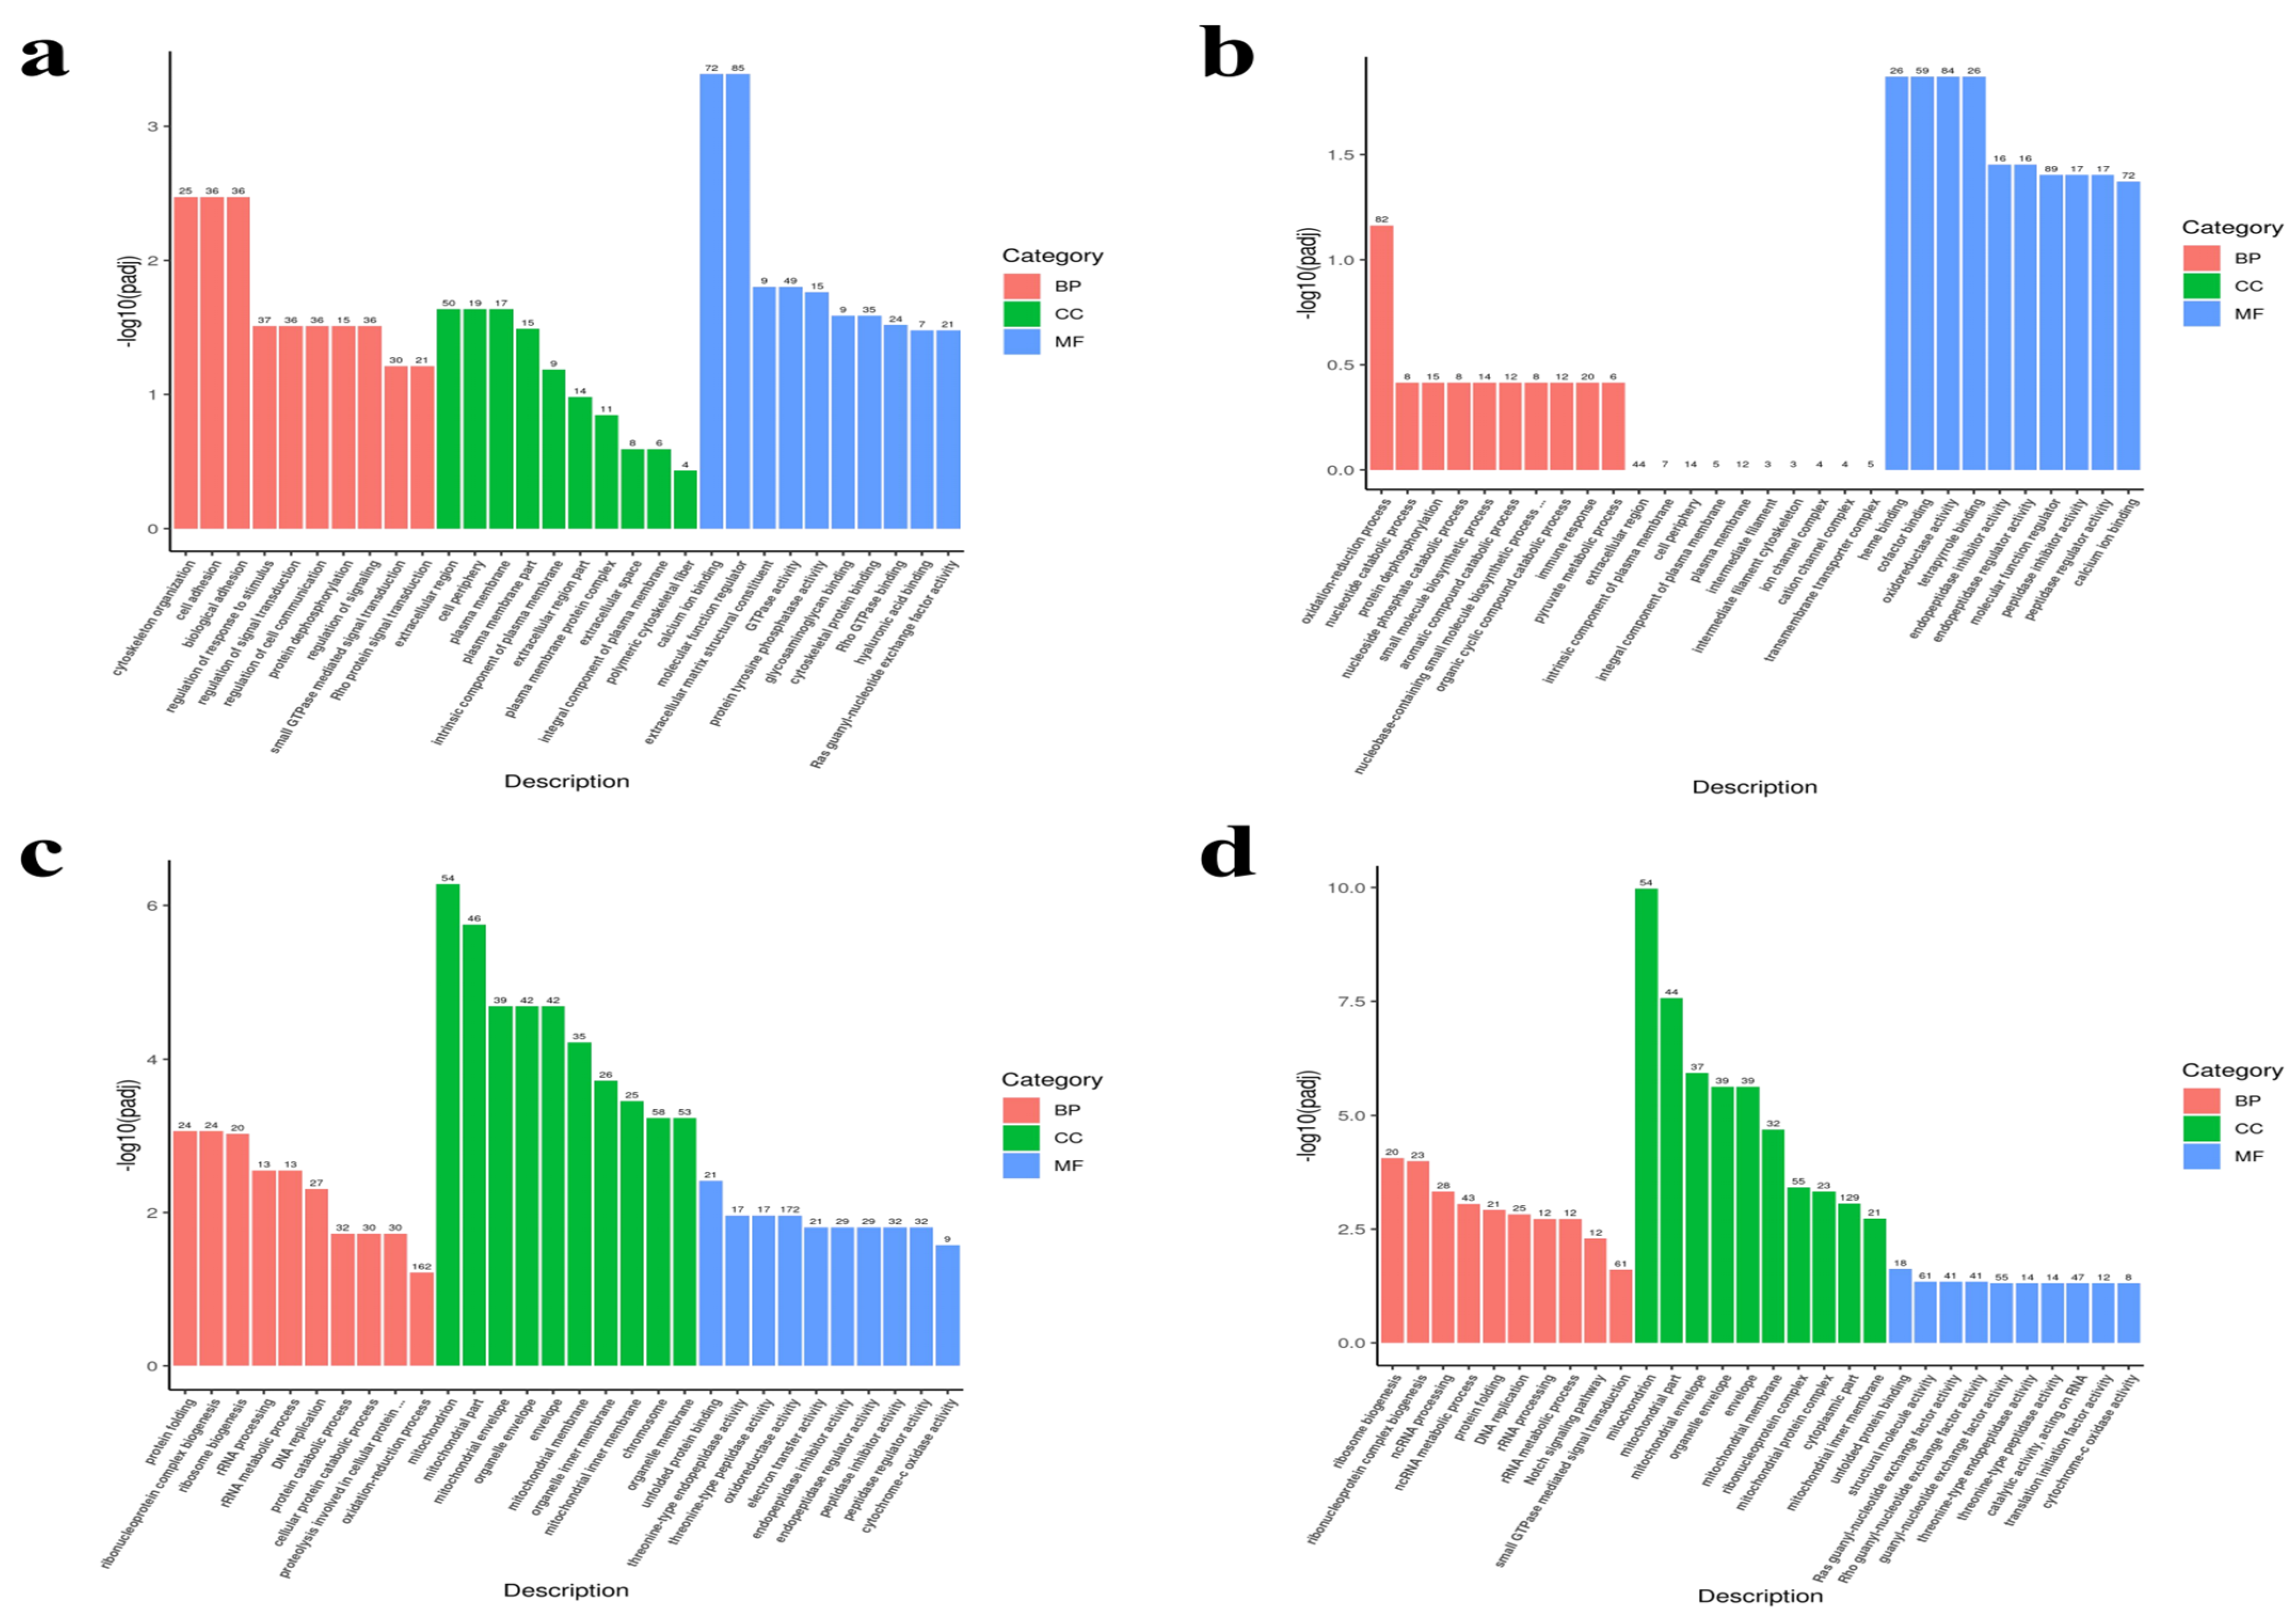
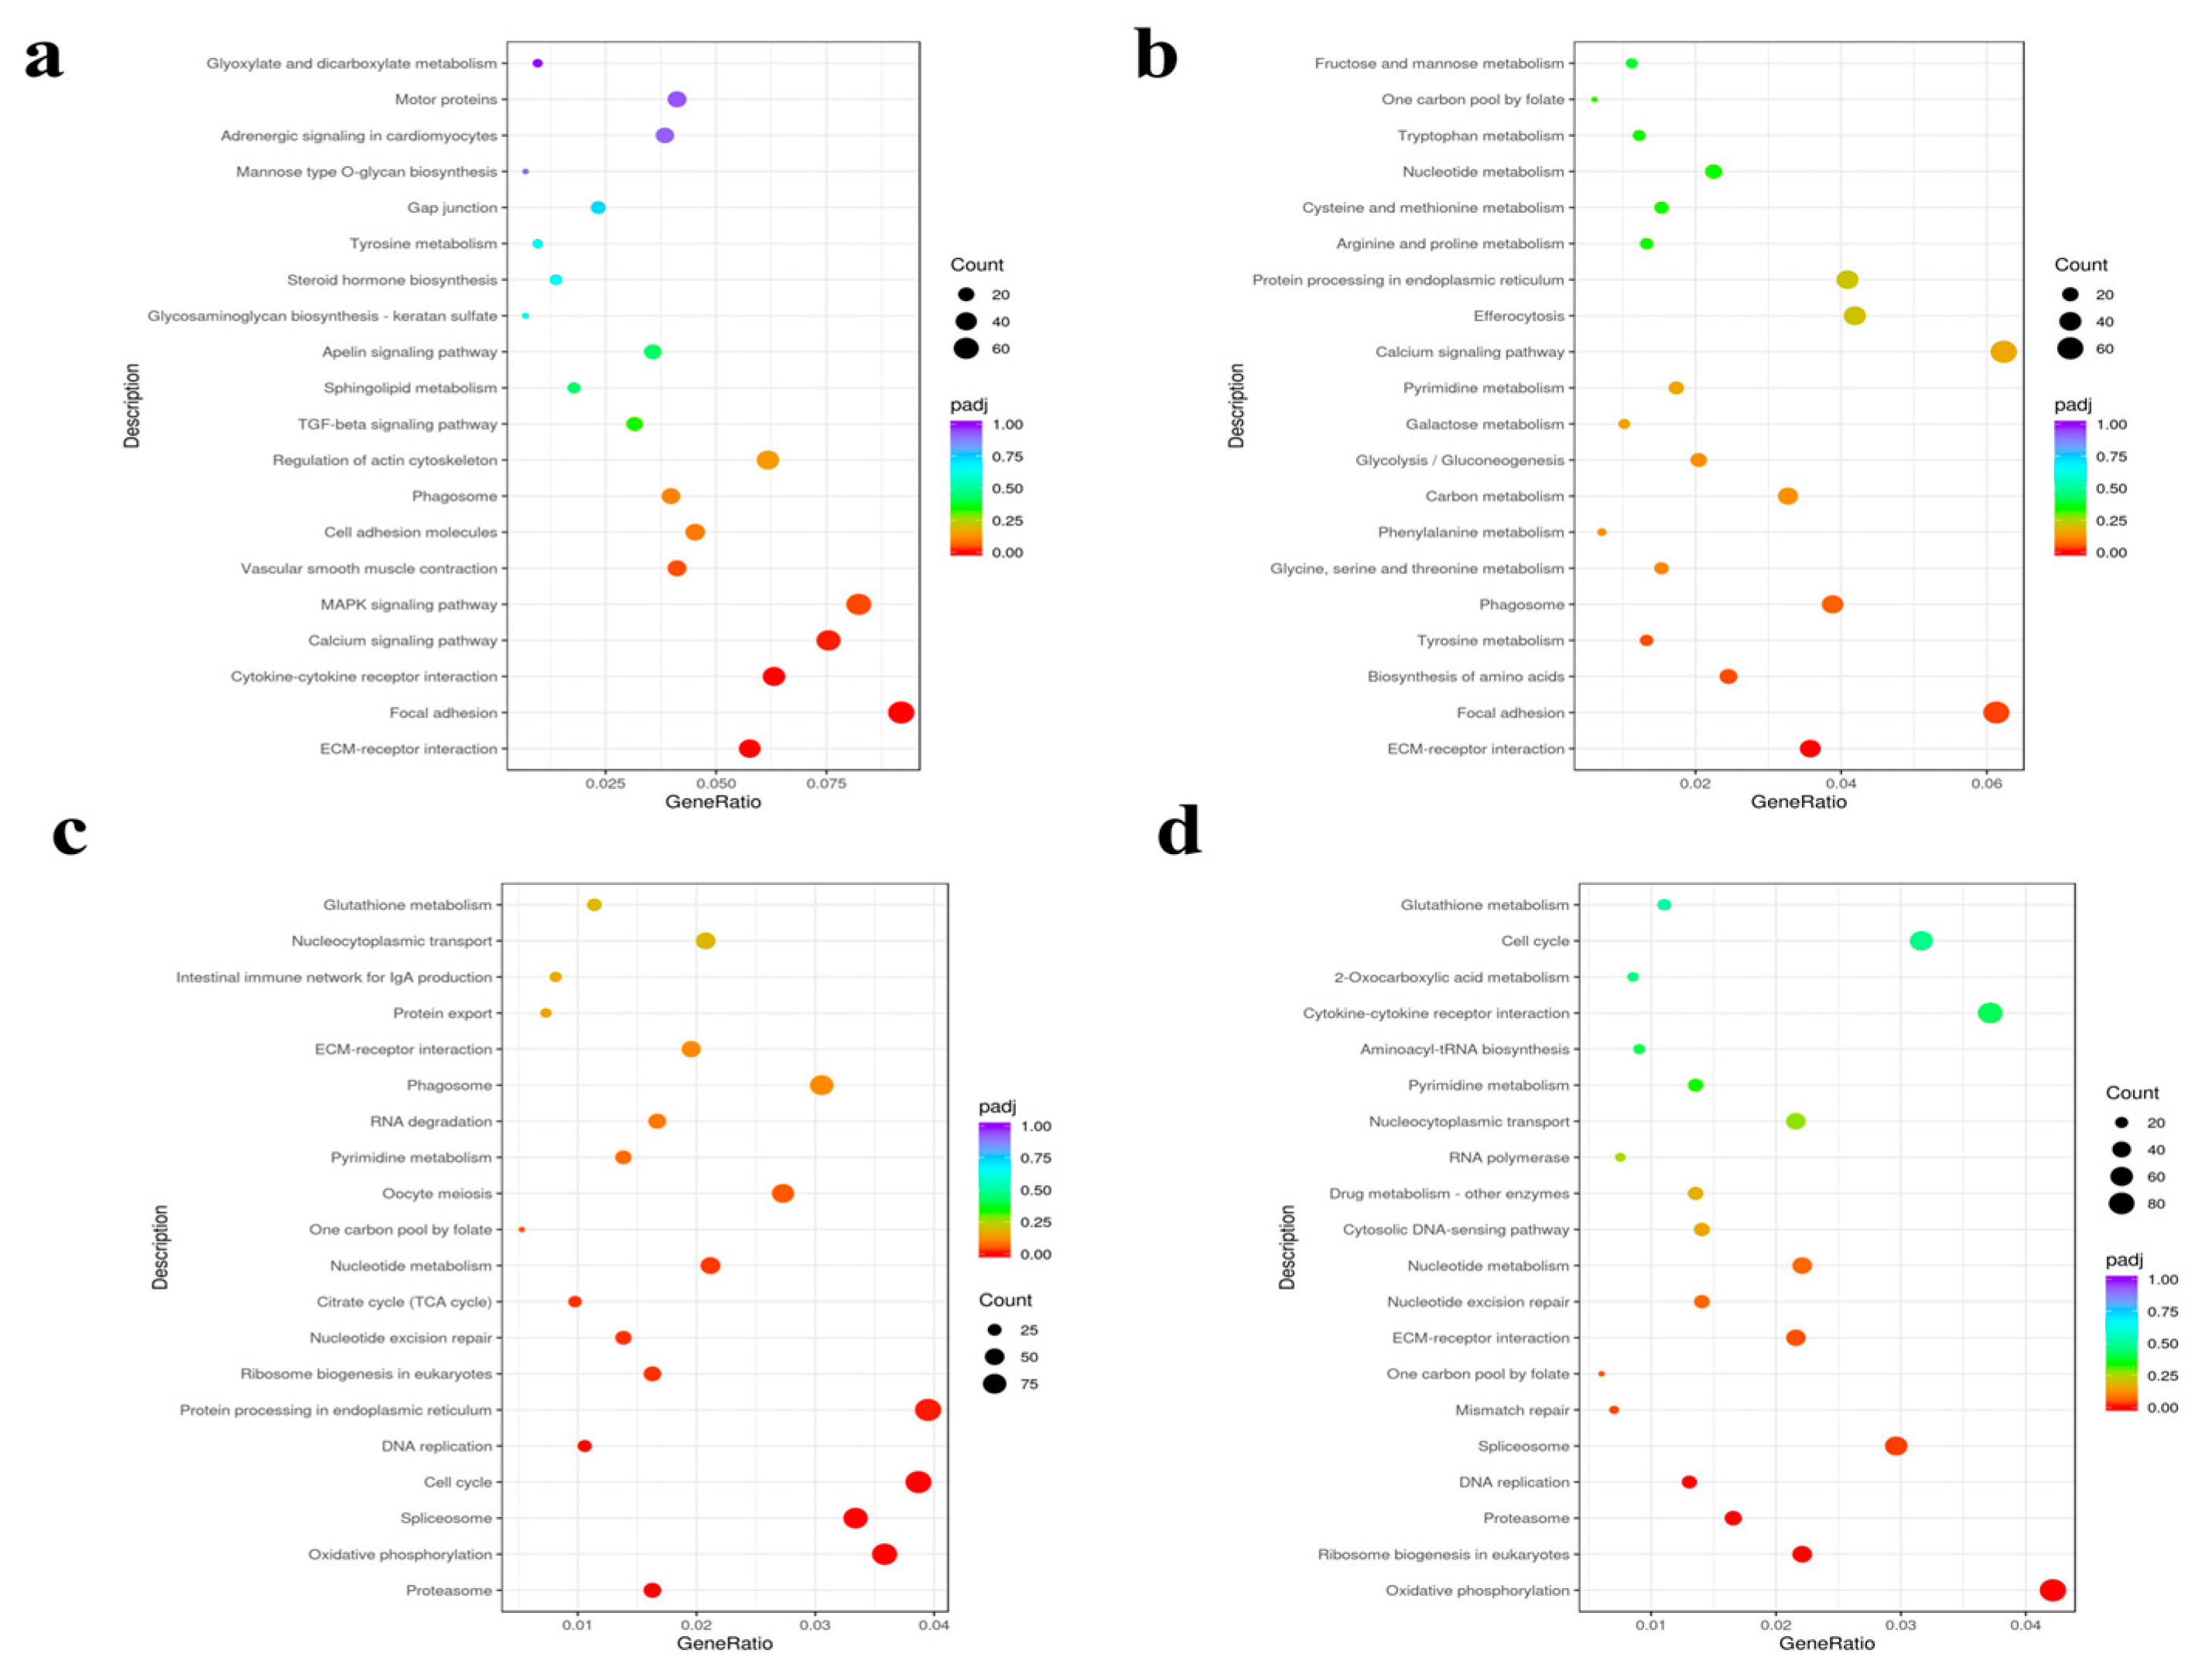
3.4. Functional Annotation and Enrichment Analysis

To elucidate the molecular mechanisms underlying the immune response of L. crocea to N. seriolae infection, we performed Gene Ontology (GO) functional enrichment and Kyoto Encyclopedia of Genes and Genomes (KEGG) pathway analyses on DEGs using the clusterProfiler package. This approach was employed to identify key biological pathways involved in the L. crocea’s response to N. seriolae infection, thereby elucidating the fundamental molecular mechanisms underlying this process.
GO analysis systematically categorizes gene functions into three ontologies: biological process (BP), cellular component (CC), and molecular function (MF). Using an adjusted p-value (padj) < 0.05, we visualized the 30 most significantly enriched GO terms (or all if fewer than 30) (Figure 5). Enrichment patterns varied temporally. At P1 (1 dpi), DEGs were predominantly enriched in biological adhesion (BP, 8 terms), extracellular region (CC, 4 terms), and receptor regulator activity (MF, 16 terms). By P3 (3 dpi), the enrichment profile shifted toward the oxidation–reduction process (BP, 9 terms), extracellular region (CC, 10 terms), and oxidoreductase activity (MF, 11 terms). At P7 (7 dpi), protein folding (BP, 9 terms), mitochondrion (CC, 27 terms), and unfolded protein binding (MF, 14 terms) showed significant enrichment. The P14 (14 dpi) time point demonstrated the most extensive changes, with DEGs primarily enriched in ribosome biogenesis (BP, 29 terms), mitochondrion (CC, 30 terms), and unfolded protein binding (MF, 15 terms).
KEGG pathway analysis (padj < 0.05) identified key immune-related and metabolic pathways activated during infection. The top 20 most significant pathways (or all if fewer than 20) were plotted (Figure 6). DEG annotation revealed the following: 2274 genes mapped to 150 pathways (10 significantly enriched) at P1 (1 dpi); 2829 genes to 160 pathways (3 enriched) at P3; 6933 genes to 164 pathways (41 enriched) at P7 (7 dpi); and 5593 genes to 165 pathways (37 enriched) at P14 (14 dpi). Notably, immune-related pathways showed dynamic temporal regulation. ECM–receptor interaction and focal adhesion were consistently enriched across all time points. Cytokine–cytokine receptor interaction, cell adhesion molecules, and MAPK signaling pathway were prominent at 1, 7, and 14 dpi, while the intestinal immune network for IgA production emerged at 7 and 14 dpi. Pattern recognition receptor pathways (NOD-like, C-type lectin, and RIG-I-like receptor signaling) were activated throughout infection. Metabolic pathways, including oxidative phosphorylation and citrate cycle (TCA cycle), became significantly enriched only at later stages (7 and 14 dpi).
The Toll-like receptor, NOD-like receptor, RIG-I-like receptor, and C-type lectin receptor signaling pathways facilitate pathogen recognition by detecting distinct molecular patterns, thereby initiating innate immune responses. ECM–receptor interactions and focal adhesion pathways dynamically regulate immune cell migration and tissue localization, while cytokine–receptor interactions orchestrate leukocyte recruitment and activation. Key immune-related genes enriched in these immune pathways include IL-1β and TLR5, which are critical for inflammatory regulation and bacterial detection, respectively. Additionally, CCL19, CCL20, and CXCR2 contribute significantly to immune modulation. These pathways and genes collectively form a coordinated defense network against N. seriolae infection. Furthermore, oxidative phosphorylation and the TCA cycle-central metabolic pathways support the immune response by enhancing ATP production through mitochondrial electron transport and substrate oxidation. The significant enrichment of these pathways suggests a close link between energy metabolism and immune defense in L. crocea.

3.5. qPCR Analysis

To validate the RNA-seq results, eight immune-related genes were selected from the four infection time points for qPCR verification. Three distinct expression patterns were identified (Figure 7): Relative to the N group, the expression levels of CDHE, TRX1, and LAMP progressively increased following N. seriolae exposure, reaching peak expression at 7 dpi. In contrast, CDH5 expression decreased at 1, 3, and 14 dpi, with an increase observed at 7 dpi. The expression levels of IL7R, CXCR3, CARD9, and MKK4 remained lower than pre-infection levels. These qPCR results align with the RNA-seq findings, supporting the reliability of the RNA-seq data.

4. Discussion

N. seriolae poses a major threat to aquaculture, causing significant economic losses, yet its pathogenic mechanisms remain incompletely understood [11]. Since pathogenic manifestations directly reflect host–pathogen interactions [12], we observed the clinical and histopathological features of L. crocea infected with N. seriolae. Notably, yellow-white granulomatous nodules were observed in visceral tissues and the abdominal cavity, showing remarkable consistency with previous reports in Micropterus salmoides [13], Salmo salar [14], Pampus argenteus [15], and Channa argus [16]. The disease progression exhibited distinct temporal patterns: while the initial infection stages (1 and 3 dpi) were asymptomatic, prominent granuloma formation occurred in multiple organs during later stages (7 and 14 dpi), accompanied by progressive tissue damage and hemorrhagic manifestations. Histopathological examination revealed distinct granulomatous nodules in the liver, spleen, head kidney, and trunk kidney during advanced infection stages (7 and 14 dpi), with enlarged nodules featuring defined boundaries and darkened centers. These nodules were encapsulated by a layer of lymphocytes and fibrous connective tissue. Previous studies indicate that N. seriolae can evade phagocytic killing, disseminate within the host, and infect multiple tissues [17]. In response to N. seriolae infection and spread, hosts accumulate immune and epithelial cells around the lesions, leading to granuloma formation [11]. These findings suggest that in the late stages of infection (7 and 14 dpi), L. crocea mounts an immune response by forming granulomatous nodules to counteract N. seriolae.
To further investigate the immune mechanisms of L. crocea against N. seriolae, we performed RNA-Seq analysis on the head kidney of both uninfected and infected fish. KEGG pathway analysis identified significant enrichment in both immune-related (Toll-like receptor signaling, cytokine–cytokine receptor interaction) and metabolic pathways (TCA cycle, oxidative phosphorylation). Notably, key immune genes, including IL-1β, TLR5, CCL19, CCL20, and CXCR2, were significantly upregulated. These findings provide a foundation for subsequent mechanistic discussions regarding host–pathogen interactions. We systematically analyzed and discussed these pathways and immune-related genes to elucidate their functional significance in the host defense mechanism.
Innate immune responses serve as the first line of host defense against pathogenic infections [18]. Upon pathogen entry, pattern recognition receptors (PRRs) detect pathogen-associated molecular patterns (PAMPs) through specific signaling pathways, thereby resisting pathogen invasion and initiating immune responses. This process forms the core of cellular innate immunity [19]. Our KEGG enrichment analysis identified the involvement of four key receptor signaling pathways: C-type lectin receptor (CLR), Toll-like receptor (TLR), NOD-like receptor (NLR), and RIG-I-like receptor (RLR) pathways. This multi-PRR activation pattern is consistent with observations in N. seriolae-infected L. maculatus [20]. It is common for multiple PRRs to be activated simultaneously in response to pathogen invasion [21]. Notably, IL-1β expression was significantly upregulated at all post-infection time points within these four receptor pathways. As a pivotal early-response cytokine, IL-1β orchestrates immune defense by activating monocytes, macrophages, and neutrophils, thereby regulating inflammatory processes [22]. These results demonstrate that L. crocea employs coordinated PRR signaling and IL-1β-mediated inflammation to combat N. seriolae infection.
The Toll-like receptor (TLR) family represents the primary and most extensively studied category of PRRs [23,24]. In fish, the TLR signaling pathway plays a pivotal role in defense against both bacterial and viral infections [25]. Our transcriptomic analysis revealed significant upregulation of TLR5 in the head kidney at 7 and 14 dpi, consistent with observations in silver pomfret infected with N. seriolae [15]. Mechanistically, surface-expressed TLR5 detects bacterial flagellin [26,27], triggering downstream signaling cascades that orchestrate comprehensive immune activation through precise PAMP recognition [28]. These findings establish TLR5 as a key gene in L. crocea’s immune recognition and defense against N. seriolae.
The extracellular matrix (ECM) serves as a critical modulator of post-infection immune responses, mediating complex pathogen–host–immune cell interactions [29]. Our transcriptomic analysis revealed consistent enrichment of ECM–receptor interaction pathways throughout infection, accompanied by the downregulation of most ECM-related genes (laminin, integrin, collagen, and fibronectin), indicating infection-induced ECM remodeling. Such ECM degradation may promote host defense by facilitating immune cell trafficking and releasing bioactive factors [30]. These findings suggest the active participation of ECM dynamics in L. crocea’s immune defense against N. seriolae.
Cytokines are a family of secreted proteins integral to immune regulation and inflammation, including chemokines (CKs), interleukins (ILs), interferons (IFNs), colony-stimulating factors (CSFs), and tumor necrosis factors (TNFs) [31]. Transcriptional profiling revealed the temporal regulation of key cytokine genes: Antimicrobial CCL19 and CCL20 were significantly upregulated at 7 dpi, while CXCR2 and IL1R2 showed sustained induction at 3, 7, and 14 dpi. These chemokines coordinate leukocyte recruitment and differentiation, bridging innate and adaptive immunity [32]. CXCR2 upregulation in L. crocea mirrors previous observations during bacterial and viral challenges [33], reinforcing its central role in antimicrobial defense. The lymphoid chemokine CCL19, which orchestrates antigen-presenting cell migration [34], exhibited infection-responsive expression patterns consistent with reports in A. hydrophila-infected goldfish [35] and V. harveyi-challenged S. ocellatus [36]. Similarly, IL1R2 induction paralleled findings in V. anguillarum-infected S. salar and A. hydrophila-exposed fish [37,38]. Collectively, these results demonstrate that L. crocea mobilizes a conserved cytokine network (CXCR2, IL1R2, CCL19, CCL20) to combat N. seriolae infection through enhanced immune activation.
Focal adhesions (FAs) are essential for cell adhesion, migration, and antimicrobial immunity [39]. Previous studies have shown that the FA signaling pathway plays an active role in the skin immune response of Cynoglossus semilaevis following V. vulnificus infection [40]. Our results demonstrate the sustained downregulation of FA pathway components in N. seriolae-challenged L. crocea. This suppression coincided with visible skin lesions and hemorrhages, likely resulting from both infection-induced tissue damage and husbandry-related trauma. Given the skin’s vital role as a primary physical and immunological barrier [41], the observed FA pathway inhibition suggests compromised barrier function, which may facilitate secondary infections during pathogenesis.
Host metabolic regulation plays a critical role during pathogen infection by influencing immune responses [42]. Transcriptomic analysis revealed a significant activation of oxidative phosphorylation and TCA cycle pathways at 7 and 14 dpi in N. seriolae-infected L. crocea, reflecting heightened energy demands for immune defense [43]. This metabolic shift, characterized by coordinated upregulation of pathway genes, mirrors observations in P. plecoglossicida-infected L. crocea [44], suggesting a conserved metabolic strategy for antibacterial immunity. The elevated energy metabolism likely supports resource-intensive immune processes, including leukocyte proliferation and effector molecule production, during late-stage infection.

5. Conclusions

This study provides a comprehensive transcriptomic analysis of the immune response in the L. crocea head kidney following N. seriolae infection. Our findings reveal (1) the robust activation of immune defense mechanisms, as evidenced by the enrichment of Toll-like receptor signaling, ECM–receptor interaction, cytokine–cytokine receptor interaction, and focal adhesion pathways, alongside the upregulation of key immune mediators (IL-1β, TLR5, CCL19/20, CXCR2); (2) metabolic reprogramming favoring energy production through enhanced TCA cycle activity and oxidative phosphorylation; and (3) histopathological confirmation of granuloma formation as a host defense strategy.
While this study provides valuable insights into molecular immune responses in the head kidney, its scope is limited in terms of organ coverage and mechanistic depth. Future investigations should employ multi-omics approaches (proteomics, metabolomics, and single-cell RNA sequencing) across key immune organs (e.g., spleen, liver). Additionally, in situ hybridization and immunohistochemical analyses would provide further validation and spatial resolution of gene expression patterns. These advancements will deepen our understanding of host–pathogen interactions and contribute to the development of effective disease control strategies.

Author Contributions

L.Y.: Investigation, Writing—original draft, Writing—review and editing. Z.B.: Investigation, Writing—original draft. K.H.: Investigation, Writing—original draft. R.M.: Investigation, Writing—original draft. S.Z.: Project administration, Resources, Writing—review and editing. J.J.: Project administration, Resources, Supervision. C.F.: Project administration, Resources, Supervision. J.X.: Conceptualization, Funding acquisition, Investigation, Project administration, Resources, Supervision, Writing—original draft, Writing—review and editing. All authors have read and agreed to the published version of the manuscript.

Funding

This research was supported by the Ningbo Natural Science Foundation (No. 2024J015), the National Natural Science Foundation of China (No. 42106105), and the Ningbo Yongjiang Talent Introduction Programme (No. 2021B-029-C). The funders had no role in study design, data collection, analysis, decision to publish, or preparation of the manuscript.

Institutional Review Board Statement

All procedures involving the fish were conducted in accordance with the guidelines set by the Ningbo University Council of Animal Care under the protocol number NBU20210046.

Informed Consent Statement

Not applicable.

Data Availability Statement

The data presented in this study are available on request from the corresponding author.

Acknowledgments

We would like to thank Novogene Co., Ltd. for their support in this study.

Conflicts of Interest

The authors declare no conflicts of interest.

Appendix A

Table A1. Primers used for qPCR verification of differently expressed genes.
Primer NameForward PrimerReverse Primer
β-actinGTGATGGTTGGTATGGGCCA TCGATGGGGTACTTCAGGGT
CDHEGTGTGGATAAGGAGACGGGCACGTTCCTCAATGGTGGGTG
CDH5TGCAAACCTGCGTTTTCCTGGCTGTGACCGCTCCTATGTT
TRX1ACTGTATGCCCACGTTCCAGCTATGACGTGCCAGCTTTTCTT
LAMPACGATCAACACCACCTACCGTGGAGTTACGGTTGTAGCGG
CXCL12GTCAACAACATCCCACGAAGCGCTTGGCAATCACTTGGAAGG
IL7RTGGCAACACACAGGACAACTTAGGATGAGGGATGCTTGGC
CXCR3TCTCTTGGGCACCGTACAACGGTTCAGAGCACAATGCGAC
CARD9GGACGGAGTGTGTGAGGATGTGTCGGAGGTATGGGGTGAT
MKK4GATAAGCCTGTCTGGAGTGTCCGACGACTCGATGCTGTGTGT
Table A2. Summary of the L. crocea transcriptome assembly.
SamplesRaw ReadsRaw BasesClean ReadsClean BasesError RateQ20Q30GC
N_HK_445,270,9806.79G43,075,4766.46G0.0198.0995.4447.84
N_HK_546,974,8007.05G44,636,1026.7G0.0198.1495.5747.98
N_HK_640,982,1866.15G38,848,0965.83G0.0198.0395.3747.55
N_HK_740,274,0046.04G38,171,0125.73G0.0198.0295.2848.5
P_HK_1d_547,345,3127.1G44,994,3786.75G0.0198.0895.4848.22
P_HK_1d_645,743,5886.86G43,437,7766.52G0.0198.0295.347.81
P_HK_1d_747,512,6087.13G45,120,6366.77G0.0198.0395.3347.91
P_HK_1d_856,976,1328.55G54,292,3048.14G0.0197.9995.3246.91
P_HK_3d_648,648,1227.3G46,120,9066.92G0.0197.9695.247.53
P_HK_3d_746,225,3326.93G44,490,2206.67G0.0198.0795.4745.84
P_HK_3d_850,153,9887.52G47,511,6087.13G0.0197.9895.2745.81
P_HK_3d_944,439,9586.67G42,185,0686.33G0.0198.1295.5548.21
P_HK_7d_646,642,4547G44,231,9646.63G0.0198.0195.2248.68
P_HK_7d_744,570,0786.69G42,994,8506.45G0.0197.7894.647.08
P_HK_7d_843,698,1426.55G42,023,4546.3G0.0197.8794.7847.93
P_HK_7d_948,596,3987.29G47,487,7327.12G0.0197.5193.1646.78
P_HK_14d_641,531,4086.23G39,872,0205.98G0.0197.6994.547.71
P_HK_14d_745,741,0406.86G44,079,9566.61G0.0197.8694.7848.03
P_HK_14d_848,603,6587.29G46,527,0646.98G0.0197.7194.5346.74
P_HK_14d_950,941,4807.64G48,972,8607.35G0.0197.8894.8648.18

References

  1. Chen, Y.-J.; Lin, L.-S.; Li, Y.; Zhang, J.; Song, P.-Q.; Zhang, R.; Zhong, Z.-H. Research review of fish species diversity in taiwan strait. Acta Hydrobiol. Sin. 2016, 40, 157–164. [Google Scholar]
  2. Yan, L.-T.; Jiang, Y.; Xu, Q.; Ding, G.-M.; Chen, X.-Y.; Liu, M. Reproductive dynamics of the large yellow croaker Larimichthys crocea (Sciaenidae), A commercially important fishery species in China. Front. Mar. Sci. 2022, 9, 154–196. [Google Scholar] [CrossRef]
  3. Hu, F.; Zhong, H.; Wu, C.; Wang, S.; Guo, Z.; Tao, M.; Zhang, C.; Gong, D.; Gao, X.; Tang, C.; et al. Development of fisheries in China. Reprod. Breed. 2021, 1, 64–79. [Google Scholar] [CrossRef]
  4. Zeng, J.; Long, F.; Wang, J.; Zhao, J.; Ke, Q.; Gong, J.; Bai, Y.; Deng, Y.; Jiang, P.; Qu, A.; et al. GWAS reveals heritable individual variations in the inherent swimming performance of juvenile large yellow croaker. Aquaculture. 2022, 559, 738419. [Google Scholar] [CrossRef]
  5. Beaman, B.L.; Beaman, L. Nocardia species: Host-parasite relationships. Clin. Microbiol. Rev. 1994, 7, 213–264. [Google Scholar] [CrossRef] [PubMed]
  6. Maekawa, S.; Yoshida, T.; Wang, P.C.; Chen, S.C. Current knowledge of nocardiosis in teleost fish. J. Fish. Dis. 2018, 41, 413–419. [Google Scholar] [CrossRef] [PubMed]
  7. Itano, T.; Kawakami, H.; Kono, T.; Sakai, M. Experimental induction of nocardiosis in yellowtail, Seriola quinqueradiata Temminck and Schlegel by artificial challenge. J. Fish Dis. 2006, 29, 529–534. [Google Scholar] [CrossRef]
  8. Chen, J.; Chen, Z.; Wang, W.; Hou, S.; Cai, J.; Xia, L.; Lu, Y. Development of DNA vaccines encoding ribosomal proteins (RplL and RpsA) against Nocardia seriolae infection in fish. Fish Shellfish Immunol. 2020, 96, 201–212. [Google Scholar] [CrossRef]
  9. Xi, Q. RNA-Seq technology and its application in fish transcriptomics. Omics A J. Integr. Biol. 2014, 18, 98–110. [Google Scholar]
  10. Li, Q.; Ai, Q.; Mai, K.; Xu, W.; Zheng, Y. In vitro effects of arachidonic acid on immune functions of head kidney macrophages isolated from large yellow croaker (Larmichthys crocea). Aquaculture 2012, 330, 47–53. [Google Scholar] [CrossRef]
  11. Liu, Y.; Chen, G.; Xia, L.; Lu, Y. A review on the pathogenic bacterium Nocardia seriolae: Aetiology, pathogenesis, diagnosis and vaccine development. Rev. Aquac. 2022, 15, 14–34. [Google Scholar] [CrossRef]
  12. Casadevall, A.; Pirofski, L.A. Host-pathogen interactions: Basic concepts of microbial commensalism, colonization, infection, and disease. Infect. Immun. 2000, 68, 6511–6518. [Google Scholar]
  13. Huang, X.; Liu, S.; Chen, X.; Zhang, H.; Yao, J.; Geng, Y.; Ou, Y.; Chen, D.; Yin, L.; Li, L.; et al. Comparative pathological description of nocardiosis in largemouth bass (Micropterus salmoides) and other Perciformes. Aquaculture 2021, 534, 736193. [Google Scholar] [CrossRef]
  14. Bransden, M.P.; Carson, J.; Munday, B.L.; Handlinger, J.H.; Carter, C.G.; Nowak, B.F. Nocardiosis in tank-reared Atlantic salmon, Salmo salar L. J. Fish Dis. 2000, 23, 83–85. [Google Scholar]
  15. Zhang, Y.; Hu, J.; Li, Y.; Yuan, F.; Yan, K.; Gu, W.; Zhang, M.; Li, Y.; Huang, X.; Zhang, C.; et al. Immune strategies of silver pomfret (Pampus argenteus) infected with Nocardia seriolae at different infection stages. Aquaculture 2024, 582, 740449. [Google Scholar]
  16. Zhou, T.; Cai, P.; Li, J.; Dan, X.; Li, Z. Pathological variations and immune response in Channa argus infected with pathogenic Nocardia seriolae strain. Fish Shellfish Immunol. 2024, 150, 109554. [Google Scholar] [PubMed]
  17. Itano, T.; Nakaoka, N.; Kawakami, H.; Kono, T.; Sakai, M. Comparison of Sensitivity between Yellowtail Seriola quinqueradiata and Red Sea Bream Pagrus major to Nocardia seriolae. Fish Pathol. 2006, 41, 135–139. [Google Scholar]
  18. Medzhitov, R.; Janeway, C., Jr. Innate immunity. N. Engl. J. Med. 2000, 343, 338–344. [Google Scholar]
  19. Akira, S.; Uematsu, S.; Takeuchi, O. Pathogen recognition and innate immunity. Cell 2006, 124, 783–801. [Google Scholar]
  20. Dong, Y.; Wen, H.; Zhang, Y.; Qi, X.; Wang, L.; Li, H.; Zhang, K.; Li, Y. Unveiling the molecular regulatory mechanisms of immune responses in the spleen of spotted sea bass (Lateolabrax maculatus) against Nocardia seriolae infection. Aquaculture 2024, 592, 741178. [Google Scholar] [CrossRef]
  21. Mogensen, T.H. Pathogen recognition and inflammatory signaling in innate immune defenses. Clin. Microbiol. Rev. 2009, 22, 240–273. [Google Scholar]
  22. Dinarello, C.A. Interleukin-1 in the pathogenesis and treatment of inflammatory diseases. Blood 2011, 117, 3720–3732. [Google Scholar] [CrossRef]
  23. Rauta, P.R.; Samanta, M.; Dash, H.R.; Nayak, B.; Das, S. Toll-like receptors (TLRs) in aquatic animals: Signaling pathways, expressions and immune responses. Immunol. Lett. 2014, 158, 14–24. [Google Scholar] [PubMed]
  24. El-Zayat, S.R.; Sibaii, H.; Mannaa, F.A.E. Toll-like receptors activation, signaling, and targeting: An overview. Bull. Natl. Res. Cent. 2019, 43, 1–12. [Google Scholar]
  25. Kawai, T.; Akira, S. The role of pattern-recognition receptors in innate immunity: Update on Toll-like receptors. Nat. Immunol. 2010, 11, 373–384. [Google Scholar]
  26. Celhar, T.; Magalhães, R.; Fairhurst, A.M. TLR7 and TLR9 in SLE: When sensing self goes wrong. Immunol. Res. 2012, 53, 58–77. [Google Scholar] [PubMed]
  27. Uematsu, S.; Fujimoto, K.; Jang, M.H.; Yang, B.G.; Jung, Y.J.; Nishiyama, M.; Sato, S.; Tsujimura, T.; Yamamoto, M.; Yokota, Y.; et al. Regulation of humoral and cellular gut immunity by lamina propria dendritic cells expressing Toll-like receptor 5. Nat. Immunol. 2008, 9, 769–776. [Google Scholar]
  28. Ribeiro, C.M.; Hermsen, T.; Taverne-Thiele, A.J.; Savelkoul, H.F.; Wiegertjes, G.F. Evolution of recognition of ligands from Gram-positive bacteria: Similarities and differences in the TLR2-mediated response between mammalian vertebrates and teleost fish. J. Immunol. 2010, 184, 2355–2368. [Google Scholar]
  29. Tomlin, H.; Piccinini, A.M. A complex interplay between the extracellular matrix and the innate immune response to microbial pathogens. Immunology 2018, 155, 186–201. [Google Scholar]
  30. Bhattacharjee, O.; Ayyangar, U.; Kurbet, A.S.; Ashok, D.; Raghavan, S. Unraveling the ECM-Immune Cell Crosstalk in Skin Diseases. Front. Cell Dev. Biol. 2019, 7, 68. [Google Scholar]
  31. Gulati, K.; Guhathakurta, S.; Joshi, J.; Rai, N.; Ray, A.J. Cytokines and their role in health and disease: A brief overview. MOJ Immunol. 2016, 4, 00121. [Google Scholar]
  32. Bonecchi, R.; Galliera, E.; Borroni, E.M.; Corsi, M.M.; Locati, M.; Mantovani, A. Chemokines and chemokine receptors: An overview. Front. Biosci. 2009, 14, 540–551. [Google Scholar] [CrossRef] [PubMed]
  33. Liu, X.; Kang, L.; Liu, W.; Lou, B.; Wu, C.; Jiang, L. Molecular characterization and expression analysis of the large yellow croaker (Larimichthys crocea) chemokine receptors CXCR2, CXCR3, and CXCR4 after bacterial and poly I:C challenge. Fish Shellfish Immunol. 2017, 70, 228–239. [Google Scholar] [CrossRef]
  34. Takamura, K.; Fukuyama, S.; Nagatake, T.; Kim, D.Y.; Kawamura, A.; Kawauchi, H.; Kiyono, H. Regulatory role of lymphoid chemokine CCL19 and CCL21 in the control of allergic rhinitis. J. Immunol. 2007, 179, 5897–5906. [Google Scholar] [CrossRef]
  35. Nawaz, M.; Gouife, M.; Zhu, S.; Yue, X.; Huang, K.; Ma, R.; Jiang, J.; Jin, S.; Zhu, J.; Xie, J. Transcriptome profiling and differential expression analysis of altered immune-related genes in goldfish (Carassius auratus) infected with Aeromonas hydrophila. Fish Shellfish Immunol. 2023, 137, 108789. [Google Scholar] [CrossRef] [PubMed]
  36. Zhou, J.; Yu, J.; Chu, Q. Comparative transcriptome analysis reveals potential regulatory mechanisms of genes and immune pathways following Vibrio harveyi infection in red drum (Sciaenops ocellatus). Fish Shellfish Immunol. 2024, 146, 109386. [Google Scholar] [CrossRef]
  37. Stansberg, C.; Subramaniam, S.; Collet, B.; Secombes, C.J.; Cunningham, C. Cloning of the Atlantic salmon (Salmo salar) IL-1 receptor associated protein. Fish Shellfish Immunol. 2005, 19, 53–65. [Google Scholar] [CrossRef]
  38. Li, X.; chen, f.; Kong, J.; Shang, B.; li, z.; Du, Q.; Zhang, X.; Shen, X. Transcriptome analysis of Aeromonas hydrophila infected Channel catfish (Ictalurus punctatus). Res. Sq. 2024, 8, 17925. [Google Scholar]
  39. Brown, N.D.; Vomhof-DeKrey, E.E. Focal Adhesion Kinase and Colony Stimulating Factors: Intestinal Homeostasis and Innate Immunity Crosstalk. Cells 2024, 13, 1178. [Google Scholar] [CrossRef]
  40. Liu, H.; Hu, X.; Lian, Z.; Luo, Z.; Lv, A.; Tan, J. Focal adhesion signaling pathway involved in skin immune response of tongue sole Cynoglossus semilaevis to Vibrio vulnificus infection. Fish Shellfish Immunol. 2023, 135, 108651. [Google Scholar] [CrossRef]
  41. Esteban, M.Á. An Overview of the Immunological Defenses in Fish Skin. Int. Sch. Res. Not. 2012, 2012, 1–29. [Google Scholar]
  42. Ganeshan, K.; Chawla, A. Metabolic regulation of immune responses. Annu. Rev. Immunol. 2014, 32, 609–634. [Google Scholar] [CrossRef] [PubMed]
  43. Yin, F.; Gong, H.; Ke, Q.; Li, A. Stress, antioxidant defence and mucosal immune responses of the large yellow croaker Pseudosciaena crocea challenged with Cryptocaryon irritans. Fish Shellfish Immunol. 2015, 47, 344–351. [Google Scholar] [CrossRef] [PubMed]
  44. Zhang, Y.; Lu, L.; Li, C.; Shao, G.; Chen, X. Transcriptome analysis revealed multiple immune processes and energy metabolism pathways involved in the defense response of the large yellow croaker Larimichthys crocea against Pseudomonas plecoglossicida. Comp. Biochem. Physiol. Part. D Genom. Proteom. 2021, 40, 100886. [Google Scholar] [CrossRef]
Figure 1. Clinical signs of L. crocea following N. seriolae challenge. (a) External bleeding and ulcerations, with hemorrhaging observed in the fins (red arrows); (b) abdominal swelling (black circles); (c) multiple yellow-white nodules in the liver, spleen, head kidney, and trunk kidney (yellow arrows).
Fishes 10 00167 g001
Figure 2. HE-stained sections of visceral tissue from L. crocea infected with N. seriolae. (a) Normal liver. (b) Liver at 1 dpi: Initial hepatocyte deformation. (c) Liver at 3 dpi: Pronounced hepatocyte deformation with vacuolization and cellular hemorrhage. (d) Liver at 7 dpi: Nodule formations appear; thin layers of fibrous connective tissue and a small number of lymphocytes can be observed around the nodule. (e) Liver at 14 dpi: Nodules enlarge with distinct boundaries; the nodules are encapsulated by a dense layer of lymphocytes and fibrous connective tissue. (f) Normal spleen. (g) Spleen at 1 dpi: Onset of hemosiderin deposition and cellular hemorrhage. (h) Spleen at 3 dpi: Increased hemosiderin deposition with aggravated cellular hemorrhage. (i) Spleen at 7 dpi: Nodular formations appear; thin layers of fibrous connective tissue and a small number of lymphocytes can be observed around the nodule. (j) Spleen at 14 dpi: Enlarged nodules with defined boundaries and darkened centers; the nodules are encapsulated by a dense layer of lymphocytes and fibrous connective tissue. (k) Normal head kidney. (l) Head kidney at 1 dpi: Hemosiderin deposition observed. (m) Head kidney at 3 dpi: Cellular hemorrhage present. (n) Head kidney at 7 dpi: Nodules with indistinct boundaries appear, and thin layers of fibrous connective tissue and a small number of lymphocytes can be observed around the nodule. (o) Head kidney at 14 dpi: Multiple nodules with distinct boundaries and darkened centers; the nodules are encapsulated by a dense layer of lymphocytes and fibrous connective tissue. (p) Normal trunk kidney. (q) Trunk kidney at 1 dpi: No significant changes. (r) Trunk kidney at 3 dpi: Hemosiderin deposition observed. (s) Trunk kidney at 7 dpi: Nodules with distinct boundaries and severe deformation of renal tubules; thin layers of fibrous connective tissue and a small number of lymphocytes can be observed around the nodule. (t) Trunk kidney at 14 dpi: Multiple nodules with distinct boundaries and darkened centers; the nodules are encapsulated by a dense layer of lymphocytes and fibrous connective tissue. (Black arrows indicate granulomatous nodules, while red arrows represent hemosiderin deposits.).
Fishes 10 00167 g002
Figure 3. (a) Heatmap of correlation coefficients (horizontal and vertical axes represent the squared correlation coefficients between samples). (b) PCA plot of gene expression levels (horizontal axis represents the first principal component, and the vertical axis represents the second principal component). (c) Heatmap of DEGs (horizontal axis indicates sample names, and the vertical axis shows normalized FPKM values of DEGs). The color gradient reflects expression levels, with red indicating higher expression and green indicating lower expression.
Fishes 10 00167 g003aFishes 10 00167 g003b
Figure 4. Volcano plots of DEGs. (a) P1 (1 dpi). (b) P3 (3 dpi). (c) P7 (7 dpi). (d) P14 (14 dpi). Upregulated genes are represented by red points, downregulated genes by green points, and non-differential genes by blue points.
Fishes 10 00167 g004
Figure 5. GO term enrichment analysis bar graphs. (a) P1 (1 dpi). (b) P3 (3 dpi). (c) P7 (7 dpi). (d) P14 (14 dpi). The x-axis represents the GO terms, while the y-axis indicates the significance level of GO term enrichment, with higher values reflecting greater significance. Numbers on each bar represent the count of DEGs associated with each term. Different colors correspond to the three GO subcategories: biological process (BP), cellular component (CC), and molecular function (MF).
Fishes 10 00167 g005
Figure 6. Scatter plots of KEGG pathway enrichment analysis. (a) P1 (1 dpi). (b) P3 (3 dpi). (c) P7 (7 dpi). (d) P14 (14 dpi). The x-axis represents the ratio of DEGs annotated to each KEGG pathway relative to the total number of DEGs, while the y-axis indicates KEGG pathways. Point size reflects the number of genes annotated to each pathway, and color gradients from red to purple represent the significance of enrichment.
Fishes 10 00167 g006
Figure 7. qPCR validation of eight immune-related DEGs in L. crocea. The selected DEGs include cadherin 1 (CDHE) (a), cadherin-5 (CDH5) (b), thioredoxin (TRX1) (c), lysosome-associated membrane glycoprotein 1 (LAMP) (d), C-X-C chemokine receptor type 3 (CXCR3) (e), caspase recruitment domain-containing protein 9 (CARD9) (f), interleukin 7 receptor (IL7R) (g), and mitogen-activated protein kinase kinase 4 (MKK4) (h). Data represent means from three independent experiments, with error bars indicating SEM (* p < 0.05, ** p < 0.01, *** p < 0.001, **** p < 0.0001).
Fishes 10 00167 g007
Disclaimer/Publisher’s Note: The statements, opinions and data contained in all publications are solely those of the individual author(s) and contributor(s) and not of MDPI and/or the editor(s). MDPI and/or the editor(s) disclaim responsibility for any injury to people or property resulting from any ideas, methods, instructions or products referred to in the content.

