Article

Establishing the Physiological Values of Minimally Invasive Biomarkers in Gilthead Sea Bream (Sparus aurata)

by
Rafael Angelakopoulos
,
Andreas Tsipourlianos
,
Alexia E. Fytsili
and
Katerina A. Moutou
*
Laboratory of Genetics, Comparative and Evolutionary Biology, Department of Biochemistry and Biotechnology, University of Thessaly, 41500 Larissa, Greece
*
Author to whom correspondence should be addressed.
Fishes 2025, 10(2), 52; https://doi.org/10.3390/fishes10020052
Submission received: 30 December 2024 / Revised: 24 January 2025 / Accepted: 27 January 2025 / Published: 28 January 2025
(This article belongs to the Special Issue Environmental Physiology of Aquatic Animals)

Abstract

:
Peripheral blood has been always used as the mirror of physiological status in a minimally invasive manner. In homeothermic vertebrates, different blood parameters have been correlated to a variety of biochemical and physiological processes and the establishment of physiological values have rendered them valuable indicators for research, diagnosis, and welfare status. Despite the volume of research in fish physiology and teleost significance for food security, information about the physiological values of minimally invasive biomarkers is still fragmented while there is a great need for such biomarkers for monitoring fish health, welfare, and factors that can impact their homeostasis. For the first time, we have focused on determining the physiological ranges of cholesterol, triglycerides, and total proteins in the plasma of gilthead sea bream (Sparus aurata) and detecting how size, diet, environment, and genetic background may influence these levels. A large heterogeneous dataset of 5318 healthy individuals of two different size classes (1–100 g; 101–200 g), dietary status (10 feeds and feeding regimes), and different genetic background (125 families), in combination with different geographic locations (GxE), was produced over a period of three years and analyzed to ensure a comprehensive representation in establishing the physiological range for these biomarkers. Dietary status and GxE introduced significant variations in the range of the physiological values of all biomarkers in both size classes. Triglyceride, total protein and cholesterol values did differentiate with age/size. Interestingly, all parameters responded to diet in a size-specific way, revealing their potential as biomarkers of dietary status.
Key Contribution: This study establishes, for the first time, the physiological reference ranges for cholesterol, triglycerides, and total proteins in gilthead sea bream, highlighting their variability across size classes, diet, and environment (GxE). It demonstrates the potential of these minimally invasive biomarkers for monitoring fish health, welfare, and dietary status in aquaculture.

1. Introduction

Gilthead sea bream (Sparus aurata) is a key commercial teleost species, extensively farmed in the Mediterranean with a total production of 210,537 t annually [1,2]. Greece, Turkey, Egypt, Tunisia, Spain and Italy are the main producer countries of this species [1,3]. Sustainable fish farming must overcome a series of daily challenges imposed by environmental fluctuations and pathogens and it must ensure the dietary adequacy, health and welfare of the farmed fish. Each stressor, including dietary changes or inadequacies, is expected to affect the physiological processes of the fish, and easy-to-apply diagnostic tools are in high demand to facilitate routine operation and allow informed practical decisions.
Peripheral blood provides a minimally invasive insight into the physiological processes of an animal and it has been used for the quick monitoring of the physiological status in farmed animals [4,5]. The alterations in blood parameters are important indicators, reflecting diseases and stress responses as well as the adaptation to different conditions. These methods are not exclusive to mammals; they have also proven valuable for fish [6]. Numerous studies have examined the variations in blood parameters in fish living in different habitats or subjected to different dietary regimes [7,8,9]. However, while blood biomarkers are established tools for assessing the physiological and biochemical statuses in homeothermic vertebrates, their application in teleosts is less developed. Current studies of fish physiology often focus on the general responses to environmental stressors or diseases, while establishing baseline values of a healthy status has been largely neglected [9,10]. In commercial fish farming, the quick and precise evaluation of fishes’ physiological condition is critical from the economic as well as product quality standpoints [11].
The measurement of blood parameters is reasonably priced and simple to perform, allowing for its operational use. Several variables, such as age, sex, feeding behavior, nutritional status and environmental changes, are expected to shape the distribution of the blood parameters in fish [6]. Standardized reference values of blood biomarkers make it possible to reliably assess whether the observed changes in blood biomarkers are indicative of a normal variation or reflect underlying health issues or unbalanced physiological processes.
In mammals, the blood plasma cholesterol, triglycerides and total protein levels are indicative of metabolic health and are known to respond to dietary and environmental changes [12,13]. Despite extensive studies, establishing reference values for these blood parameters in fish remains scarce in general [14,15], and it remains unresolved in gilthead sea bream especially [16]. Establishing reference values for these biomarkers in gilthead sea bream plasma and comprehending how they change in response to various biological and environmental conditions is essential in monitoring and improving relevant farming practices. Furthermore, distinguishing the effects of genetic background, feed composition, and environmental factors on blood biomarkers offer deeper insights into fish physiology [17,18]. This, in turn, may have additional applications in selective breeding programs aiming at enhancing disease resistance in farmed fish populations [19].
The objectives of this study are twofold: (i) to establish a physiological reference range for key blood biomarkers, i.e., cholesterol, triglycerides, and total protein levels, in gilthead sea bream (Sparus aurata) plasma, and (ii) to investigate the effect of size, dietary status, genetic background, and geographical distribution on these biomarkers.

2. Materials and Methods

2.1. Ethics Statement

All examined biological materials were derived from fish reared and harvested at commercial farms, registered for aquaculture production in EU countries. Animal sampling followed routine procedures and samples were collected by a qualified staff member from standard production cycles. All sampling procedures complied with existing Greek (PD 374/2001) and EU (Council Directive 98/58/EC of 20 July 1998) guidelines concerning the protection of animals kept for farming purposes. No fishes were sacrificed in the context of this study.

2.2. Fish Sampling

Gilthead sea bream juveniles originated from seven commercial installations across Greece (Table 1). Blood samples were collected over a period of three years, resulting in a total of 5318 healthy individuals for analysis. These fish, representing a wide array of genetic backgrounds from 125 different families, were reared under standard farming practices, which included ten distinct feeding regimes across the installations. The sampled fish, with a minimum weight of 12 g, were further categorized into two size classes: 1–100 g (n = 4649) and 101–200 g (n = 669). These size classes were selected because these weight ranges correspond to periods of rapid growth in gilthead sea bream, which gradually decelerates as the fish grows. This extensive and heterogeneous dataset was thoughtfully designed to provide a comprehensive foundation for establishing physiological reference ranges for the selected biomarkers.

2.3. Blood Sampling

At sampling, all 5318 fish were carefully removed from the sea cages using a net and immediately immersed in water containing anesthetic (150 ppm ethylene glycol monophenyl ether) to minimize stress and prevent any movement. Prior to blood sampling, all of the fish were weighed. Blood samples (200–300 μL) were then collected from the caudal vein, using heparinized 1 mL insulin syringes (25G), and promptly centrifuged on site (3000× g for 5 min) to separate the plasma from blood cells. This method was employed to minimize the duration of each sampling step. Afterwards, the fish were placed in clean water to recover before being returned to their cages. The collected plasma was stored in dry ice and transported at −80 °C until further analysis.

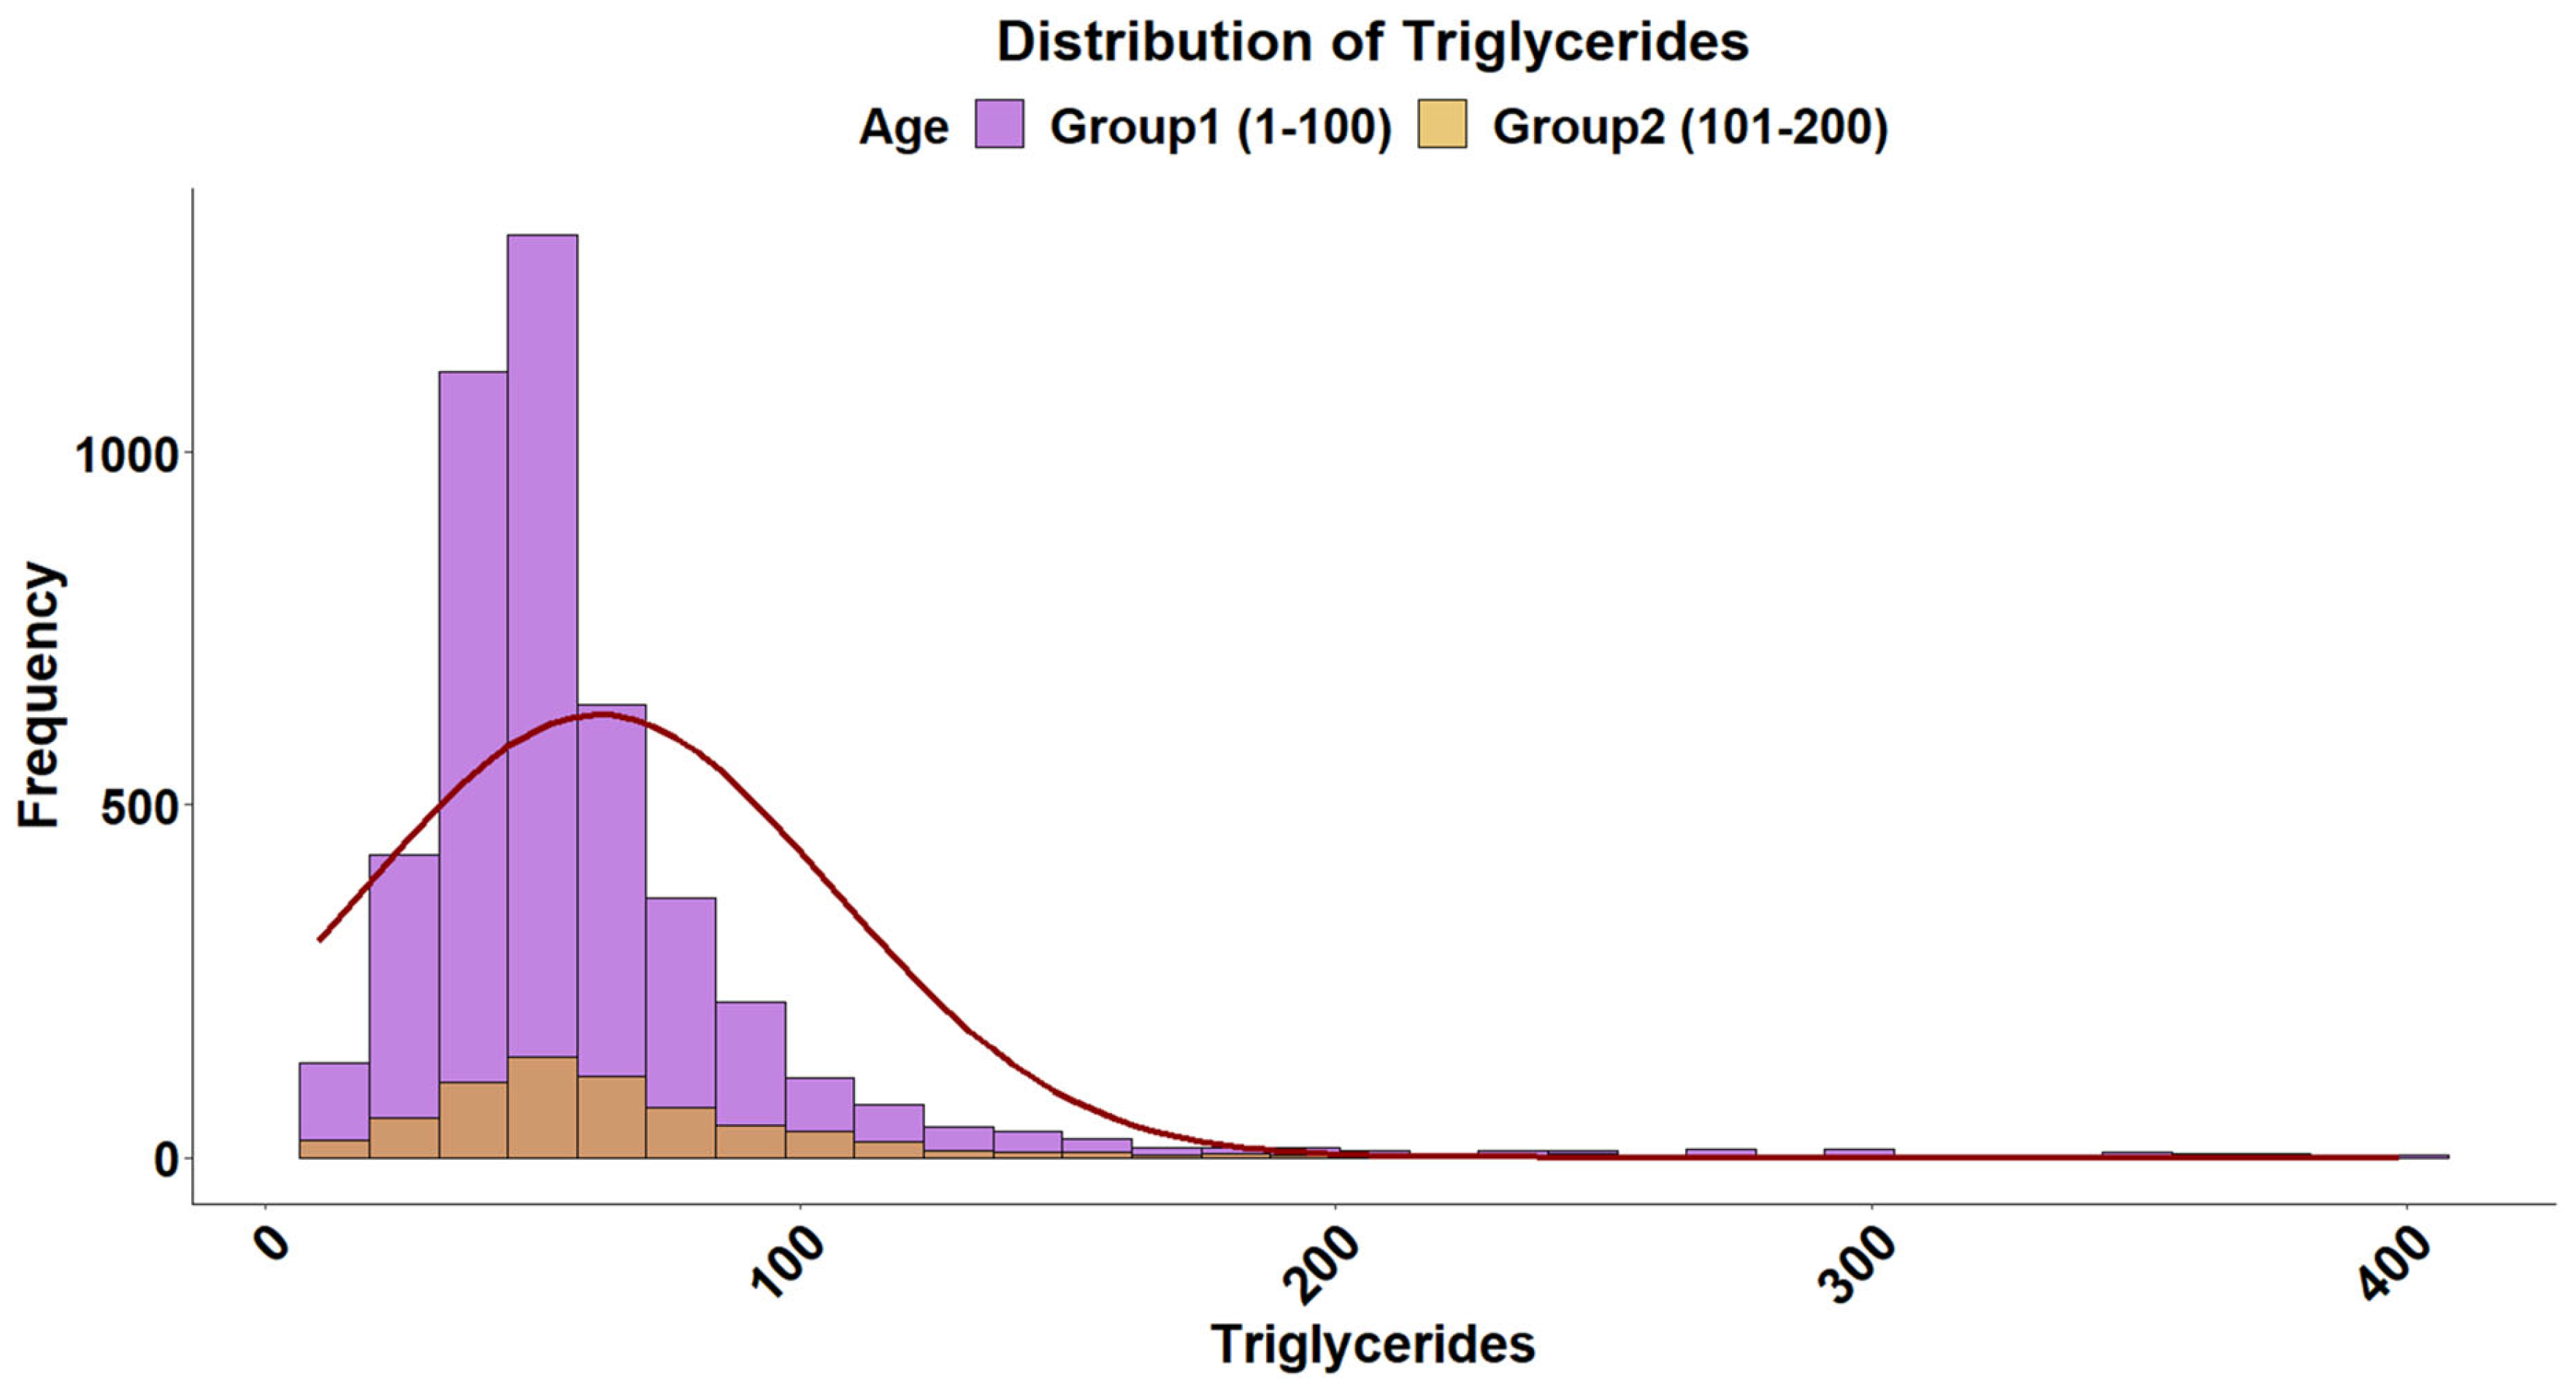
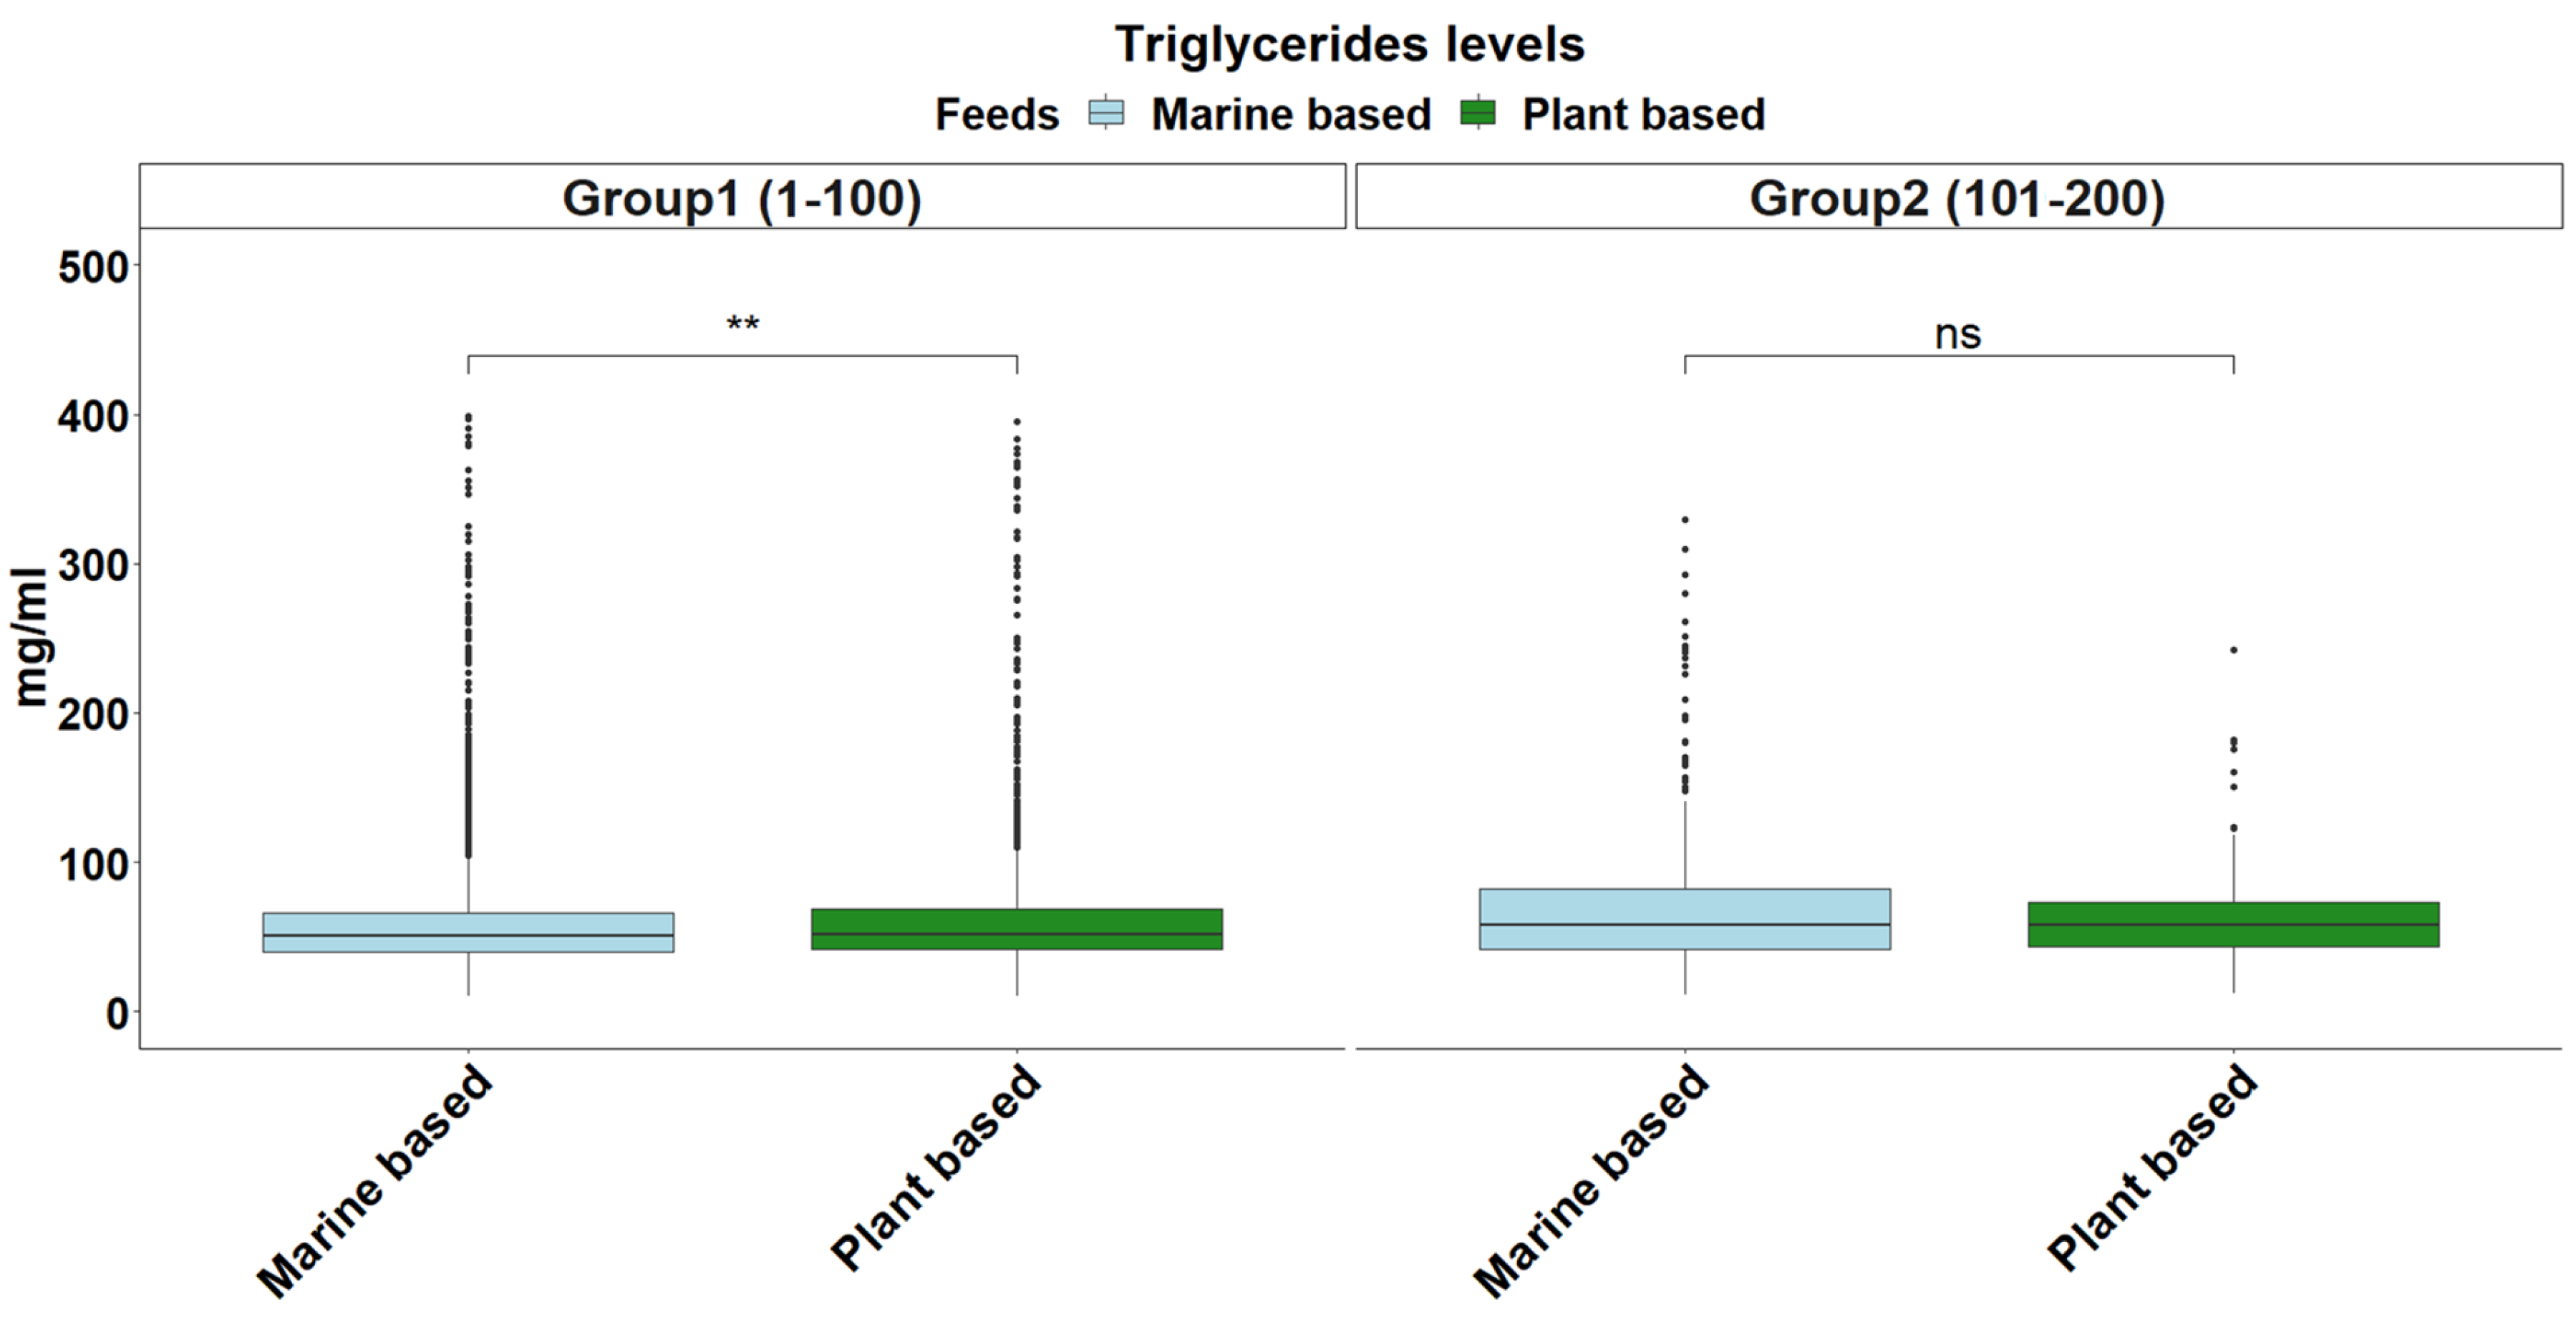
2.4. Triglyceride Levels

The triglyceride levels in plasma were determined using a colorimetric assay kit (Biosis, cat no: 000244) following the manufacturer’s protocol, with minor modifications. The assay was performed in a microplate, and the measurements were obtained using a spectrofluorometer at 510 nm (Varioskan™ LUX multimode microplate reader, Thermo Fisher, Waltham, MA, USA).

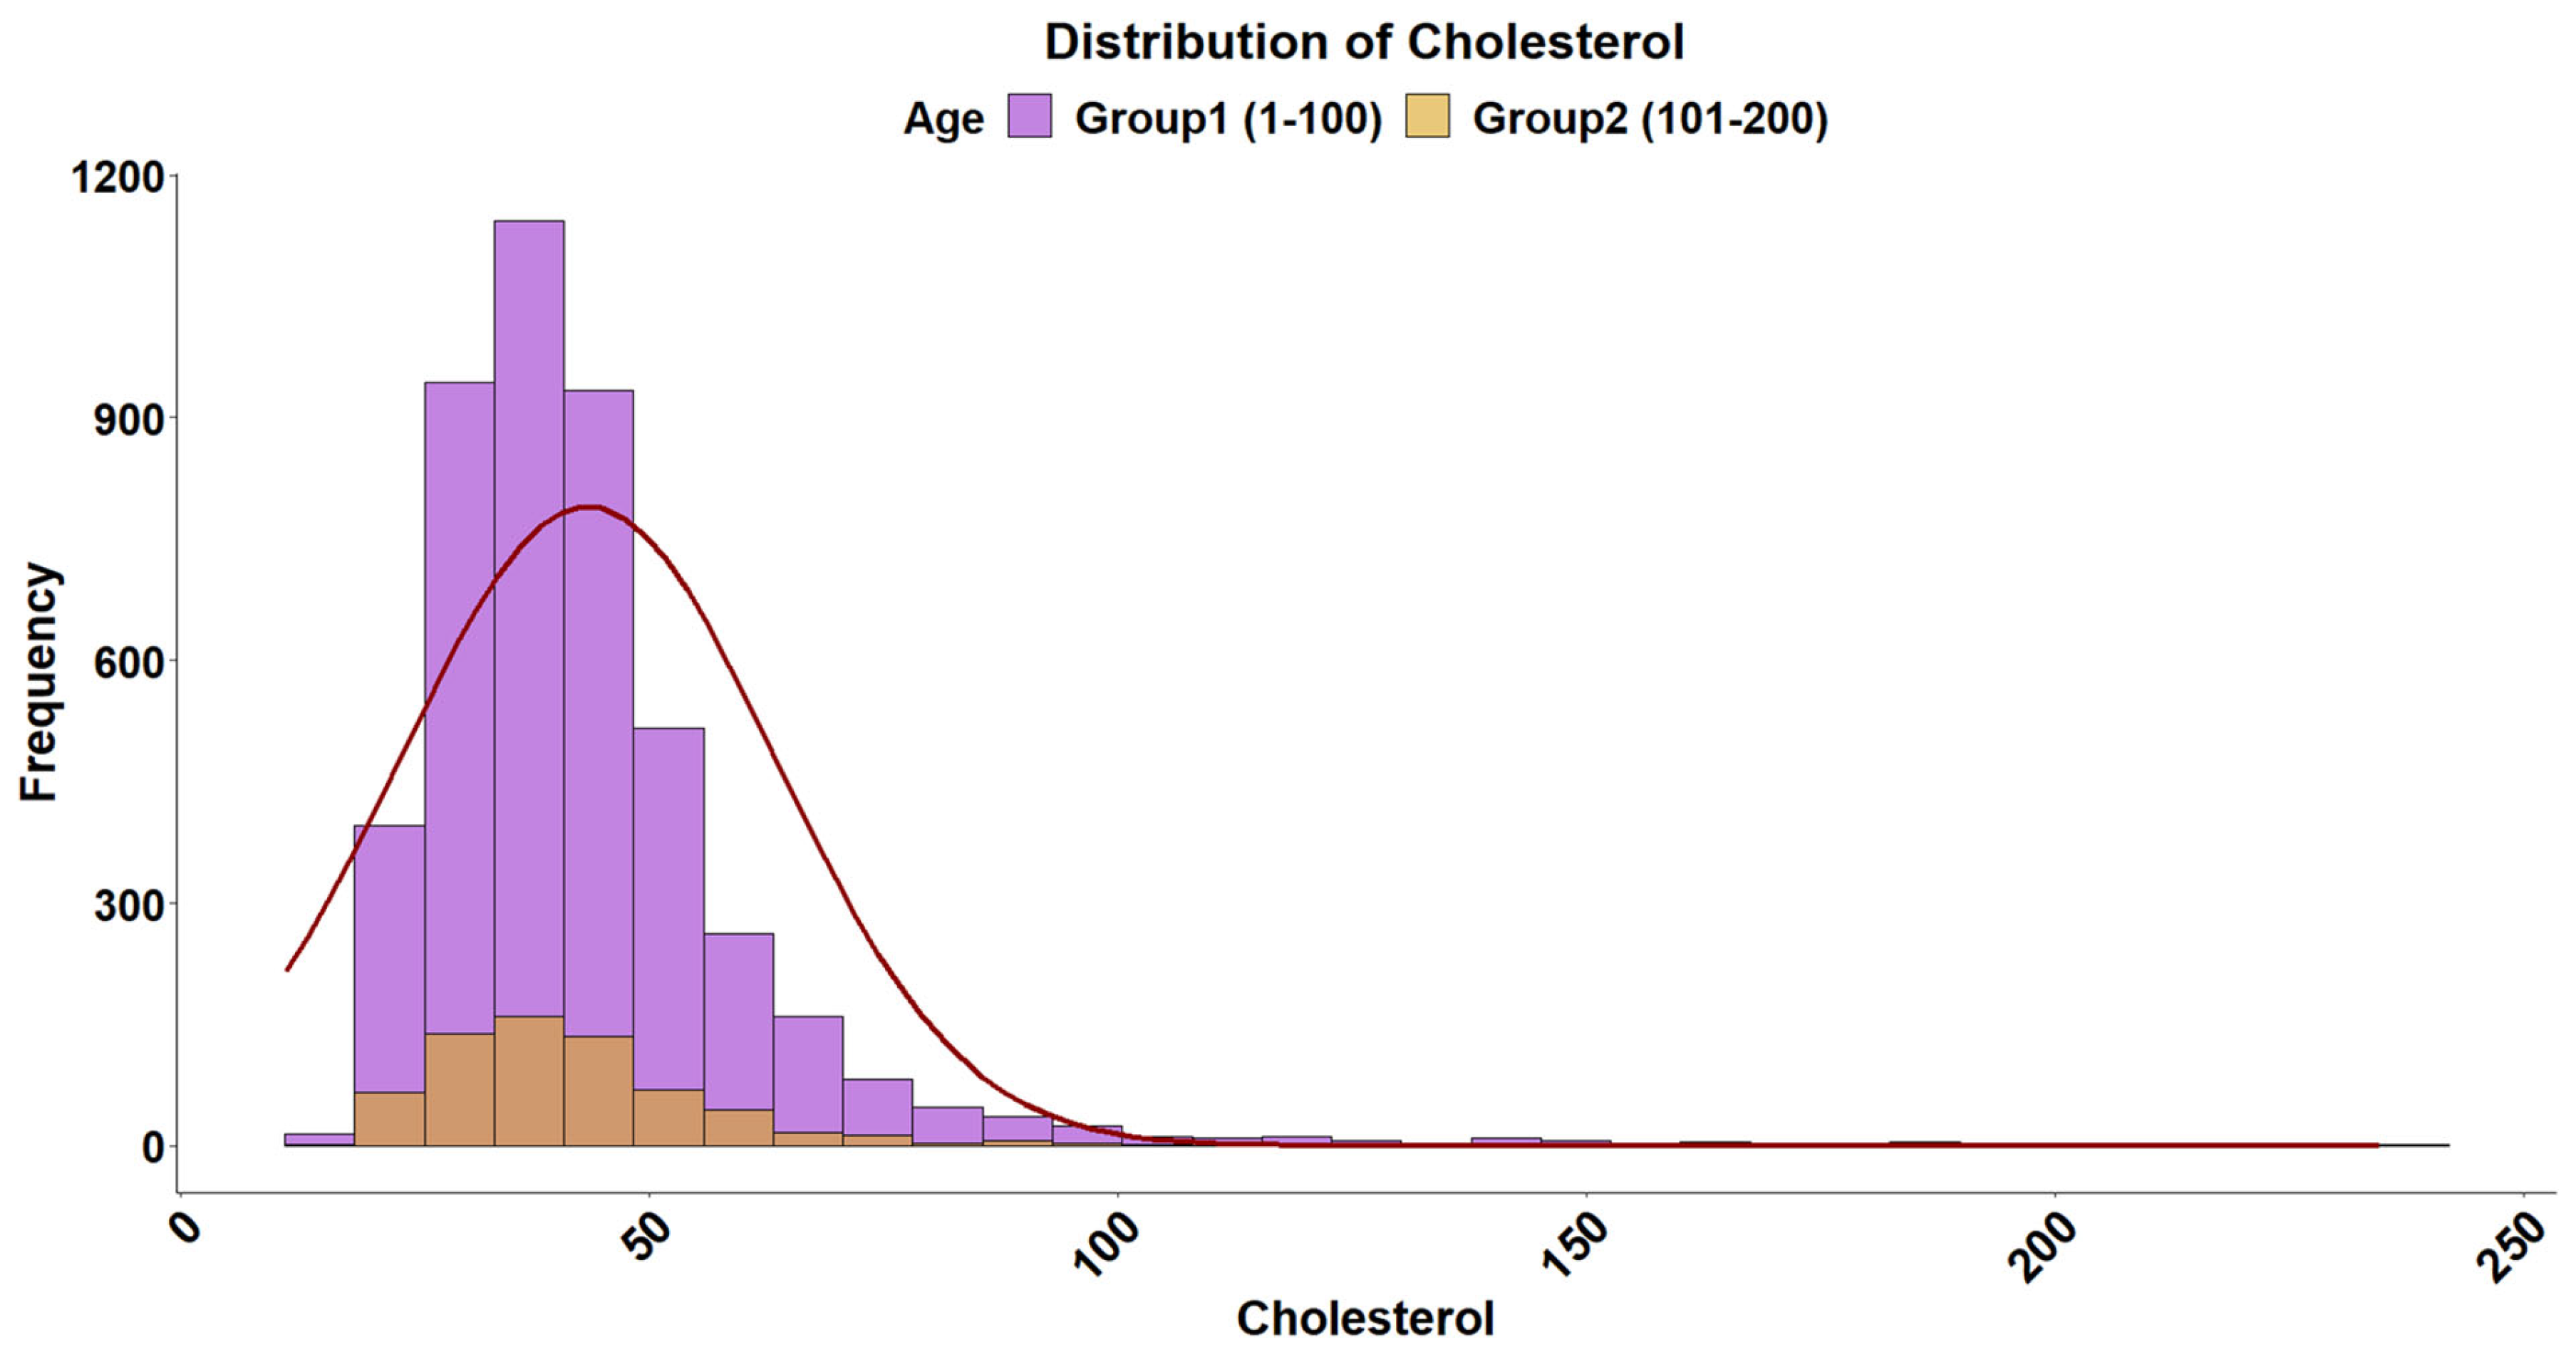
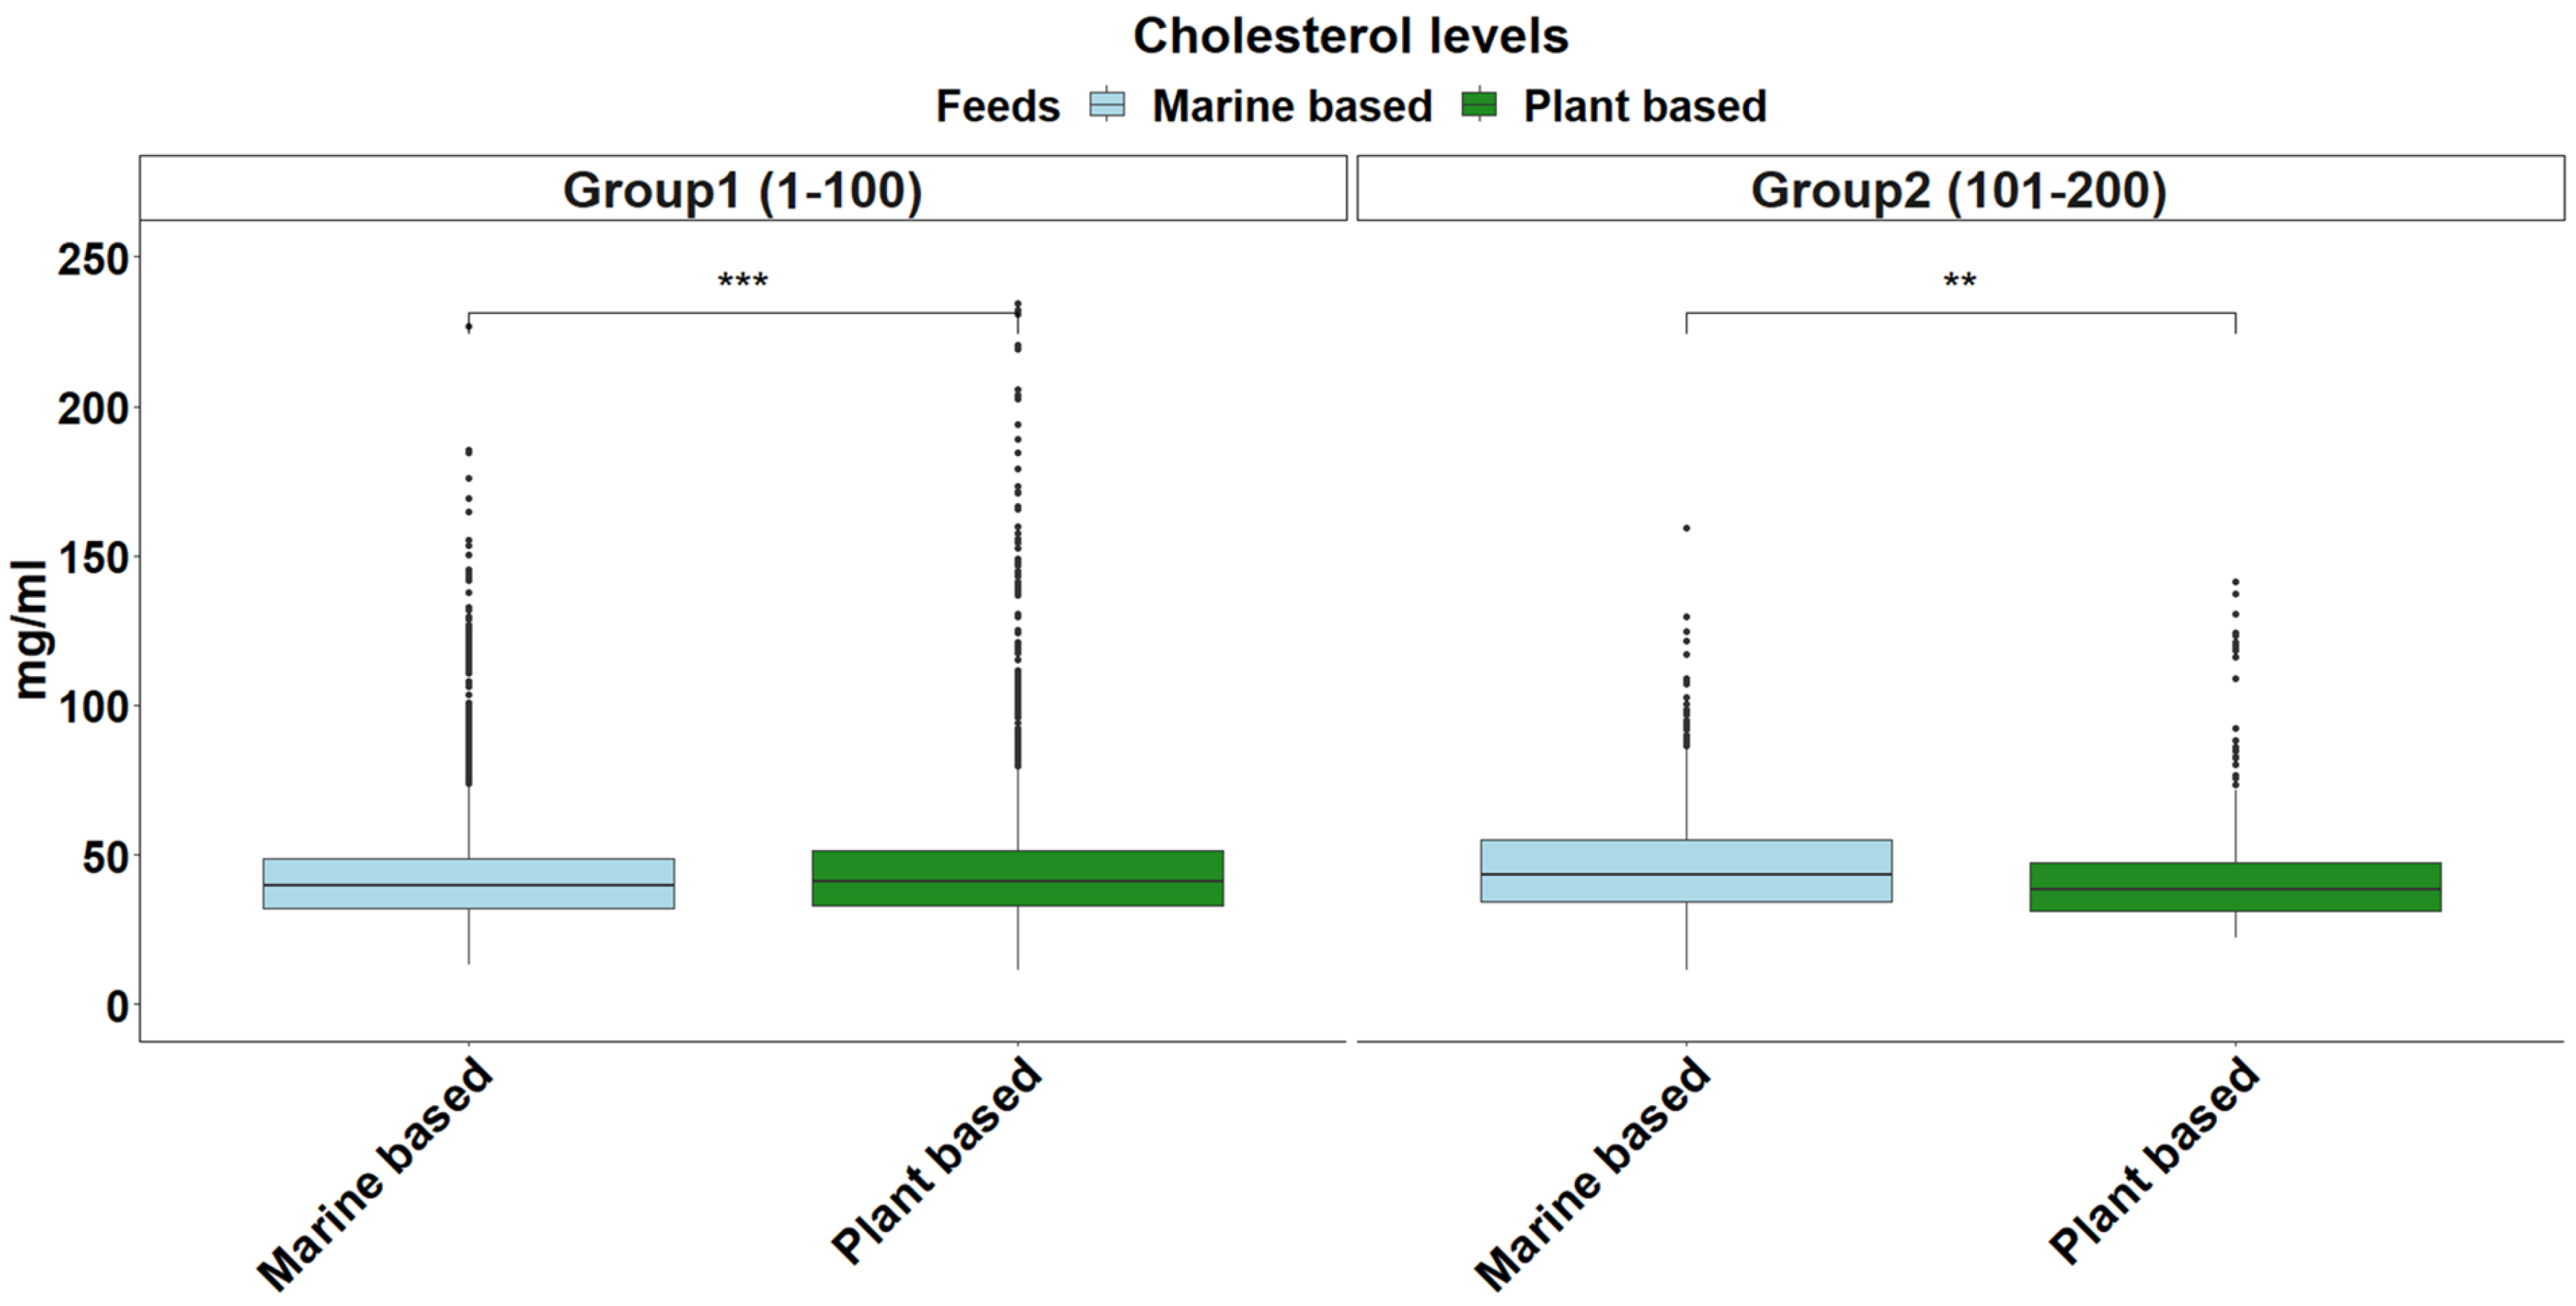
2.5. Cholesterol Levels

For the quantification of total cholesterol levels in fish plasma, a colorimetric assay kit (Biosis, cat no: 001564) was used, following the manufacturer’s protocol with slight modifications. This colorimetric reaction was measured in a microplate using a spectrofluorometer at 510 nm (Varioskan™ LUX multimode microplate reader, Thermo Fisher, Waltham, MA, USA).

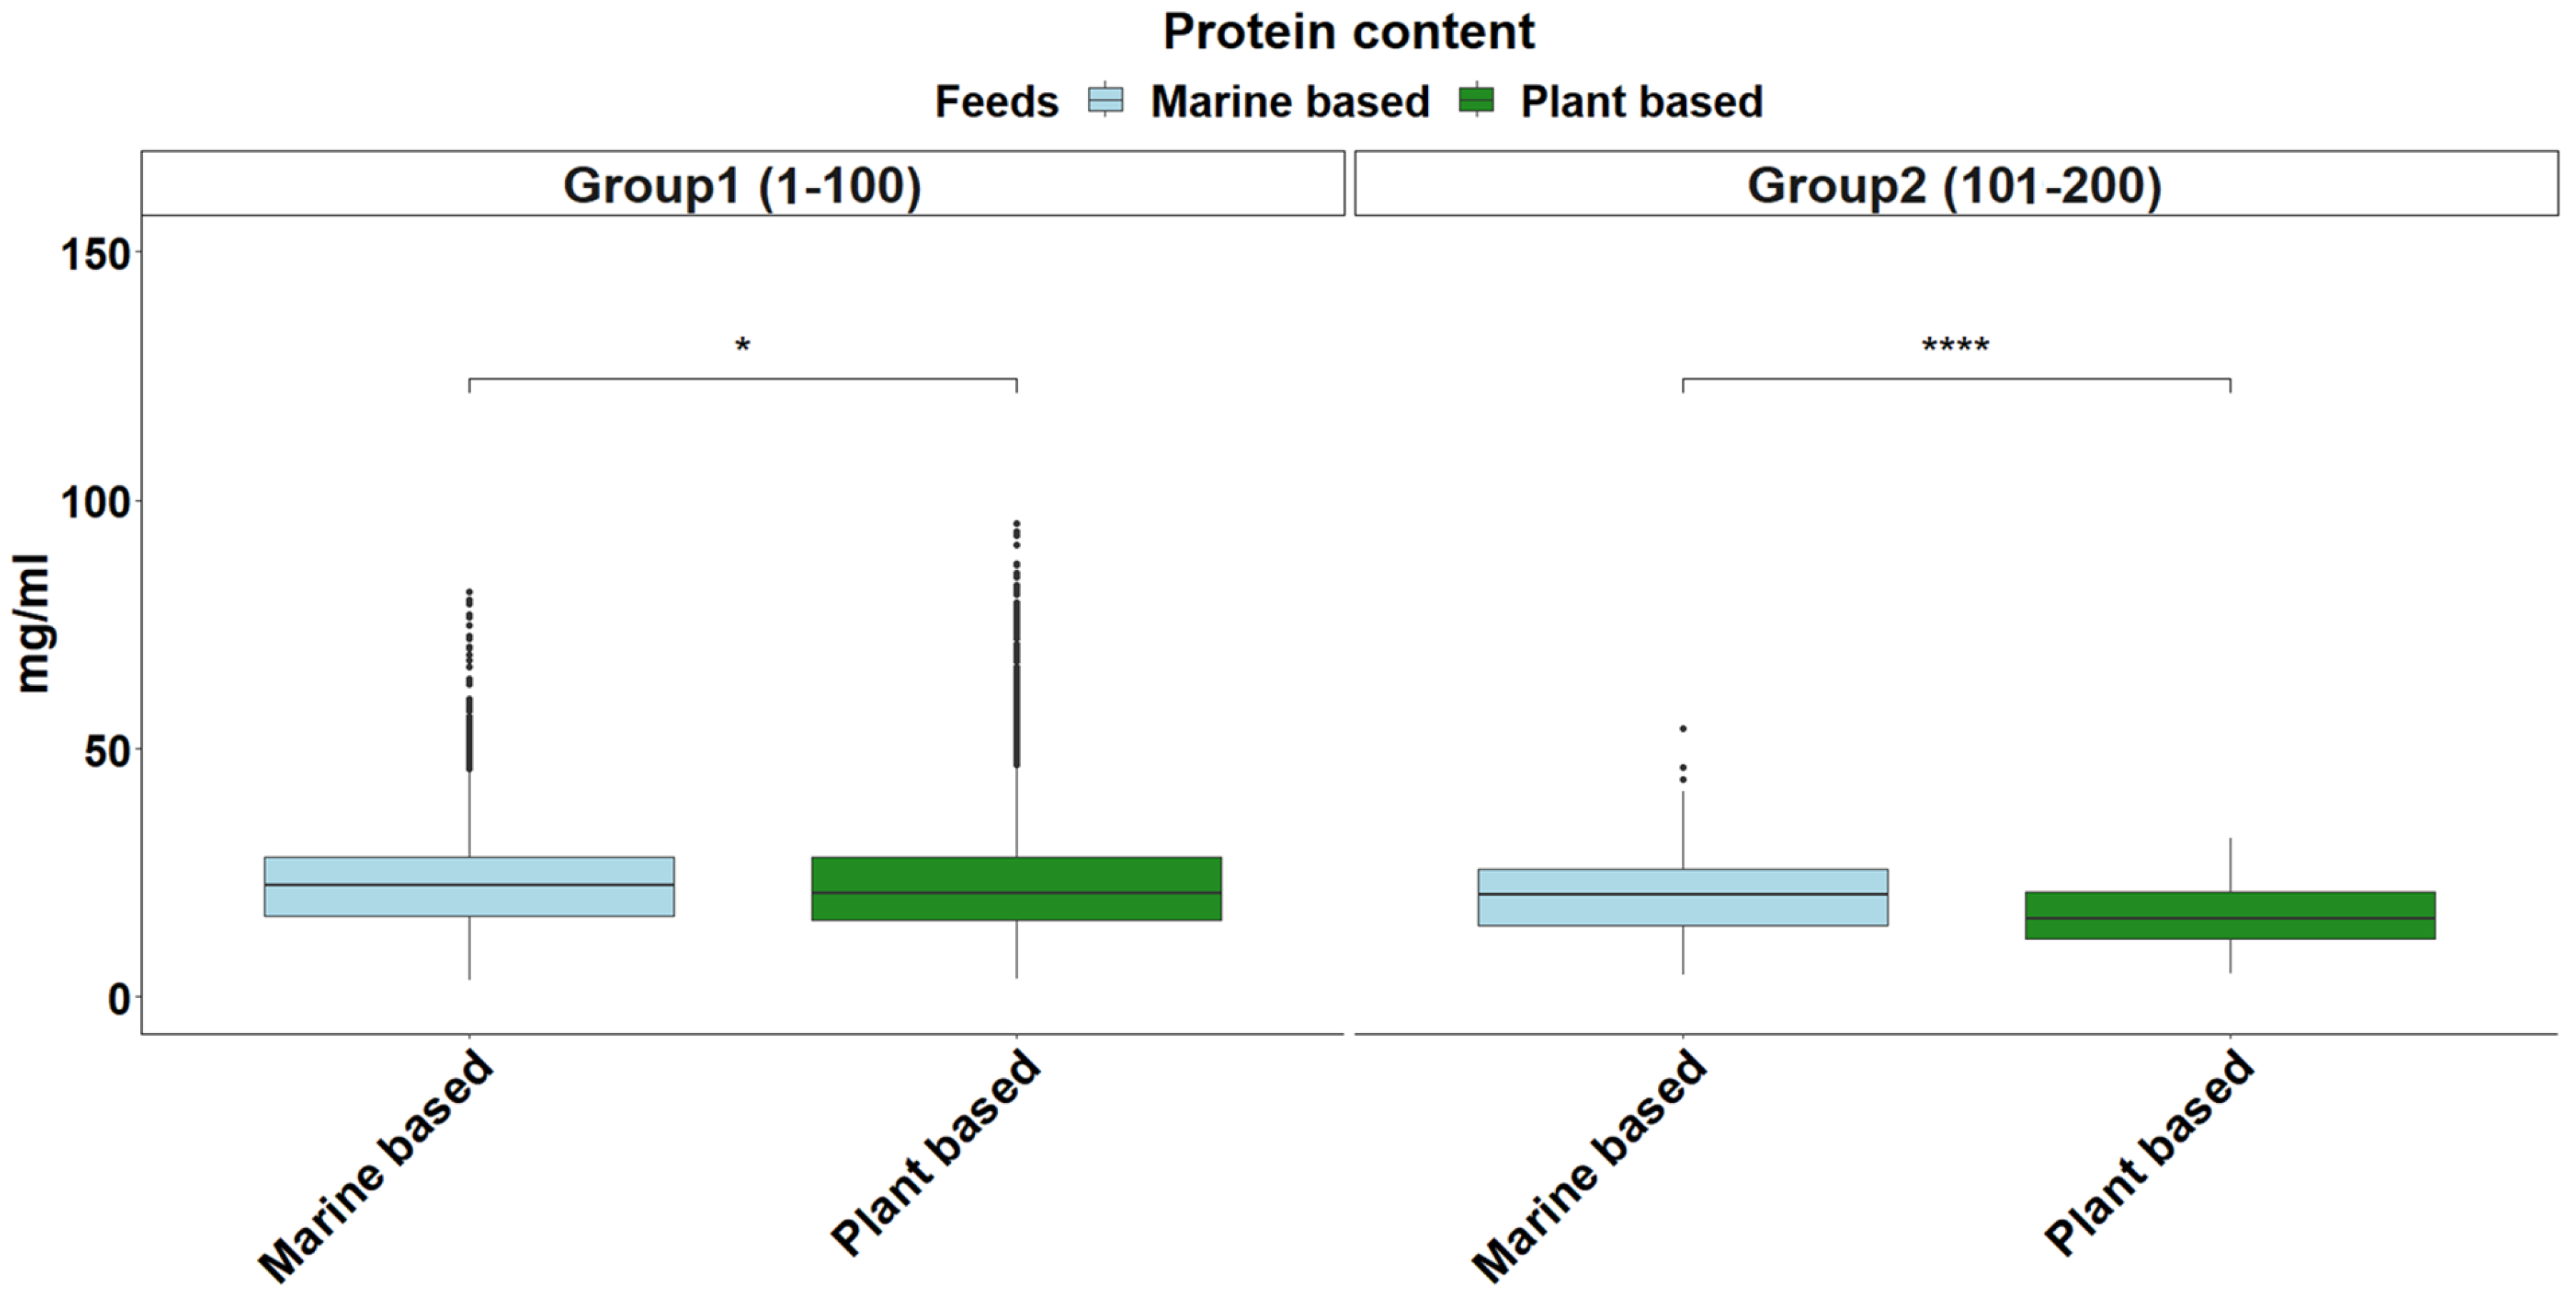
2.6. Total Protein Content

The plasma protein content was assessed using the Bradford method [20], with bovine serum albumin serving as the standard. Each sample was analyzed in duplicate to ensure the reproducibility of the results. The absorbance was measured in a microplate at 595 nm using a spectrofluorometer (Varioskan™ LUX multimode microplate reader, Thermo Fisher, Waltham, MA, USA).

2.7. Statistical Analysis

A statistical analysis was performed using RStudio (v: 2022.12.0), using appropriate packages [21,22]. A distribution fitting analysis was performed to determine the distribution of the data for each variable using the R package fitdistrplus (v: 1.2-2) [23]. Furthermore, to evaluate the goodness-of-fit, we compared the distributions based on their Akaike Information Criterion (AIC) and Bayesian Information Criterion (BIC). These criteria enabled us to determine which distribution best matched the data. As the data did not follow a normal distribution, non-parametric tests were selected for subsequent analyses. Specifically, the Kruskal–Wallis test was employed to assess the differences between groups, with the statistical significance set at p ≤ 0.05 [24]. To assess the group differentiation, permutational analyses were conducted using PERMANOVA, a non-parametric test that evaluates differences across multiple variables [25]. PERMANOVA tests the null hypothesis that the centroids and dispersions of the groups, as defined by the data, are equivalent. The rejection of the null hypothesis indicates that there is a significant difference in either the centroids or the spread between the groups [26]. Additionally, a Principal Coordinate Analysis (PCoA) was employed to explore and visualize the similarity or dissimilarity of the data within a low-dimensional Euclidean space [27]. Visual representations of the results were generated using the R packages ggplot (v: 3.5.1) and ggpubr (v: 0.6.0) [28,29].

3. Results and Discussion

The purpose of this study was to define physiological reference ranges for three significant blood biomarkers—cholesterol, triglycerides, and total protein—in gilthead sea bream plasma. These markers have been commonly used to monitor a variety of traits and conditions in farmed animals, such as chickens, pigs, cattle, and fish, including stress levels, disease detection, and overall meat quality among others [30,31]. Triglyceride, cholesterol, and plasma protein levels have been proven to be informative biomarkers in understanding metabolic health, energy balance, and dietary adaptation [7,13]. Using an extensive dataset of 5318 healthy individuals of varied genetic background reared under 10 different feeding regimes in different geographic locations, we investigated how genetic background, environment, nutritional status, and size influence the variation in these blood biomarkers. However, it should be noted that the dataset includes a disproportionate distribution of sample sizes between the two weight classes (4649 individuals in the 1–100 g class and 669 individuals in the 101–200 g class). Despite the unequal distribution in size between the two groups, the findings are critical in establishing reference values for these biomarkers for promoting operational non-invasive health monitoring and management in aquaculture, especially as the industry strives for increased sustainability.
The overall distribution of triglyceride levels in sea bream plasma is shown in Figure 1. The data followed a gamma distribution and was moderately influenced by fish size (Table 2). The type of diet also influenced triglyceride levels, with plant-based diets pushing triglyceride levels higher in smaller fish (Figure 2). The distribution of total plasma protein levels also varied slightly with fish size and was positively skewed, fitting a gamma distribution (Figure 3, Table 2). Additionally, diet influenced protein levels, with plant-based diets significantly reducing circulating protein levels compared with marine-based diets (Figure 4). The overall distribution of cholesterol levels is shown in Figure 5 and follows a gamma distribution (Table 2). Diet type had a significant effect on cholesterol levels, with plant-based diets leading to lower cholesterol levels in smaller fish, while larger fish exhibited higher cholesterol levels on plant-based diets compared to marine-based diets (Figure 6). The range of physiological values of the three parameters is provided in Table 3.
The Principal Coordinate Analysis (PCoA) and PERMANOVA demonstrated that the varied combinations of genetic background and environment (GxE) explained 38% of the variation in blood parameter values. For farms implementing a family-based breeding plan, we also performed a PERMANOVA analysis to evaluate the influence of individual families, which accounted for 27% of the variation.
When examining the influence of the different plant-based dietary regimes on physiological biomarkers, the Principal Coordinate Analysis (PCoA) revealed that the variation in biomarker values was not significantly influenced by the distinct types of feed used in different farms (1.7% of variation is explained by feed) (Figure 7). Instead, the plant-based diets, despite their individual compositions that spanned a plant-based ingredient inclusion between 40% and 80%, collectively behaved as a single “challenging” dietary factor when compared to the marine-based feed (56% of variation is explained by feed type). The lack of substantial variance between the plant-based feeds indicates that the primary differentiation in biomarker values arose from the inclusion of plant ingredients as a similar physiological challenge on the fish, supporting the notion that they can be treated as one unified group in terms of their impact on the physiological markers analyzed.
Triglycerides, the primary dietary lipid and energy reserve, are central to evaluating the metabolic state of fish [32]. Considering that plant-based feeds frequently lack adequate lipid quality, elevated triglyceride levels in fish that were fed plant-rich diets most likely reflect fat mobilization in order to compensate for decreased energy absorption. Fish may find it more difficult to use lipids from plant-based feeds than from conventional fishmeal-based diets, even when the feeds are isolipidic (Figure 2). Cortisol may be implicated in this response as prolonged increased cortisol levels, frequently related to nutritional challenges, were connected to a higher triglyceride content and reduced growth rates [33]. Cortisol has a significant role in energy regulation by increasing lipolysis and fatty acid oxidation, which help the fish mobilize energy stores during periods of nutritional stress. However, prolonged elevated cortisol levels can contribute to metabolic imbalances in fish [34].
Total protein levels, which are mostly generated in the liver, represent indirect indicators of liver function and overall nutritional condition [35]. Serum proteins are primarily composed of α1-globulins (apolipoproteins for fatty acid transport), α2-globulins (protease inhibitors, such as alpha-2-macroglobulin), β-globulins (including transferrin for iron metabolism), γ-globulins (immunoglobulins), fibronectin, and acute-phase proteins, all of which are mainly synthesized in the liver. These proteins can increase or decrease rapidly in response to challenging conditions, providing valuable insights into the fishes’ health status [36]. Variations in plasma protein levels between dietary groups could be indicative of liver stress or a response to challenges associated with metabolizing plant-derived proteins. Increased liver activity to process plant materials might result in changes to protein synthesis and metabolism, potentially leading to altered protein profiles in the plasma [37,38]. Alterations in liver morphology, including hyperplasia, have been documented in fish transitioning to plant-rich diets, reflecting an increase in metabolic activity to compensate for dietary challenges, underscoring the need for careful diet formulation (Figure 4) [38].
The response of cholesterol levels to diet type was size-dependent (Figure 6). This observation contrasts with previous observations that diets rich in high-quality proteins support higher cholesterol levels [39]. Cholesterol is a molecule that can also be synthesized endogenously, reducing the reliance on dietary sources. As a result, cholesterol levels are less influenced by dietary intake compared to triglycerides [40]. In this study, plant-based feeds, which predominantly contain phytosterols rather than cholesterol, likely limit the dietary cholesterol available to fish [41]. Phytosterols may interfere with cholesterol absorption in the gut, leading to lower cholesterol bioavailability in fish. However, endogenous cholesterol synthesis compensates for this dietary limitation, underscoring the adaptability of fish in maintaining cholesterol homeostasis [42]. Monitoring these biomarkers can provide valuable insights into how fish respond metabolically to changes in their diet, especially in terms of lipid utilization and protein metabolism. This provides a valuable tool for evaluating the effectiveness of plant-based feed formulations and their effects on fish health and growth [43].
The size-specific responses of biomarkers to dietary variation were particularly noteworthy. Triglyceride, cholesterol, and total protein levels varied significantly with size, indicating age-/size-dependent physiological responses to dietary inputs. These size-specific effects may demonstrate the importance of tailoring dietary interventions to the growth stage of fish to optimize their health and metabolic efficiency. The observed fluctuation further emphasizes how these biomarkers might be used as real-time indicators of physiological state and nutritional intake throughout the life cycle of fish [44].
In addition to addressing a major knowledge gap in the current understanding of gilthead sea bream physiology, this study provides a solid dataset that considers genetic, dietary, and environmental variation. From a practical perspective, the shared overlap in biomarker profiles across GxE groups supports the possibility that, within this common physiological range, general management or nutritional techniques could be applied successfully to fish from a variety of genetic backgrounds and geographical locations. Establishing physiological reference ranges for these markers (Table 3) provides an important tool for evaluating fish growth, welfare, and health in aquaculture [45].
The current research has focused on establishing the physiological ranges of various blood parameters in Sparus aurata, including erythrocytes, hematocrit, hemoglobin, leukocyte (WBC) differential count, leucocrit, mean corpuscular hemoglobin (MCH), mean corpuscular hemoglobin concentration (MCHC), mean corpuscular volume (MCV), and thrombocytes (TCs). These ranges were derived from a meta-analysis that compiled data from 45 different studies, enhancing the sample size and thus, the robustness of the findings [46]. Additionally, Fazio et al. examined glucose and other biochemical parameters in 60 individuals [6]. Building on these efforts, we analyzed the data from 5318 individuals, incorporating various co-factors to establish a comprehensive dataset with robust statistical power. Although there is a disproportionate distribution between the two weight classes, the sample sizes for both groups remain sufficiently large to provide meaningful insights.
The broader implications of this research extend to the development of minimally invasive biomarker tools, which hold significant promise for improving aquaculture practices. Biomarkers, as highlighted in recent reviews, serve as essential tools for evaluating the overall health status of fish. They allow producers to respond proactively to mitigate adverse conditions and reduce product loss by detecting imbalances, nutritional effects, and stress responses early on. However, effective biomarkers must be accurate, sensitive, and consistent across various contexts, such as developmental stages, reproductive conditions, and environmental changes. The transition toward minimally invasive biomarkers is particularly critical [47,48]. Traditional biomarker assessments frequently use invasive sampling procedures, which are inefficient for large-scale monitoring and harmful to fish welfare. Minimally invasive biomarkers provide real-time insights without harming animals, ensuring ethical compliance and improving public perception of aquaculture. Such tools are valuable in enhancing management methods, allowing for the sustainable intensification of the aquaculture production system [45]. This strategy provides a foundation not only for gilthead sea bream, but also for other aquaculture species.

4. Conclusions

This study provides the first physiological reference ranges for key blood biomarkers (cholesterol, triglycerides, and total protein) in gilthead sea bream, highlighting the significant influence of dietary status and GXE factors on these biomarkers across size classes. These minimally invasive biomarkers offer an effective means for routine monitoring and real-time decision-making in aquaculture, aiding in the optimization of growth, health, and productivity.

Author Contributions

Conceptualization and approach, K.A.M.; methodology, R.A. and A.E.F.; sampling, K.A.M., R.A. and A.T.; investigation, R.A., A.T. and A.E.F.; data curation, R.A. and A.T.; writing—original draft preparation, R.A., A.T. and A.E.F.; writing—review and editing, K.A.M.; visualization, R.A. and A.T.; supervision, K.A.M.; project administration, K.A.M. All authors have read and agreed to the published version of the manuscript.

Funding

This work was co-financed by a. Greece and the European Union, European Maritime and Fisheries Fund in the context of the implementation of the Greek Operational Programme for Fisheries, Priority Axis “Innovation in Aquaculture”, project title: “Development of a novel method of genetic selection of farmed fish aiming at optimizing food conversion rate” (2018–2021) MIS 5010669; b. the European Regional Development Fund of the European Union and Greek national funds through the Operational Program Competitiveness, Entrepreneurship and Innovation, under the call RESEARCH–CREATE–INNOVATE (project code: T2EDK-03599); c. the European Union and Greek national funds through the Regional Operational Program Sterea Ellada 2014–2020 under the call “Support of Plans for Research, Technological Development, and Innovation in RIS3 sectors of the Region of Sterea Ellada”, project title: “Development of an innovative evaluation system for ingredients and fishfeeds to promote competitive performance in the Mediterranean fish farming” (2020–2023), project code: [ΣΤΕΡ1-0022625], MIS 5056126.

Institutional Review Board Statement

All examined biological materials were derived from fish reared and harvested at commercial farms, and registered for aquaculture production in EU countries. Animal sampling followed routine procedures and samples were collected by a qualified staff member from standard production cycles. All experimental procedures complied with existing Greek (PD 56/2013) and EU (Directive 63/2010) legislation on the care of farmed animals. Fish were all commercial and none of the samplings were lethal and were performed on the commercial installments.

Informed Consent Statement

Not applicable.

Data Availability Statement

The data are available from the corresponding author upon reasonable request.

Conflicts of Interest

The authors declare no conflicts of interest.

References

  1. FFEAP. European Aquaculture Production Report; FEAP: Brussels, Belgium, 2024; Available online: https://feap.info (accessed on 14 November 2024).
  2. Federation of Greek Mariculture. Aquaculture in Greece 2020. Annual Report; Federation of Greek Mariculture: Ilioupoli, Greece, 2020. [Google Scholar]
  3. Mhalhel, K.; Levanti, M.; Abbate, F.; Laurà, R.; Guerrera, M.C.; Aragona, M.; Porcino, C.; Briglia, M.; Germanà, A.; Montalbano, G. Review on Gilthead Seabream (Sparus aurata) Aquaculture: Life Cycle, Growth, Aquaculture Practices and Challenges. J. Mar. Sci. Eng. 2023, 11, 2008. [Google Scholar] [CrossRef]
  4. Habibu, B.; Dzenda, T.; Ayo, J.O.; Yaqub, L.S.; Kawu, M.U. Haematological Changes and Plasma Fluid Dynamics in Livestock during Thermal Stress, and Response to Mitigative Measures. Livest. Sci. 2018, 214, 189–201. [Google Scholar] [CrossRef]
  5. Roland, L.; Drillich, M.; Iwersen, M. Hematology as a Diagnostic Tool in Bovine Medicine. J. Vet. Diagn. Investig. 2014, 26, 592–598. [Google Scholar] [CrossRef] [PubMed]
  6. Fazio, F. Fish Hematology Analysis as an Important Tool of Aquaculture: A Review. Aquaculture 2019, 500, 237–242. [Google Scholar] [CrossRef]
  7. Magalhães, R.; Guerreiro, I.; Coutinho, F.; Moutinho, S.; Sousa, S.; Delerue-Matos, C.; Domingues, V.F.; Olsen, R.E.; Peres, H.; Oliva-Teles, A. Effect of Dietary ARA/EPA/DHA Ratios on Growth Performance and Intermediary Metabolism of Gilthead Sea Bream (Sparus aurata) Juveniles. Aquaculture 2020, 516, 734644. [Google Scholar] [CrossRef]
  8. Basto-Silva, C.; Enes, P.; Oliva-Teles, A.; Capilla, E.; Guerreiro, I. Dietary Protein/Carbohydrate Ratio and Feeding Frequency Affect Feed Utilization, Intermediary Metabolism, and Economic Efficiency of Gilthead Seabream (Sparus aurata) Juveniles. Aquaculture 2022, 554, 738182. [Google Scholar] [CrossRef]
  9. Ahmed, I.; Reshi, Q.M.; Fazio, F. The Influence of the Endogenous and Exogenous Factors on Hematological Parameters in Different Fish Species: A Review. Aquac. Int. 2020, 28, 869–899. [Google Scholar] [CrossRef]
  10. Fazio, F.; Ferrantelli, V.; Fortino, G.; Arfuso, F.; Giangrosso, G.; Faggio, C. The Influence of Acute Handling Stress on Some Blood Parameters in Cultured Sea Bream (Sparus aurata Linnaeus, 1758). Ital. J. Food Saf. 2015, 4, 4–6. [Google Scholar] [CrossRef]
  11. Fazio, F.; Ferrantelli, V.; Saoca, C.; Giangrosso, G.; Piccione, G. Stability of Haematological Parameters in Stored Blood Samples of Rainbow Trout Oncorhynchus mykiss (Walbaum, 1792). Vet. Med. 2017, 62, 401–405. [Google Scholar] [CrossRef]
  12. Puppel, K.; Kuczyńska, B. Metabolic Profiles of Cow’s Blood; A Review. J. Sci. Food Agric. 2016, 96, 4321–4328. [Google Scholar] [CrossRef]
  13. Dias, J.; Alvarez, M.J.; Arzel, J.; Corraze, G.; Diez, A.; Bautista, J.M.; Kaushik, S.J. Dietary Protein Source Affects Lipid Metabolism in the European Seabass (Dicentrarchus labrax). Comp. Biochem. Physiol. Part A Mol. Integr. Physiol. 2005, 142, 19–31. [Google Scholar] [CrossRef] [PubMed]
  14. Řehulka, J.; Minařík, B. Cholesterolaemia and Triacylglycerolaemia in Farmed Rainbow Trout, Oncorhynchus mykiss. Aquac. Res. 2012, 43, 1651–1659. [Google Scholar] [CrossRef]
  15. Albassam, N.H.; Al Habib, F.M.; Hassan, S.M. Studying Cholesterol and Triglyceride Levels in Some Types of Fish in Salah Al-Din Governorate. Al-Qadisiyah J. Pure Sci. 2021, 26, 95–99. [Google Scholar] [CrossRef]
  16. Esmaeili, N. Blood Performance: A New Formula for Fish Growth and Health. Biology 2021, 10, 1236. [Google Scholar] [CrossRef]
  17. Sallam, E.A.; Matter, A.F.; Mohammed, L.S.; Azam, A.E.; Shehab, A.; Mohamed Soliman, M. Replacing Fish Meal with Rapeseed Meal: Potential Impact on the Growth Performance, Profitability Measures, Serum Biomarkers, Antioxidant Status, Intestinal Morphometric Analysis, and Water Quality of Oreochromis niloticus and Sarotherodon galilaeus Finge. Vet. Res. Commun. 2021, 45, 223–241. [Google Scholar] [CrossRef]
  18. Passos, R.; Correia, A.P.; Ferreira, I.; Pires, P.; Pires, D.; Gomes, E.; do Carmo, B.; Santos, P.; Simões, M.; Afonso, C.; et al. Effect on Health Status and Pathogen Resistance of Gilthead Seabream (Sparus aurata) Fed with Diets Supplemented with Gracilaria Gracilis. Aquaculture 2021, 531, 735888. [Google Scholar] [CrossRef]
  19. Gjedrem, T.; Robinson, N.; Rye, M. The Importance of Selective Breeding in Aquaculture to Meet Future Demands for Animal Protein: A Review. Aquaculture 2012, 350–353, 117–129. [Google Scholar] [CrossRef]
  20. Bradford, M.M. A Rapid and Sensitive Method for the Quantitation of Microgram Quantities of Protein Utilizing the Principle of Protein-Dye Binding. Anal. Biochem. 1976, 72, 248–254. [Google Scholar] [CrossRef]
  21. R Core Team. R: A Language and Environment for Statistical Computing; R Foundation for Statistical Computing: Vienna, Austria, 2021; Available online: https://www.R-project.org/ (accessed on 13 November 2024).
  22. RStudio Team. RStudio: Integrated Development for R. RStudio; PBC: Boston, MA, USA, 2020; Available online: http://www.rstudio.com/ (accessed on 13 November 2024).
  23. Delignette-Muller, M.L.; Dutang, C. Fitdistrplus: An R Package for Fitting Distributions. J. Stat. Softw. 2015, 64, 1–34. [Google Scholar] [CrossRef]
  24. Kruskal-Wallis Test. In The Concise Encyclopedia of Statistics; Springer: New York, NY, USA, 2008. [CrossRef]
  25. Oksanen, J.; Simpson, G.; Blanchet, F.; Kindt, R.; Legendre, P.M.P.; O’Hara, R.; Solymos, P.; Stevens, M.; Szoecs, E.; Wagner, H.B.M.; et al. Vegan: Community Ecology Package, Version 2.6-4; R Foundation for Statistical Computing: Vienna, Austria, 2022. [Google Scholar]
  26. Anderson, M.J. Permutational multivariate analysis of variance (PERMANOVA). Wiley Stats Ref. Stat. Ref. Online 2017, 1–15. [Google Scholar] [CrossRef]
  27. Zapala, M.A.; Schork, N.J. Multivariate Regression Analysis of Distance Matrices for Testing Associations between Gene Expression Patterns and Related Variables. Proc. Natl. Acad. Sci. USA 2006, 103, 19430. [Google Scholar] [CrossRef]
  28. Kassambara, A. ggpubr: ‘ggplot2’ Based Publication Ready Plots. R package version 0.6.0. 2023. Available online: https://rpkgs.datanovia.com/ggpubr/ (accessed on 14 November 2024).
  29. Wickham, H. Ggplot2: Elegant Graphics for Data Analysis; Springer: New York, NY, USA, 2016; ISBN 978-3-319-24277-4. [Google Scholar]
  30. Kumar, P.; Ahmed, M.A.; Abubakar, A.A.; Hayat, M.N.; Kaka, U.; Ajat, M.; Goh, Y.M.; Sazili, A.Q. Improving Animal Welfare Status and Meat Quality through Assessment of Stress Biomarkers: A Critical Review. Meat Sci. 2023, 197, 109048. [Google Scholar] [CrossRef] [PubMed]
  31. Perera, E.; Simó-Mirabet, P.; Shin, H.S.; Rosell-Moll, E.; Naya-Catalá, F.; de las Heras, V.; Martos-Sitcha, J.A.; Karalazos, V.; Armero, E.; Arizcun, M.; et al. Selection for Growth Is Associated in Gilthead Sea Bream (Sparus aurata) with Diet Flexibility, Changes in Growth Patterns and Higher Intestine Plasticity. Aquaculture 2019, 507, 349–360. [Google Scholar] [CrossRef]
  32. Tocher, D.R. Reviews in Fisheries Science Metabolism and Functions of Lipids and Fatty Acids in Teleost Fish Metabolism and Functions of Lipids and Fatty Acids in Teleost Fish. Rev. Fish. Sci. 2010, 11, 37–41. [Google Scholar]
  33. Jerez-Cepa, I.; Gorissen, M.; Mancera, J.M.; Ruiz-Jarabo, I. What Can We Learn from Glucocorticoid Administration in Fish? Effects of Cortisol and Dexamethasone on Intermediary Metabolism of Gilthead Seabream (Sparus aurata L.). Comp. Biochem. Physiol. Part A Mol. Integr. Physiol. 2019, 231, 1–10. [Google Scholar] [CrossRef]
  34. Blanco, A.M.; Antomagesh, F.; Comesaña, S.; Soengas, J.L.; Vijayan, M.M. Chronic Cortisol Stimulation Enhances Hypothalamus-Specific Enrichment of Metabolites in the Rainbow Trout Brain. Am. J. Physiol.—Endocrinol. Metab. 2024, 326, E382–E397. [Google Scholar] [CrossRef]
  35. Kaplan, Ç.; Erdoğan, F. Effect of Dietary Propolis on Growth, Body Composition, and Serum Biochemistry of Juvenile Sea Bream (Sparus aurata). Aquac. Int. 2021, 29, 553–563. [Google Scholar] [CrossRef]
  36. Campos-Sánchez, J.C.; Guardiola, F.A.; Esteban, M.Á. Serum Proteinogram of Gilthead Seabream (Sparus Aurata) and European Sea Bass (Dicentrarchus labrax) as a New Useful Approach for Detecting Loss of Haemostasis. Fish Shellfish Immunol. 2024, 151, 109699. [Google Scholar] [CrossRef]
  37. Han, Y.K.; Xu, Y.C.; Luo, Z.; Zhao, T.; Zheng, H.; Tan, X.Y. Fish Meal Replacement by Mixed Plant Protein in the Diets for Juvenile Yellow Catfish Pelteobagrus fulvidraco: Effects on Growth Performance and Health Status. Aquac. Nutr. 2022, 2022, 2677885. [Google Scholar] [CrossRef]
  38. Donadelli, V.; Di Marco, P.; Mandich, A.; Finoia, M.G.; Cardinaletti, G.; Petochi, T.; Longobardi, A.; Tibaldi, E.; Marino, G. Effects of Dietary Plant Protein Replacement with Insect and Poultry By-Product Meals on the Liver Health and Serum Metabolites of Sea Bream (Sparus aurata) and Sea Bass (Dicentrarchus labrax). Animals 2024, 14, 241. [Google Scholar] [CrossRef]
  39. Mabe, L.T.; Su, S.; Tang, D.; Zhu, W.; Wang, S.; Dong, Z. The Effect of Dietary Bamboo Charcoal Supplementation on Growth and Serum Biochemical Parameters of Juvenile Common Carp (Cyprinus carpio L.). Aquac. Res. 2018, 49, 1142–1152. [Google Scholar] [CrossRef]
  40. Cardona, E.; Baranek, E.; Vigor, C.; Gros, V.; Reversat, G.; Surget, A.; Larroquet, L.; Maunas, P.; Turronet, N.; Oger, C.; et al. A Two-Year Plant-Based Diet Alters the Fatty Acid Profile and Enzymatic and Non-Enzymatic Lipid Metabolites, in the Eggs and Fry of Female Rainbow Trout. Aquaculture 2025, 595, 741602. [Google Scholar] [CrossRef]
  41. Shukla, A.; Kumar, M.; Gupta, G.; Pathak, N. A Review on Replacing Fish Meal in Aqua Feeds Using Plant and Animal Protein Sources. Int. J. Fish. Aquat. Stud. 2019, 6, 164–179. [Google Scholar]
  42. Kortner, T.M.; Björkhem, I.; Krasnov, A.; Timmerhaus, G.; Krogdahl, Å. Dietary Cholesterol Supplementation to a Plant-Based Diet Suppresses the Complete Pathway of Cholesterol Synthesis and Induces Bile Acid Production in Atlantic Salmon (Salmo salar L.). Br. J. Nutr. 2014, 111, 2089–2103. [Google Scholar] [CrossRef]
  43. Satheeshkumar, P.; Ananthan, G.; Kumar, D.S.; Jagadeesan, L. Haematology and Biochemical Parameters of Different Feeding Behaviour of Teleost Fishes from Vellar Estuary, India. Comp. Clin. Path. 2012, 21, 1187–1191. [Google Scholar] [CrossRef]
  44. Ripa, R.; Ballhysa, E.; Steiner, J.D.; Laboy, R.; Annibal, A.; Hochhard, N.; Latza, C.; Dolfi, L.; Calabrese, C.; Meyer, A.M.; et al. Refeeding-Associated AMPKγ1 Complex Activity Is a Hallmark of Health and Longevity. Nat. Aging 2023, 3, 1544–1560. [Google Scholar] [CrossRef]
  45. Oliveira, J.; Oliva-Teles, A.; Couto, A. Tracking Biomarkers for the Health and Welfare of Aquaculture Fish. Fishes 2024, 9, 289. [Google Scholar] [CrossRef]
  46. Michail, G.; Berillis, P.; Nakas, C.; Henry, M.; Mente, E. Haematology Reference Values for Dicentrarchus labrax and Sparus aurata: A Systematic Review and Meta-Analysis. J. Fish Dis. 2022, 45, 1549–1570. [Google Scholar] [CrossRef]
  47. Witeska, M.; Kondera, E.; Ługowska, K.; Bojarski, B. Hematological Methods in Fish—Not Only for Beginners. Aquaculture 2022, 547, 737498. [Google Scholar] [CrossRef]
  48. Barreto, M.O.; Rey Planellas, S.; Yang, Y.; Phillips, C.; Descovich, K. Emerging Indicators of Fish Welfare in Aquaculture. Rev. Aquac. 2022, 14, 343–361. [Google Scholar] [CrossRef]
Figure 1. Distribution of triglyceride levels in gilthead sea bream plasma. The data follows a gamma distribution in both size groups. The histogram represents the distribution, and the fitted normal distribution curve is overlaid for comparison. The purple and brown colors denote the 1–100 g and 101–200 g groups, respectively.
Fishes 10 00052 g001
Figure 2. Triglycerides levels in blood plasma in each size group. The light blue and green colors denote feeding on a marine-based and plant-based diet, respectively. The statistical significance levels are presented on the plot (ns: >0.05, ** < 0.01).
Fishes 10 00052 g002
Figure 3. Distribution of total protein levels in gilthead sea bream plasma. The data follows a gamma distribution in both size groups. The histogram represents the distribution, and the fitted normal distribution curve is overlaid for comparison. The purple and brown colors denote the 1–100 g and 101–200 g groups, respectively.
Fishes 10 00052 g003
Figure 4. Protein content in blood plasma in each size group. The light blue and green colors denote feeding on a marine-based and plant-based diet, respectively. The statistical significance levels are presented on the plot (* < 0.05, **** < 0.0001).
Fishes 10 00052 g004
Figure 5. Distribution of cholesterol levels in gilthead sea bream plasma. The data follows a gamma distribution in both size groups. The histogram represents the distribution, and the fitted normal distribution curve is overlaid for comparison. The purple and brown colors denote the 1–100 g and 101–200 g groups, respectively.
Fishes 10 00052 g005
Figure 6. Cholesterol levels in gilthead sea bream blood plasma in each size group. The light blue and green colors denote feeding on a marine-based and plant-based diet, respectively. The statistical significance levels are presented on the plot (** < 0.01, *** < 0.001).
Fishes 10 00052 g006
Figure 7. Principal Coordinate Analysis (PCoA) illustrating the effect of plant-based feeds on physiological biomarker profiles in gilthead sea bream. The colored circles depict different plant-based feeds. The PCoA suggests a minimal separation of groups.
Fishes 10 00052 g007
Table 1. Geographical location and farming practices of the commercial installations which provided the blood samples of gilthead sea bream for this study.
Farm No.Geographic CoordinatesFarming SystemBreeding PracticeNo. of FamiliesSize ClassType of Diet
138°45′47.5″ N 20°46′56.2″ ESea CagesFamily-based201–100 gMarine-based
138°45′47.5″ N 20°46′56.2″ ESea CagesFamily-based201–100 gPlant-based
138°45′47.5″ N 20°46′56.2″ ESea CagesFamily-based971–100 gMarine-based
138°45′47.5″ N 20°46′56.2″ ESea CagesFamily-based971–100 gPlant-based
138°45′47.5″ N 20°46′56.2″ ESea CagesFamily-based97101–200 gMarine-based
138°45′47.5″ N 20°46′56.2″ ESea CagesFamily-based97101–200 gPlant-based
238°22′03.4″ N 22°06′41.2″ ESea CagesFamily-based3101–200 gMarine-based
238°22′03.4″ N 22°06′41.2″ ESea CagesFamily-based3101–200 gPlant-based
338°21′57.4″ N 24°03′02.9″ ESea CagesFamily-based3101–200 gMarine-based
338°21′57.4″ N 24°03′02.9″ ESea CagesFamily-based3101–200 gPlant-based
438°36′12.5″ N 23°20′12.6″ ESea CagesMass spawning-1–100 gMarine-based
438°36′12.5″ N 23°20′12.6″ ESea CagesMass spawning-1–100 gPlant-based
539°40′19.9″ N 20°04′26.3″ ESea CagesMass spawning-1–100 gMarine-based
539°40′19.9″ N 20°04′26.3″ ESea CagesMass spawning-1–100 gPlant-based
539°40′19.9″ N 20°04′26.3″ ESea CagesMass spawning-101–200 gMarine-based
539°40′19.9″ N 20°04′26.3″ ESea CagesMass spawning-101–200 gPlant-based
638°33′31.8″ N 23°36′35.0″ EClose circuitFamily-based41–100 gMarine-based
638°33′31.8″ N 23°36′35.0″ EClose circuitFamily-based41–100 gPlant-based
638°33′31.8″ N 23°36′35.0″ EClose circuitFamily-based4101–200 gMarine-based
638°33′31.8″ N 23°36′35.0″ EClose circuitFamily-based4101–200 gPlant-based
Table 2. Key statistics parameters for determining the type of distribution of blood parameter values. The type of distribution associated with each parameter is indicated in bold.
ParameterDistributionAICBICKolmogorov–Smirnov Statistic
Total ProteinNormal43,675.7243,688.880.1493
Exponential44,614.4444,621.020.247
Gamma41,463.8641,477.020.0817
CholesterolNormal46,943.0346,956.190.1462
Exponential50,762.3350,768.910.3754
Gamma44,236.2644,249.410.082
TriglyceridesNormal55,284.8855,298.040.1904
Exponential54,587.8554,594.430.2864
Gamma51,316.7551,329.910.1122
Table 3. Physiological ranges of total protein, cholesterol, and triglycerides levels in blood plasma of gilthead sea bream.
mg/mLMedianPhysiological Ranges (95% CI)
Total Protein21.71(5.42–65.42)
Cholesterol39.66(22.08–91.73)
Triglycerides51.67(18.78–184.89)
Disclaimer/Publisher’s Note: The statements, opinions and data contained in all publications are solely those of the individual author(s) and contributor(s) and not of MDPI and/or the editor(s). MDPI and/or the editor(s) disclaim responsibility for any injury to people or property resulting from any ideas, methods, instructions or products referred to in the content.

