You are currently viewing a new version of our website. To view the old version click .
Fishes
  • Article
  • Open Access

10 November 2025

Modeling the Water Source Ecosystem in the Middle Route of the South-to-North Water Diversion Project: Implications for Management and Conservation

,
,
,
,
,
,
,
,
and
1
Key Laboratory of Ecological Impacts of Hydraulic-Projects and Restoration of Aquatic Ecosystem of Ministry of Water Resources, Institute of Hydroecology, Ministry of Water Resources & Chinese Academy of Sciences, Wuhan 430079, China
2
State Key Laboratory of Breeding Biotechnology and Sustainable Aquaculture, Institute of Hydrobiology, Chinese Academy of Sciences, Wuhan 430072, China
3
Mid-Route Source of South-To-North Water Transfer Co., Ltd., Danjiangkou 442700, China
*
Author to whom correspondence should be addressed.
This article belongs to the Section Biology and Ecology

Abstract

The Danjiangkou Reservoir (DJKR) serves as the water source for the Middle Route of the South-to-North Water Diversion Project (MR-SNWDP), yet comprehensive understanding of its ecosystem structure and function remains limited. This study addressed this knowledge limitation by developing an Ecopath model with 22 functional groups, parameterized using field survey data from 2022 to 2023. Our findings revealed a trophic structure spanning levels 1 to 3.59, with the highest level occupied by piscivorous mandarin fish (Siniperca spp.). Energy flowed through two dominant pathways, with the grazing food chain demonstrating higher transfer efficiency compared to the detrital pathway. Mixed trophic impact analysis identified the introduced icefish (Neosalanx taihuensis) as exerting substantial negative impacts on most functional groups. Key ecosystem indices, including the total primary production to total respiration ratio (TPP/TR, 1.99), connectance index (CI, 0.248), and system omnivory index (SOI, 0.113), collectively indicated an ecosystem of moderate maturity and stability. Persistent challenges include the proliferation of N. taihuensis, suboptimal energy transfer between trophic levels III and IV, and inefficient utilization of primary productivity. To enhance ecosystem resilience and maintain water quality, we recommend the targeted removal of icefish and strategic management of zooplanktivorous fish populations.
Key Contribution:
This study conducted the first ecosystem assessment of the entire DJKR using an Ecopath model. The results indicate a system with moderate maturity yet constrained by several key limitations: low primary productivity utilization, suboptimal energy transfer efficiency, and substantial negative impacts from introduced icefish. To address these issues, targeted management strategies are proposed to enhance ecosystem stability and safeguard water quality for this critical water source.

1. Introduction

The Middle Route of the South-to-North Water Diversion Project (MR-SNWDP) is one of the world’s most ambitious water transfer initiatives, channeling water over a remarkable distance of more than 1400 km to water-stressed cities in the north, including Beijing and Tianjin. This critical artery benefits a population of over 108 million and supplies billions of cubic meters of water annually []. The Danjiangkou Reservoir (DJKR), serving as the water source for the MR-SNWDP, is situated in the upper reaches of the Han River and spans both Hubei and Henan provinces. It is designated as a National First-Class Water Source Protection Zone. Construction of the Danjiangkou Hydraulic Complex began in 1958, with the initial phase completed in 1974. To facilitate the MR-SNWDP, a dam heightening project was initiated in 2005 and concluded in 2013. This project raised the reservoir’s water level from 157 m to 170 m and increased its storage capacity from 17.45 billion m3 to 29.05 billion m3 []. The health of the DJKR ecosystem and the safety of its water quality are crucial to the drinking water security for the vast population in the water-receiving regions, making it a pivotal factor for the success of the MR-SNWDP.
To ensure “a continuous flow of clean water to the north”, systematic protection and restoration measures have been implemented in the DJKR area and its catchment in recent years []. These measures include controlling non-point source pollution, completely banning cage aquaculture, removing aquaculture facilities in reservoir bays, and enforcing fishing moratoriums. However, since the operation of the water diversion project, the rise in water level, increased storage capacity, and water redistribution have significantly altered the water environment and hydrological–hydrodynamic characteristics of the reservoir [].
Against this backdrop, the fish community has undergone a clear ecological transition from rheophilic to limnophilic dominance, shaped by both hydrological changes and fisheries management []. Prior to dam construction (1957–1958), rheophilic species predominated. During the post-impoundment period (1986–1987), limnophilic fish increased substantially, though rheophilic taxa persisted in upper reservoir areas with residual flow. Following dam heightening and further water level rise, our 2022–2023 surveys confirm the current dominance of generalist and limnophilic species, such as Hemiculter leucisculus and Culter mongolicus []. This shift was also influenced by stocking and introduction programs initiated in the 1990s to enhance fisheries as well as to improve the livelihoods of local fishers. While native species such as silver and bighead carp were widely released, the introduced icefish (Neosalanx taihuensis) became successfully established a self-sustaining population. Since its introduction in 1998, the population has grown rapidly, reaching a standing stock of 3000 t and an annual catch of 2000 t by 2008 []. Recent data (2021–2023) from the Henan section indicate a sustained catch of between 280 and 600 t, confirming its persistent abundance. Other non-native species, including Luciobarbus brachycephalus and Cyprinus carpio var. specularis, which were likely introduced through recent religious release activities, have been recorded but made a negligible contribution to the overall biomass [].
Additionally, while a “ten-year fishing ban” initiated in 2021 has been currently in effect in the Hubei section of the reservoir, seasonal fishing (from September to February each year) is still permitted in the Henan section. Consequently, the DJKR ecosystem continues to face pressures from multiple factors, including the operation of the MR-SNWDP and localized fishing activities, and the ecological impacts of established non-native species.
Current research on the DJKR ecosystem remains largely confined to studies on single biotic groups, such as plankton [,], zoobenthos [], and fish [,], as well as assessments of biological integrity []. Existing ecosystem-level studies of the reservoir are limited to the Henan section [], leaving a gap in comprehensive analyses of the entire reservoir’s food web structure, energy flow, interactions among biological groups, and functional characteristics. This lack of holistic understanding hinders the scientific assessment of the reservoir ecosystem’s stability and maturity under the dynamic water transfer regime, as well as the diagnosis of ecosystem-level issues and the implementation of targeted conservation and restoration measures. Ecopath with Ecosim (EwE), an ecosystem network modeling approach, is now widely applied in studies of marine [,], lacustrine [,], and reservoir [,] ecosystems due to its relatively modest data requirements and powerful analytical and simulation capabilities.
Addressing current challenges—such as the unclear food web structure, undefined ecosystem characteristics, and the lack of a scientific basis for ecosystem protection measures in the DJKR—this study constructs an Ecopath model to investigate the structural and functional attributes of the reservoir ecosystem. The findings aim to provide a data-driven foundation for assessing the current state, diagnosing issues, and guiding the conservation and restoration of the DJKR ecosystem.

2. Materials and Methods

2.1. Study Area and Data Collection

The study area was the DJKR (110°39′11″–111°41′55″ E, 32°29′52″–33°5′13″ N). Routine aquatic ecological surveys were conducted six times during high-flow (June–September) and low-flow (November–January) periods each year from 2022 to 2023.
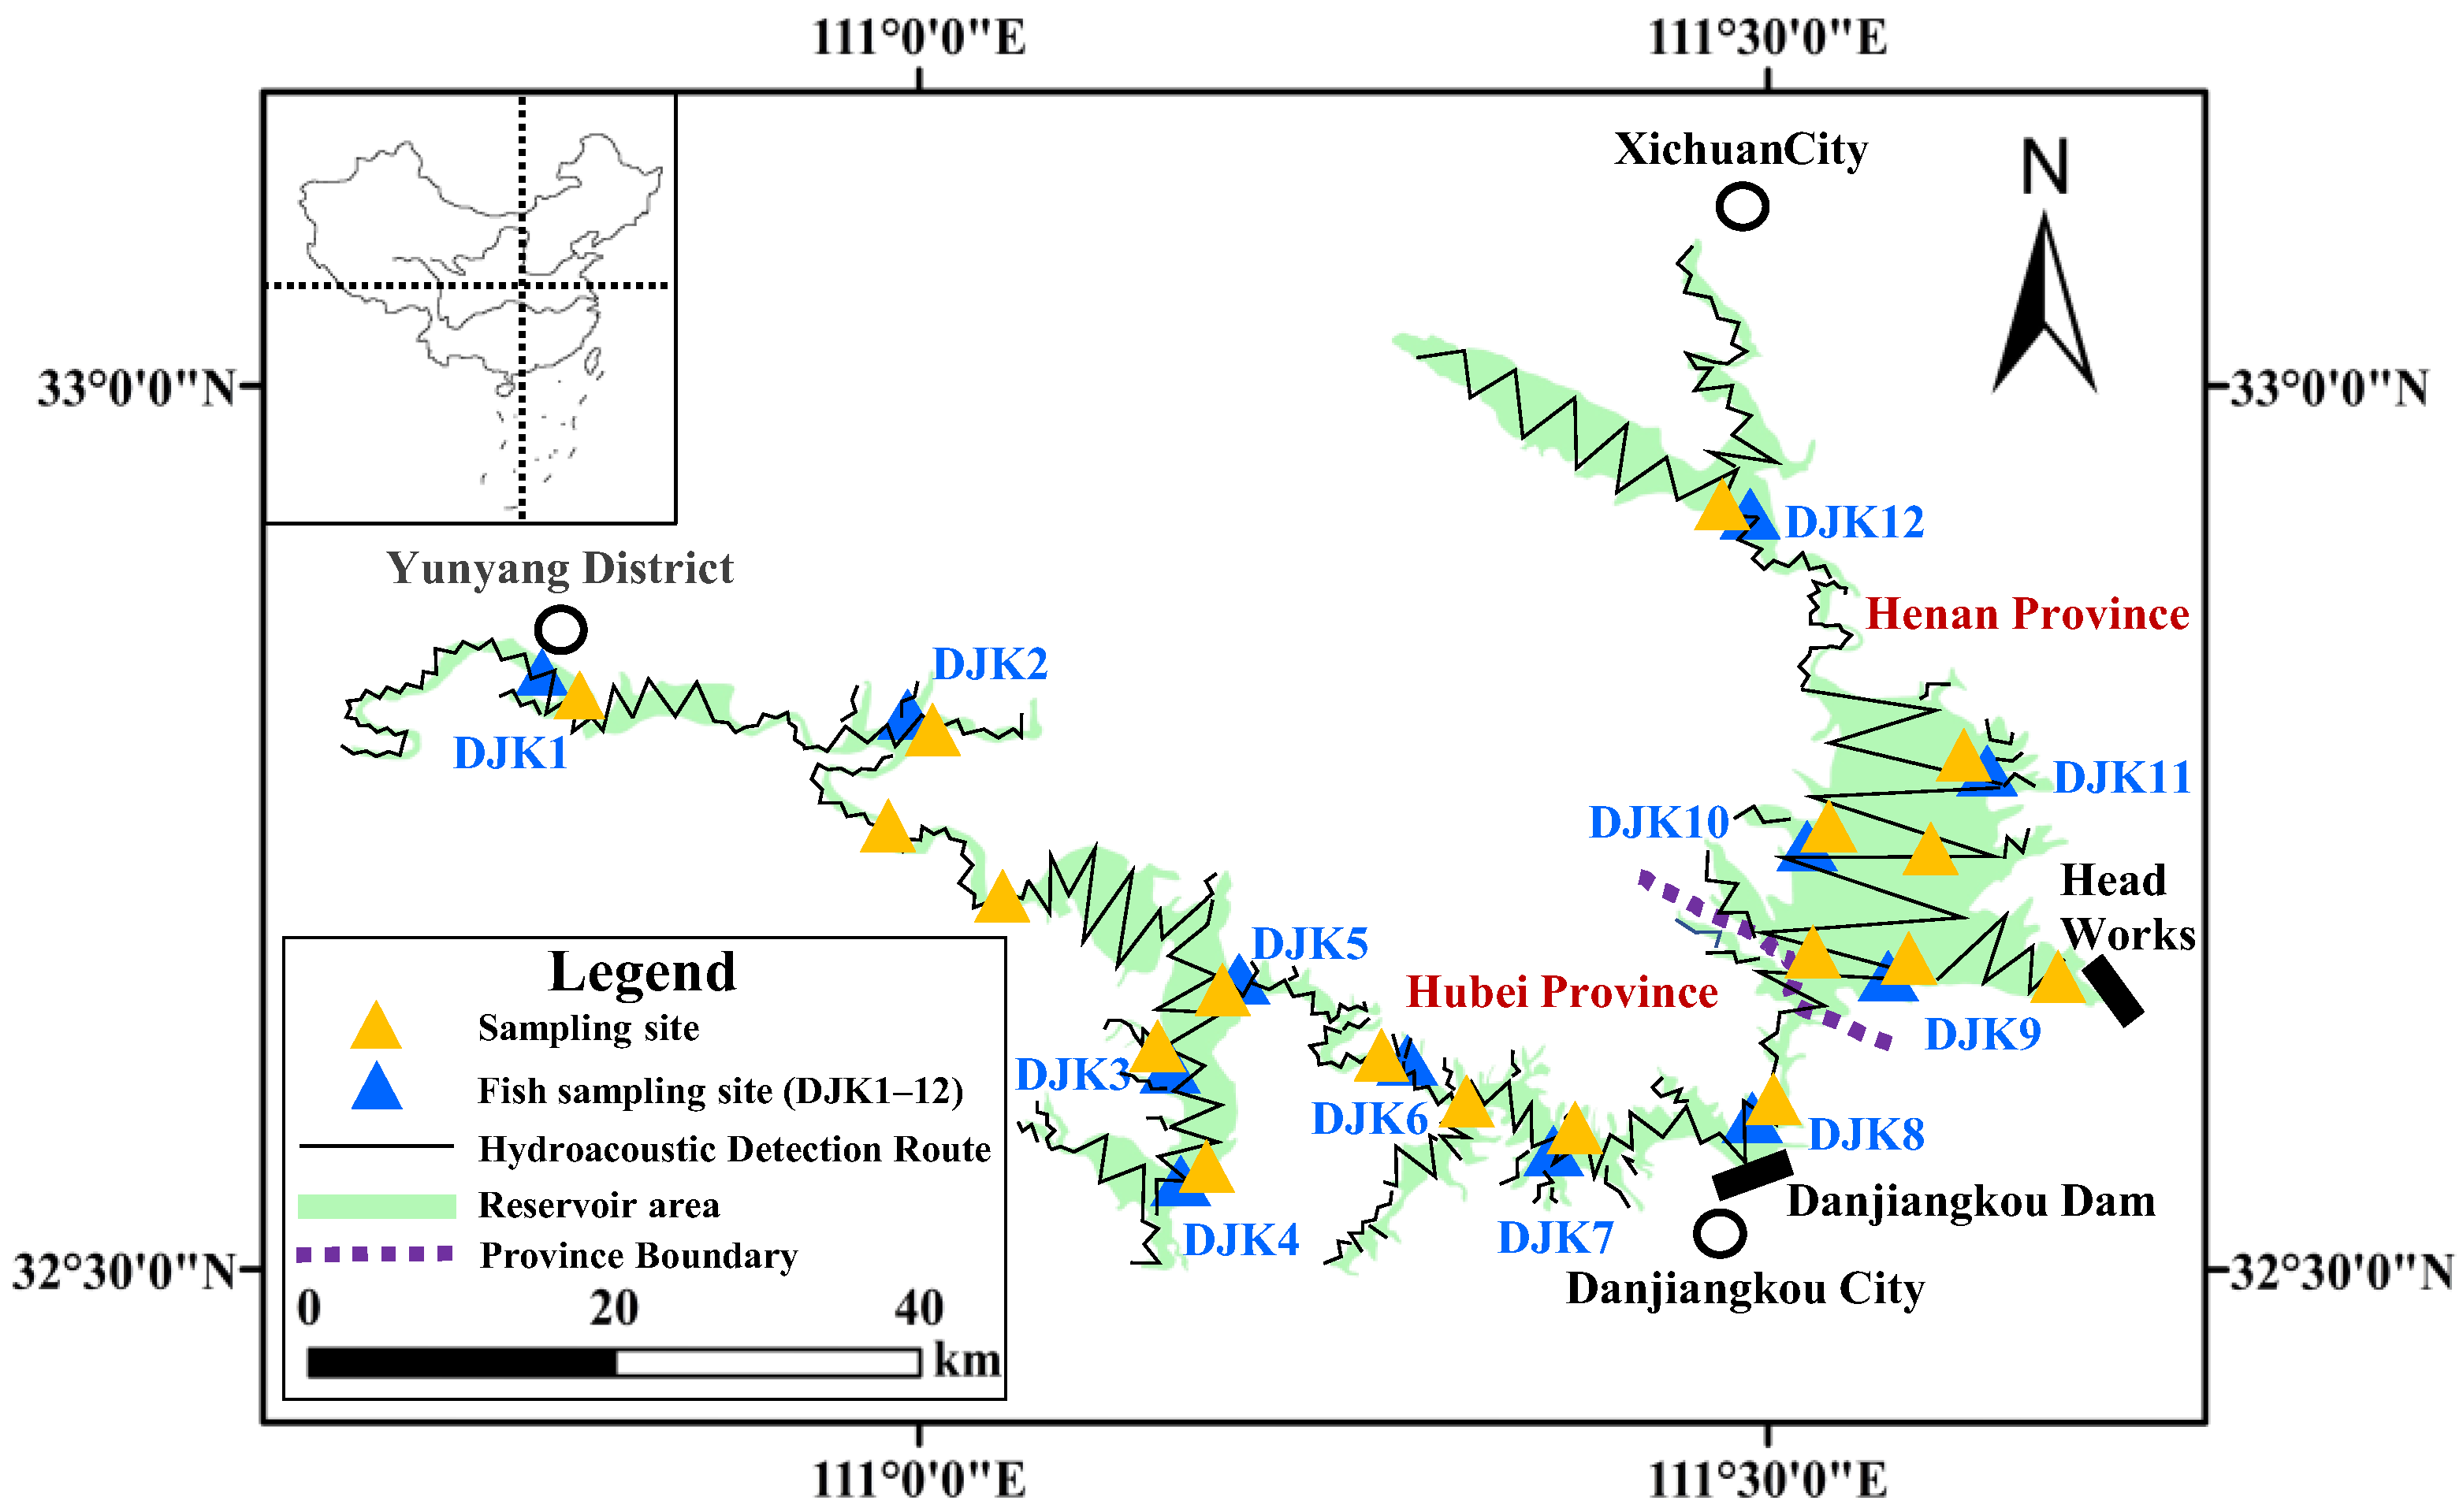
A total of 18 sampling sites for phytoplankton, zooplankton, and zoobenthos were strategically established throughout the reservoir to ensure representative spatial coverage (Figure 1). The site distribution was designed to encompass major ecological gradients, including areas influenced by the main inflows (Hanjiang and Danjiang rivers), central lacustrine zones, sheltered bays, and the fore-dam region, thereby covering diverse habitats and water retention conditions. At each site, Quantitative phytoplankton and zooplankton samples were collected using plankton nets No. 25 (mesh 0.064 mm) and No. 13 (mesh 0.112 mm), respectively. Sampling was performed at upper, middle, and lower layers, and the samples from these layers were mixed. Phytoplankton samples were preserved with Lugol’s solution (Sinopharm Chemical Reagent Co., Ltd., Shanghai, China), and zooplankton samples were fixed with formaldehyde solution (Sinopharm Chemical Reagent Co., Ltd., Shanghai, China). Zoobenthos were collected using a Petersen grab. The sediment samples were washed through a 60-mesh sieve (mesh 0.25 mm), and the organisms were manually sorted and preserved in formaldehyde solution. In the laboratory, microscopes (Sunny Optical Technology (Group) Co., Ltd., Yuyao, China) and stereomicroscopes (Leica Microsystems, Wetzlar, Germany) were used to identify the species, count the abundance, and measure the size of all plankton and zoobenthos, from which biomass was calculated. The biomass values imported into the model were the averages from the six survey rounds.
Figure 1. Sampling sites of field surveys and routes of hydroacoustic detections in the DJKR.
Although 18 sites were established for plankton and zoobenthos, the fish community was assessed at 12 strategically aligned sites (Figure 1). This design acknowledged the greater mobility of fish compared to other biotic groups and mitigated the risk of gear loss or damage from heavy vessel traffic in the reservoir. Despite the lower number of sites, the fish sampling network effectively covered the critical ecological gradient from the riverine upper reaches to the lacustrine fore-dam area. Furthermore, these 12 sites were a subset of the broader 18-site grid, ensuring spatial consistency in data collection across all surveyed biological communities. Fish sampling was performed using multi-mesh gillnets. Each sampling site was surveyed for three consecutive days (replicates), with sampling periods from 18:00 to 06:00 the next day (12 h). At each site, one floating net and one sinking net were deployed. Each multi-mesh gillnet was 5 m in height and 600 m in length, composed of 12 different mesh sizes. Each mesh type was 50 m long, with stretched mesh sizes of 1, 2, 3, 4, 5, 6, 7, 8, 10, 12, 14, and 16 cm. Captured fish were identified to species, and morphometric measurements (e.g., body length, body weight) were taken to calculate the biomass proportion of each species.
To more accurately estimate fish biomass, a hydroacoustic survey was conducted throughout the reservoir during August–September in both 2022 and 2023 []. Given the significant variation in fish distribution across different habitat types in the reservoir, the survey routes were designed to cover both the main river/open water areas and major tributaries/reservoir bays to ensure comprehensive, representative, and accurate data collection. For navigational safety, all surveys were conducted during daylight hours (08:00–18:30). The hydroacoustic data were collected using a Simrad EK80 echosounder (Kongsberg Maritime Inc., Horten, Norway) operating at 120 kHz, with a transducer −3 dB beam angle of 7° × 7°. The raw acoustic data were processed using Echoview 8.0 software, and fish density was calculated using the echo integration method (Sv/TS). Total fish biomass was calculated as fish density (from hydroacoustics) × average body weight of fish (from gillnet sampling). The biomass of each fish species was derived as total fish biomass × the species’ biomass proportion (from gillnet catch data). The biomass values imported into the model were the averages from the two survey years. Additionally, fishing yield data for the Henan section of the reservoir were obtained through interviews with local fisheries authorities and fishers. The distribution of sampling sites and the hydroacoustic survey routes are shown in Figure 1.
The spatiotemporal patterns of the fish community are detailed in Figures S1 and S2, and fishery yield data are provided in Table S1.

2.2. Model Principles

The DJKR ecosystem model was constructed using the Ecopath with Ecosim software (Version 6.5). This model represents static energy balance through a series of linear equations, which can be described as follows: Production = Fishing Mortality + Predation Mortality + Biomass Accumulation + Net Migration + Other Mortality. Mathematically, this is expressed as
B i · P / B i · E E i j = 1 n B j · Q / B j · D C j i = E X i
where Bi is the biomass of functional group i; (P/B)i is the production-to-biomass ratio of functional group i; EEi is the ecotrophic efficiency of functional group i; Bj is the biomass of predator j; (Q/B)j is the consumption-to-biomass ratio of predator j; DCji is the proportion of prey i in the diet of predator j; EXi represents the export of functional group i (including yield and migration), which in this study primarily corresponds to the fishery catch in the Henan section of the reservoir. Among these parameters, EEi is generally difficult to obtain directly and is typically estimated by the model. The other essential input parameters required by the model are as follows: Bi, (P/B)i, (Q/B)i, EXi and DCji (the diet composition matrix) [].

2.3. Functional Group Definition

The DJKR ecosystem was categorized into 22 functional groups based on biological characteristics and ecological traits. To facilitate the study, species with similar feeding habits or low biomass were grouped together [,]. The specific functional groups and their representative species are detailed in Table 1.
Table 1. Functional groups of the DJKR and their major constituent species/taxonomic groups.

2.4. Sources of Basic Model Parameters

(1)
Biomass (B)
The biomass for each functional group was derived from field surveys conducted between 2022 and 2023.
(2)
P/B Coefficient
The Production-to-Biomass (P/B) coefficient, representing biomass turnover rate and numerically equivalent to the instantaneous mortality rate (Z), was calculated for fish functional groups using the following formula:
P / B   =   Z   =   K   ×   ( L L ¯ ) / ( L ¯ L )
where K is the coefficient of the von Bertalanffy growth equation; L, L ¯ and L′ represent the asymptotic length (cm), mean length (cm), and length at first capture (cm), respectively. Relevant parameters were obtained using the Life-history tool from FishBase (https://www.fishbase.org).
For other aquatic organisms, P/B coefficients were calculated following methods described in references [,], with reference to the standard “SC/T 1149-2020 Calculation Methods for Carrying Capacity of Stock Enhancement and Aquaculture in Large Water Bodies” [].
(3)
Q/B Coefficient
The Consumption-to-Biomass (Q/B) coefficients for fish were calculated using the empirical formula from Palomares and Pauly [], supplemented by data from studies on the main canal of the MR-SNWDP [].
(4)
Diet Composition Matrix (DC)
Dietary analysis and trophic structure of fish in the DJKR were primarily investigated using carbon and nitrogen stable isotope techniques. During each survey, samples of detritus (suspended particulate organic matter, surface sediment, humus), phytoplankton, zooplankton, zoobenthos, macrophytes, and fish were collected from each sampling site for stable isotope analysis. Three to five replicates were taken for each sample type. Samples of particulate organic matter (POM) were obtained by filtering integrated water samples (from upper, middle, and lower layers) through a plankton net onto pre-combusted GF/F filters, followed by drying at 60 °C and dry storage in aluminum foil. Phytoplankton were collected using plankton net No. 25 (mesh 64 μm), with zooplankton and debris removed, then filtered onto pre-combusted GF/F filters and stored dry. Zooplankton samples were gathered with plankton net No. 13 (mesh 112 μm), allowed to evacuate their guts, filtered onto pre-combusted GF/F filters, and stored dry. Zoobenthos, after gut evacuation, were processed by pooling small individuals and extracting muscle tissue from large individuals, followed by drying at 60 °C and dry storage. Fish were identified to species, measured for basic biological traits, and dorsal white muscle was extracted, dried at 60 °C, and stored dry.
A total of 630 isotope samples were sent to the Chinese Academy of Agricultural Sciences for analysis. To determine the contribution rates of various food sources to consumers, the “simmr” package developed by Parnell [] within R software (version 4.3.1) was used for analysis via a Bayesian mixing model. Prior to analysis, Permutational Multivariate Analysis of Variance (PERMANOVA) was applied to test for significant differences in δ13C and δ15N among fish food sources; non-significantly different sources were merged []. This was implemented using the “adonis2 ()” function in the “vegan” package, with Euclidean distance and 999 permutations. The trophic enrichment factors (TEFs) for δ13C and δ15N were set at 0.4 ± 1.3‰ and 3.4 ± 1.0‰, respectively, following established values from classical foundational ecological studies [,]. The dual-isotope (δ13C–δ15N) biplot of functional groups is shown in Figure S3 in the Supplementary Materials. Using species as the classification variable, data were formatted using “simmr_load ()” function, then analyzed using “simmr_mcmc ()” function. Finally, the isotope analysis results were validated and corrected based on stomach content data and model balancing requirements. For functional groups comprising multiple species, a weighted average of the dietary proportions of each species was calculated to generate the final diet matrix, detailed in Table 2.
Table 2. Matrix of diet composition for the DJKR ecosystem model.

2.5. Model Balancing and Optimization

The Ecopath model operates as a steady-state model. Following the PREBAL diagnostic procedure [] (details provided in Table S2 in the Supplementary Materials), we evaluated the ecological plausibility of all input parameters before model balancing. After entering all required parameters for the functional groups, it is essential to ensure that 0 < EE ≤ 1 and P/Q < 0.3 to comply with ecological and thermodynamic principles [,]. Therefore, when necessary, relevant parameters should be adjusted to balance and optimize the model, achieving both mass and energy balance. During this debugging process, adjustments to data from reliable sources should be avoided. Specifically, this study involved minimal adjustments to biomass inputs and only limited modifications to the diet matrix. Relatively more frequent adjustments were made to parameters obtained from literature, such as P/B and Q/B ratios. For example, when the ecotrophic efficiency (EE) of a functional group exceeded 1, we would achieve model balance by appropriately increasing its P/B ratio.

3. Results

3.1. Food Web Structure

3.1.1. Food Web Composition

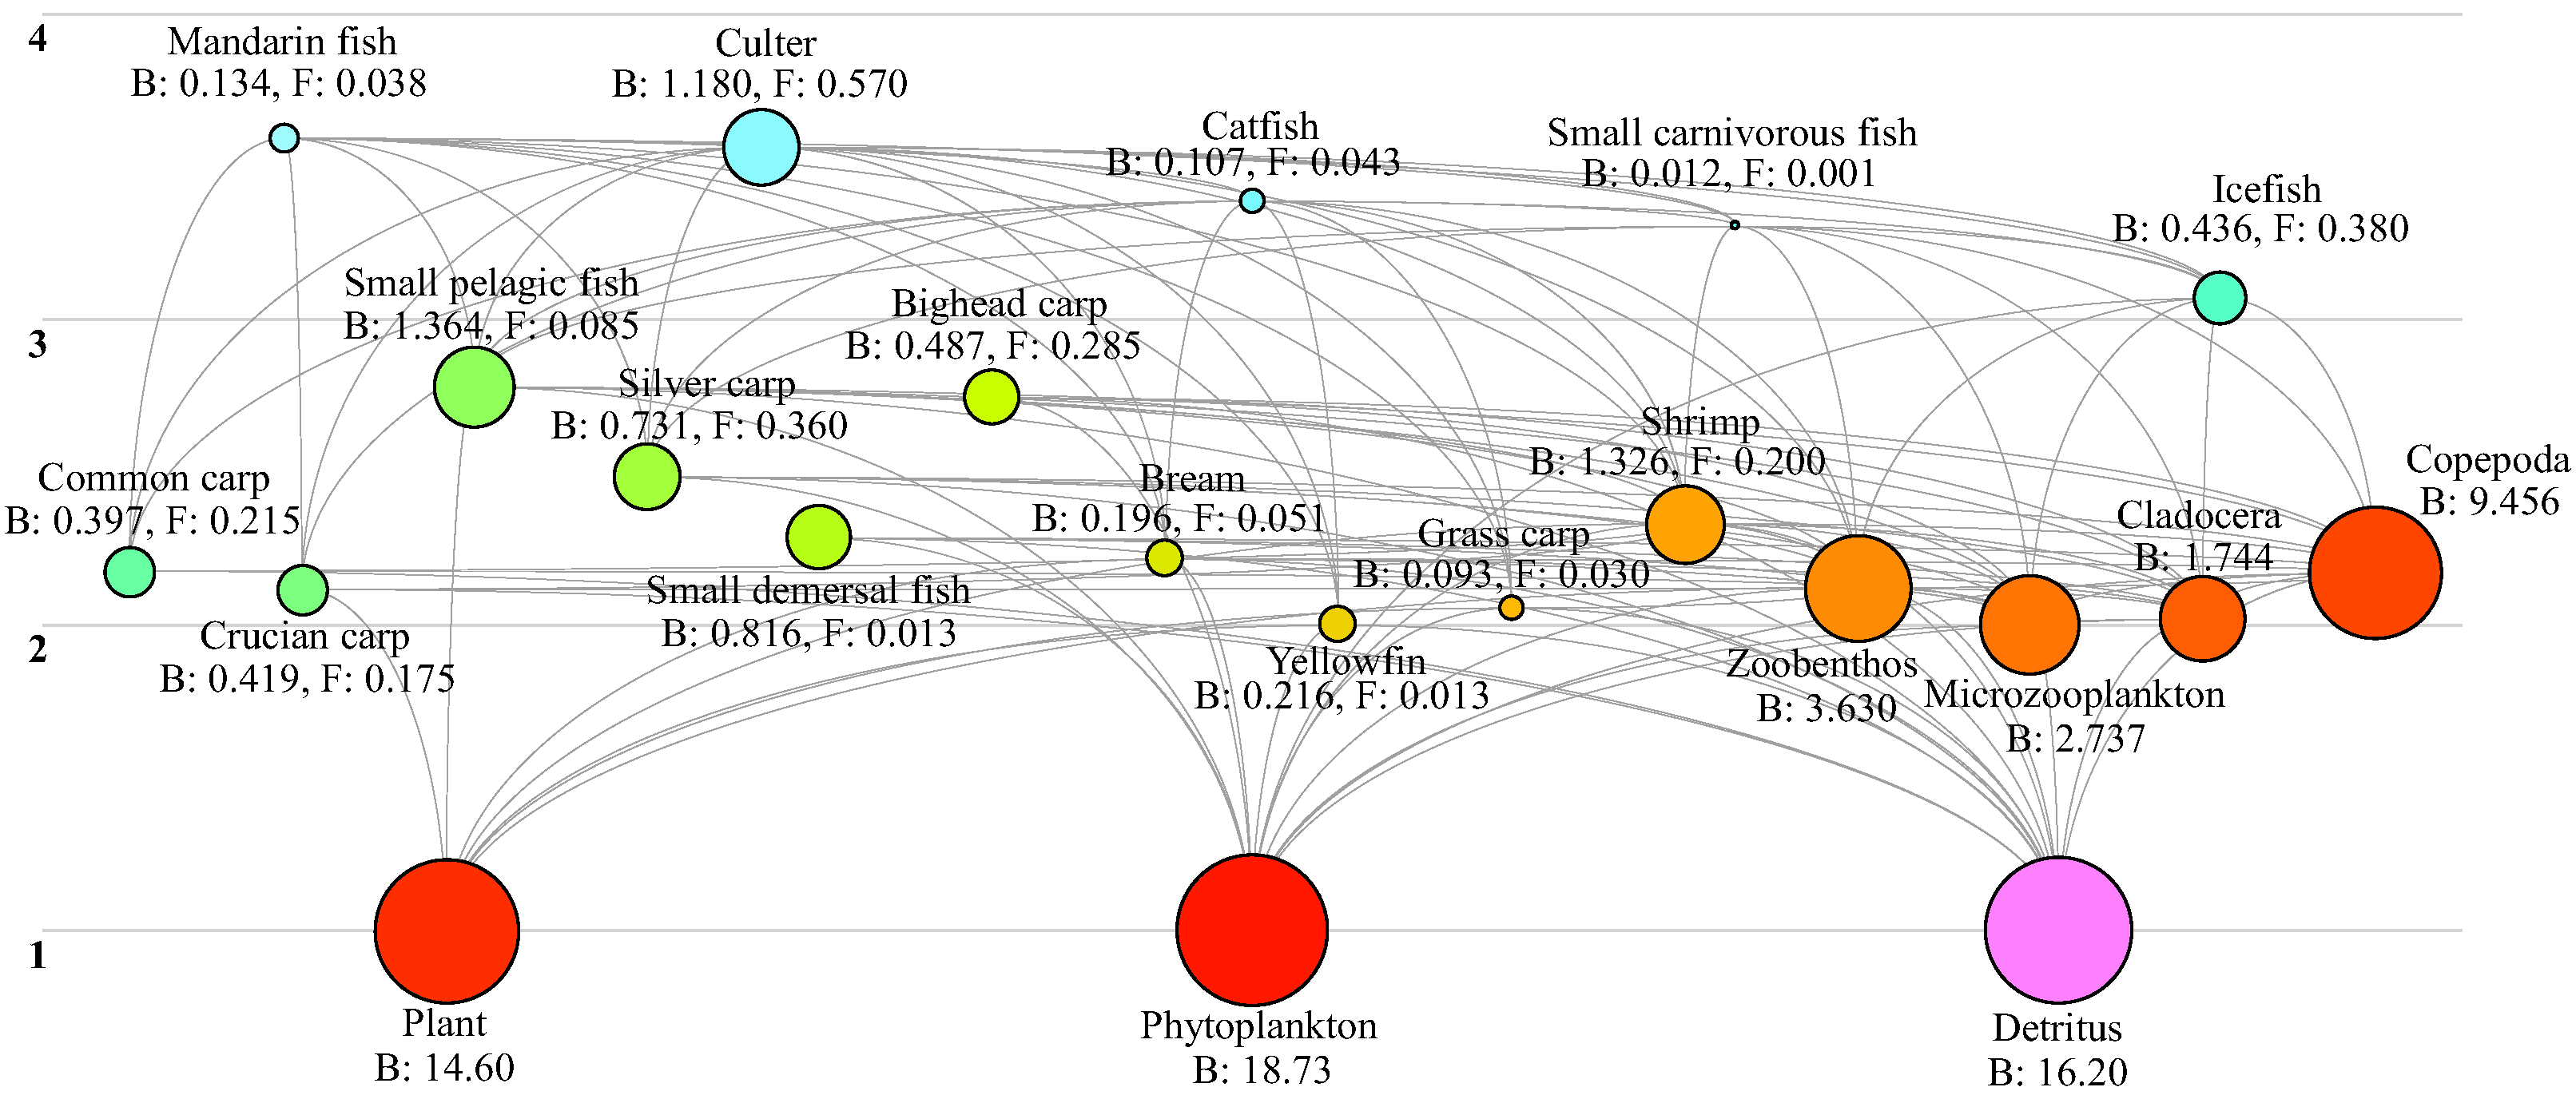
The food web of DJKR was interconnected through trophic relationships that facilitate energy transfer (Figure 2). The results indicated that the 22 functional groups spanned trophic levels (TL) ranging from 1 to 3.59. Primary producers and detritus occupied the lowest trophic level, while mandarin fish (S. chuatsi, S. kneri) occupied the highest. It is noteworthy that the biomass of the introduced N. taihuensis was relatively high, with an estimated biomass of 0.436 t km−2·year−1. Furthermore, the zooplankton community in the DJKR exhibited a suboptimal standing stock structure. The biomass of microzooplankton (2.737 t km−2) and Cladocera (1.744 t km−2) was significantly lower than that of Copepoda (9.456 t km−2) (Figure 2).
Figure 2. Food web structure of the DJKR ecosystem. In the figure, circles of different colors represent distinct functional groups, with circle size proportional to biomass. The B and F values (in t km−2) below each circle represent the biomass and fishing fleet (fishery catches), respectively.

3.1.2. Ecotrophic Efficiency

In the DJKR ecosystem, most fish functional groups exhibited ecotrophic efficiency (EE) values below 0.7. Regarding zooplankton, the low standing stocks of microzooplankton (e.g., protozoans, rotifers) and Cladocera resulted in high EE values of 0.94 and 0.96, respectively. In contrast, Copepoda, with their higher standing stock, had a relatively low EE of only 0.16. The EE value for primary producers (phytoplankton) was also moderate at 0.38 (Table 3).
Table 3. Basic parameters of the DJKR ecosystem model.

3.1.3. Mixed Trophic Impacts

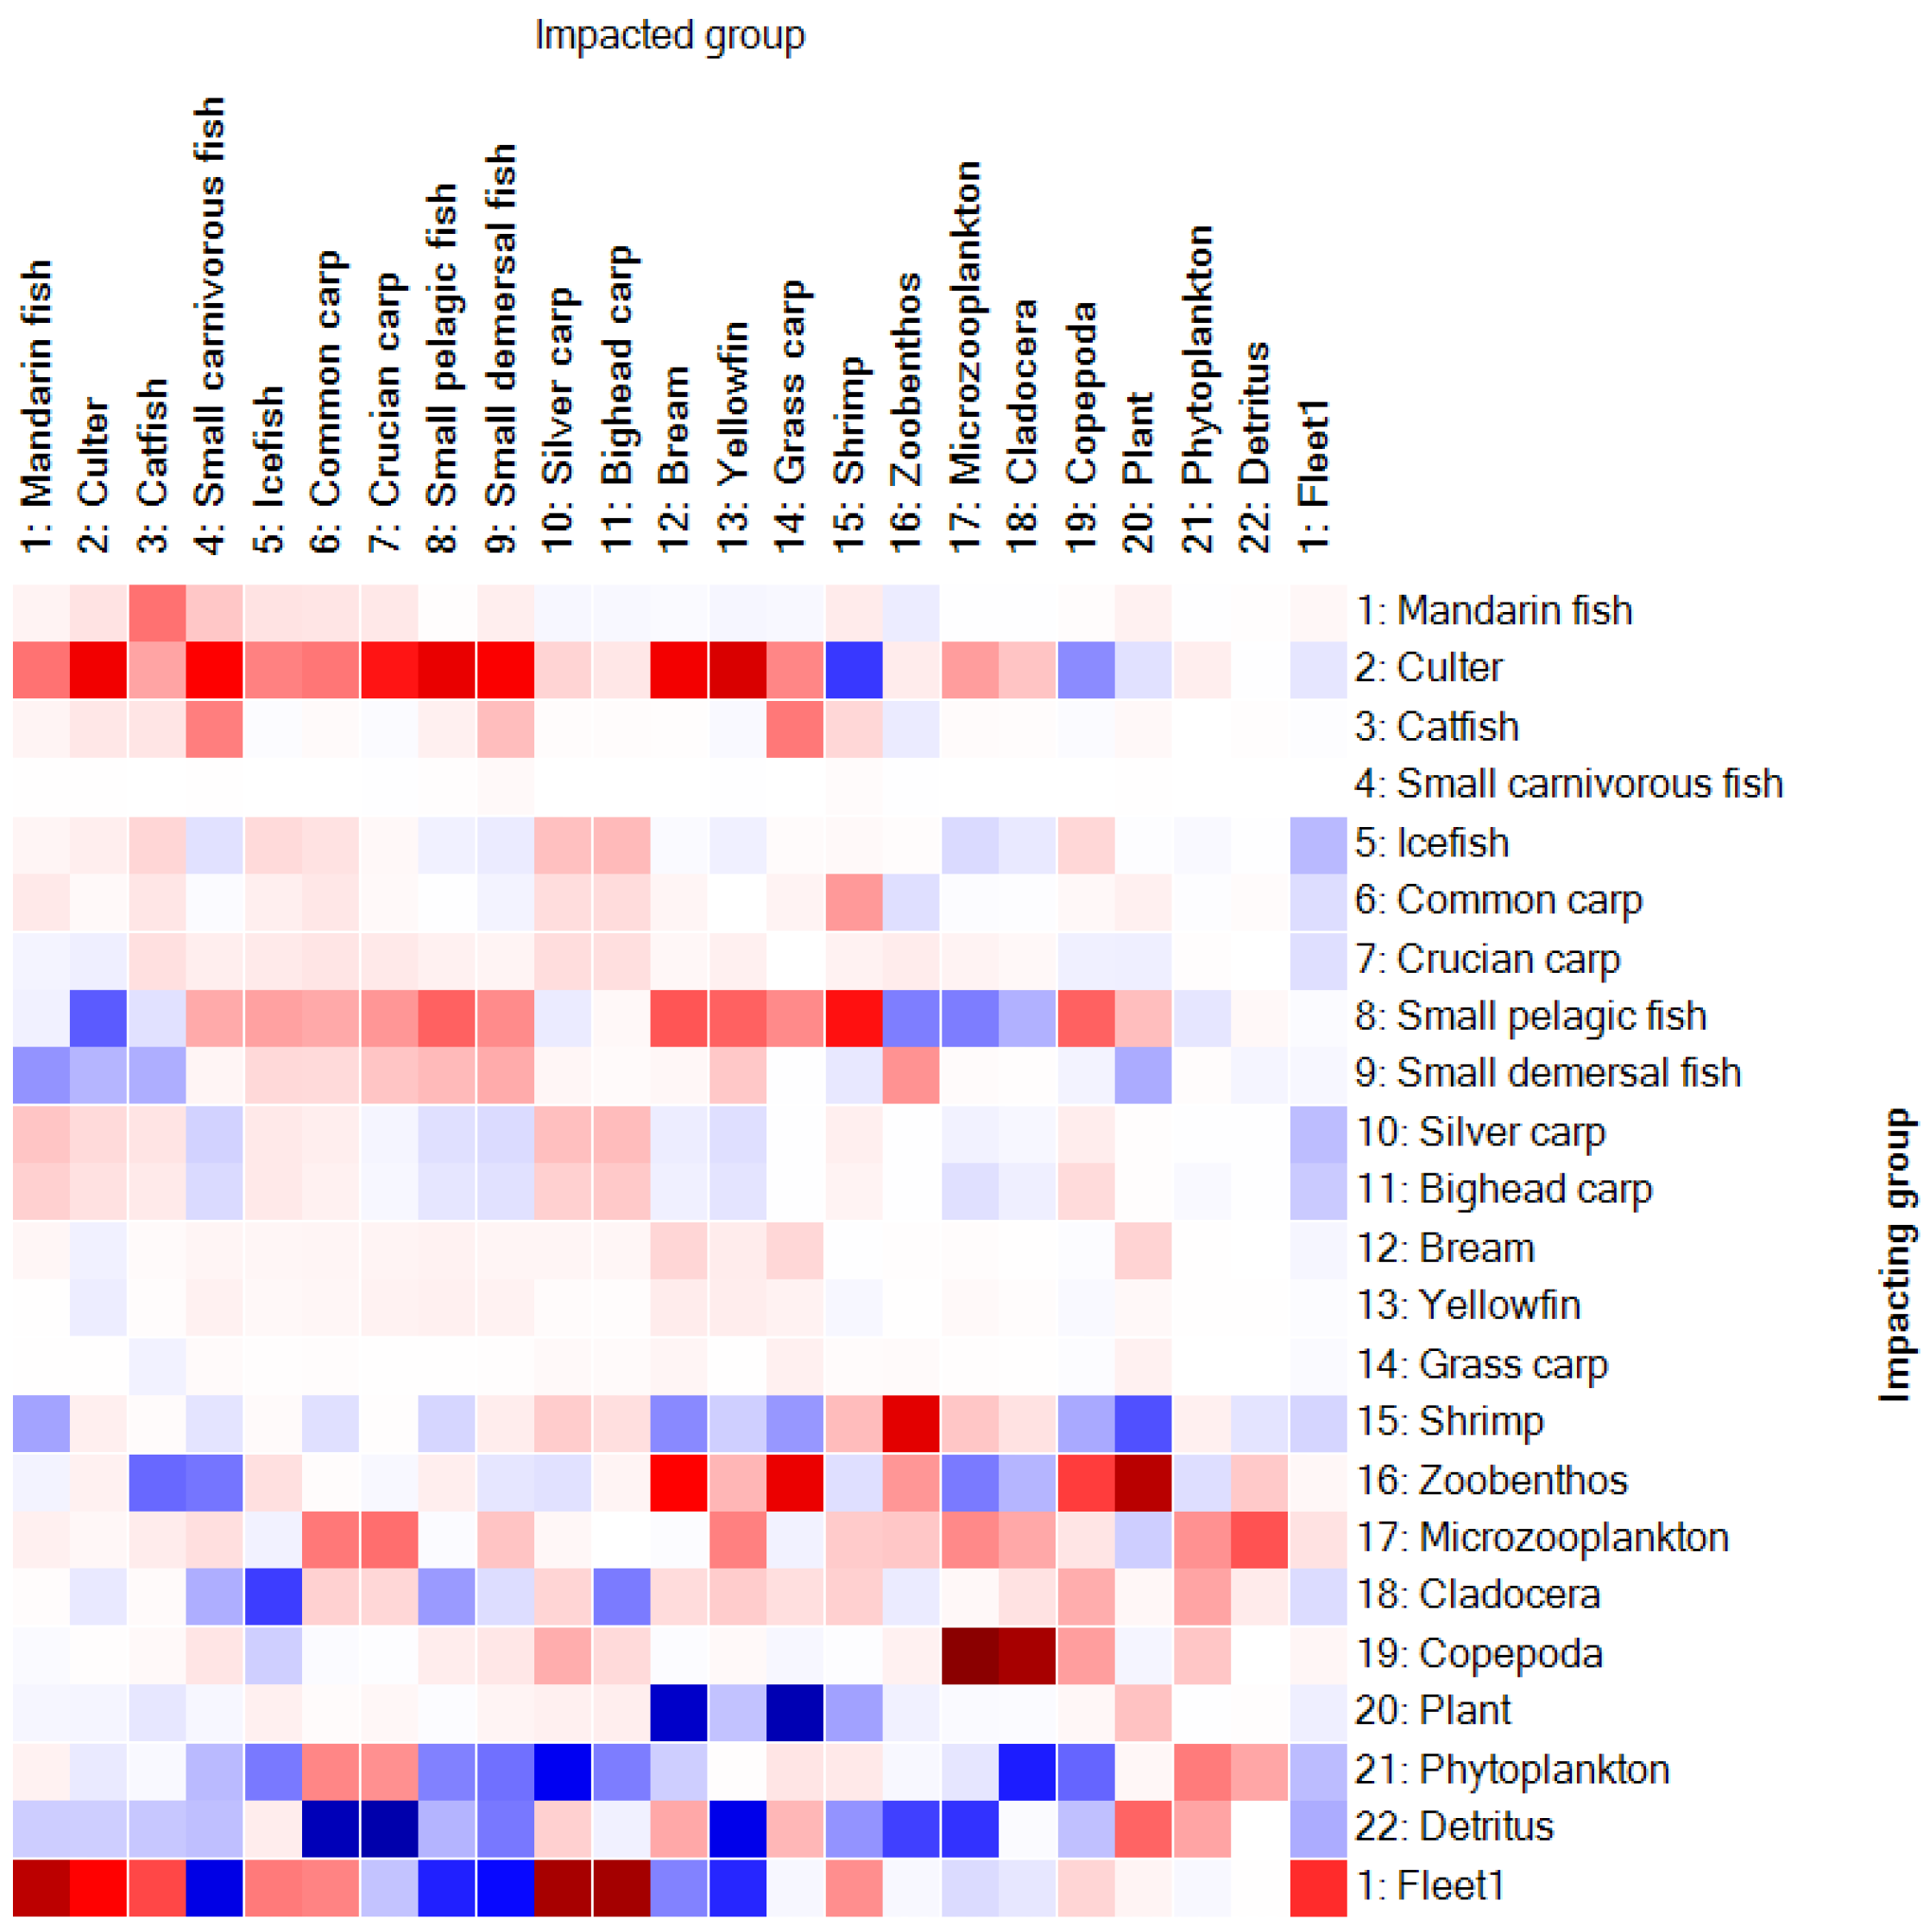
The Ecopath model integrates the Mixed Trophic Impacts (MTI) among functional groups, which describes both positive and negative impacts of any functional group (including fishery activities) on others. The MTI results for the DJKR are illustrated in Figure 3. Overall, piscivorous fish (mandarin fish, culter, catfish, small carnivorous fish) exhibited negative impacts on small pelagic (H. leucisculus, H. bleekeri, P. sinensis) and small demersal fish (P. simoni, S. argentatus, S. dabryi, A. macropterus). Small pelagic and small demersal fish, in turn, negatively affected zooplankton. The introduced N. taihuensis had negative impacts on multiple functional groups, including zooplankton (microzooplankton, Cladocera, Copepoda). Zooplankton negatively influenced phytoplankton. The fishery (fleet group) showed negative impacts on most fish groups, while exhibiting some positive effects on prey organisms such as shrimp, zooplankton, and zoobenthos.
Figure 3. MTIs among functional groups in the DJKR ecosystem (red represents negative impacts, blue represents positive impacts, and the color intensity reflects the degree of impact).

3.2. Characteristics of Energy Flow

To facilitate the description of energy transfer efficiency between trophic levels in the ecosystem, the functional groups in the Ecopath model were aggregated into seven discrete trophic levels. As the actual study only included the first four trophic levels, with minimal energy transfer to TL V–VII, these higher levels were not considered.
The model results indicate the presence of two primary food chains in the DJKR: the grazing food chain and the detrital food chain. The grazing food chain starts with plant-based resources, which in lacustrine systems typically refer to phytoplankton, periphyton, and aquatic macrophytes. The pathway is as follows: phytoplankton/periphyton/macrophytes (→ zooplankton) → fish. The detrital food chain begins with organic detritus, a mixture of particulate organic matter and bacteria. Its energy flow generally follows the path organic detritus → zoobenthos/detritivorous fish.
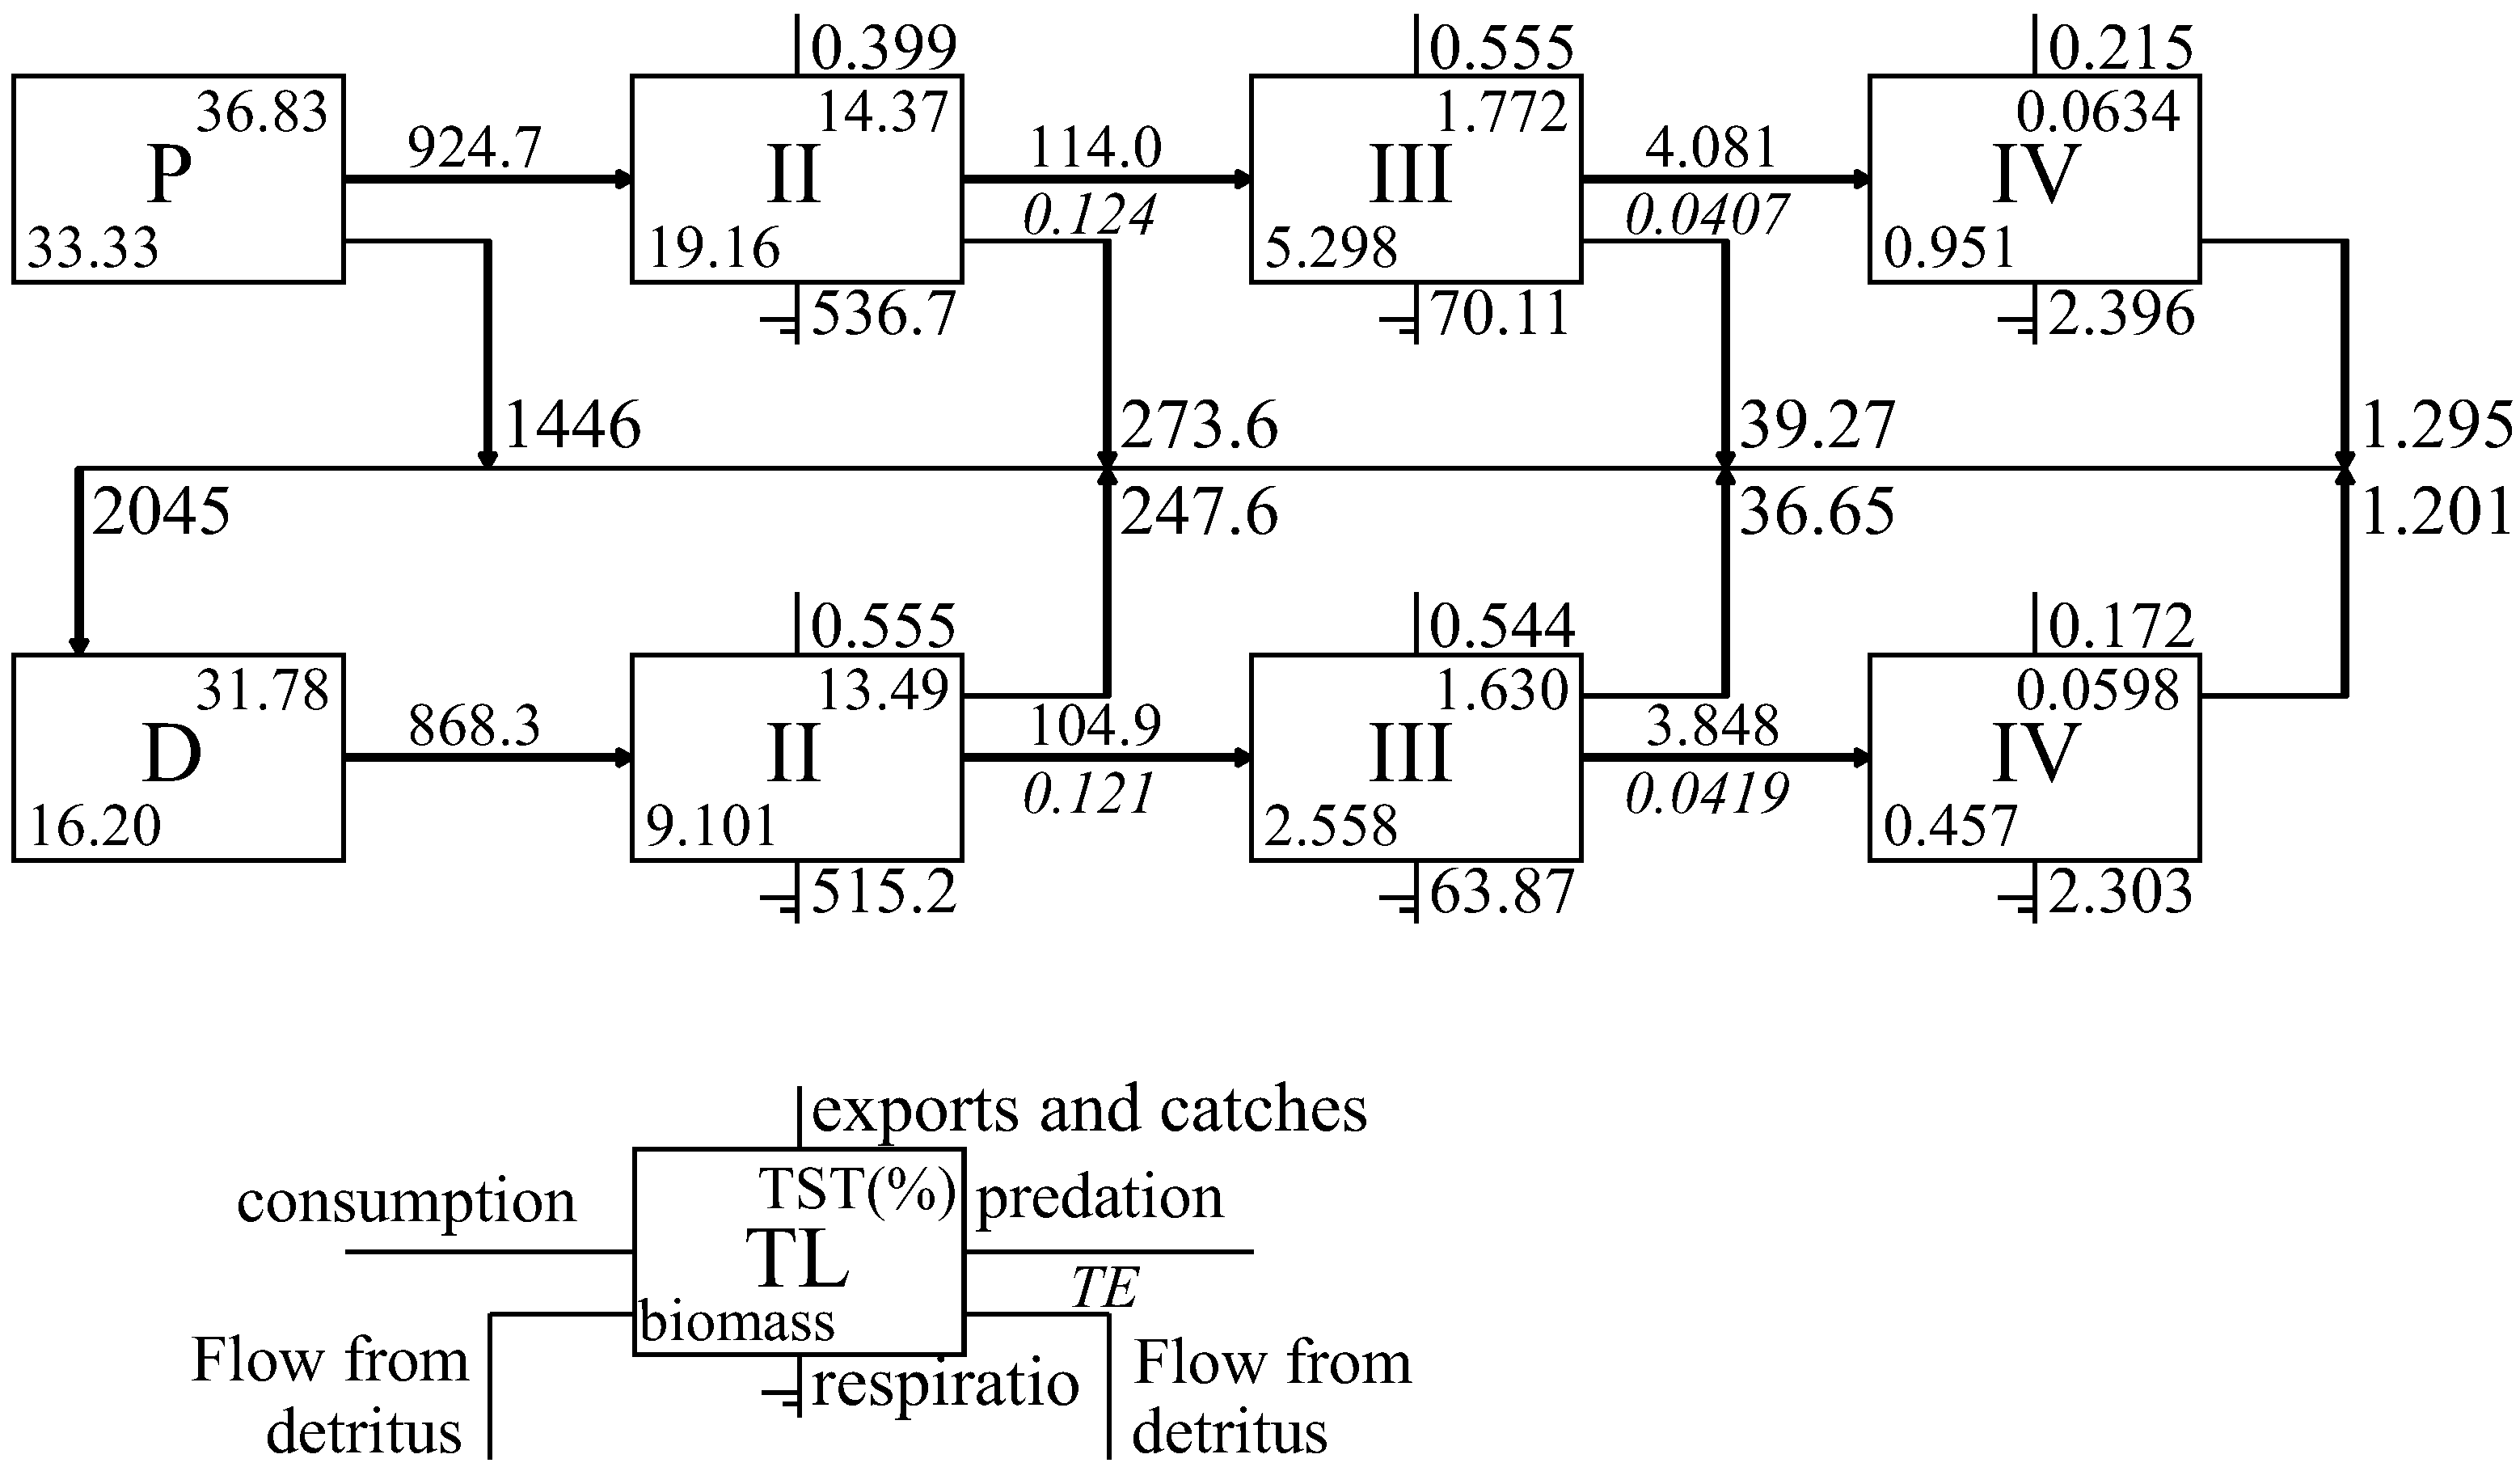
In the DJKR, the energy flow from TL I to TL II in the grazing food chain was 924.7 t km−2 year−1. The transfer efficiencies from TL II to TL III and from TL III to TL IV were 12.40% and 4.07%, respectively, yielding an average transfer efficiency of 8.24%. For the detrital food chain, the energy flow from TL I to TL II was 868.3 t km−2 year−1, with subsequent transfer efficiencies of 12.10% (TL II to TL III) and 4.19% (TL III to TL IV), resulting in an average efficiency of 8.15% (Figure 4). Both the initial energy flow from TL I to TL II and the average transfer efficiency from TL II to TL IV were greater in the grazing food chain than in the detrital food chain.
Figure 4. Energy flow among TLs in the DJKR ecosystem. Box annotations indicate: P—grazing food chain energy flow; D—detrital food chain energy flow; TL—trophic level; Roman numerals—specific trophic level numbers.

3.3. Overall Ecosystem Characteristics

The overall characteristic parameters of the DJKR ecosystem are presented in Table 4. The total system throughput for the ecosystem was 6439.88 t·km−2·year−1. Total consumption, total exports, total respiration, and total flow to detritus accounted for 31.37%, 18.35%, 18.49%, and 31.79% of the total system throughput, respectively.
Table 4. The characteristic parameters of the DJKR ecosystem.
Furthermore, a series of ecosystem parameters calculated by the Ecopath model were used to assess ecosystem maturity. According to Odum [] and Christensen [], as a system matures, energy flows become more balanced, meaning the ratio of Total Primary Production to Total Respiration (TPP/TR) tends toward 1 during succession towards maturity. The TPP/TR value for the DJKR ecosystem was 1.99.
The Ecopath model also computes several indices to characterize ecosystem stability, primarily the connectance index (CI) and system omnivory index (SOI) values, which help evaluate whether the trophic interactions lean towards a linear or web-like structure. The CI and SOI values for the DJKR ecosystem were 0.259 and 0.127, respectively.

4. Discussion

4.1. Food Web Structure and Ecological Impacts of the Introduced N. taihuensis

As the water source for the MR-SNWDP, the DJKR’s most critical ecological service function is to maintain ecosystem and water quality health and stability. Overall, the reservoir’s ecosystem currently possesses a relatively complete set of functional groups. Benefiting from the year-round fishing ban in the Hubei section and the seasonal fishing ban in the Henan section, the EE values for most fish species in the DJKR ecosystem were below 0.7, indicating that fish resources were not overexploited.
A notable concern was the currently high biomass of the introduced N. Taihuensis in the reservoir, which may pose potential risks to ecosystem health and water quality security. These risks manifest as follows. Firstly, N. taihuensis exerts strong grazing pressure on zooplankton through predation [], potentially leading to excessive algal proliferation. Secondly, it directly competes with silver carp (H. molitrix) and bighead carp (A. nobilis)—key species in “non-traditional biomanipulation” (bottom-up biomanipulation)—for food and habitat, thereby reducing their filtration pressure on algae. Finally, through direct competition and complex trophic cascades [], the introduced N. taihuensis can negatively impact species relevant to “traditional biomanipulation” (top-down control), such as culter, mandarin fish, and catfish (Figure 3), weakening their top-down control effect on algae.
Evidence of these mechanisms was already apparent in the zooplankton community structure and the EE value of phytoplankton. The current biomass of microzooplankton (which constituted 19.64% of total zooplankton biomass) and Cladocera (12.51%) in the DJKR was significantly lower than that of Copepoda (67.85%). This aligns with findings from surveys in 2017 [] and 2019 []. This imbalance was likely related to prey selectivity—compared to Cladocera, which have stronger algae-control capabilities [] but weaker swimming ability [], Copepoda possess superior escape capabilities, giving them a survival advantage under predation pressure from species like N. taihuensis, H. leucisculus, and H. bleekeri []. This structural imbalance, characterized by “Copepoda dominance and Cladocera scarcity”, resulted in insufficient grazing pressure on phytoplankton (indicated by the low phytoplankton EE of only 0.38, suggesting underutilization), posing a potential risk of cyanobacterial blooms that warrants significant attention.

4.2. Energy Flow Characteristics

In most mature terrestrial and shallow-water ecosystems, the majority of biomass is not consumed but decomposes after death, making the detrital food chain the dominant pathway for energy flow. Although the grazing food chain is most commonly observed by researchers, it is not the primary food chain in terrestrial or many aquatic ecosystems, except in specific aquatic systems where it becomes the main channel for energy flow [,]. Odum [] also suggested that mature ecosystems tend to rely more heavily on the detrital food chain. Model results indicated that the energy flow through the grazing food chain (924.7 t·km−2·year−1) was higher than that through the detrital food chain (868.3 t·km−2·year−1), which suggests that the DJKR ecosystem was not yet fully mature.
Furthermore, the average energy transfer efficiencies for the grazing and detrital food chains in the DJKR ecosystem were 8.24% and 8.15%, respectively (Figure 4). These values were lower than the theoretical “one-tenth” value proposed by Lindeman [] and the average transfer efficiency for global aquatic ecosystems (10.0%) []. Specifically, the transfer efficiency from TL II to TL III was relatively high (12.30%), partly due to the high conversion efficiency (EE values of 0.94 and 0.96, respectively) of microzooplankton and Cladocera, which were effectively utilized by predators. In contrast, the transfer efficiency from TL III to TL IV was low (4.13%), indicating that a substantial portion of small fish resources (such as N. taihuensis, H. leucisculus, H. bleekeri, S. argentatus, and S. dabryi) were not fully utilized by predators. This inefficiency hinders the effective cycling of materials and energy flow within the ecosystem.
The low energy transfer efficiency in the DJKR ecosystem can be attributed to multiple interacting factors. The structural simplification of the food web, reflected in the moderate CI and SOI indices, limits alternative energy pathways and reduces the system’s resilience to perturbations. Additionally, the apparent trophic uncoupling between small fish and their predators suggests an imbalance in the predator-prey size spectrum, where insufficient biomass of large piscivorous fish fails to effectively control the abundant small fish populations. Furthermore, the ecosystem’s intermediate maturity, as indicated by the TPP/TR ratio and the relative dominance of the grazing food chain, contributes to this pattern, as the system has not yet developed the complex trophic interactions and efficient detrital pathways characteristic of mature ecosystems.
Notably, since the main or partial diet of these small fish in the DJKR consists of zooplankton, their high biomass further increased the risk of algal proliferation.

4.3. Ecosystem Assessment

To provide a more scientific and objective evaluation of the current state of the DJKR ecosystem, we compared it with typical reservoir ecosystems in China that have been reported in the recent literature [,,,], as well as with the geographically proximate and climatically similar Qingjiang cascade reservoirs [] (Table 5). The compared reservoirs include Zhangze Reservoir (ZZR) in Shanxi Province, Qianxiahu Reservoir (QXHR) and Qiandaohu Reservoir (QDHR) in Zhejiang Province, Tanghe Reservoir (THR) in Liaoning Province, and the Shuibuya Reservoir (SBYR), Geheyan Reservoir (GHYR), and Gaobazhou Reservoir (GBZR) in Hubei Province.
Table 5. Comparison of ecosystem characteristics of typical reservoirs in China.
Total system throughput (TST), which represents the magnitude of material flux and reflects the overall system scale [,], was 6439.88 t·km−2·year−1 in the DJKR. This value was relatively low compared to other reservoirs, indicating a small ecosystem scale. Two primary factors may explain this observation. Firstly, the operation of the MR-SNWDP significantly increased the reservoir’s storage capacity and surface area (by 66% and 21%, respectively) []; secondly, stringent nitrogen and phosphorus input controls and non-point source pollution mitigation measures have been implemented in the catchment [], which has resulted in a relatively lower carrying capacity of the water body.
Regarding ecosystem maturity, the DJKR ecosystem had a TPP/TR value of 1.99. This indicates higher maturity level compared to the QDHR (6.51), ZZR (4.00), THR (3.70), and GBZR (3.25), but lower maturity level than SBYR (1.19), GHYR (1.24), and QXHR (1.54), placing it at an upper-medium level.
Ecosystem stability can be assessed using the CI and SOI values. Stability increases as food chains transition from linear to web-like structures and system connectivity strengthens []. The CI and SOI values for the DJKR were 0.259 and 0.127, respectively. These values indicate higher ecosystem stability compared to SBYR (CI: 0.256, SOI: 0.112), GBZR (0.236, 0.102), and GHYR (0.234, 0.089), but lower stability than THR (0.299, 0.142), QXHR (0.270, 0.200), ZZR (0.267, 0.149), and QDHR (0.263, 0.131), positioning the DJKR ecosystem at a lower-medium level. The moderately low CI and SOI values for the DJKR may be related to its relatively small ecosystem scale, as energy tends to be more dispersed and connections between biological groups are often weaker in smaller-scale ecosystems [,].
Ecosystem succession is a process directed towards maturity, typically following specific trajectories and patterns, and aims to maximize biomass and optimize energy flow [,,]. Overall, the DJKR ecosystem was not yet fully mature, with its maturity and stability generally at a medium level. This can be primarily attributed to the following factors: (1) changes in water environment and hydrological–hydrodynamic characteristics after the operation of the MR-SNWDP, particularly the substantial increases in storage capacity and water surface area; (2) the ongoing structural changes in the aquatic biological community (unpublished data) and the rapid increase in fish resources [] observed between 2022 and 2023, likely associated with the implementation of environmental policies such as the full-year fishing ban (Hubei section) and seasonal fishing ban (Henan section). This suggests that the fish community and aquatic ecosystem of the DJKR may still be in a critical stage of succession; (3) Considerable interannual fluctuations in the population size of N. taihuensis, with estimated biomasses of 0.353 t·km−2, 0.332 t·km−2, and 0.624 t·km−2 for 2021, 2022, and 2023, respectively. Furthermore, based on interviews with fishery authorities and fisheries in Xichuan County, the annual catch of N. taihuensis in the Henan section fluctuated between 280 and 600 tons from 2021 to 2023.

4.4. Management and Conversation Recommendations

Influenced by the operation of the MR-SNWDP, fishing bans, invasive species, and other factors, the DJKR ecosystem currently exhibits an overall medium level of maturity and stability and is potentially at a critical successional stage. Key identified issues include the following: (1) the large population size of the introduced N. taihuensis; (2) low energy transfer efficiency between trophic levels (TL) III and IV; and (3) an unbalanced zooplankton community structure and low utilization efficiency of primary productivity.
Fundamentally, these issues can be attributed to a single overarching problem: the excessively high standing stocks of the introduced N. taihuensis and indigenous zooplanktivorous fish (e.g., H. leucisculus, H. bleekeri) (Figure 2, Table 3). These exert top-down effects that alter the zooplankton community structure and reduce the utilization efficiency of primary productivity (especially phytoplankton), posing potential water quality risks. Concurrently, from a bottom-up perspective, they were not fully utilized by predators, hindering efficient material cycling and energy flow within the ecosystem. To address these problems, the following fish community structure optimization measures are proposed to help maintain the health and stability of the DJKR ecosystem and its water quality.
(1)
Enhance Targeted Removal of N. taihuensis
N. taihuensis was introduced into the DJKR in 1998, and by 2008, it had formed a biomass of 3000 t with an annual catch of 2000 t []. This study estimated the annual catch of N. taihuensis in the Henan section from 2021 to 2023 was also 280–600 t. Stable isotope and stomach content analysis indicates low predation efficiency on N. taihuensis by piscivorous fish; therefore, the most effective control measure currently available is targeted removal through fishing. Research shows that N. taihuensis in the DJKR has two spawning cohorts: a spring cohort (January–May, peak spawning March–April) and an autumn cohort (September–October), with the spring cohort being dominant [,]. The current fishing season in the Henan section (September to February of the following year) does not effectively target the spring cohort. To more effectively control the N. taihuensis population, it is recommended that relevant management authorities implement targeted removal measures specifically for this species even during the closed fishing season (March–August), tailored to its life history, to reduce its impact on the reservoir ecosystem and water quality.
(2)
Control Indigenous Zooplanktivorous Fish Populations
Studies globally have shown that removing zooplanktivorous fish [] or reducing their stocking levels [] can facilitate the recovery of large-bodied Cladocera and subsequently improve water quality. This study revealed a distinct spatial distribution pattern for the two dominant species the DJKR—the Mongolian culter (C. mongolicus) and the sharpbelly (H. leucisculus); the Hubei section (under a full-year fishing ban) exhibits a pattern of “more Mongolian culter, fewer sharpbelly”, whereas the Henan section (under a seasonal fishing ban) shows a pattern of “fewer Mongolian culter, more sharpbelly” (Figure 5). The Mongolian culter can effectively control the populations of sharpbelly, H. bleekeri, and similar species through predation and competition (as observed in the Hubei section). However, in the Henan section, the abundance of Mongolian culter is relatively low, likely due to fishing pressure, weakening its top-down control on small zooplanktivorous fish like the sharpbelly.
Figure 5. Spatial distribution of C. mongolicus (a) and H. leucisculus (b) in the DJKR. DJK1–12 represent the 12 fish sampling sites (see locations in Figure 1).
Given the strong regulatory role of piscivorous fish on the fish community through top-down effects, and considering the full-year fishing ban already in place in the Hubei section, expanding their populations through stock enhancement is not currently advisable. However, the current catch management regulations in the Henan section lack specificity, leading to the selective harvesting of high-value piscivorous fish. It is recommended that fisheries management authorities focus on restricting the catch of piscivorous fish such as Mongolian culter, topmouth culter (C. alburnus), and mandarin fish (S. chuatsi, S. kneri), particularly larger individuals (>20 cm). Their population size and size structure should be managed within ranges suitable for ecological regulation needs, to help control populations of sharpbelly, and similar species in the Henan section, alongside strengthened population dynamic monitoring. Implementing these regulatory measures is expected to effectively reduce the density of small zooplanktivorous fish in the Henan section, optimize the fish community structure, and enhance the capacity for controlling cyanobacterial blooms.

5. Conclusions

(1) The DJKR ecosystem maintains relatively complete functional groups across trophic levels 1–3.59. Energy flows predominantly through the grazing food chain, which demonstrates higher transfer magnitude and efficiency than the detrital pathway. Model analysis revealed significant negative impacts of the introduced icefish (N. taihuensis) on most functional groups. Ecosystem indices (TPP/TR = 1.99, CI = 0.259, SOI = 0.127) collectively indicate a moderate level of maturity and stability.
(2) Current challenges include the proliferation of N. taihuensis, inefficient energy transfer between trophic levels III–IV, and suboptimal zooplankton community structure with low primary productivity utilization. These issues are primarily driven by excessive standing stocks of introduced icefish and native zooplanktivorous fish.
(3) We recommend the targeted removal of N. taihuensis and control of native zooplanktivorous fish to optimize community structure, enhance phytoplankton utilization, and improve material cycling and energy flow efficiency in the reservoir.

Supplementary Materials

The following supporting information can be downloaded at: https://www.mdpi.com/article/10.3390/fishes10110576/s1, Table S1. Annual fishery catches data (t) from the Henan section of Danjiangkou Reservoir, 2022–2023; Table S2. Summary of the PREBAL diagnostic procedure for the Ecopath model; Figure S1. Temporal variation in fish communities of Danjiangkou Reservoir based on PCoA (a) and cluster analysis (b) of gill net survey data; Figure S2. Spatial variation in fish communities of Danjiangkou Reservoir based on PCoA (a) and cluster analysis (b) of gill net survey data; Figure S3. Dual-isotope (δ13C-δ15N) biplot of functional groups in the Danjiangkou Reservoir ecosystem.

Author Contributions

Conceptualization, G.H. and F.C.; investigation, G.H., H.L., C.G., C.L., Z.C., L.Z. and Y.W.; data curation, T.Y., C.G., M.X. and W.C.; writing—original draft preparation, G.H. and T.Y.; writing—review and editing, G.H. and F.C. All authors have read and agreed to the published version of the manuscript.

Funding

The authors declare that this study received funding from the National Natural Science Foundation of China (Grant No. 32403032) and the Scientific Research Project of the Mid-Route Source of South-To-North Water Transfer Co., Ltd. (Grant No. ZSY/YG-ZX(2021)007). The funder was not involved in the study design, collection, analysis, or interpretation of data; the writing of this article; or the decision to submit it for publication.

Institutional Review Board Statement

To prevent the negative impact of repeated fishing on fish resources, this study conducted fish surveys in collaboration with the Institute of Hydrobiology, Chinese Academy of Sciences. This research was approved by the ethical rules of Institutional Animal Care and the animal welfare regulations of the Government of China and the Animal Care Use Committee of the Institute of Hydrobiology (Approval Code: Keshuizhuan 08529 and approval date: 10 March 2020).

Data Availability Statement

All data are available within the article and its Supplementary Materials. Further inquiries can be directed to the corresponding author.

Conflicts of Interest

Authors Zetao Chen, Lequn Zhang, and Yuqi Wang were employed by the company Mid-Route Source of South-To-North Water Transfer Co., Ltd. The remaining authors declare that the research was conducted in the absence of any commercial or financial relationships that could be construed as a potential conflict of interest.

References

  1. Zhang, Y.Y.; Gu, K.D.; Wang, X.Y.; Zhang, J.A.; Duan, J.Y.; Hu, Z.; Liu, Q.G. Food web structure and ecosystem functions of the water source in the middle route of China’s South-to-North Water Diversion Project. Fishes 2024, 9, 202. [Google Scholar] [CrossRef]
  2. Fu, J.J.; Wang, M.L.; Wang, B.H.; Xie, D.X. Operational management of Danjiangkou hydro-complex and its heightening works. Yangtze River 2015, 46, 14–16. [Google Scholar]
  3. Yin, W.; Wang, C.; Wang, L.; Xin, X.K.; Liu, G. Spatial and temporal distribution characteristics and influencing factors of total phosphorus in Danjiangkou Reservoir. Yangtze River 2023, 54, 1–7. [Google Scholar]
  4. Pan, Y.D.; Guo, S.J.; Li, Y.Y.; Yin, W.; Qi, P.C.; Shi, J.W.; Hu, L.Q.; Li, B.; Bi, S.G.; Zhu, J.Y. Effects of water level increase on phytoplankton assemblages in a drinking water reservoir. Water 2018, 10, 256. [Google Scholar] [CrossRef]
  5. Bai, J.P.; Huang, G.; Jiang, C.J.; Zhang, W.C.; Wang, Q.D.; Yao, L.G. Characteristics and historical changes of the fish assemblage in the Danjiangkou Reservoir. Biodivers. Sci. 2020, 28, 1202–1212. [Google Scholar] [CrossRef]
  6. Huang, G.; Cao, J.Q.; Heng, W.J.; Lei, H.; Tan, H.W.; Xiong, M.T.; Li, C.G.; Chen, F.; Chen, Z.T.; Han, X.Y.; et al. The characteristics of spatio-temporal distributions of fish resources in the Danjiangkou Reservoir based on hydroacoustic assessment. J. Lake Sci. 2025, 37, 963–975. [Google Scholar] [CrossRef]
  7. Yang, Z.W.; Li, Z.J.; Liu, J.S.; Zhang, T.L.; Ye, S.W.; Zhang, H. A comparative study on reproductive characteristics of different spawning stocks of the icefish (Neosalanx taihuensis) in the Danjiangkou Reservoir. Freshw. Fish. 2012, 42, 58–62. [Google Scholar]
  8. Xiong, M.T.; Li, R.J.; Zhang, T.L.; Liao, C.S.; Yu, G.L.; Yuan, J.; Liu, J.S.; Ye, S.W. Zooplankton Compositions in the Danjiangkou Reservoir, a Water Source for the South-to-North Water Diversion Project of China. Water 2022, 14, 3253. [Google Scholar] [CrossRef]
  9. Xiao, Y.N.; Cheng, J.H.; Mo, X.C.; Li, Y.R.; Liu, X.J.; Bi, S. Spatio-temporal variation of phytoplankton community and its relationship with environmental factor in Danjiangkou Reservoir. J. Lake Sci. 2023, 35, 821–832. [Google Scholar] [CrossRef]
  10. Chi, S.Y.; Zhao, X.F.; Gao, S.B.; Zhang, A.J.; Hu, J.; Li, S.X.; Hu, J.X.; Dong, F.Y. The spatial distribution pattern of autumn macroinvertebrates in relation to environmental factors in Danjiangkou Reservoir. Acta Ecol. Sin. 2021, 41, 1229–1241. [Google Scholar] [CrossRef]
  11. Hui, J.; Fang, D.D.; He, H.Z.; Ma, C.; Zhang, Q.Q.; Liu, D.Z. Water ecological health evaluation of Danjiangkou Reservoir based on fish biological integrity index. Henan Shuichan 2024, 4, 32–35+44. [Google Scholar]
  12. Coll, M.; Akoglu, E.; Arreguín-Sánchez, F.; Fulton, E.A.; Gascuel, D.; Heymans, J.J.; Libralato, S.; Mackinson, S.; Palomera, I.; Piroddi, C.; et al. Modelling dynamic ecosystems: Venturing beyond boundaries with the Ecopath approach. Rev. Fish Biol. Fish. 2015, 25, 413–424. [Google Scholar] [CrossRef]
  13. Craig, J.K.; Link, J.S. It is past time to use ecosystem models tactically to support ecosystem-based fisheries management: Case studies using Ecopath with Ecosim in an operational management context. Fish Fish. 2023, 24, 381–406. [Google Scholar] [CrossRef]
  14. Cremona, F.; Järvalt, A.; Bhele, U.; Timm, H.; Seller, S.; Haberman, J.; Zingel, P.; Agasild, H.; Nõges, P.; Nõges, T. Relationships between fisheries, foodweb structure, and detrital pathway in a large shallow lake. Hydrobiologia 2018, 820, 145–163. [Google Scholar] [CrossRef]
  15. Yao, Y.J.; Mao, Z.G.; Gu, X.H.; Zeng, Q.F.; Chen, H.H.; Wang, Y.Y.; Jeppesen, E. Influence of fishery management on trophic interactions and biomass fluxes in Lake Taihu based on a trophic mass-balance model exercise on a long-term data series. Ecol. Indic. 2024, 158, 111343. [Google Scholar] [CrossRef]
  16. Huang, G.; Wang, Q.D.; Du, X.; Liu, H.; Feng, K.; Ye, S.W.; Yuan, J.; Liu, J.S.; Li, Z.J.; De Silva, S.S. Modeling trophic interactions and impacts of introduced icefish (Neosalanx taihuensis Chen) in three large reservoirs in the Yangtze River basin, China. Hydrobiologia 2020, 847, 3637–3657. [Google Scholar] [CrossRef]
  17. Liu, Z.M.; Feng, M.Q.; Yang, R.J.; Liu, G.G. Ecological system characteristics and ecological capacity of Hypophthalmichthys molitrix and Aristichthys nobilis in the Zhangze Reservoir based on Ecopath model. Acta Hydrobiol. Sin. 2024, 48, 1553–1565. [Google Scholar]
  18. Christensen, V.; Walters, C.J. Ecopath with Ecosim: Methods, capabilities and limitations. Ecol. Model. 2004, 172, 109–139. [Google Scholar] [CrossRef]
  19. Pauly, D. On the interrelationships between natural mortality, growth parameters, and mean environmental temperature in 175 fish stocks. ICES J. Mar. Sci. 1980, 39, 175–192. [Google Scholar] [CrossRef]
  20. Ministry of Agriculture and Rural Affairs of the People’s Republic of China. Calculation Methods for Carrying Capacity of Stock Enhancement and Aquaculture in Large Water Bodies: SC/T 1149-2020; China Agriculture Press: Beijing, China, 2020. [Google Scholar]
  21. Palomares, M.L.; Pauly, D. Predicting food consumption of fish populations as functions of mortality, food type, morphometrics, temperature and salinity. Mar. Freshw. Res. 1998, 49, 447–453. [Google Scholar] [CrossRef]
  22. Tang, J.F.; Xiao, X.Z.; Wang, Y.C.; Hu, S.; Wang, Y. Ecosystem structure and function of the main channel of the middle route of south-to-north water diversion project. China Environ. Sci. 2020, 40, 5391–5402. [Google Scholar]
  23. Parnell, A. Simmr: A Stable Isotope Mixing Model. 2023. Available online: https://CRAN.R-project.org/package=simmr (accessed on 14 April 2023).
  24. Wang, K.; Zhu, K.H.; Guo, Y.L.; Hu, J.; Gu, B.H. Reconstruction of consumer dietary sources based on stable isotopes. Acta Hydrobiol. Sin. 2022, 46, 767–777. [Google Scholar]
  25. Post, D.M. The long and short of food-chain length. Trends Ecol. Evol. 2002, 17, 269–277. [Google Scholar] [CrossRef]
  26. Fry, B. Stable Isotope Ecology; Springer: New York, NY, USA, 2006. [Google Scholar]
  27. Link, J.S. Adding rigor to ecological network models by evaluating a set of pre-balance diagnostics: A plea for PREBAL. Ecol. Model. 2010, 221, 1580–1591, Erratum in Ecol. Model. 2016, 337, 348–349. [Google Scholar] [CrossRef]
  28. Christensen, V.; Walters, C.J.; Pauly, D. Ecopath with Ecosim: A User’s Guide; Fisheries Centre, University of British Columbia: Vancouver, BC, Canada, 2005; Available online: https://www.vliz.be/imisdocs/publications/395938.pdf (accessed on 5 November 2025).
  29. Odum, E.P. The strategy of ecosystem development. Science 1969, 164, 262–270. [Google Scholar] [CrossRef] [PubMed]
  30. Christensen, V. Ecosystem maturity—Towards quantification. Ecol. Model. 1995, 77, 3–32. [Google Scholar] [CrossRef]
  31. Zhang, S.F.; Shen, J.Z.; Wan, C.Y.; Ji, F.F.; Hu, L.; Qiu, L.H.; Peng, L.G.; Zhu, W. Effects of Neosalanx taihuensis feeding on zooplankton community structure in Xiaojiang River. J. Hydroecol. 2024, 45, 138–147. [Google Scholar]
  32. Fang, Y.H.; Wang, W.J.; Wang, C.; Chen, F.; Zheng, H.T.; Zhang, Q.; Jian, D. Investigation and Analysis of Plankton Community in the Danjiangkou Reservoir in 2019. In Proceedings of the 2019 Academic Annual Conference of the Chinese Hydraulic Engineering Society (Part V), Yichang, China, 22–24 October 2019; China Water & Power Press: Beijing, China, 2019; pp. 14–22. [Google Scholar]
  33. Wang, L.; Chen, J.; Su, H.J.; Ma, X.F.; Wu, Z.X.; Shen, H.; Yu, J.; Wu, Y.; Ding, G.Y.; Xie, P. Is zooplankton body size an indicator of water quality in (sub)tropical reservoirs in China? Ecosystems 2022, 25, 308–319. [Google Scholar] [CrossRef]
  34. Havens, K.E.; Beaver, J.R.; Manis, E.E.; East, T.L. Inter-lake comparisons indicate that fish predation, rather than high temperature, is the major driver of summer decline in Daphnia and other changes among cladoceran zooplankton in subtropical Florida lakes. Hydrobiologia 2015, 750, 57–67. [Google Scholar] [CrossRef]
  35. Shurin, J.B.; Gruner, D.S.; Hillebrand, H. All wet or dried up? Real differences between aquatic and terrestrial food webs. Proc. R. Soc. B 2006, 273, 1–9. [Google Scholar] [CrossRef]
  36. Cui, W.H.; Xu, B.Q.; Dong, X.Q.; Yang, J.S.; Li, M.; Zhang, D.P.; Li, S.F.; Lv, Z.B.; Li, F.; Ren, Z.H. Comparative study of the characteristics of the energy flow and food web structure in the Laizhou Bay ecosystem based on the Ecopath and LIM-MCMC models. Front. Mar. Sci. 2025, 12, 1572355. [Google Scholar] [CrossRef]
  37. Lindeman, R.L. The trophic-dynamic aspect of ecology. Ecology 1942, 23, 399–417. [Google Scholar] [CrossRef]
  38. Ulanowicz, R.E. Growth and Development: Ecosystem Phenomenology; Springer: New York, NY, USA, 1986; pp. 104–110. [Google Scholar]
  39. Liu, M.; Shu, M.X.; Lian, Q.P.; Guo, A.H.; Zhou, D.; Zou, S.B.; Yuan, J.L.; Chen, G.M. Assessment of ecosystem characteristics and fishery carbon sink potential of Qianxiahu Reservoir based on trophic level and carbon content methods. Fishes 2024, 9, 438. [Google Scholar] [CrossRef]
  40. Qiu, L.H.; Qiu, Y.H.; Peng, L.G.; Shen, J.Z.; Li, G.Y.; Li, J.W. Enhancing fishery management in Tanghe Reservoir, China: Insights from food web structure and ecosystem analysis. Water 2024, 16, 200. [Google Scholar] [CrossRef]
  41. Yu, J.; Liu, J.R.; Wang, L.; Wu, Z.X.; Yu, Z.M.; Liu, M.L.; Han, Y.C.; Xie, P. Analysis on the ecosystem structure and function of Lake Qiandao based on Ecopath model. Acta Hydrobiol. Sin. 2021, 45, 308–317. [Google Scholar]
  42. Nielsen, C.O.; Odum, E.P.; Odum, H.T. Fundamentals of ecology. Ecology 1960, 41, 400–401. [Google Scholar] [CrossRef]
  43. Wu, L.; Liu, J.S.; Zhang, G.; Liu, Z.J.; Liu, M.; Xie, S.G. Chemical compositions and energy densities of female Neosalanx taihuensis with ovaries at different developmental stages. Acta Hydrobiol. Sin. 2013, 37, 444–449. [Google Scholar]
  44. Chara-Serna, A.; Maxson, K.A.; Anderson, A.M.; Zalay, B.D.; Casper, A.F. Zooplankton as an Indicator of the Ecosystem Response to Bigheaded Carp Suppression via Commercial Harvest in the Illinois River (2010–2017); Illinois Natural History Survey Technical Report 2018 (37); Illinois Natural History Survey: Champaign, IL, USA, 2019. [Google Scholar]
Disclaimer/Publisher’s Note: The statements, opinions and data contained in all publications are solely those of the individual author(s) and contributor(s) and not of MDPI and/or the editor(s). MDPI and/or the editor(s) disclaim responsibility for any injury to people or property resulting from any ideas, methods, instructions or products referred to in the content.

Article Metrics

Citations

Article Access Statistics

Article metric data becomes available approximately 24 hours after publication online.