Abstract
The present study investigated possible consequences for the number of killed and seriously injured (KSI) in traffic if trucking companies in Norway introduced the organisational safety management (OSM) measures in the stepwise approach called the “Safety Ladder” for road goods transport. The aim of the paper was to estimate the potential of OSM to prevent KSIs involving HGV drivers in Norwegian companies, given the current prevalence and effect. On the basis of these analytical steps, the present study concluded that OSM measures seem to provide an efficient approach to reduce the number of KSIs involving HGVs, especially as previous research indicates low implementation. The estimates in the example calculations varied between 7 and 52 KSI, which potentially can be avoided per year (retrospectively). Thus, OSM measures may reduce KSIs with a share of up to 51% of the total number of KSIs involving HGVs in Norway, when taking into consideration the known effects in robust studies and current prevalence of OSM.
1. Introduction
Heavy vehicle traffic has increased worldwide in the last 25 years, and it is of vital economic importance in most parts of the world [1]. In 2017, the European road goods transport (tonne-kms) was the highest recorded over the last 5 years: increasing by about 12% from 2013 to 2017 [2]. The road transport of goods is also increasing in Norway, and heavy goods vehicles (HGV) represent the dominant means of goods transport, comprising the largest total transported tonnes and tonne-kilometres, compared with maritime transport and rail transport [3]. HGVs are defined as goods vehicles of over 3.5 tons maximum permissible gross weight.
The large and increasing shares of HGV transport influence both the number and types of road accidents. Heavy vehicles are overrepresented in fatal accidents due to their weight, which means that accidents with HGVs are generally serious accidents with high proportions of killed and seriously injured people. In the EU, about 4000 people were killed in road accidents involving HGVs in 2016, making up about 16% of all road fatalities [4]. In the USA, 4761 people were killed in accidents involving large trucks in 2017, and 72% of these were other road users [5]. HGV accidents represents a particularly important challenge in Norway, as HGVs are involved in 33% of all road fatalities, and Norway has about 35% more killed per capita in HGV accidents than the average for Europe [6].
Although there are relatively few systematic studies in this area, research indicates that increased focus on organisational safety culture and safety structure can lead to increased road safety [7,8,9,10]. The relationship between safety culture/climate and safety outcomes is well documented across industries and countries [11], including the road sector [12,13]. Studies also indicate a relationship between safety structure and safety outcomes [9,14]. In addition, previous studies show that hauliers transporting dangerous goods (road tankers) by road have a 75% lower risk of accidents than other trucking companies [15]. This indicates what can be achieved through systematic organisational safety management (and special framework conditions).
Safety culture and safety structure is referred to as organisational safety management (OSM). Safety structure refers to the formal aspects of safety management (“how things should be done”) as described in procedures, routines, and organisational charts, etc. These aspects are often referred to as SMS. Safety culture refers to the informal aspects of safety management (“how things are actually done”) [16]. Safety culture scholars generally seem to agree that safety culture refers to shared ways of thinking and acting that are relevant for safety [17]. OSM may also refer to other safety measures that cannot necessarily be categorised as culture or structure, such as equipment and technology (type of vehicle, speed limiter), as well as other measures that are necessarily associated with safety, such as payment systems [18]. Despite the potential of preventing accidents involving HGVs by means of OSM, it seems that neither transport companies nor authorities focus sufficiently well on the importance of OSM for transport safety. Panel experts interviewed by Nævestad et al. [18] asserted that transport companies employing drivers focus little on OSM. Similar tendencies have been found in research from other countries (e.g., [9]). Work-related road safety has traditionally been managed using single driver-focused measures, and not OSM (e.g., [8,19]). This illustrates the considerable and largely unexploited traffic safety potential of improving the safety of companies employing HGV drivers [18]. The low focus on OSM is especially evident when comparing the road sector with aviation [20], rail [21], and the maritime sector [22], where safety management systems (SMS) facilitating positive safety cultures are legally required. In contrast, the ISO:39001 safety management standard which aims to facilitate good safety culture is voluntary in the road sector.
Nævestad et al. [23] suggest that the size of the companies may be an important factor in explaining the relatively low focus on safety structure/culture in road trucking companies. In Norway, over 85% of trucking companies employ five or fewer persons [24]. Accordingly, similar research from EU countries with available data indicates that over 80% of the trucking companies have less than 10 employees, while very few companies have more than 50 employees (usually about 1%) [25]. It is not unreasonable to assume that the small trucking companies have fewer resources (time, economy, competence on traffic safety management) compared with larger companies. Nævestad et al. [23] therefore suggested an approach termed the Safety Ladder for goods transport, which consists of a series of measures at four different levels/steps. This is suggested on the basis of a systematic literature study of organisational safety measures, an analysis of studies of accidents with drivers at work, and industry characteristics (majority of small companies). Nævestad et al. [26] validate the Safety Ladder approach in empirical research by comparing safety structure, safety culture, and accident risk for road trucking companies. Survey results indicate increasing safety culture scores at each level of the Safety Ladder, while the accident risk decreases. The accident risk at level 4 was half the risk of level 2.
The aim of the present study was to estimate the potential of OSM to prevent KSIs involving HGV drivers in Norwegian companies, given the current prevalence and effect.
2. The Safety Ladder for Companies Involved in Road Transport of Goods
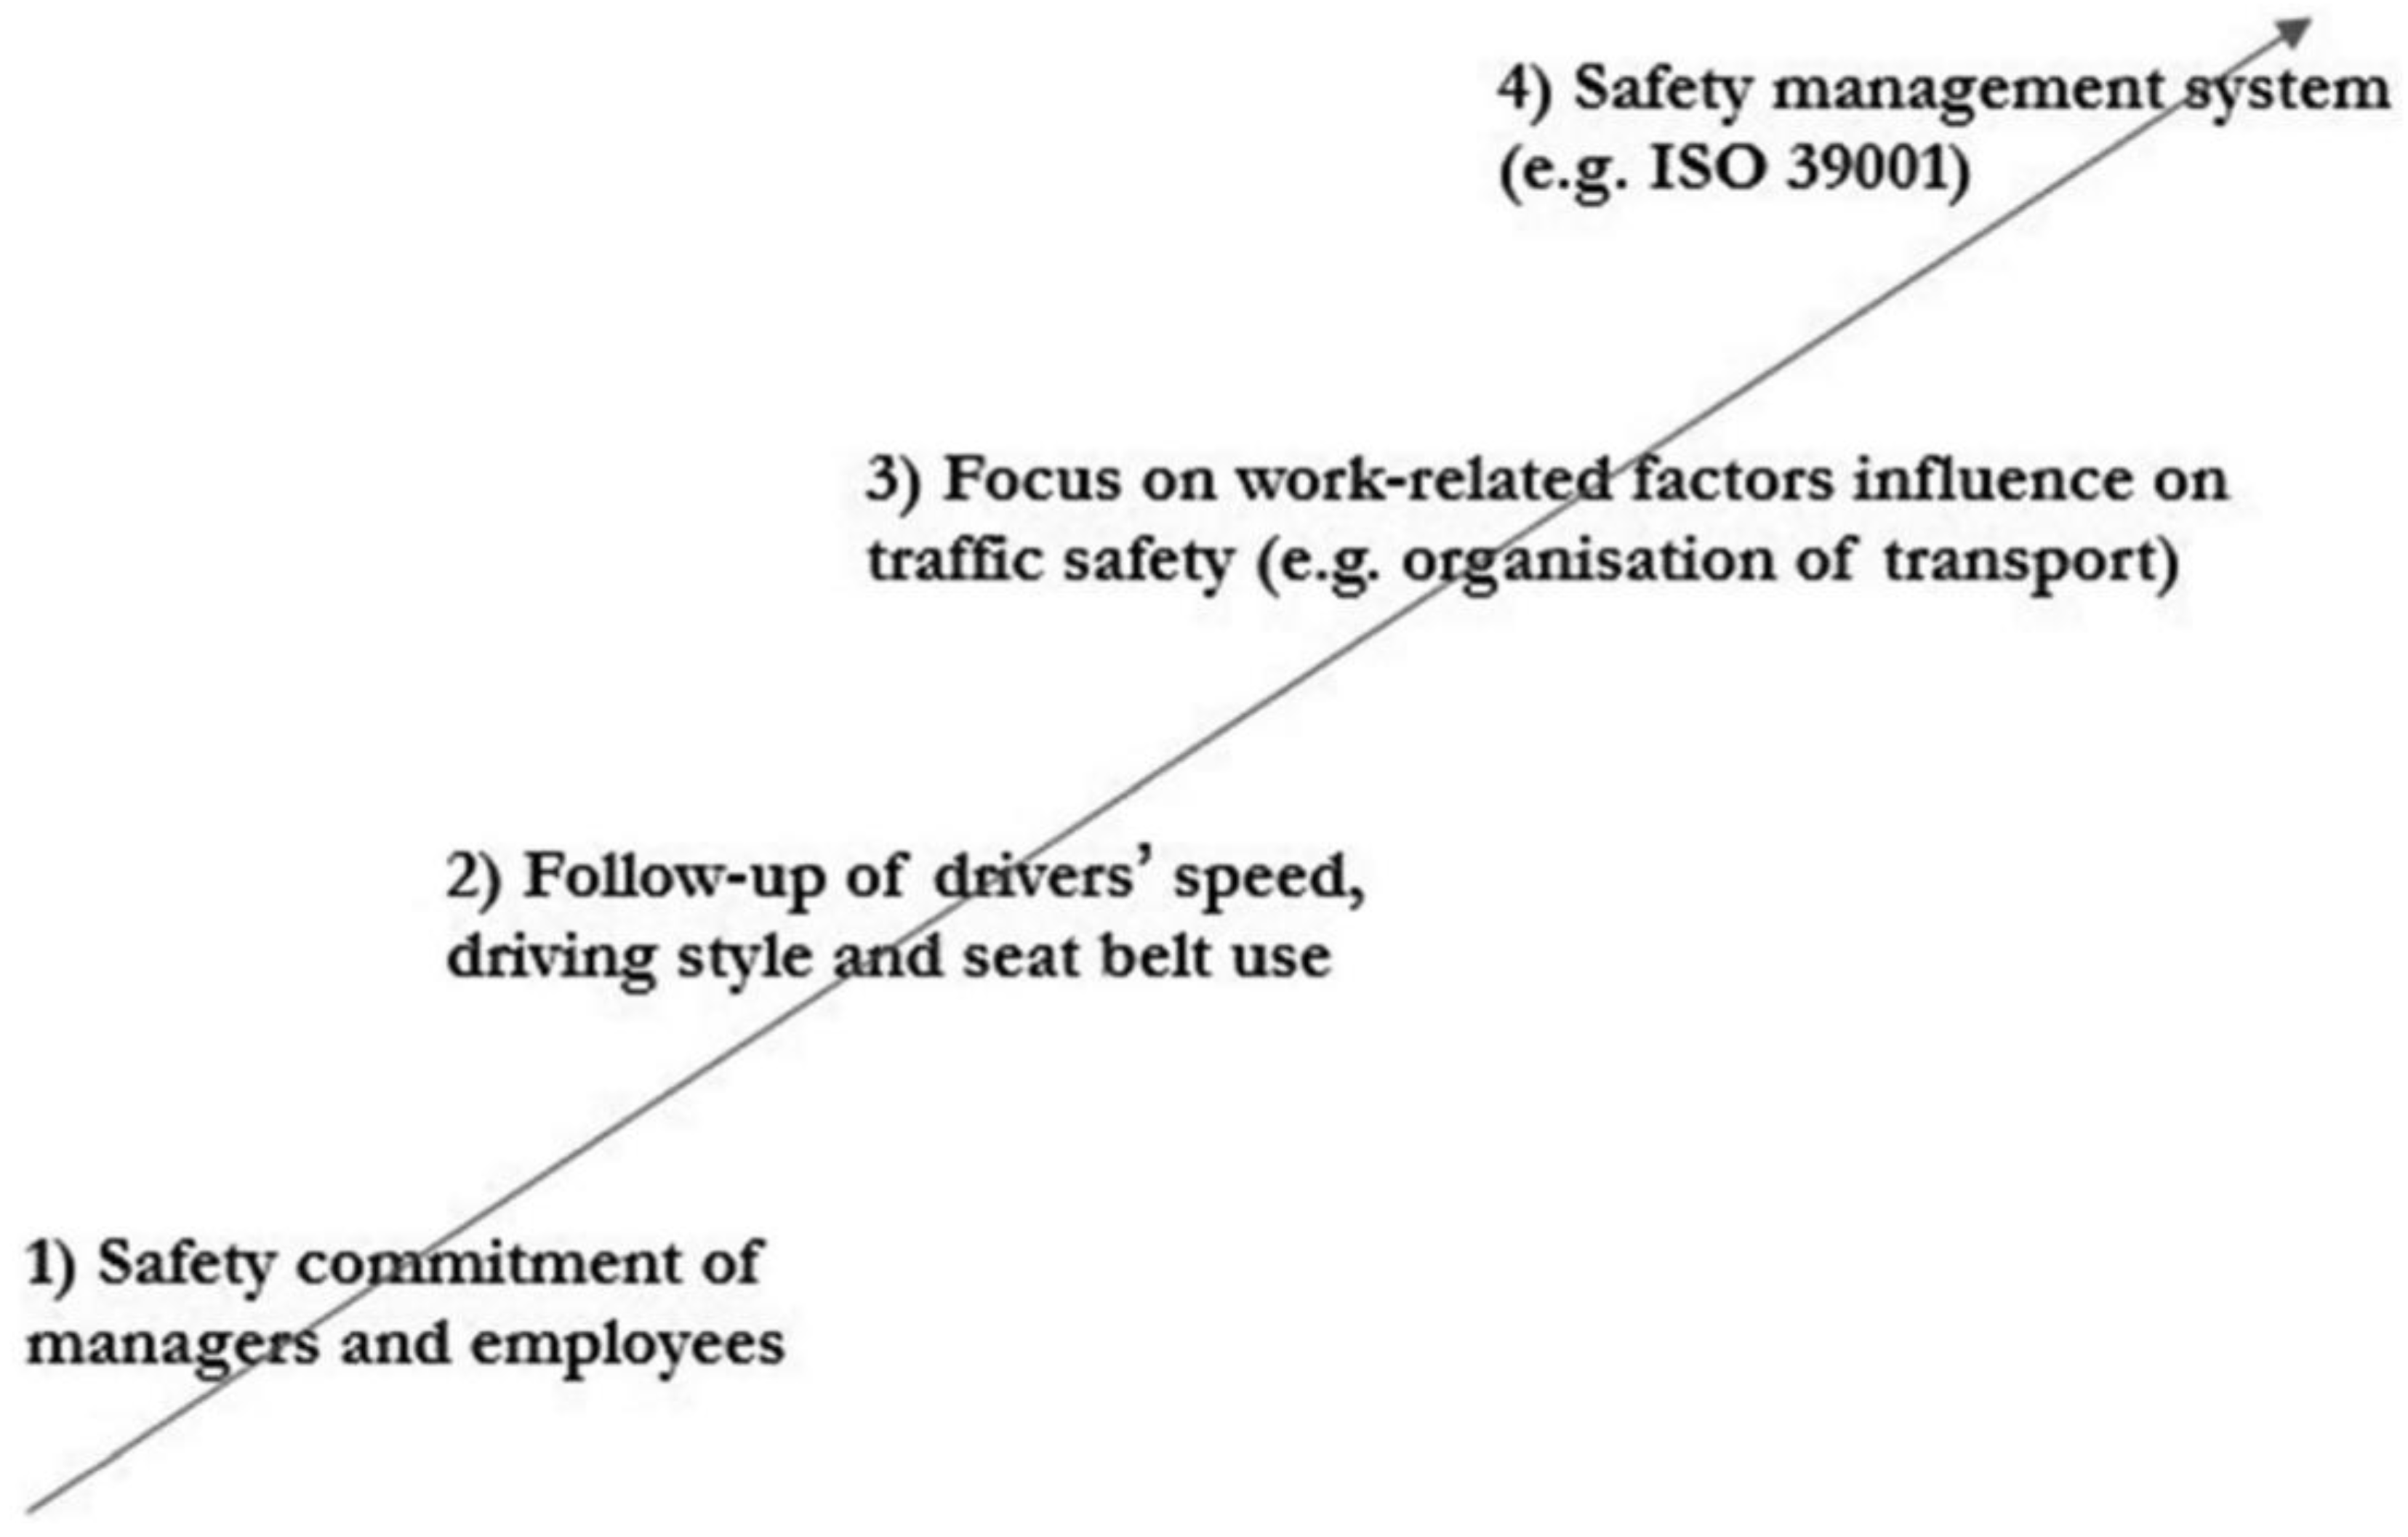
Nævestad et al. [23] concludes that four main measures aimed at organisational safety management have the greatest transport safety potential and are most realistic for regular trucking companies. These four measures can be arranged on a ladder, starting at the lowest level, before proceeding to the next step (see Figure 1).

Figure 1.
The Safety Ladder for safety management in goods transport.
The idea behind the Safety Ladder is that companies start at the bottom of the ladder if they have no measures aimed at work-related risk factors in the company. The first step in the ladder, “Managers’ commitment to safety”, is the most basic step in the Safety Ladder, because research shows that this is usually a prerequisite for the company’s safety work to be successful. The second step in the safety ladder is “Follow-up of driver speed, driving style and seat belt use”. This is aimed at the main risk factors associated with drivers identified in analysis of fatalities involving drivers in work. This involves, e.g., company policies for speed, driving style, and seat belt use; follow-up of driving style with fleet management system recording driving style; feedback to drivers about their driving styles; etc. (cf. examples of Level 2 practices in Table 1). The third step in the Safety Ladder is “Focus on work-related factors influence on transport safety”. This applies, for example, to planning, scheduling, and organisation of transport, with the consequences for drivers’ experience of stress, time pressure, fatigue, etc., the extent to which drivers have direct contact with customers or recipients of goods, wage systems, negotiation and contact with transport buyers, etc. The fourth step in the Safety Ladder is to implement a “Safety Management System”, such as ISO:39001, or other similar alternatives, e.g., ISO:45001 (Occupational Health and Safety). This involves, e.g., systematic risk analyses and development of procedures and training systems based on these, systems for reporting safety issues and incidents, etc. [23]. The Safety Ladder represents a future area of focus in the Norwegian road safety work. It is described in White paper 40 (2015–2016) of the Norwegian Parliament “Traffic safety work—coordination and organisation”, in the “Norwegian National action plan for road safety 2018–2021” and in the “Norwegian National action plan for road safety 2022–2025”.

Table 1.
Questions in the survey on the prevalence of measures aimed at organisational safety management, categorised by the levels in the Safety Ladder.
3. Methods
To fulfil the aim of the study, there is a need to (1) map the KSIs in accidents involving HGV drivers employed in Norwegian trucking companies and other companies involved in HGV transport, (2) map the current prevalence of OSM in these companies, and (3) map the effects of OSM. The methods that are used to collect this information are described below.
3.1. Focus on Employed Drivers in Norwegian Companies
The focus is on employed drivers and not on self-employed drivers, since the latter is only one person, and because OSM largely is about the relationship between managers and employees. Managers have a certain managerial prerogative (and duty) to intervene in employed drivers’ work situations and introduce measures that can increase their safety (such as speed limiters, procedures prohibiting driving over speed limits, mobile use, etc., fleet management and measures to enhance safety culture). The study focuses primarily on drivers employed in trucking companies (“rental transport or reward”), but also drivers employed in companies which have transport as an auxiliary function (“transport for own account”). The latter may, e.g., be companies involved in construction materials and food products, or wholesale companies in general, which also transport their products. The focus is on both types of companies, as both employ drivers that can be subjected to OSM. The focus is on Norwegian companies, because it is difficult for Norwegian authorities to demand OSM measures from foreign trucking companies, given EU legislation in this field.
3.2. Mapping HGV Fatalities and Injuries Involving Employed Drivers
Five analytical steps were conducted to identify the number and shares of kilometres driven (and accidents) by drivers in Norwegian companies with employed HGV drivers (both trucking companies and other companies).
First, an overview of kilometres driven by Norwegian-registered HGVs in Norway, during the period 2003–2016, is provided, on the basis of Statistics Norway’s lorry survey. This is a quarterly survey for domestic and international driving with Norwegian-registered HGVs with payloads above 3.5 tonnes. The focus is on trips that takes place on Norwegian roads, and which are conducted by employed drivers. International transport is excluded because it does not distinguish between kilometres driven in Norway and abroad.
Second, the proportion of kilometres driven by employed drivers in Norwegian companies, both trucking companies and other companies, was estimated using Statistics Norway’s structural statistics for transport and storage in the period 2007–2015. These statistics are combined with data for kilometres driven, because there are no statistics that report both employment and the basis for kilometres driven.
Third, information about the number of accidents the Norwegian-registered HGVs are involved in is provided. This is based on Statistics Norway’s data on police-reported personal injury accidents involving HGVs, in the period 2007–2016. Data from all police-reported accidents in Norway are registered by Statistics Norway.
Fourth, the share of accidents involving employed drivers was estimated. There are only numbers for exposure (i.e., the kilometres driven) of self-employed and employed drivers. An overview of the accident involvement of the two groups is lacking. Calculating the share of accidents involving employed drivers, we assigned the employed drivers the same proportion of accidents as their share of the total number of kilometres driven each year. This means that it was assumed that the accident risk for the two groups is equal. This assumption is not necessarily true and should therefore be investigated in future research. On the basis of the figures for kilometres driven and accidents, the accident risk of the target groups for the measures in the Safety Ladder was estimated.
Fifth, on the basis of the numbers of accidents that employed drivers of Norwegian-registered HGV have been involved in, the average number of personal injuries per year, which are potentially preventable through measures directed at OSM, was estimated. Since the numbers of accidents of this type have been significantly reduced over the past 10 years, the focus was on the annual average for a recent five-year period (2012–2016).
3.3. The Current Prevalence of Organisational Safety Management
A survey involving manager representatives (N = 62) and employee representatives (N = 59) was conducted to estimate the occurrence of OSM measures in Norwegian trucking companies. The questions were largely based on measures examined or mentioned in scientific studies (cf. Section 4.3), examining effects on accidents and/or risk.
Respondents were asked to answer on the basis of their impressions of the prevalence of OSM measures in their districts (the companies that respondents presumably were familiar with). Respondents were instructed to specify the responses as a percentage, and they were given 10 response options: (1) 0–9%, (2) 10–19%, (3) 20–29%, etc. The survey questions are presented in Table 1.
3.4. Outcomes of Organisational Safety Management
A systematic literature search and analysis of studies of OSM in road transport was conducted in order to estimate expected or possible effects of OSM on accidents. The literature study was based on, and further developed the literature search and review reported in Nævestad et al. [23]. The purposes of the literature search were to (1) identify all published studies that say something about experiences with OSM measures that can be used to address the risk factors associated with drivers at work, (2) determine what level of the Safety Ladder the various measures address, and (3) examine whether the studies estimate the effect of the measure on accident risk. Information from the two latter points is needed to use the information from the studies in the example calculations.
The following scientific databases were searched: ScienceDirect, ISI Web of Knowledge, Google Scholar, and Springerlink. The searches were primarily conducted in June–November 2016, but studies were also included in March 2017. The relevance of each publication was assessed on the basis of titles and summaries. The literature searches were supplemented with research literature that was already known to the authors and which was considered relevant to the purpose of the search. The following English language words were used in the search: “occupational driving”, “occupational transport”, “occupational driving”, “work-related road safety”, “occupational travel”, “work-related driving”, “work-related”, “driving at work”, “professional transport”, “occupational transport”, “truck driver”, and “road transport”. These were combined with words such as “safety measures”, “safety interventions”, “safety training”, and “fleet safety”.
3.5. Example Calculations of Potential Given Prevalence and Effects
Example calculations of possible effects of measures operationalising the various steps on the Safety Ladder on the number of KSIs in traffic accidents are provided on the basis of Statistics Norway’s data on police reported injuries in traffic. The number of KSIs in these accidents was calculated. Examples are given as to how many of these KSIs that could be avoided, given the results from the literature study about effects. The results of the survey of existing implementation of OSM measures were also taken into account (cf. Section 4.4).
4. Results
4.1. Exposure, HGV Fatalities, and Injuries Involving Employed Drivers
Table 2 shows the number of kilometres travelled by employee drivers and self-employed drivers.
Table 2.
The development in kilometres driven by self-employed and employed drivers, measured as million kilometres, and shares. The focus is national transport. (Avg. = average).
The data indicate that drivers employed in trucking companies (“rental transport”) were involved in 58% of the kilometres driven with HGVs on Norwegian roads. Transport for own account made up 31% of the kilometres.
Table 3 shows the number of HGVs involved in police-reported traffic accidents involving personal injuries in Norway in 2007–2016 by country of registration.
Table 3.
The number of HGVs involved in police-reported traffic accidents involving personal injuries in Norway 2007–2016 by country of registration.
Table 3 shows data from 5206 HGVs that have been involved in police-reported traffic accidents with personal injuries in Norway during the period 2007–2016. A total of 4.158 of the HGVs were Norwegian, while 479 HGVs had no stated nationality in the accident data.
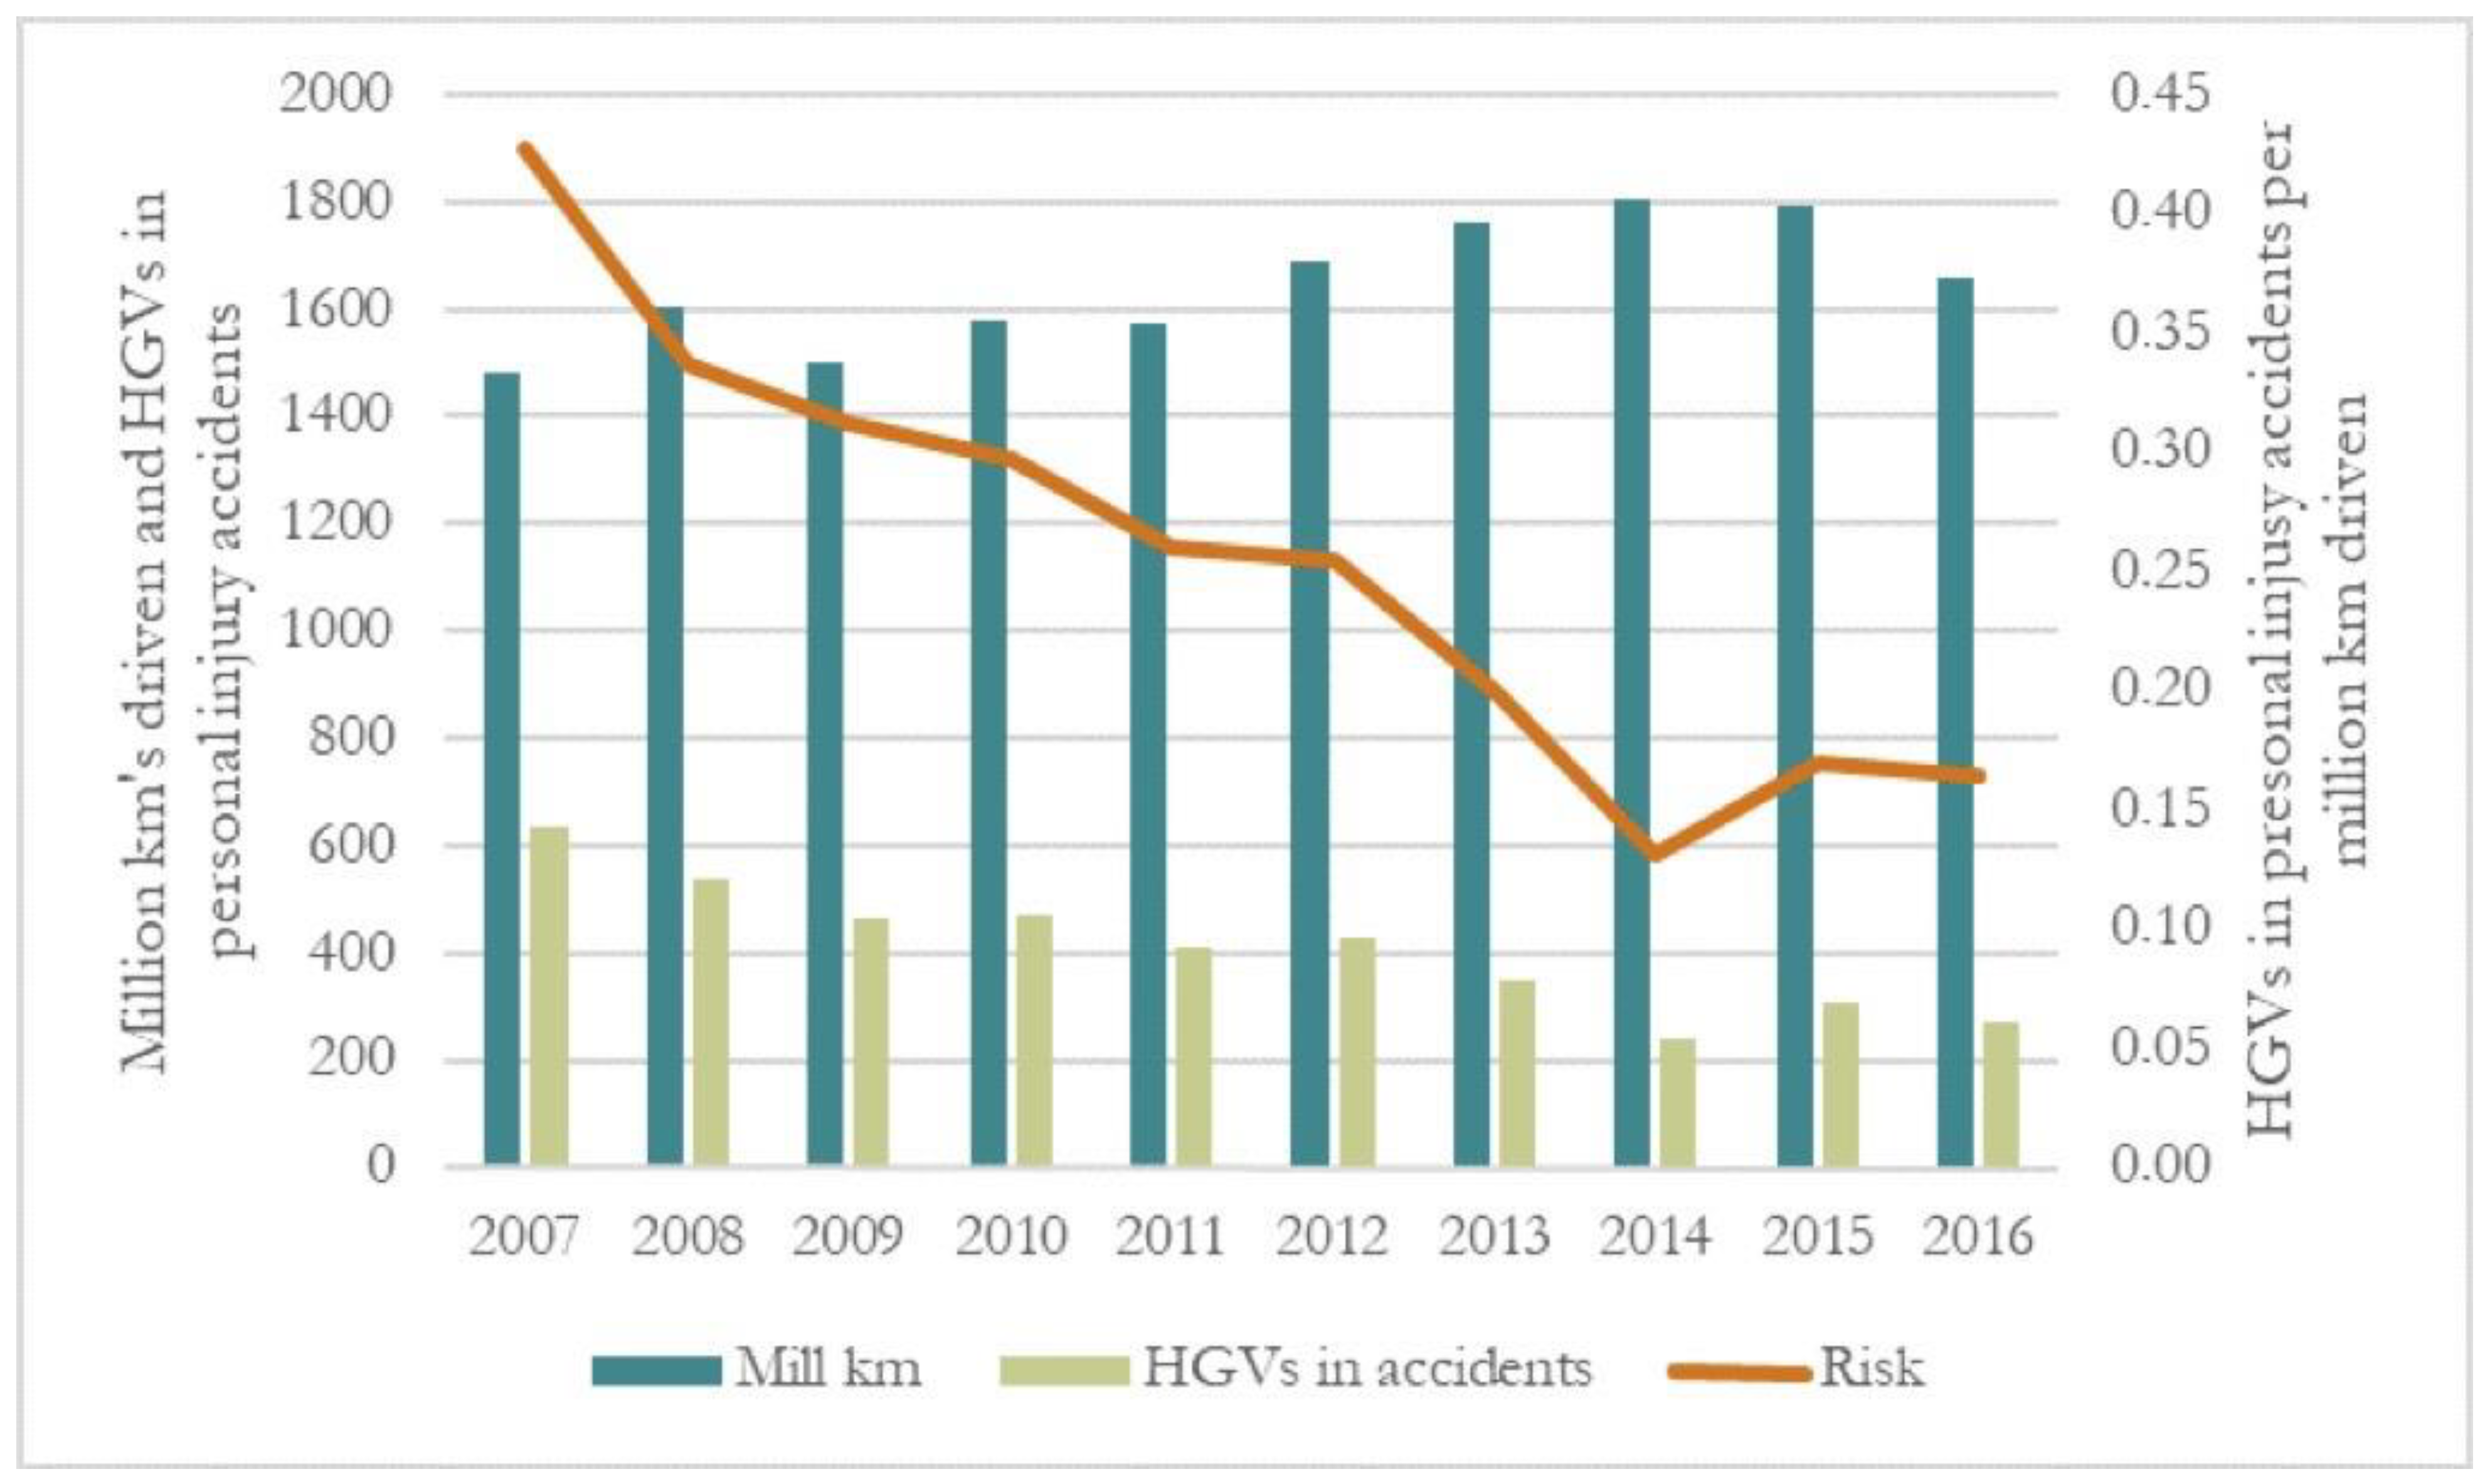
Figure 2 shows the number of kilometres travelled and the number of HGVs driven by employed drivers who have been involved in personal injury accidents. The information about accidents in Table 2 and kilometres driven in Table 3 was used to calculate the accident risk for each year. Personal injury accident risk was estimated as the number of HGVs in personal injury accidents per million kilometres driven. The focus is on Norwegian-registered HGVs driven by employed drivers in trucking companies.
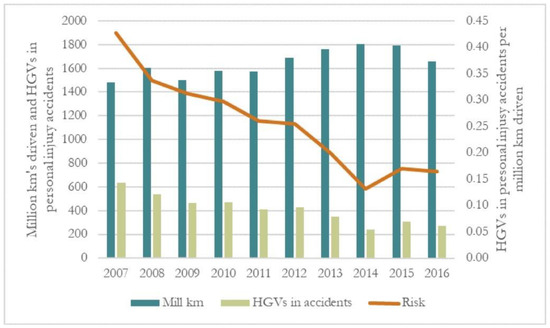
Figure 2.
Million kms driven and the number of Norwegian-registered HGVs driven by employed drivers in trucking companies (rental transport or reward) and other companies (transport for own account), involved in personal injury accidents per year 2007–2016 (left-hand scale), and risk per year (right-hand scale).
Figure 2 indicates that the risk of personal injury accidents for HGVs was reduced by 63% in the period 2007–2016.
4.2. Prevalence of Organisational Safety Management Measures
Two surveys were conducted to assess the occurrence of measures focusing on OSM in Norwegian trucking companies. The first survey (N = 62) involved employers’ representatives, while the other (N = 59) involved representatives on the employee side. The survey contained 12 questions about measures (cf. Table 1 for the full wording of the questions). Figure 3 shows the answers of management and employee representatives, including their average.
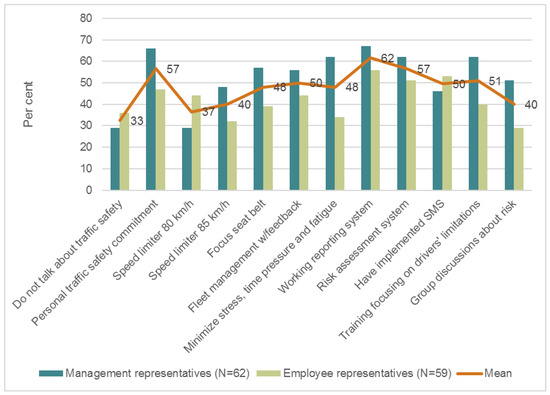
Figure 3.
Results from two surveys on the occurrence of 12 OSM measures in Norwegian trucking companies.
First, Figure 3 indicates that the employee representatives tend to rate the prevalence of OSM measures as lower than the management representatives (up to 20 percentage points lower). Second, the overall impression is that Figure 3 seems to overestimate the occurrence of OSM measures in trucking companies. This impression can be tested against measures on which there is information about the occurrence. Figure 3 indicates 50% share of SMS in Norwegian trucking companies. At the same time, about 10% of the members of the Norwegian Haulier Association in 2016 made use of the SMS “Quality and Environment on the Road” and “HSE”. Moreover, five (of about 10,000) trucking companies in Norway were certified according to the voluntary ISO:39001 in April 2018. On the basis of Figure 3 above, respondents estimated that 50% of Norwegian trucking companies introduced SMSs (cf. “The company has introduced a safety management system such as Quality and environment on the road, ISO9001, ISO39001”). This estimate thus appeared to be about five times as high as the real proportion.
4.3. Effects of Organisational Safety Management Measures
A systematic literature search and analysis of studies of measures aimed at OSM in road transport was conducted to estimate expected or possible effects of OSM on accidents. Twenty-four studies were identified. In Table 4, the steps in the Safety Ladder that the studies refer to and their main findings, strengths, and weaknesses are presented.
Table 4.
Studies describing organisational measures that can be aimed at drivers at work.
In the following, the main characteristics of the studies and challenges related to using them to establish the reduction of accident risk related to OSM in Norwegian companies is discussed. The first challenge is that several of the studies focus on multifaceted interventions, including several different key elements and Safety Ladder levels that are implemented at the same time. Although a higher number of OSM measures may be positive for safety, implementing several measures simultaneously makes it more difficult to identify specific effective measures from a scientific viewpoint. Table 4 categorises the studies according to the different levels of the Safety Ladder that they address. Evidently, several of the studies address several levels in the Safety Ladder (e.g., those at level 1), which makes the categorisation in the table difficult. However, counting each of the times that the studies address a Safety Ladder level, different levels are addressed 40 times in the 24 studies: level 1 is addressed 7 times, level 2 is addressed 13 times, level 3 is addressed 12 times, and level 4 is addressed 8 times. In four cases, the studies are relevant to all the Safety Ladder levels [41,42,43,45]. These studies look at larger “packages” of measures in companies, so it is difficult to point out the effect of individual measures.
The second challenge is related to the robustness of the studies. Not all are based on a robust design, that is, before and after measurements with relevant control groups. On the basis of the review in Table 4, it appears that only two of the studies use satisfactory robust designs, i.e., pre- and post-measurements with control groups and otherwise no significant methodological weaknesses. It seems that these are the only studies that can be used to draw conclusions about the effects of OSM measures in the analyses. These studies are those of Gregersen et al. [8] and Wouters and Bos [35]. Gregersen et al. [8] found a major decline in accident risk among company drivers who participated in group discussions (59%) or anticipatory driver training (41%) and less effects among drivers who participated in incentive programs, or who received information from campaigns. Wouters and Bos [35] showed that the accident rate decreased by 20% among drivers who received feedback on speed, acceleration, braking, and fuel consumption (from a unit in the vehicles). Both studies focus on the impact on accidents in general, i.e., accidents involving property damage.
The third challenge is that not all of the studies include accidents as an outcome measure. Table 4 shows that nine of the studies use or include accidents as an outcome measure (e.g., [8,9,28,31,35,37,40,44]. These generally look at insurance data, focusing on all accidents (e.g., all material damage accidents, or only accidents where drivers are at fault), while the primary interest in the present study is accidents with KSI. Furthermore, not all of the studies that focus on accidents include exposure measures. The focus in the present study is on accidents per kilometre. This is the best exposure measure, as it allows us to control for increased/decreased driving, which is a primary predictor of risk.
A fourth potential challenge concerns whether it is reasonable to generalise about experiences from measures focusing on drivers at work in general to measures aimed at drivers of HGVs. Many of the reviewed studies apply to drivers at work in general and not HGVs. A fifth potential challenge is whether it is reasonable to transfer experiences from measures in groups and/or organisations to the societal level, which is the focus in the present study. A sixth potential challenge in the study of measures is that some studies often look at only one measure, and do not necessarily control for conditions other than the described measure.
4.4. Estimating the Potential for Avoiding Accidents and Injuries
4.4.1. The Basis of the Example Calculations
Table 5 presents the annual number of Norwegian HGVs involved in personal injury accidents, which are driven by employed drivers. These are the accidents that potentially can be prevented through measures aimed at organisational safety management. The numbers are based on the shares presented in Figure 2.
Table 5.
Average for Norwegian registered, employee-driven HGVs in accidents involving personal injuries per year in the period 2012–2016, and the average number of accidents and personal injuries in the accidents.
Accident data from Statistics Norway’s indicate that the ratio between the number of (Norwegian) HGVs involved in personal injury accidents and personal injury accidents was 1.03 HGVs per accident involving HGVs. This means that there was rarely more than one HGV involved in each personal injury accidents (but often also other lighter vehicles). On this basis, the number of accidents in which the HGVs were involved was calculated, as well as the number of personal injuries (cf. Table 5). Data from Statistics Norway indicated that the ratio between personal injury accidents involving HGVs and the number of personal injuries was 1.4. The shares of fatalities, severe injuries, and minor injuries in the accidents were also calculated. Data from Statistics Norway indicated that 8% of the injury accidents involved fatalities, 12% involved serious injuries, and 80% involved minor injuries. These proportions are also used in the calculations in Table 5.
Table 5 shows an average (full) potential for avoiding 60 KSIs per year when looking only at trucking companies in 2012–2016 (Row 1), and 92 KSIs when transport for own account also is included in 2012–2016 (Row 2). Table 5 also show 102 KSIs in all accidents with Norwegian-registered HGV in Norway (Row 3), and 111 when foreign-registered HGVs were included (Row 4).
4.4.2. The Relationship between Personal Injury Accidents and Property Damage Accidents
The reviewed studies which include data on accident reductions point to reductions in the risk of property damage accidents and not just personal injuries (including fatalities), which is the focus on in the present study. In order to use these, the estimates from the reviewed studies, an understanding of the relationship between property damages and personal injuries must be developed. For this purpose, data on property damages involving HGVs were extracted from the insurance industry’s TRAST database. As for the other accidents, the calculations focused on 58% and 90% of these, attributed to HGV drivers employed in trucking companies, and also including other companies.
Table 6 indicates that the relationship between the risk of property damage accidents and personal injury accidents was approximately the same as reported in the Handbook of Traffic Safety Measures [15]. This reports that the risk of property damage accidents for HGVs is 9.69 property damages per million kilometres driven, while the risk of personal injuries is 0.21 per million kilometres driven. These numbers can be used to examine the effects of the measures in the studies on the number of KSIs in traffic. This was performed as shown below. As studies suitable for example calculations are lacking for level 1 and 4 in the Safety Ladder, example calculations are only provided for level 2 and 3. The descriptions of level 1 and 4 in the Safety Ladder therefore only include background information about the reviewed studies.
Table 6.
Annual kilometres driven, personal injury accidents, and property damage accidents for HGVs driven by drivers employed in trucking companies in rental transport (58% in Row 1) and also including drivers employed in companies involved in transport for own account (90% in Row 2) in the period 2012–2016.
4.4.3. Level 1: Managers’ and Employees’ Safety Commitment
Background. Management commitment to safety is the most fundamental step in the Safety Ladder because research shows that this is often a prerequisite for companies’ work with safety to succeed [47]. One of the most important findings in the review of Mooren et al. [9] is a robust correlation between management’s commitment to safety and safety outcomes. Management commitment to safety is also highlighted by Arboleda et al. [27], as well as in the SMS review of Thomas [14]. Management commitment to safety is the most studied and well-documented characteristic of a good safety culture, regardless of sector [47,48]. This is therefore the most basic prerequisite for addressing key risk factors, as well as being the aspect of OSM that has the clearest relationship with various safety outcomes [14,47].
Managers’ safety commitment in itself is likely to have little impact on traffic safety alone, unless it is combined with, or motivates, specific OSM measures or management practices. The above-mentioned research (e.g., [27,28]) suggests that measures aimed at improving managers’ safety commitment may lead to increased safety, probably because it leads to the implementation of measures and management practices that favour safety in various situations.
4.4.4. Level 2: Organisational Focus on Speed, Driving Style, and Seat Belt Use
Background. The second step in the Safety Ladder is “Follow-up of driver speed, driving style and seat belt use”. This step relates to the most important risk factors associated with the driver (e.g., speed, driving style, seat belt use), which have been identified in analyses of fatal accidents involving drivers at work [18]. The studies that are discussed in the literature review (cf. Table 4) indicate that the introduction of fleet management technology and the follow-up of driving style is strongly correlated with the decline in accidents. The seven studies on fleet management technology and organisational follow-up and feedback on driving style show positive results: safer driving and/or fewer accidents [30,35,39]. These measures appear to be based on a combination of driver self-monitoring using technology and management control and support.
Example calculations: Fleet management. In Table 7, various ways to calculate the effects of possible implementation of Wouters and Bos [35] fleet management measures in Norwegian companies are exemplified. By comparing the rows without (Row 1) and with implementation and a 20% reduction in the number of accidents (Row 2), it is indicated that the measure in the calculation example may lead to 66 fewer personal injuries and 13 fewer KSIs per year. It is, however, important to remember that one cannot assume that no other Norwegian companies involved in HGV transport have fleet management systems recording speed, driving style, etc., in Norway. The survey indicated that 50% of Norwegian goods companies already have such a measure. This is taken into account in Row 3, which is based on a rough assumption that 50% implementation of the measure means that 50% of the accidents have already been reduced by 20%.
Table 7.
Averages for accidents involving personal injuries and property damage per year during the period 2012–2016. Calculation example of 20% reduction in personal injury accidents due to fleet management system. Rows 1–4 include trucking companies (58% of HGV km), while Rows 5–7 also include companies involved in transport for own account (90% of HGV km).
By comparing the numbers in Row 1 with the numbers in Row 3, which indicates 20% reduction and 50% implementation of the measure in Norwegian trucking companies (i.e., aimed at half of the accidents), it is indicated that the measure in the calculation example results in 37 fewer personal injuries. These comprise 7 fewer KSIs per year and 30 fewer minor injuries (cf. minor personal injuries: row 1 vs. row 3).
As the data indicate that the survey seemed to overestimate the prevalence of OSM measures, the table also provides example calculations that assume five times lower occurrence of measures than those found in the survey (Rows 4 and 7). However, it is not known as to whether the incidence of all the measures is overestimated in the survey. Taking into account that the occurrence of measures is likely to be overestimated in the survey (to the same extent as SMSs, i.e., five times), the introduction of fleet management system, as studied by Wouters and Bos (2000), could lead to an average of 10 fewer KSIs and 44 fewer minor injuries per year, when looking at only trucking companies (Row 4).
The table also includes calculation examples including transport for own account (Row 5–7). These estimates indicate that “Fleet management” hypothetically can lead to up to 14 fewer KSIs and 58 fewer minor injuries per year during the study period (Row 7).
Example calculations: Anticipatory driver training. Driver training can also be a relevant measure at level 2 in the Safety ladder. The third main result in the literature review of Mooren et al. [9] is that safety training is closely linked to positive safety outcomes. Gregersen et al. [8] found that the reductions in accident risk were significant in the experimental groups that received driver training. However, Salminen [37] found that training led to more traffic accidents. The study by Gregersen et al. [8] is, however, of higher quality than the study of Salminen, since the latter has no measures of exposure or control groups, and since the sample of Gregersen et al. [8] is larger. For these reasons, the example calculations were based on the conclusions of Gregersen et al. [8].
Table 8 presents an example calculation with a 41% reduction in accident risk as a result of anticipatory driver training, aiming to make drivers aware of their own limitations, etc. [8]. Table 8 calculates the implications of the lower risk for the number of KSIs, given 51% implementation in the companies, which means that the 41% decline can only occur in 49% of the accidents.
Table 8.
Average numbers for accidents involving personal injuries and property damage per year during the period 2012–2016. Calculation example of a 41% reduction in accident risk as a result of “Anticipatory driver training”. Rows 1–3 include trucking companies (58% of HGV kms), while Rows 4–6 also include companies involved in transport for own account (90% of HGV kms).
Row 6 in Table 8 shows that anticipatory driver training can hypothetically result in maximum 37 fewer KSIs, 148 fewer minor personal injuries, and 5043 fewer property damages per year during the period, if also including the companies involved in transport for own account and assuming five times lower incidence of measures than as stated in the survey (Row 4 vs. 6). This is the maximum estimate in the calculations. The corresponding minimum estimates were 14 fewer KSIs, 58 fewer minor personal injuries, and 1898 fewer property damages (Row 1 vs. 2).
4.4.5. Level 3: Focus on the Importance of Work-Related Factors for Road Safety
The third step in the Safety Ladder is “Focus on the importance of work-related factors for transport safety”. High speed among drivers may be a symptom of stress and time pressure that may be traced to work-related conditions (for example, organisation of transport, driver’s customer contact, and commission pay). Given the low focus on OSM in companies employing drivers [18] it is important that managers and employees in trucking companies develop an awareness related to the importance of work-related factors for transport safety. One way of developing awareness towards work-related risks is to implement group-based discussions among the drivers, which is one of the key measures examined by Gregersen et al. [8].
Table 9 focuses on the potential effects of the measure of Gregersen et al. [8], “group discussions aimed at uncovering workplace risk and implementing measures”. Given 40% implementation of this measure, as shown by the survey, 59% risk reduction for 60% of the kilometres driven by HGVs was calculated.
Table 9.
Average numbers for accidents involving personal injury and material damage per year during the period 2012–2016. Example calculation of 59% reduction in accident risk as a result of “group discussions aimed at uncovering workplace risk and implementing measures”. Rows 1–3 include trucking companies (58% of HGV kms), while Rows 4–6 also include companies involved in transport for own account (90% of HGV kms).
Rows 1–3 only focus on trucking companies, whose drivers make up 58% of the kilometres driven and a corresponding share of accidents. Comparing the rows without (1) and with (2) implementation and 59% reduction risk for 60% of the accidents, one sees that the measure in the example calculation can hypothetically provide an average reduction of 93 fewer minor injuries and 23 fewer KSIs per year. Taking into account the fact that the incidence of measures is likely to be overestimated in the survey (to the same extent as SMS), the introduction of this measure can hypothetically lead to an average of 34 fewer killed and seriously injured and 137 fewer minor injuries per year (Row 3). Rows 4 and 5 also include transport for own account (90% of the accidents) and indicate that a measure such as “Group discussions” hypothetically can lead to an average of 52 fewer KSIs and 207 fewer minor injuries per year during the period.
4.4.6. Level 4: Implementing a Safety Management System
The fourth step in the Safety Ladder is to implement an SMS, such as ISO 39001, or other similar alternatives. This refers to the highest level that can be reached when it comes to OSM, since it deals with a very comprehensive and systematic approach to dealing with work place risks. Such systems are, as mentioned, compulsory in aviation, the maritime sector, and rail.
Unfortunately, it is not possible to calculate effects on KSIs, primarily because there are no studies of high enough quality to allow this. This indicates a significant knowledge gap and need for future research. Thomas [14] concludes that there seems to be a relationship between SMS and objective safety outcomes (for example, behaviour and accidents). However, he also concludes that there is no consensus on which components of SMSs that contribute the most to safety outcomes. This indicates important areas for future research.
5. Discussion
The aim of this study was to estimate the potential of OSM to prevent KSIs involving HGV drivers in Norwegian companies, given the current prevalence and effect. Taking all the above-mentioned considerations into account, the example calculations varied between 7 and 52 KSIs that potentially can be avoided annually (retrospectively), depending on assumptions about prevalence and effect, and whether transport for own account is included or not. Thus, the example calculations indicate that OSM measures may reduce KSIs with a share of up to 51% of the total numbers of KSIs involving Norwegian-registered HGVs in Norway. None of the example calculations provide, however, a satisfactory picture of possible effects of introducing the Safety Ladder for trucking companies in Norway because of methodological weaknesses that will be discussed further below. Looking at all the road KSIs in Norway, and not just those that are HGV-related, the maximum potential of OSM was equal to a 14% reduction of fatalities, 4.1% reduction in serious injuries, and 3.4% reduction in minor injuries [49]. Thus, the present study indicates that OSM measures targeting HGV transport may have considerable potential to further reduce the number of accidents. This is even the case in Norway, which had the lowest number of road fatalities in Europe in 2020. Results are also relevant to other countries where HGVs make up a considerable share of the road accident statistics.
To the knowledge of the authors, there are no previous studies calculating the actual numbers of accidents and injuries involving employed HGV drivers that could be prevented in a country with increased implementation of OSM measures in the trucking industry. Most of the existing calculations of preventable traffic accidents at the societal level focus on traditional road safety measures directed to private car drivers, and not employed professional drivers. These calculations focus on the potential related to increased enforcement, improved infrastructure, or improved education (cf. [49]). Additionally, the studies examining outcomes of OSM measures generally focus on effects at the organisational level and not the societal level.
It should also be mentioned that our study indicates that the risk of personal injury accidents involving HGVs has been reduced by 63% in the period 2007–2016. This is a large reduction, which also is in line with the development trend for road accidents in Norway in the last 20 years [49]. Elvik and Høye [49] suggest that the risk of accidents involving HGVs may be even further reduced with increased implementation of OSM measures in trucking companies.
The present study contributes to existing research, as it provides an approach for calculating the effects of OSM measures (and other safety measures), given existing prevalence and effects of measures. The study provides several relevant factors that can be used in example calculations, on the basis of a large corpus of data material (e.g., the number of accidents per HGVs in accidents, the number of injuries, including the number of KSIs, the number of property damage accidents).
One of the key challenges related to making example calculations of the kind provided in this study is related to characteristics of the existing studies of OSM. Previous research has concluded that there is a lack of peer-reviewed, robust empirical evidence indicating the effects of specific OSM measures in the road sector (e.g., [10,50,51]). In accordance with this, the literature review in the present study indicates that the lacking robust design of most of the existing studies is the first main challenge associated with using data from available studies to estimate possible consequences of OSM on the number of KSIs in traffic. Very few of them included before/after measurements with control groups, etc. Only two of the 24 reviewed studies had robust enough research designs for us to use them in the present study, in addition to calculating effects on accidents risk. These studies indicate that OSM measures can reduce the incidence of traffic accidents by between 20% [35] and 60% [8].
Given the results on the outcomes of OSM for road safety, motivating companies employing HGV drivers to implement OSM measures seems to be a crucial policy implication. At the current stage, OSM measures are voluntary in the road sector, in contrast to the other transport sectors, where OSM is legally required [20,21,22]. One potential policy implication, given the effects on KSIs illustrated in the present paper, could be to develop legislation requiring some level of OSM in the road sector, as it is in the other transport sectors. Given challenges related to equal conditions for competition in European countries, such legislation must be EU-wide. Until new legal SMS requirements are implemented in the trucking industry, it seems important to follow the Safety Ladder approach, starting with the measures that are easiest to implement, concrete, and which provide the most easily attainable results, given the importance of companies’ few resources and low competence (cf. Figure 1, Section 2). If such management practices are not required by national legislations, they can be required by transport buyers, industry associations, etc.
There are several methodological weaknesses with the present study, indicating questions for future research. First, the actual numbers of employed drivers’ and self-employed drivers’ accident involvement are lacking, and it is assumed that they have equal risk in the calculations. The same applies to drivers employed in companies where transportation is an auxiliary function to the primary business (“transport for own account”). These assumptions must be tested in future research, which can compare risk, measures, etc., for the three groups. Another potential weakness of the study is that the survey on the prevalence of OSM measures seemed to overestimate the occurrence of such measures (which could lead to an underestimation of potential effects of OSM). To compensate for the uncertainty induced by the differences in the results from the prevalence survey and more objective data sources, the example calculations of prevalence were based on both survey results and “adjusted” survey results, assuming that other prevalence results also might be overestimated with a factor of five in the survey. It seems that the main reason for the overestimation of OSM measures in the surveys is that there is a discrepancy between the measures as described in the studies on which they are based (e.g., [8,35]) and the measures that the respondents envisioned when they answered the survey. Group discussions about safety may be a straightforward and common activity among drivers. However, it may also be a science-based intervention comprising several structured activities, as described by Gregersen et al. [8]. Thus, when respondents answered, it is likely that they envisioned the first meaning of group discussions and not the latter. Robust data are also lacking on the effect of OSM measures. Finally, the literature study shows that a main problem with the research on OSM is that it lacks a robust empirical basis for pointing out the relationship between different, specific management measures and practices and safety outcomes.
Several important issues for future research are indicated in the present study. There are no sufficiently good studies evaluating the effects of specific management practices at Level 2 in the Safety Ladder, i.e., studies evaluating the effects of trucking companies’ follow up of drivers’ speed, driving style, and seat belt use. Two studies report different effects of so-called anticipatory driver training [8,9], while another study does not show an effect [37]. This also requires more research. The third step in the Safety Ladder is “Focus on the importance of work-related factors for transport safety”. This in particular refers to the organisation of transport, with the consequences it has for drivers’ experienced stress, time pressure, fatigue, etc. More research is needed to shed light on these relationships and highlight the effects of specific management practices. The fourth step in the Safety Ladder is the implementation of SMSs. The absence of (high-quality) studies examining the effect of SMSs on KSIs in traffic accidents indicates a significant knowledge gap and need for future research. Previous research indicates that there seems to be a relationship between SMS and objective safety outcomes (such as behaviour and accidents) (cf. [9,10,14,44]). However, this research also concludes that there is no consensus about which specific components of SMS (e.g., risk analyses, training, procedures, policies, roles) contribute most to safety outcomes. This is an important issue for future research.
Finally, the importance of contextual factors and unique packages of OSM implementation previous studies of OSM in trucking companies indicates the importance of making more in-depth comparative analysis of both OSM measures in trucking companies and accident data. This may provide crucial contextual knowledge that may complement quantitative analyses and example calculations such as those provided in the present paper. In-depth comparative analysis of accident data involving HGVs are for instance provided in Nævestad et al. [18], suggesting the importance of OSM and framework conditions for HGV safety.
6. Conclusions
The present study provides example calculations indicating that between 7 and 52 KSIs potentially can be avoided annually (retrospectively) with increased implementation of OSM measures in companies employing HGV drivers. Thus, OSM measures may reduce KSIs with a share of up to 51% of all KSIs related to HGV accidents in Norway, when taking into consideration known effects in robust studies and current prevalence.
Author Contributions
Conceptualization, T.-O.N.; methodology, T.-O.N., R.P., R.E., I.B.H. and G.N.J.; formal analysis, T.-O.N., R.P., R.E., I.B.H. and G.N.J.; writing—original draft preparation, T.-O.N., R.P., R.E., I.B.H. and G.N.J.; writing—review and editing, T.-O.N.; project administration, T.-O.N.; funding acquisition, T.-O.N. All authors have read and agreed to the published version of the manuscript.
Funding
The present study was funded by the BEST program of the Norwegian Public Roads Administration (NPRA).
Institutional Review Board Statement
All subjects provided their informed consent for inclusion before they participated in the study. The study was conducted according to the guidelines of the Declaration of Helsinki and reported to the Norwegian Centre for Research Data (NSD), which is a government-owned company responsible for managing data for the research community of Norway (Project Reference: “Forekomst av tiltak mot trafikksikkerhet i godstransportbedrifter”).
Informed Consent Statement
All subjects provided their informed consent for inclusion before they participated in the study. (cf. point above).
Data Availability Statement
The data presented in this study are available on request from the corresponding author.
Acknowledgments
The contact persons in NPRA were Marianne Rostoft Stølan and Arild Ragnøy. The companies were recruited with good help from the Norwegian Hauliers’ Association (NLF), represented by Jens Olaf Rud, and a drivers’ union. The authors are very thankful for the funding from NPRA, as well as for all the help from the NLF and the drivers’ union.
Conflicts of Interest
The authors declare no conflict of interest.
References
- Evgenikos, P.; Yannis, G.; Folla, K.; Bauer, R.; Machata, K.; Brandstaetter, C. Characteristics and causes of heavy goods vehicles and buses accidents in Europe. Transp. Res. Procedia 2016, 14, 2158–2167. [Google Scholar] [CrossRef] [Green Version]
- Eurostat. 2018. Available online: https://ec.europa.eu/eurostat/statistics-explained/index.php/Road_freight_transport_statistics#Growth_in_EU_road_freight_transport_for_the_fifth_consecutive_year (accessed on 21 December 2020).
- Hovi, I.B.; Caspersen, E.; Wangsness, P.B. Godstransportmarkedets Sammensetning og Utvikling TØI Rapport 1363/2014; Transportøkonomisk Institutt: Oslo, Norway, 2014. [Google Scholar]
- ERSO. 2018. Available online: https://ec.europa.eu/transport/road_safety/sites/roadsafety/files/pdf/statistics/dacota/bfs20xx_hgvs.pdf (accessed on 21 December 2020).
- NHTSA, 2019. Available online: https://crashstats.nhtsa.dot.gov/Api/Public/ViewPublication/812663 (accessed on 21 December 2020).
- Langeland, P.E.; Phillips, R.O. Tunge Kjøretøy og Trafikkulykker—Norge Sammenliknet Med Andre Land i Europa. TØI Rapport 1494/2016; Transportøkonomisk Institutt: Oslo, Norway, 2016. [Google Scholar]
- Banks, T.D. An Investigation into How Work-Related Road Safety Can Be Enhanced. Ph.D. Thesis, Queensland University of Technolohy, Brisbane, Australia, 2008. [Google Scholar]
- Gregersen, N.P.; Brehmer, B.; Morén, B. Road safety improvement in large companies. An experimental comparison of different measures. Accid. Anal. Prev. 1996, 28, 297–306. [Google Scholar] [CrossRef] [Green Version]
- Mooren, L.; Grzebieta, R.; Williamson, A.; Olivier, J.; Friswell, R. Safety management for heavy vehicle transport: A review of the literature. Saf. Sci. 2014, 62, 79–89. [Google Scholar] [CrossRef]
- Mooren, L.; Williamson, A.; Friswell, R.; Olivier, J.; Grzebieta, R.; Magableh, F. What are the differences in management characteristics of heavy vehicle operators with high insurance claims versus low insurance claims? Saf. Sci. 2014, 70, 327–338. [Google Scholar] [CrossRef]
- Zohar, D. The effects of leadership dimensions, safety climate, and assigned priorities on minor injuries in work groups. J. Organ. Behav. 2002, 23, 75–92. [Google Scholar] [CrossRef]
- Wills, A.R.; Watson, B.; Biggs, H.C. Comparing safety climate factors as predictors of work-related driving behavior. J. Saf. Res. 2006, 37, 375–383. [Google Scholar] [CrossRef] [PubMed] [Green Version]
- Huang, Y.H.; Zohar, D.; Robertson, M.M.; Garabet, A.; Lee, J.; Murphy, L.A. Development and validation of safety climate scales for lone workers using truck drivers as exemplar. Transp. Res. Part F 2013, 17, 5–19. [Google Scholar] [CrossRef] [Green Version]
- Thomas, M.J.W. A Systematic Review of the Effectiveness of Safety Management Systems; No. AR-2011-148; Australian Transport Safety Bureau: Canberra, Australia, 2012.
- Elvik, R.; Høye, A.; Vaa, T.; Sørensen, M. The Handbook of Road Safety Measures, 2nd ed.; Emerald Insight: Bingley, UK, 2009. [Google Scholar]
- Antonsen, S. The relationship between culture and safety on offshore supply vessels. Saf. Sci. 2009, 47, 1118–1128. [Google Scholar] [CrossRef]
- Nævestad, T.-O. Culture, Crises and Campaigns: Examining the Role of Safety Culture in the Management of Hazards in a High Risk Industry. Ph.D. Thesis, University of Oslo, Oslo, Norway, 2010. [Google Scholar]
- Nævestad, T.O.; Phillips, R.O.; Elvebakk, B. Traffic accidents triggered by drivers at work–A survey and analysis of contributing factors. Transp. Res. Part F Traffic Psychol. Behav. 2015, 34, 94–107. [Google Scholar] [CrossRef] [Green Version]
- Newnam, S.; Watson, B. Work-related driving safety in light vehicle fleets: A review of past research and the development of an intervention framework. Saf. Sci. 2011, 49, 369–381. [Google Scholar] [CrossRef] [Green Version]
- IATA. Creating a Positive Safety Culture. Best Practices to Align with Annex 19’s New Recommendations. 2019. Available online: https://go.updates.iata.org/safety-culture?_ga=2.26439165.1941341082.1571071913-370565390.1570852392 (accessed on 21 December 2020).
- ERA. European Railway Agency Safety Unit Application Guide for the Design and Implementation of a Railway Safety Management System Developing and Improving Safety Culture in the Organisation; Publications Office of the European Union: Luxembourg, 2013. [Google Scholar]
- Lappalainen, F.J.; Kuronen, J.; Tapaninen, U. Evaluation of the ISM Code in the Finnish shipping companies. J. Marit. Res. 2014, 9, 23–32. [Google Scholar]
- T-OPhillips, R.O.N.; Elvebakk, B. The safety ladder: Developing an evidence-based safety management strategy for small road transport companies. Transp. Rev. 2017, 38, 372–393. [Google Scholar] [CrossRef]
- Steen, J.; Bråten, R.M.; Jordfald, B.; Dotterud Leiren, M.; Nævestad, T.-O.; Skollerud, K.H.; Sternberg, H.; Tranvik, T. Arbeidsforhold I Gods og Turbil. Fafo Rapport 2014:58; Fafo: Oslo, Norway, 2014. [Google Scholar]
- European Commission. Road freight transport vademecum. In European Commission, Directorate General Energy and Transport, Directorate E—Inland Transport, Unit E.1—Land Transport Policy; European Commission: Brussels, Belgium, 2009. [Google Scholar]
- Nævestad, T.O.; Blom, J.; Phillips, R.O. Safety culture, safety management 1162 and accident risk in trucking companies. Transp. Res. Part F Traffic Psychol. Behav. 2020, 73, 325–347. [Google Scholar] [CrossRef]
- Arboleda, A.; Morrow, P.C.; Crum, M.R.; Shelley, M.C., II. Management practices as antecedents of safety culture within the trucking industry: Similarities and differences by hierarchical level. J. Saf. Res. 2003, 34, 189–197. [Google Scholar] [CrossRef]
- Goettee, D.; Spiegel, W.; Tarr, R.; Campanian, C.; Grill, L. Overview of Federal Motor Carrier Safety Administration Safety Training Research for New Entrant Motor Carriers; The SAGE Corporation, Motor Carrier Services: Washington, DC, USA, 2015. [Google Scholar]
- Hickman, J.S.; Geller, E.S. Self-management to increase safe driving among short-haul truck drivers. J. Organ. Behav. Manag. 2003, 23, 1–20. [Google Scholar] [CrossRef]
- Hickman, J.S.; Hanowski, R.J. Use of a video monitoring approach to reduce at-risk driving behaviors in commercial vehicle operations. Transp. Res. Part F Traffic Psychol. Behav. 2011, 14, 189–198. [Google Scholar] [CrossRef]
- Musicant, O.; Lotan, T.; Toledo, T. Safety correlation and implications of an in-vehicle data recorder on driver behavior. In Proceedings of the TRB Conference, Washington, DC, USA, 21–25 January 2007. [Google Scholar]
- Myers, L.A.; Russi, C.S.; Will, M.D.; Hankins, D.G. Effect of an onboard event recorder and a formal review process on ambulance driving behaviour. Emerg. Med. J. 2012, 29, 133–135. [Google Scholar] [CrossRef]
- Olson, R.; Anger, W.K.; Wipfli, D.L.; Gray, M. A new health promotion model for lone workers: Results of the safety & health involvement for truckers (SHIFT) pilot study. J. Occup. Environ. Med. 2009, 51, 1233–1246. [Google Scholar]
- Toledo, T.; Musicant, O.; Lotant, T. In-vehicle data recorders for monitoring and feedback on drivers’ behavior. Transp. Res. Part C 2008, 16, 320–331. [Google Scholar] [CrossRef]
- Wouters, I.J.; Bos, J.M. Traffic accident reduction by monitoring driver behaviour with in-car data recorders. Accid. Anal. Prev. 2000, 32, 643–650. [Google Scholar] [CrossRef]
- Newnam, S.; Oxley, J. A program in safety management for the occupational driver: Conceptual development and implementation case study. Saf. Sci. 2016, 84, 238–244. [Google Scholar] [CrossRef]
- Salminen, S. Two interventions for the prevention of work-related road accidents. Saf. Sci. 2008, 46, 545–550. [Google Scholar] [CrossRef]
- Feyer, A.-M.; Williamson, A.; Friswell, R. Balancing work and rest to combat driver fatigue: An investigation of two-up driving in Australia. Accid. Anal. Prev. 1997, 29, 541–553. [Google Scholar] [CrossRef]
- Gander, P.H.; Marshall, N.S.; Bolger, W.; Girling, I. An evaluation of driver training as a fatigue countermeasure. Transp. Res. Part F Traffic Psychol. Behav. 2005, 8, 47–58. [Google Scholar] [CrossRef]
- Moore-Ede, M.; Heitmann, A.; Guttkuhn, R.; Trutschel, U.; Aguirre, A.; Croke, D. Circadian alertness simulator for fatigue risk assessment in transportation: Application to reduce frequency and severity of truck accidents. Aviat. Space Environ. Med. 2004, 75, A107–A118. [Google Scholar] [PubMed]
- Wallington, D.; Murray, W.; Darby, P.; Raeside, R.; Ison, S. Work-related road safety: Case study of British Telecommunications (BT). Transp. Policy 2014, 32, 194–202. [Google Scholar] [CrossRef]
- Murray, W.; Ison, S.; Gallemore, P.; Nijjar, H.S. Effective Occupational Road Safety Programs A Case Study of Wolseley. Transp. Res. Rec. 2009, 2096, 55–64. [Google Scholar] [CrossRef]
- Murray, W.; White, J.; Ison, S. Work-related road safety: A case study of Roche Australia. Saf. Sci. 2012, 50, 129–137. [Google Scholar] [CrossRef]
- Naveh, E.; Marcus, A. Financial performance, ISO 9000 standard and safe driving practices effects on accident rate in the U.S. motor carrier industry. Accid. Anal. Prev. 2007, 39, 731–742. [Google Scholar] [CrossRef]
- Nævestad, T.-O.; Bjørnskau, T. Kartlegging av Sikkerhetskultur i tre Godstransportbedrifter.Oslo: TØI Rapport 1300/2014; Transportøkonomisk Institutt: Oslo, Norway, 2014. [Google Scholar]
- Naveh, E.; Katz-Navon, T. A Longitudinal Study of an Intervention to Improve Road Safety Climate: Climate as an Organisational Boundary Spanner. J. Appl. Psychol. 2015, 100, 216–226. [Google Scholar] [CrossRef]
- Flin, R.; Mearns, K.; O’Connor, P.; Bryden, R. Measuring safety climate: Identifying the common features. Saf. Sci. 2000, 34, 177–192. [Google Scholar] [CrossRef]
- Guldenmund, F.W. The nature of safety culture: A review of theory and research. Saf. Sci. 2000, 34, 215–257. [Google Scholar] [CrossRef]
- Elvik, R.; Høye, A. Potensialet for å Redusere Antall drepte og Hardt Skadde i Trafikken Fram til 2030, TØI Rapport, 1645/2018; Transportøkonomisk Institutt: Oslo, Norway, 2018. [Google Scholar]
- Fourie, C.; Holmes, A.; Hildritch, C.; Bourgeois-Bougrine, S.; Jackson, P. Interviews with Operators, Regulators and Researchers with Experience of Implementing Fatigue Risk Management Systems. In Road Safety Research Report; Department for Transport: London, UK, 2010. [Google Scholar]
- Grayson, G.B.; Helman, S. Work-related road safety: A systematic review of the literature on the effectiveness of interventions. In IOSH Research Report 11.3; Institute of Occupational Safety and Health: Wigston, UK, 2011. [Google Scholar]

Publisher’s Note: MDPI stays neutral with regard to jurisdictional claims in published maps and institutional affiliations. |
© 2022 by the authors. Licensee MDPI, Basel, Switzerland. This article is an open access article distributed under the terms and conditions of the Creative Commons Attribution (CC BY) license (https://creativecommons.org/licenses/by/4.0/).