Article

Elaboration and Analysis of SARS-CoV-2 Data in the Frame of Occupational Safety and Health Assessment in Sustainable Engineering Systems

by
Stefania F. Tatli
1 and
Panagiotis K. Marhavilas
1,2,*
1
Department of Production and Management Engineering, Democritus University of Thrace, 67132 Xanthi, Greece
2
Department of Engineering Project Management (MSc), Faculty of Science & Technology, Hellenic Open University (H.O.U.), 26335 Patras, Greece
*
Author to whom correspondence should be addressed.
Submission received: 27 October 2023 / Revised: 5 December 2023 / Accepted: 12 December 2023 / Published: 2 January 2024

Abstract

:
Facing the threat of SARS-CoV-2, several countries implemented protective measures to annihilate the waves of the pandemic. Apart from quarantine, social distancing, frequent disinfection, and the use of a face mask, vaccination against COVID-19 soon became available. The measures taken in the workplace to inhibit the spread of the virus were important, as some controversial policies emerged regarding the vaccination status of employees. The “health pass” changed the workplace environment immensely, as in many job sectors vaccination became mandatory. Unvaccinated employees were required to undergo specific COVID-19 tests to access their workplace, while other specialized workers such as health workers were removed from their work altogether. Such measures would be justified if it was certain that vaccinated people cannot transmit the virus, but over the course of years this hypothesis seems to have faded. The main aim of this study is the confirmation (or the non-validation) of this hypothesis and of the specific applied measures through the elaboration and statistical analysis of vaccination data from 35 countries in relation to their daily announced infections over the time frame from the forty-fourth week of 2021 to the fourth week of 2022. This is examined from an occupational safety and health (OSH) perspective (taking into account the three pillars of sustainability) concerning risk management and safety assessment at the workplaces of sustainable engineering systems (SES). The findings imply that this hypothesis is contestable. Therefore, it is doubtful whether workplace segregation measures were socially and economically sustainable. It is deduced that (i) the complete freedom of vaccinated employees was a situation which intensified occupational risk, degraded the safety level at the workplaces of sustainable engineering systems, and increased the OSH risk management difficulties, and, on the other hand, (ii) the financial burden of mandatory unemployment and frequent testing was not justified and economically sustainable for the unvaccinated individuals in the middle of a worldwide economic crisis.

1. Introduction

From the beginning of the SARS-CoV-2 pandemic, workplace environments were highly impacted by the sudden changes quarantine induced. Many organizations and agencies published guidelines for the management of the virus in the workplace, namely, the World Health Organization (WHO) [1,2], the Occupational Safety and Health Administration (OSHA) [3], the International Labour Organization (ILO) [4], and the European Agency for Safety and Health at Work (EU-OSHA) [5].
Alongside the guidelines, based on Directive 2000/54/EC of the European Parliament concerning the protection of workers from risks related to exposure to biological agents at work [6], SARS-CoV-2 was included by the Commission Directive (EU) 2020/739 [7] in the list for biological agents known to infect humans, and is classified as a biological agent in biological risk group 3. A biological agent of risk group 3 is stated in the Directive 2000/54/EC as “one that can cause severe human disease and present a serious hazard to workers; it may present a risk of spreading to the community, but there is usually effective prophylaxis or treatment available”. In addition, SARS-CoV-2 was added to OiRA (Online Interactive Risk Assessment), an online EU-OSHA tool that assists risk assessment studies for the better management of occupational risks. In conclusion, SARS-CoV-2 is considered as a potential workplace risk factor, and measures taken in the workplace can be examined from the scope of the science of occupational safety and health (OSH).
Some studies discussed how quarantine had negative psychosocial effects [8,9,10], so it was crucial for another viable solution to emerge upon the realization that this situation could not continue long-term. Finally, vaccines against COVID-19 were created and were available beginning in December 2020, promising the return to normality. Mass vaccination began in the hope of achieving a totally immune population.
As vaccination rates grew higher and most countries achieved a rate of full vaccination higher than the 60% of population, the need for a proof of vaccination arose and led to the creation of the Covid Certificate.
In Europe the use of the EU Covid Certificate for travelling purposes started on June 2021 with Regulation 2021/953 [11], which permitted travelling to the EU without restrictions for anyone with a health pass. In paragraph (7) of the same directive, it is stated that: “Persons who are vaccinated or who have had a recent negative COVID-19 test result and persons who have recovered from COVID-19 in the previous six months seem to have a reduced risk of infecting people with SARS-CoV-2, according to current and still evolving scientific evidence. The free movement of persons who, according to sound scientific evidence, do not pose a significant risk to public health, for example because they are immune to and cannot transmit SARS-CoV-2, should not be restricted, as such restrictions would not be necessary to achieve the objective of safeguarding public health”.
For that era of 2021 and its existing scientific evidence, it is understood that the common belief was that vaccinated individuals could not transmit the virus, or they had a reduced risk of doing so. Based on this concept, several prohibiting measures were implemented for those who didn’t possess a Covid Certificate, as they were considered the main source of transmission. Although the restrictive measures initially concerned travelling within the EU, most governments followed the same principle and used the digital certificate to apply prohibitive measures for the unvaccinated. For anyone who refused to be vaccinated, the measures in Austria included fines [12], while in Greece the governmental stress on unvaccinated people was extremely high and a significant financial fine was imposed for citizens over 60 years of age by a presidential decree [13].
Some of the measures applied in the labor sector selectively for the unvaccinated individuals were: (i) the obligation of unvaccinated workers to get tested frequently for a possible infection at their own financial expense in order to enter their workplace [14], (ii) the non-obligation of compensation for the unvaccinated workers who, due to compulsory confinement, missed work and lost their salary [15], as well as (iii) the removal of health workers from their work until they were vaccinated [16,17]. Mandatory vaccination was extended to other professions, such as the US military, according to the US Department of Defense [18]. This method of mandatory checking of the Covid Certificate ultimately proved to be a strong incentive to increase vaccination rates [19,20,21].
A definition of sustainability is “the capacity to maintain or improve the state and availability of desirable materials and conditions over the long term” [22]. Although the term is usually identified with the environmental movement, it ideologically covers sociopolitical and economic aspects of life as well as their interrelations. Sustainability is traditionally constructed of three basic categories, namely, the “three pillars of sustainability”, which are environmental, social, and economic. While a popular depiction of the three pillars is a Venn diagram with sustainability being central, at the ideal intersection of these three aspects, an alternative representation is the one shown on Figure 1 with nested circles [23].
As we examine the effects of SARS-CoV-2 in the workplace, this study is mainly focused on the economic and social pillars. “Occupational safety and health” (OSH) certainly belongs to the social pillar, among other health-related issues, whereas the economic inequalities that emerged during the pandemic belong to the economic pillar.
Starting the analysis from the central cycle of the economy, it is crucial to emphasize that during the pandemic a worldwide economic crisis was observed [24,25,26,27,28]. As a result of this inevitable economic recession, a strong sense of financial insecurity was created across all work sectors since no sector was left unaffected [26], making unemployment an unfeasible scenario. A fear of losing one’s job was cultivated, as losing a main source of income during that time was not viable for one’s survival. Therefore, it was debated whether policies such as the OSHA mandate were sustainable solutions, while the complete removal of workers from their workplace (mainly in the health sector) and their deprivation of their rights to work due to their vaccination status further intensified the problem of unemployment. Employment plays an important role in the sustainable development of countries, while high rates of unemployment put this development at risk [29].
Furthermore, the scientific literature has commonly discussed how inadequate policies of occupational safety and health have a major financial cost on enterprises and society in general, as they can even influence a country’s gross domestic product [30,31]. If employees don’t operate in a safe and healthy environment, work productivity and motivation decrease, resulting in a loss of quality and profit.
On the other hand, investment in OSH systems add value to an organization through reduced costs, improved productivity, and a range of other benefits [32]. For COVID-19, it is stated that increased investments in approaches such as testing and contact tracing could have economic benefits at least 30 times higher than their estimated costs [33]. Using methods proven to work in order to tackle the issue of workplace virus transmission instead of imposing questionable segregating restrictions was the ideal sustainable strategy cost-wise, and could be considered useful for a potential future pandemic crisis.
The social pillar is described as the most complicated pillar; Murphy [34] states that its meaning and related objectives are vague, while the scientific literature gives a broad definition of the social pillar of sustainable development. Murphy’s review of the literature suggests four basic concepts: equity, awareness of sustainability, participation, and social cohesion. Equity is directly connected with the human rights to employment and healthcare, but also to the freedom from any potential discrimination; thus, it is safe to assume that OSH issues that emerged during the pandemic belong to the social pillar spectrum rather than the economic one. The compulsory removal of workers from their workplace and the deprivation of their rights to employment without a substantial reason go against the idea of equity, and consequently damage the notion of social sustainability.
Moreover, if vaccination against COVID-19 is ineffective in terms of transmission and we cannot exclude vaccinated individuals as a possible source of transmission, the result of freeing the one party (vaccinated) and minimizing the freedoms of the other party (unvaccinated) was harmful for both parties. From the OSH point of view, that could mean that employees were not fully protected but rather exposed to a potential workplace hazard, since for a certain time frame measures were targeted only for the unvaccinated. Due to a false sense of safety, it is possible that the vaccinated were not as consistent with protective measures as the unvaccinated. This situation, combined with the fact that they were not obliged to undergo frequent testing, might have been detrimental for the health and safety of all workers, vaccinated or not.
Lastly, dividing the population by their vaccination status was an act that created discriminatory situations at work, prejudices, distrust, fear, hostility, alienation, and loss of reputation. While some countries such as Italy required both unvaccinated and vaccinated workers to test in specific work sectors, in other countries, the economic burden of repeated testing that concerned solely the unvaccinated workers, even though they were not the only source of transmission, was another situation that caused discrimination and a feeling of punishment for their personal choices. These conditions further damaged social cohesion and the idea of sustainability. While it is accepted that policies that can minimize the spread of COVID-19 such as testing, contact tracing, and isolation have an enormous social value [33], it is important to assess whether measures such as vaccine mandates were useful, or even harmful to society.
On the other hand, according to the work of Magnavita et al. [35] among the social problems, it is worth mentioning the fact that the growing hostility towards vaccinations has given rise to anti-vaccination movements in many countries, which in many cases resulted in violent behavior toward healthcare personnel. Caring for patients who resist medical treatment is particularly stressful for doctors.
There have been numerous studies that analyze the data of SARS-CoV-2, yet few of them have resulted in the conclusion that vaccine rates were unrelated to infection rates.
Subramanian and Kumar [36] used the vaccination data and numbers of cases of 68 countries and 2947 US counties for a time frame of one week to create a scatter plot. They observed that countries with higher rates of fully vaccinated individuals also had higher numbers of cases, as the trend line on their scatter plot indicated a positive correlation between those two factors. They concluded that increases in COVID-19 cases were unrelated to vaccination rates. A similar study [37] presents a scatter plot with the data of vaccination and infections in 191 countries, and a positive correlation (+0.57) was observed between the average cases per million and the vaccination rate (%).
Greiner and Owusu [38] performed a set of estimations, with statistical results indicating that there is a positive correlation between vaccinations (boosters as well) and infection rates. In their conclusions they imply that vaccination against COVID-19 does not prevent transmission of the virus.
Kampf used time series to plot vaccination rates and full vaccination in Germany and presented some data from UK and Israel to conclude that vaccinated people should not be excluded from the potential sources of transmission [39].
A significant increase in COVID-19 cases was detected by Brown et al. after multiple large public gatherings in Massachusetts [40]. An important fact of their findings was that 74% of the cases were among the fully vaccinated (346 out of 469 cases), so it was concluded that prevention strategies should be expanded regardless of vaccination status. Another statistical analysis of infections by vaccination status was conducted for 96,201 individuals incarcerated in the state prison system of California, with results indicating that there was a statistically significant higher rate of infections in the vaccinated group [41]. In a similar study of prison settings that aimed to analyze the infectiousness of different groups according to vaccination status, it was deduced that it isn’t guaranteed that vaccinated individuals have decreased infectiousness. In some cases, it was even observed that vaccinated individuals had a longer duration of virus positivity in contrast to some unvaccinated individuals, and thus the authors concluded that the vaccinated are no less infectious than the unvaccinated [42].
Singanayagam et al. constructed an important study with the aim of investigating the transmission of the Delta variant among unvaccinated and vaccinated individuals [43]. The results of their statistical analysis indicate that both parties have similar peak viral loads; thus, both of them can transmit the virus to contacts in the same household setting. They suggested that public health and social measures are important, even among vaccinated individuals.
A very comprehensive study was conducted by Mavridis et al. [44], where many important topics were discussed, such as vaccine efficacy and the negative effects of vaccine mandates on work, health, and socially related aspects of life. After the examination of data by the UK Health Security Agency, the Robert Koch Institute, and a scientific literature review, they declare that vaccinated people can transmit the virus. Based on this belief, Mavridis et al. extended their analysis to the significance of the mandate imposed for health care workers and its financial and social consequences.
The scientific literature examining the negative effects of workplace vaccination mandates is scarce, mainly because they have been examined from the point of view of bioethics rather than occupational safety and health. The aspect of sustainability is not mentioned in any relevant paper, making our effort to connect vaccination mandates to sustainability issues unique.
Perhaps the most analytical study of COVID-19 vaccination mandates and their consequences is that of Bardosh et al. [45]. They analyzed how the pandemic restrictions negatively influenced the world at a social, psychological, political, and economic level. They also discussed the effect of mandates on workers, although briefly. Voo et al. [46] examined the implementation of vaccination-based differentiated measures (VDMs) taking into consideration the fact that the vaccinated can still transmit the virus. They argued that VDMs can actually pose a threat since selectively raising the restrictions on high-risk settings can be a dangerous situation for both vaccinated and unvaccinated individuals. Apart from the consequences of VDMs for society, they mentioned that VDMs for occupational safety and health can also have an impact on the employability of unvaccinated workers.
Other studies [47,48,49] have analyzed the effects of COVID-19 safety measures in the workplace, but none of them mention the vaccine factor and its relevant segregation measures, as they were written prior to the implementation of mandates.
Taking into consideration that most studies divide vaccination status in two categories (vaccinated and unvaccinated) even though the term “fully vaccinated” is complicated, we decided to conduct a statistical analysis that divides the population based on vaccine doses. By using this improved technique, we can achieve a more extensive analysis on the effectiveness of the vaccine in terms of transmission. Since there is not an accurate time period of full immunity due to new variants of the virus emerging, and estimations for the duration of vaccine efficacy seem to vary, fully vaccinated does not necessarily mean fully protected.
In agreement with other studies of the scientific literature, the results of our analysis indicate that vaccination didn’t have an effect on restraining the transmission of the virus. This fact reverses the commonly accepted belief regarding the measures taken in workplaces in order to secure the occupational safety and health of workers, as the act of giving total freedom to vaccinated individuals became a work hazard itself. Therefore, it is considered very important to emphasize this from the OSH point of view at the workplaces of sustainable engineering systems, as there seems to be a gap in the literature related to heightened risks in workplaces due to the lack of obligation of the vaccinated workers to follow public health measures.
As occupational safety and health was threatened by this situation, it is relevant to examine it in terms of sustainability and generally from the perspective of the three pillars of sustainability. Thus, the main intention of this study is the validation (or the non-validation) of this situation and also of the applied particular measures during the pandemic through the elaboration and analysis of SARS-CoV-2 data from thirty-five countries worldwide in the frame of occupational safety and health (OSH) assessment in sustainable engineering systems. Creating and maintaining a safe workplace is crucial to ensure a healthy life as a part of sustainable living.
The article is composed of five main sections: (1) Introduction, (2) Materials and Methods, (3) Results, (4) Discussion, and (5) Conclusions.

2. Materials and Methods

Data for the daily and weekly announced cases of infection were extracted from Our World in Data [50], and certain data gaps were completed with data from the European Centre for Disease Prevention and Control [51].
The time frame of our research was from the forty-fourth week of 2021 to the fourth week of 2022, a complete trimester starting from the first day of the first month (1 November) almost to the last day of the third month (30 January). This particular trimester was chosen because it was the turning point between the Delta and Omicron variants. Segregation measures and mandates were already imposed in some countries, so that trimester can illustrate the results of these policies. Another practical reason for this choice was that the data for that trimester had a higher quality in comparison to previous trimesters for most of the countries.
During the course of the study, the fourth dose of the vaccine was already available, so six vaccination statuses were set:
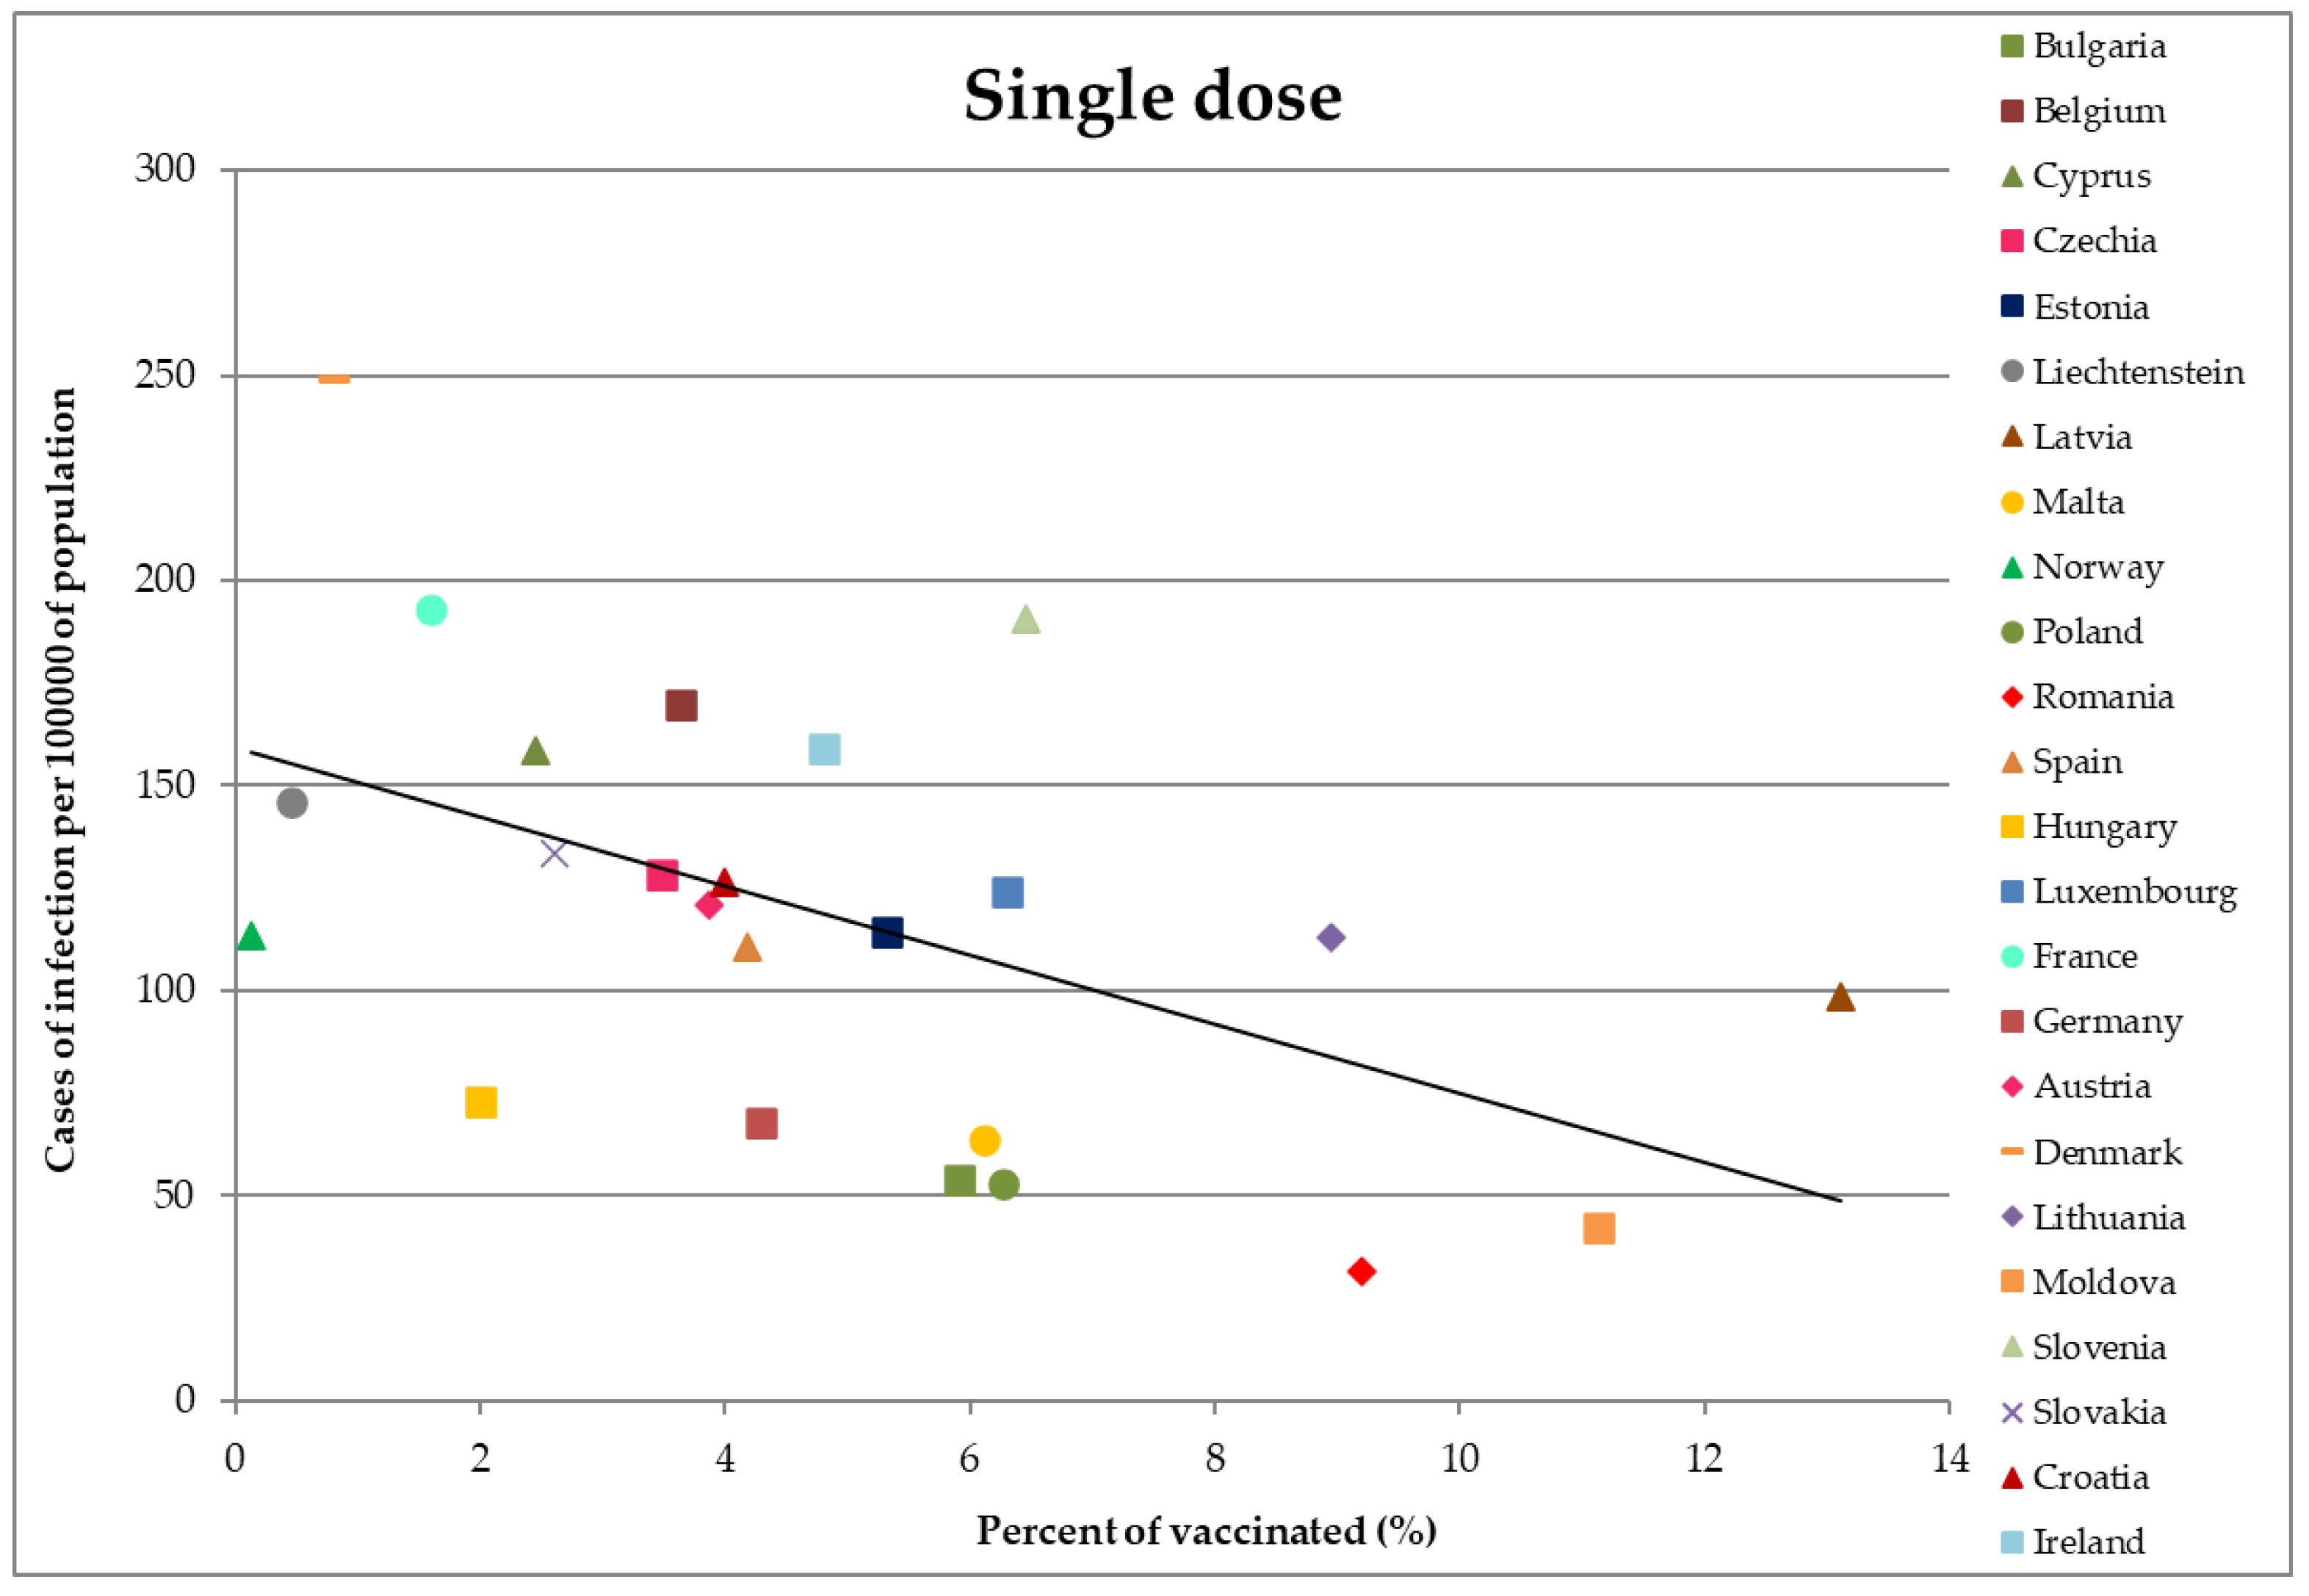
  • Vaccinated with one dose of the single dose vaccine program,
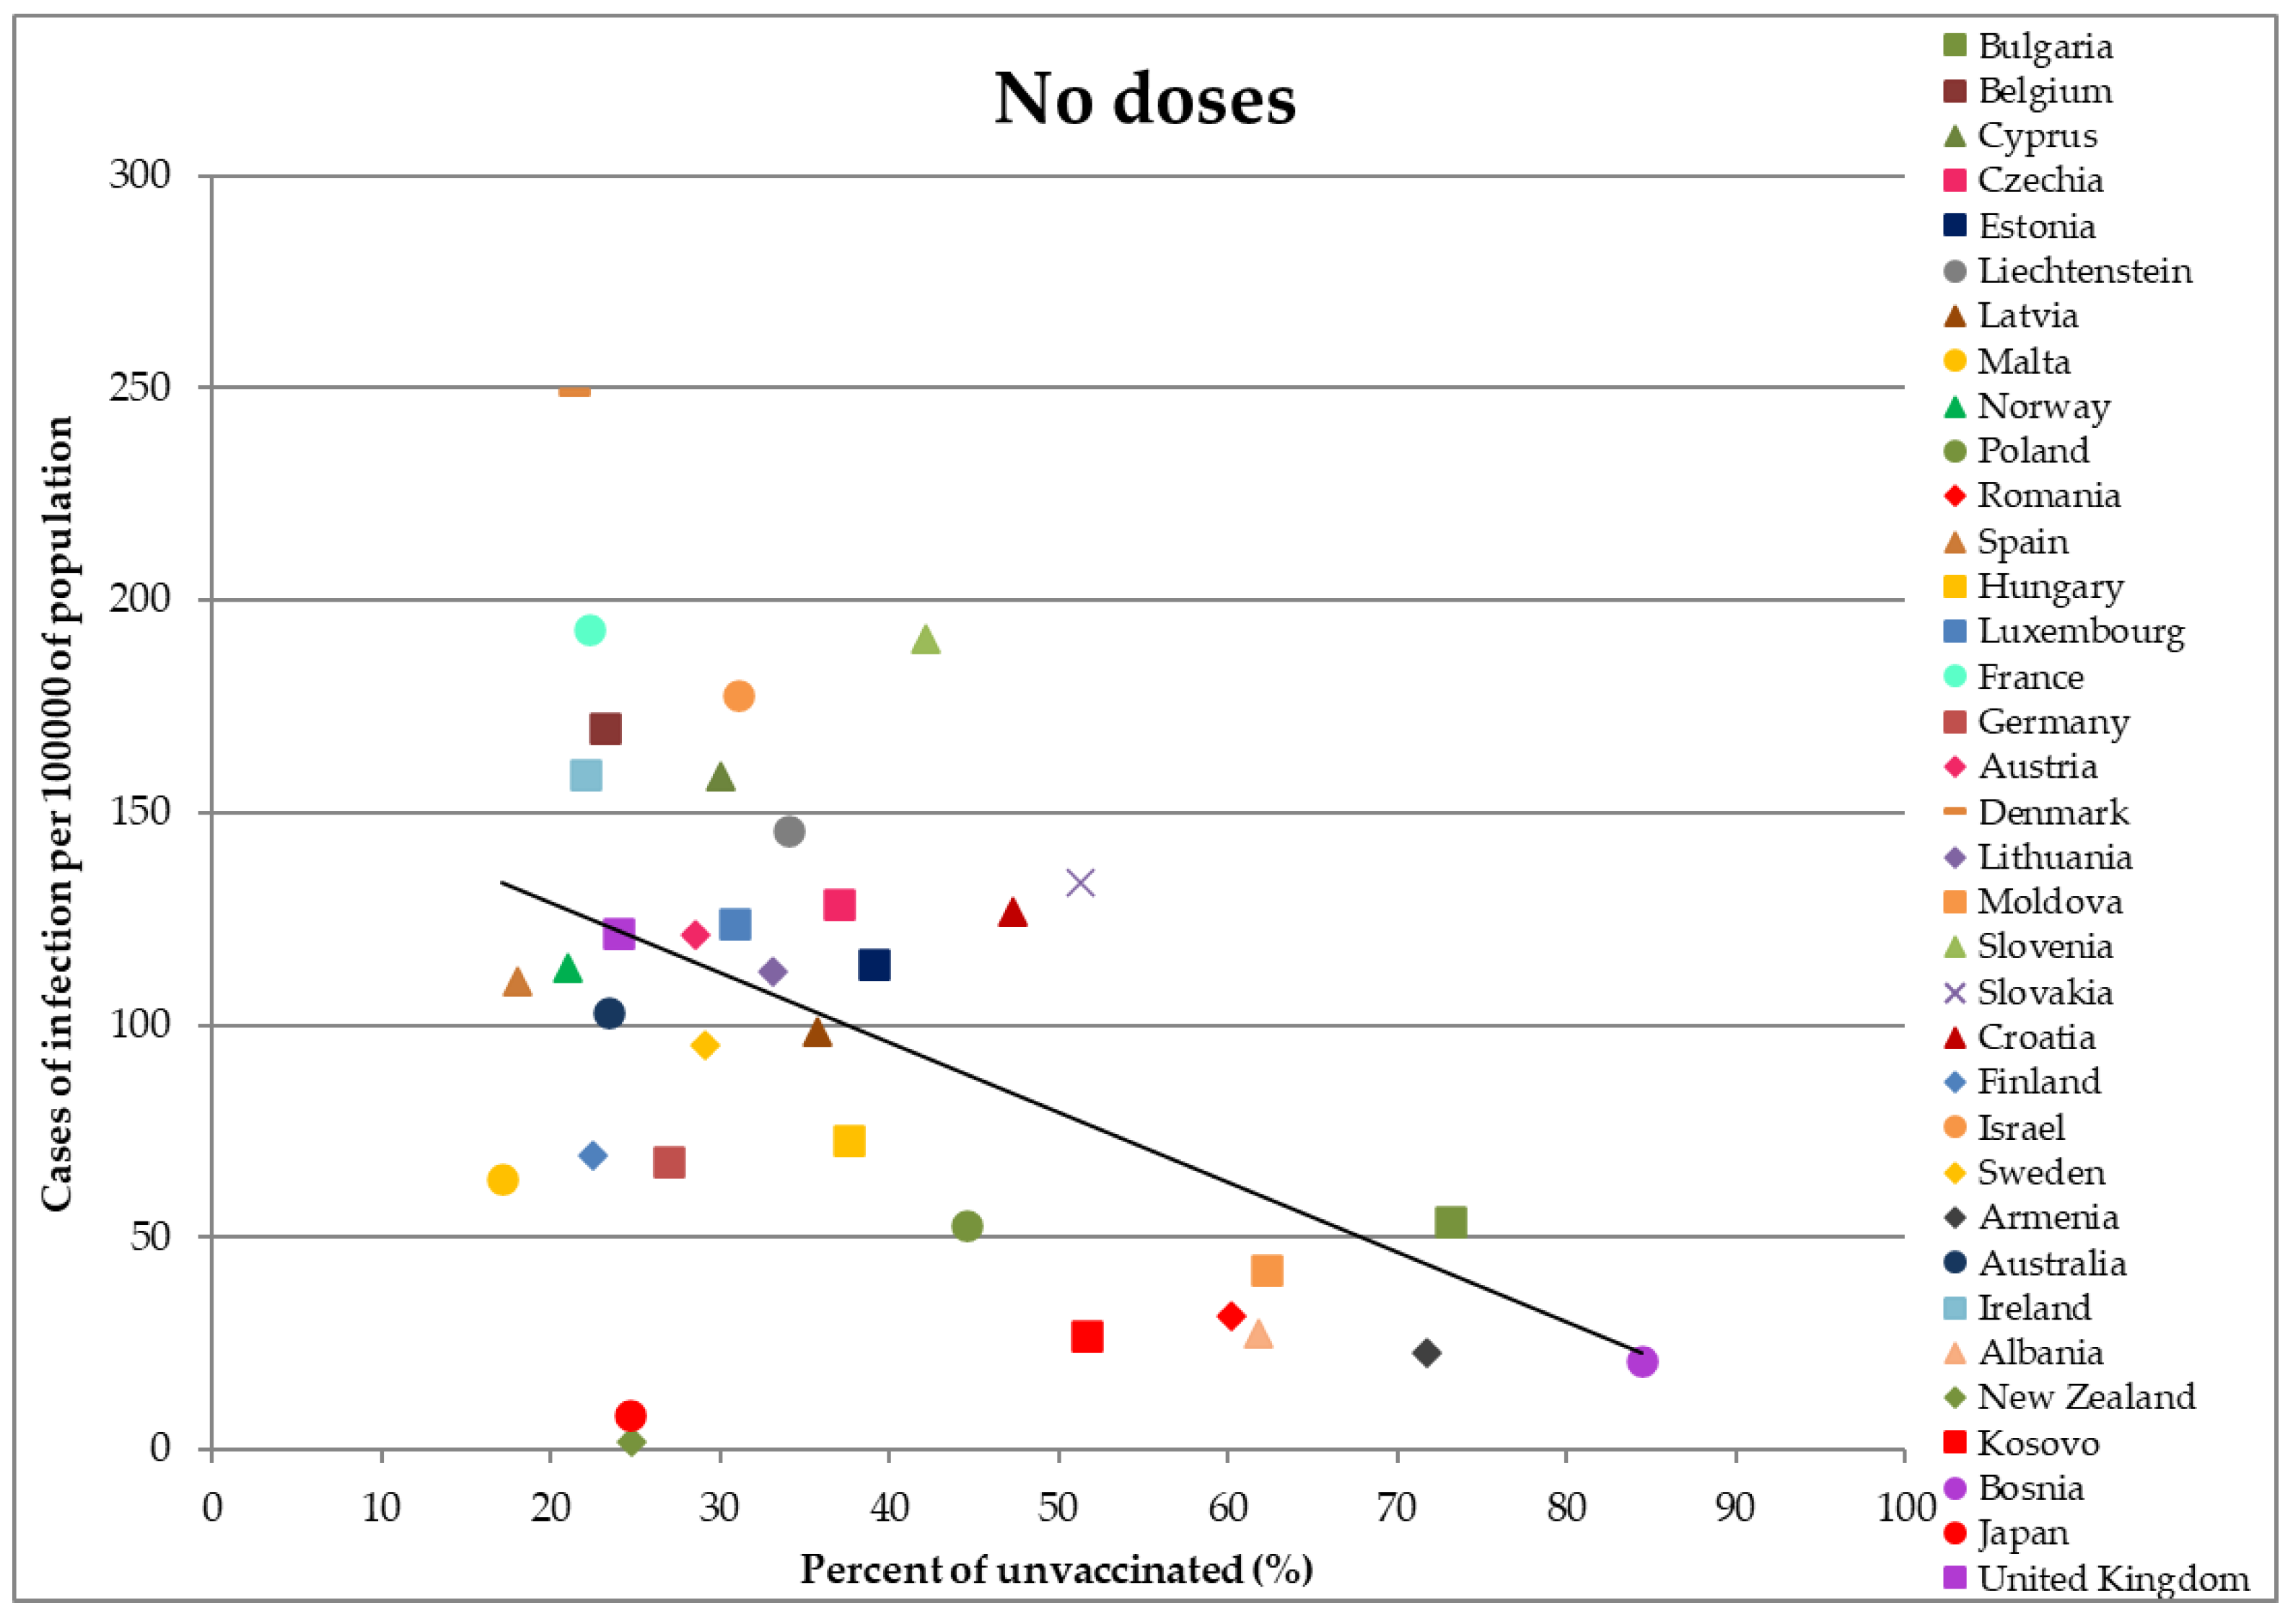
  • Not vaccinated,
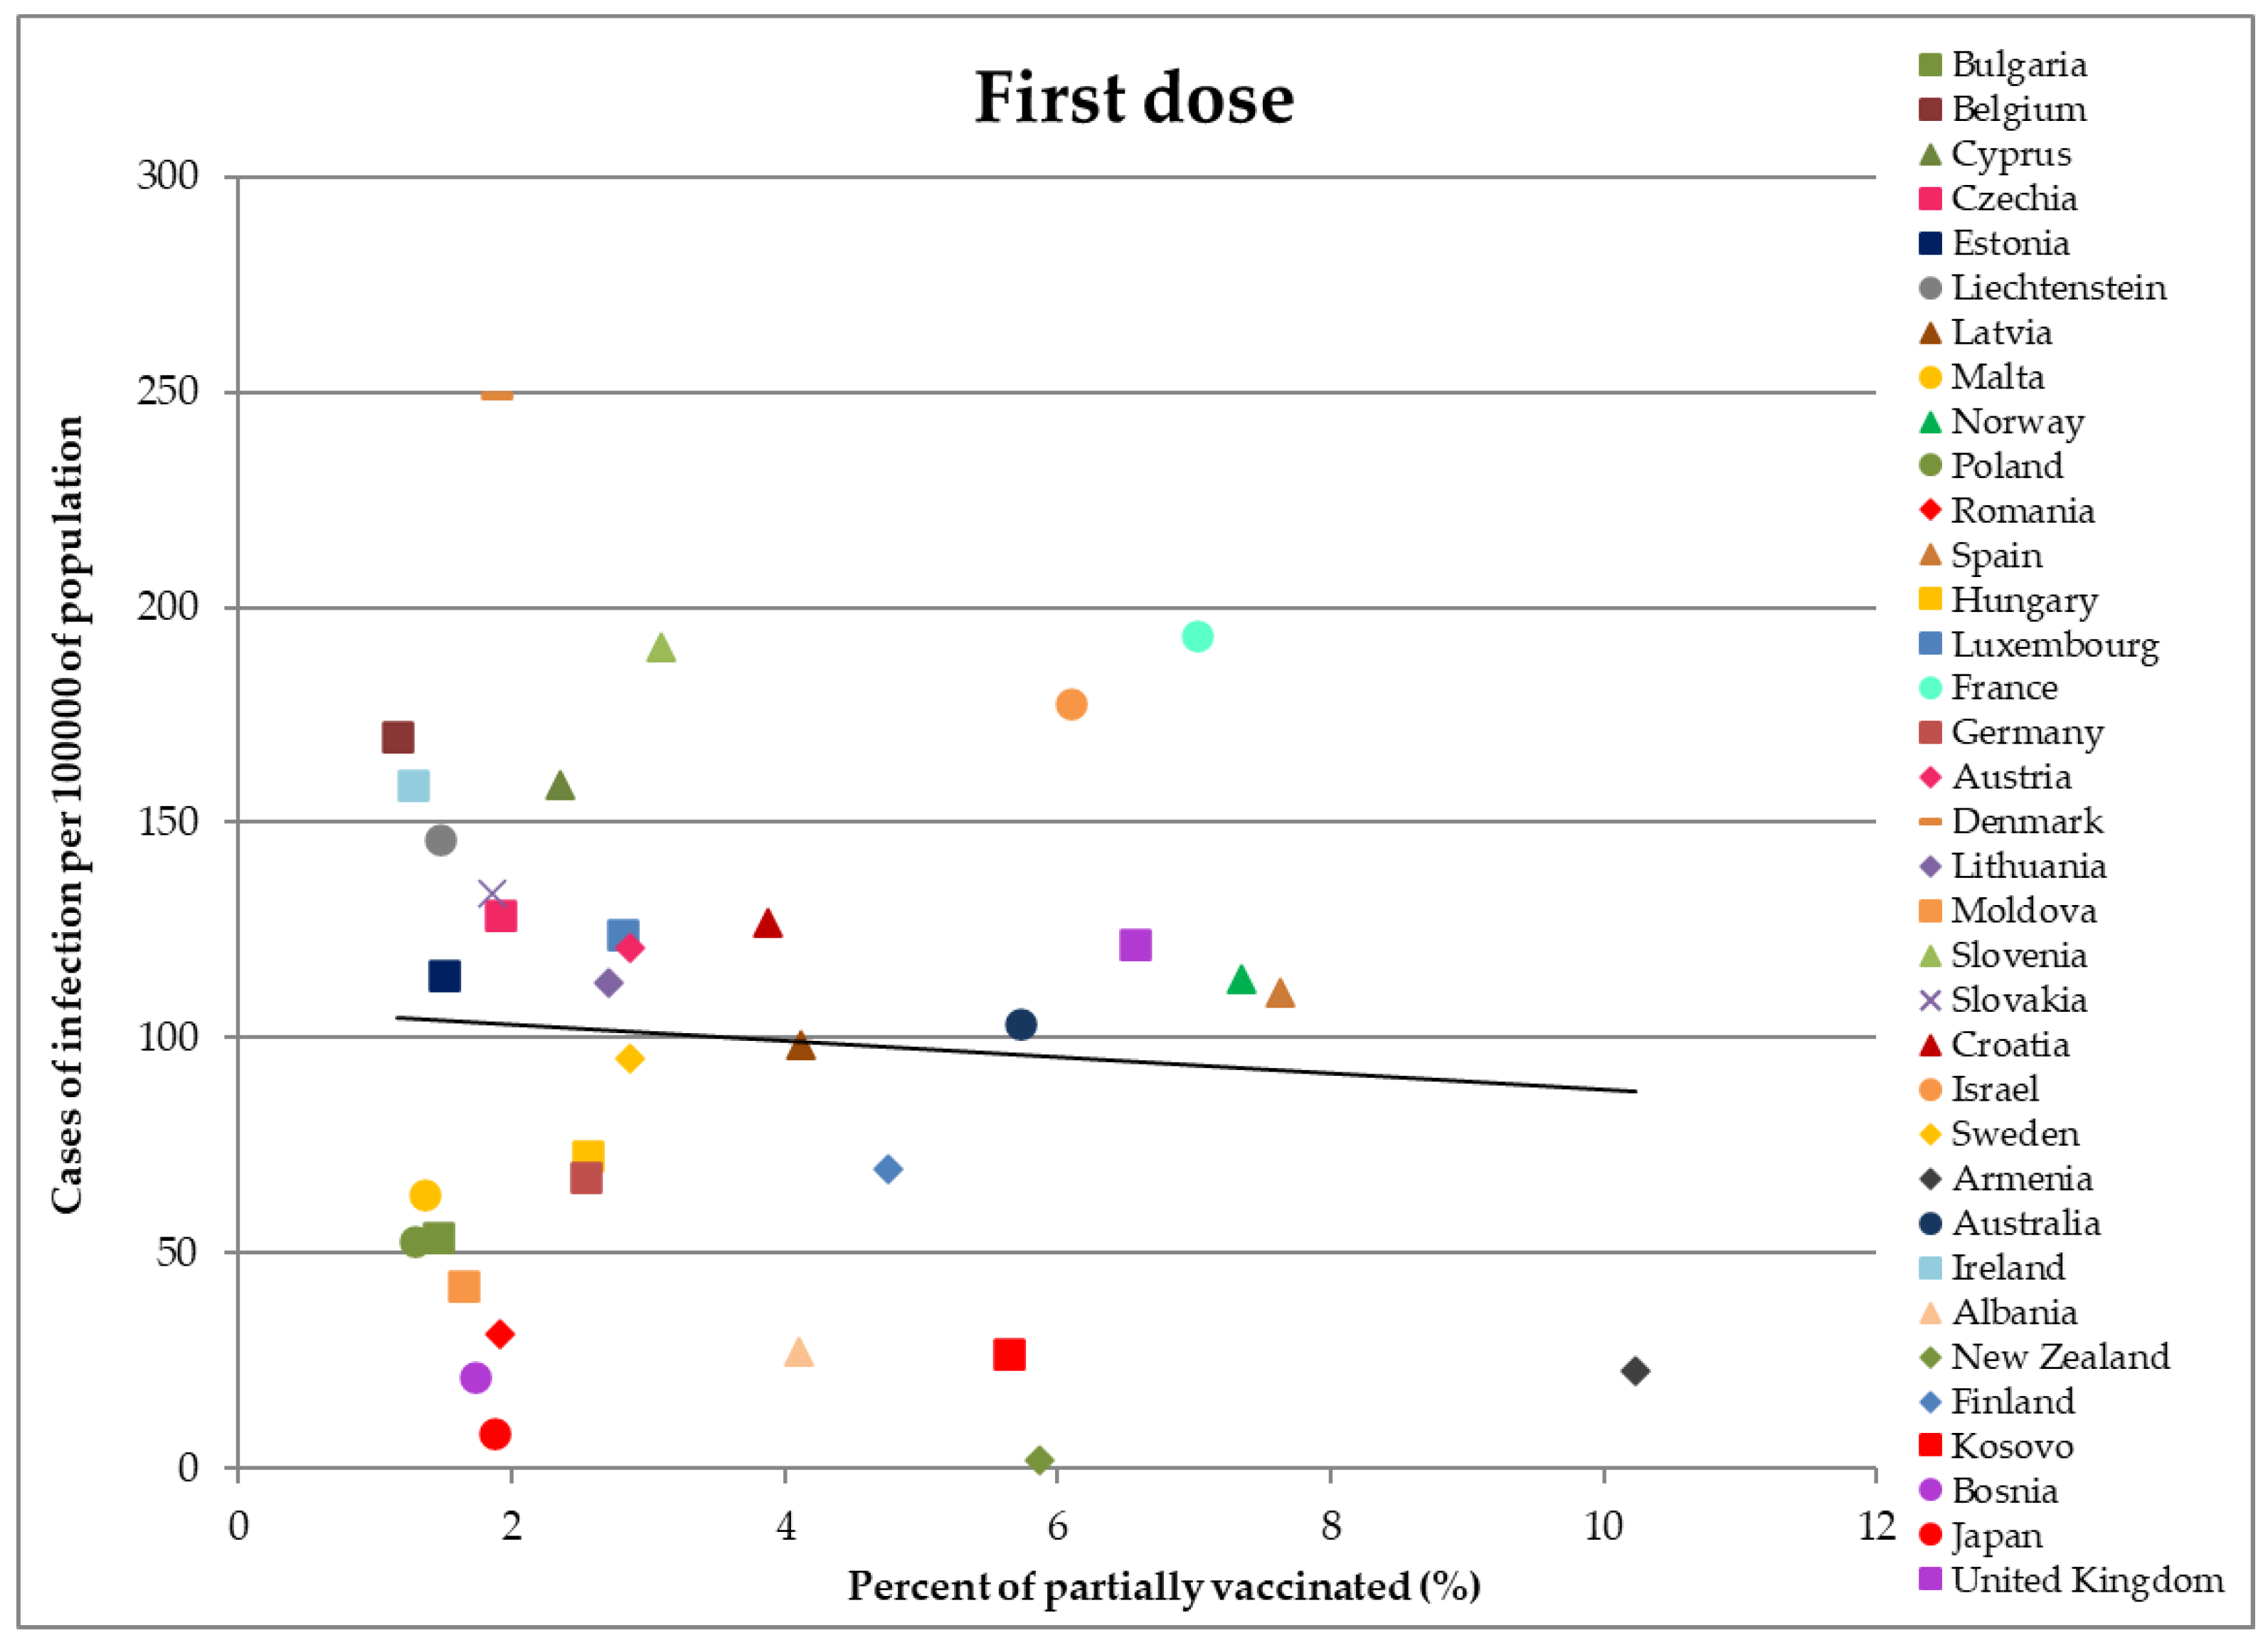
  • Vaccinated with the first dose of a two-dose vaccination program,
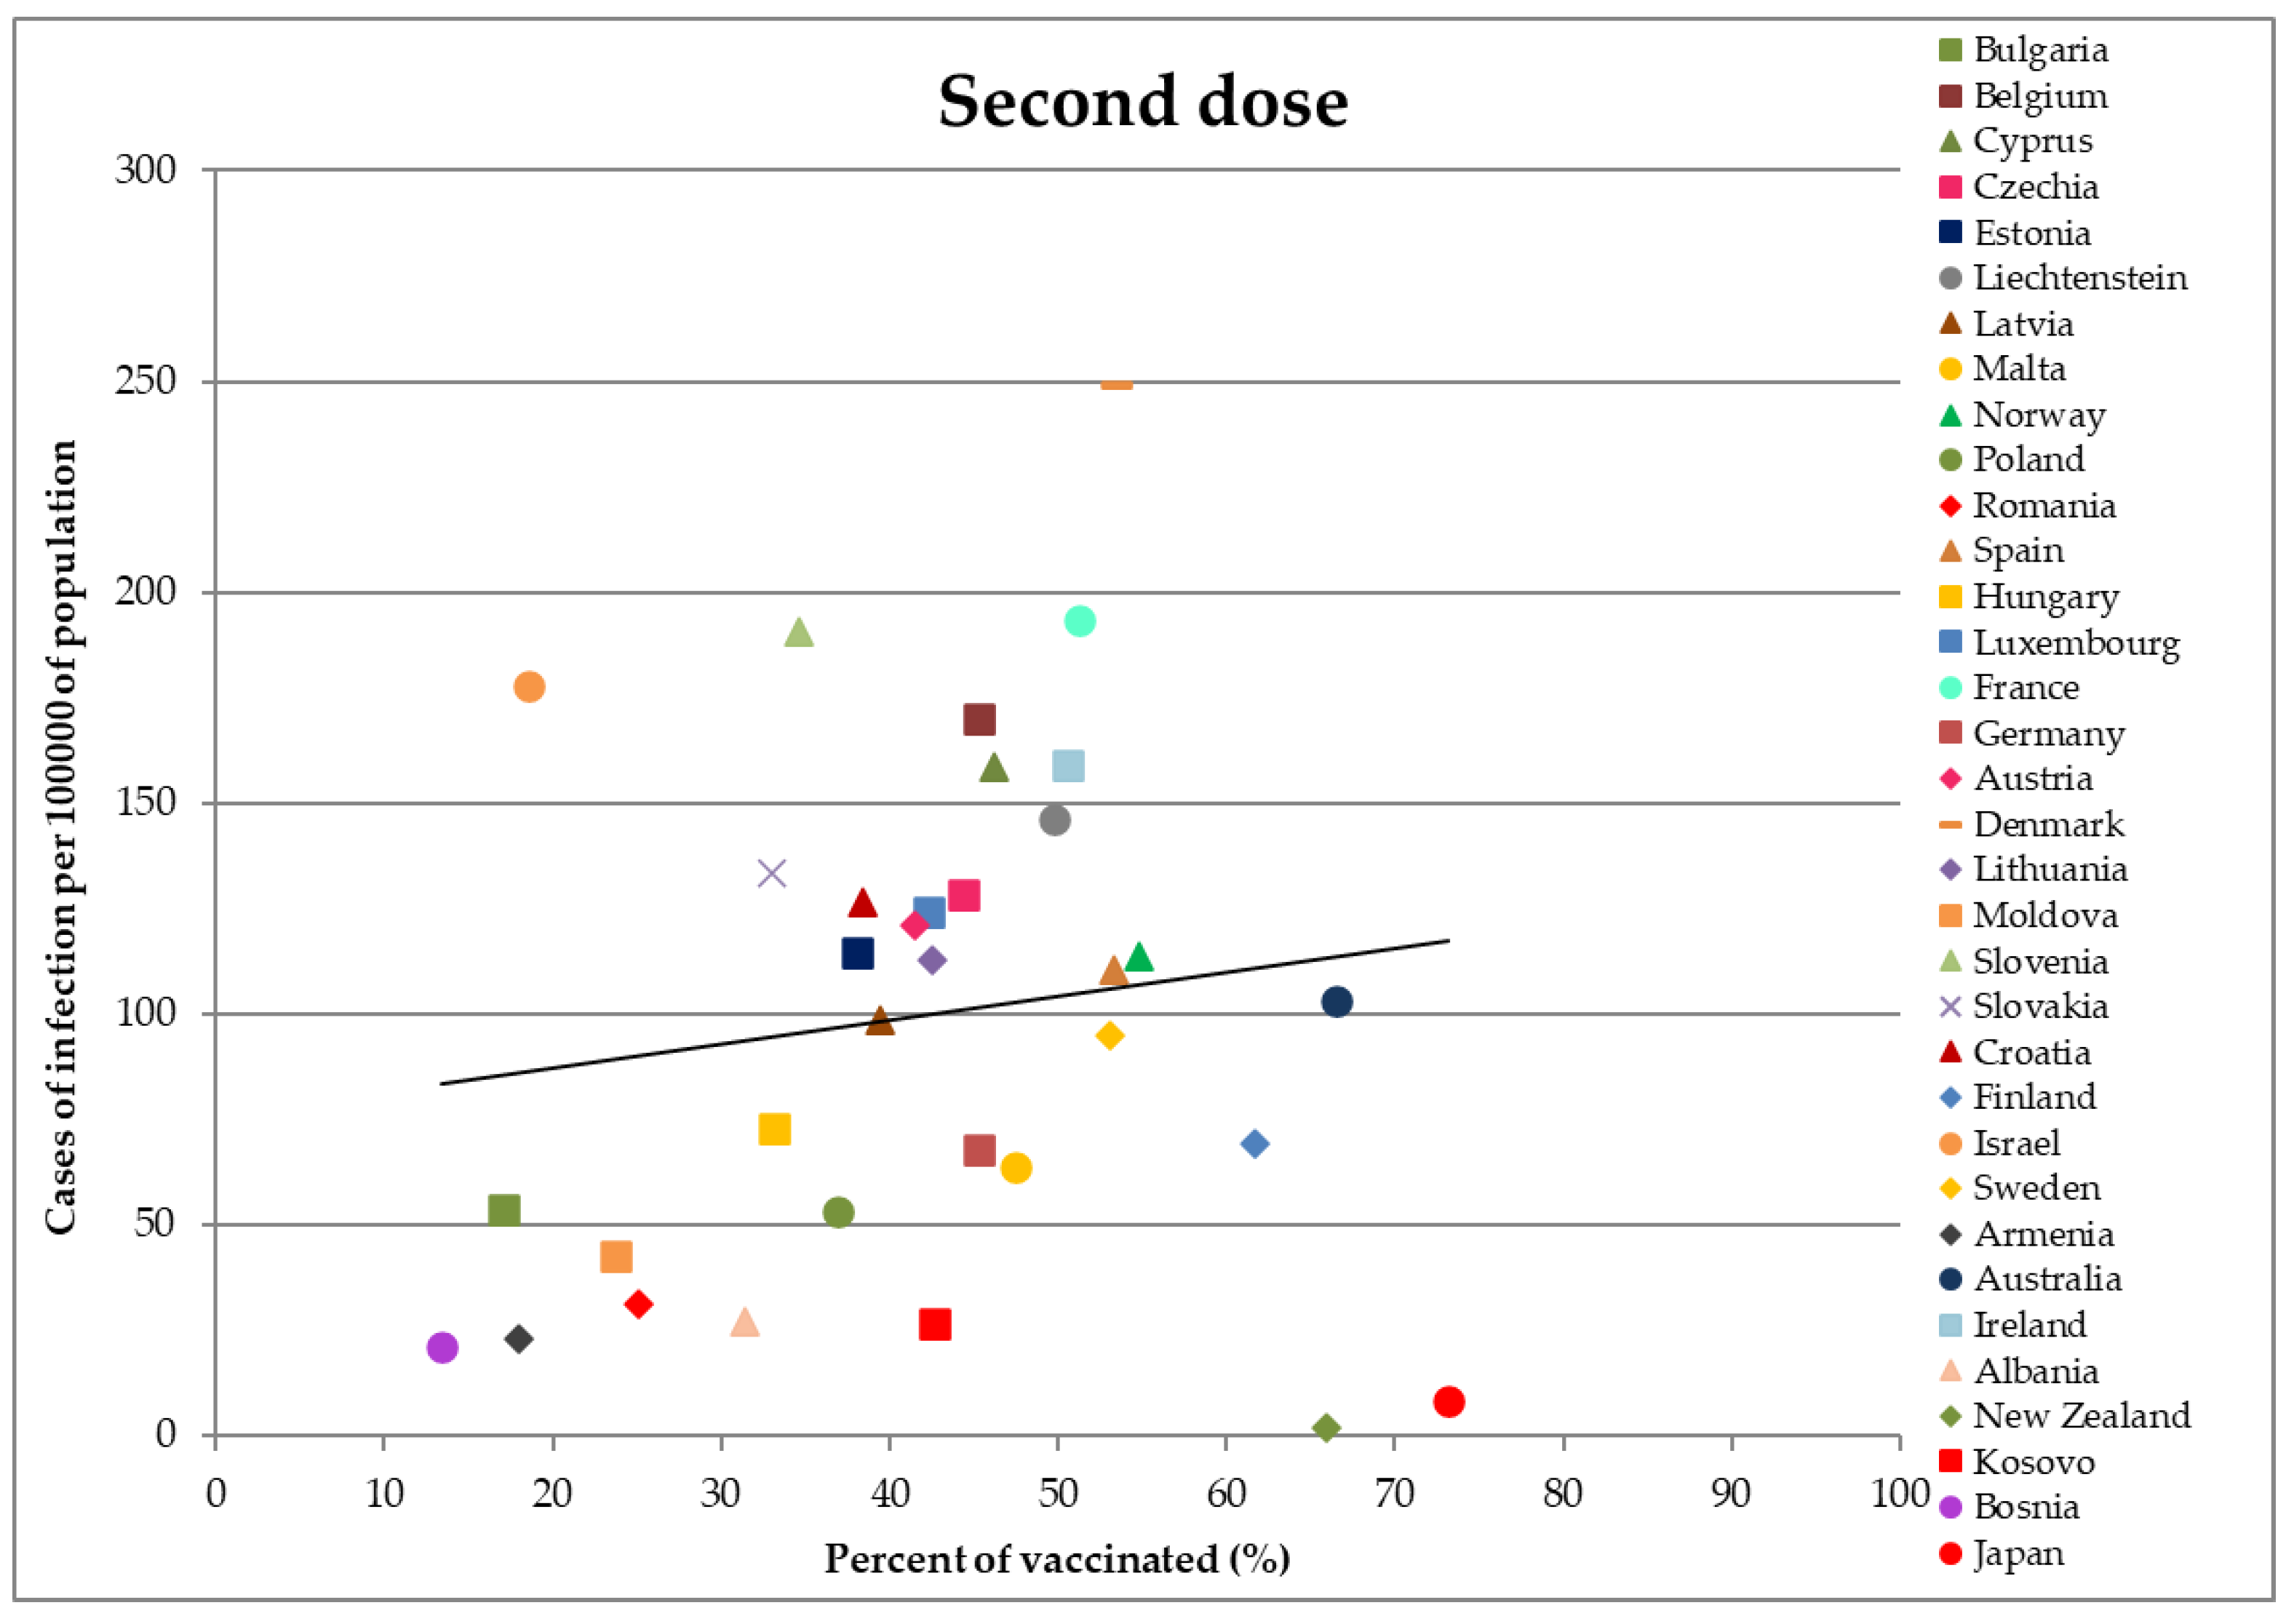
  • Vaccinated with two doses,
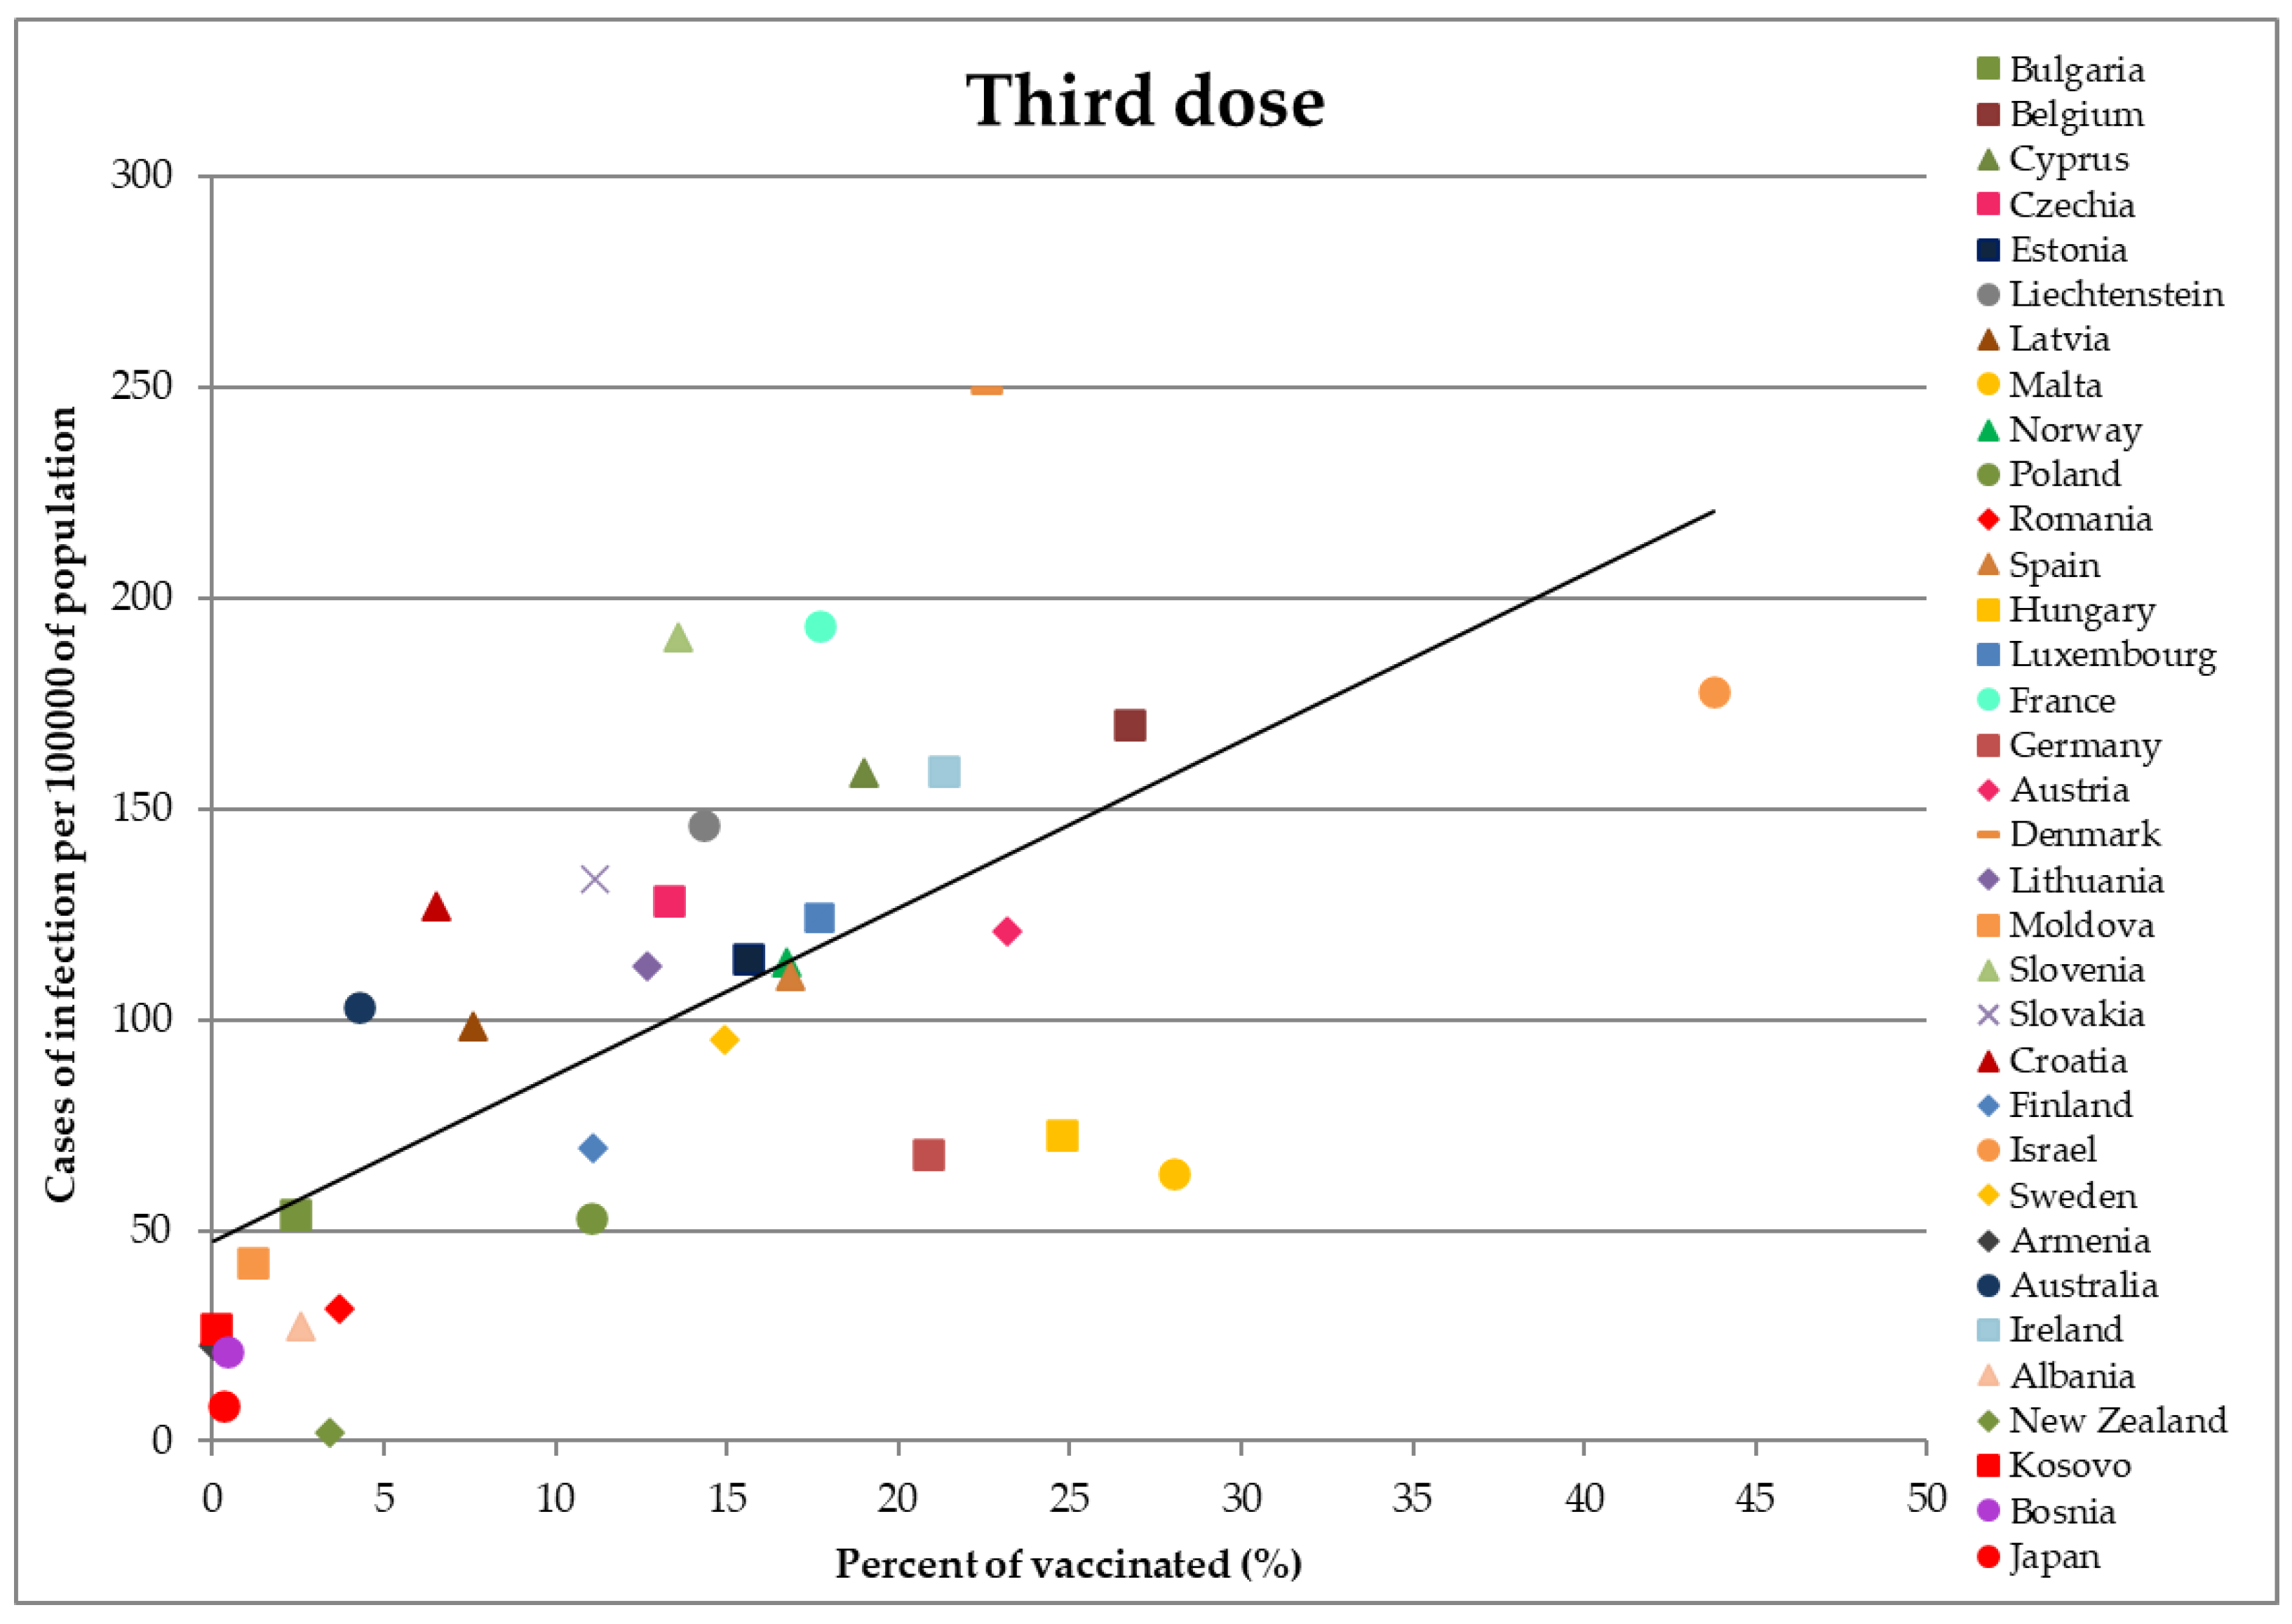
  • Vaccinated with three doses,
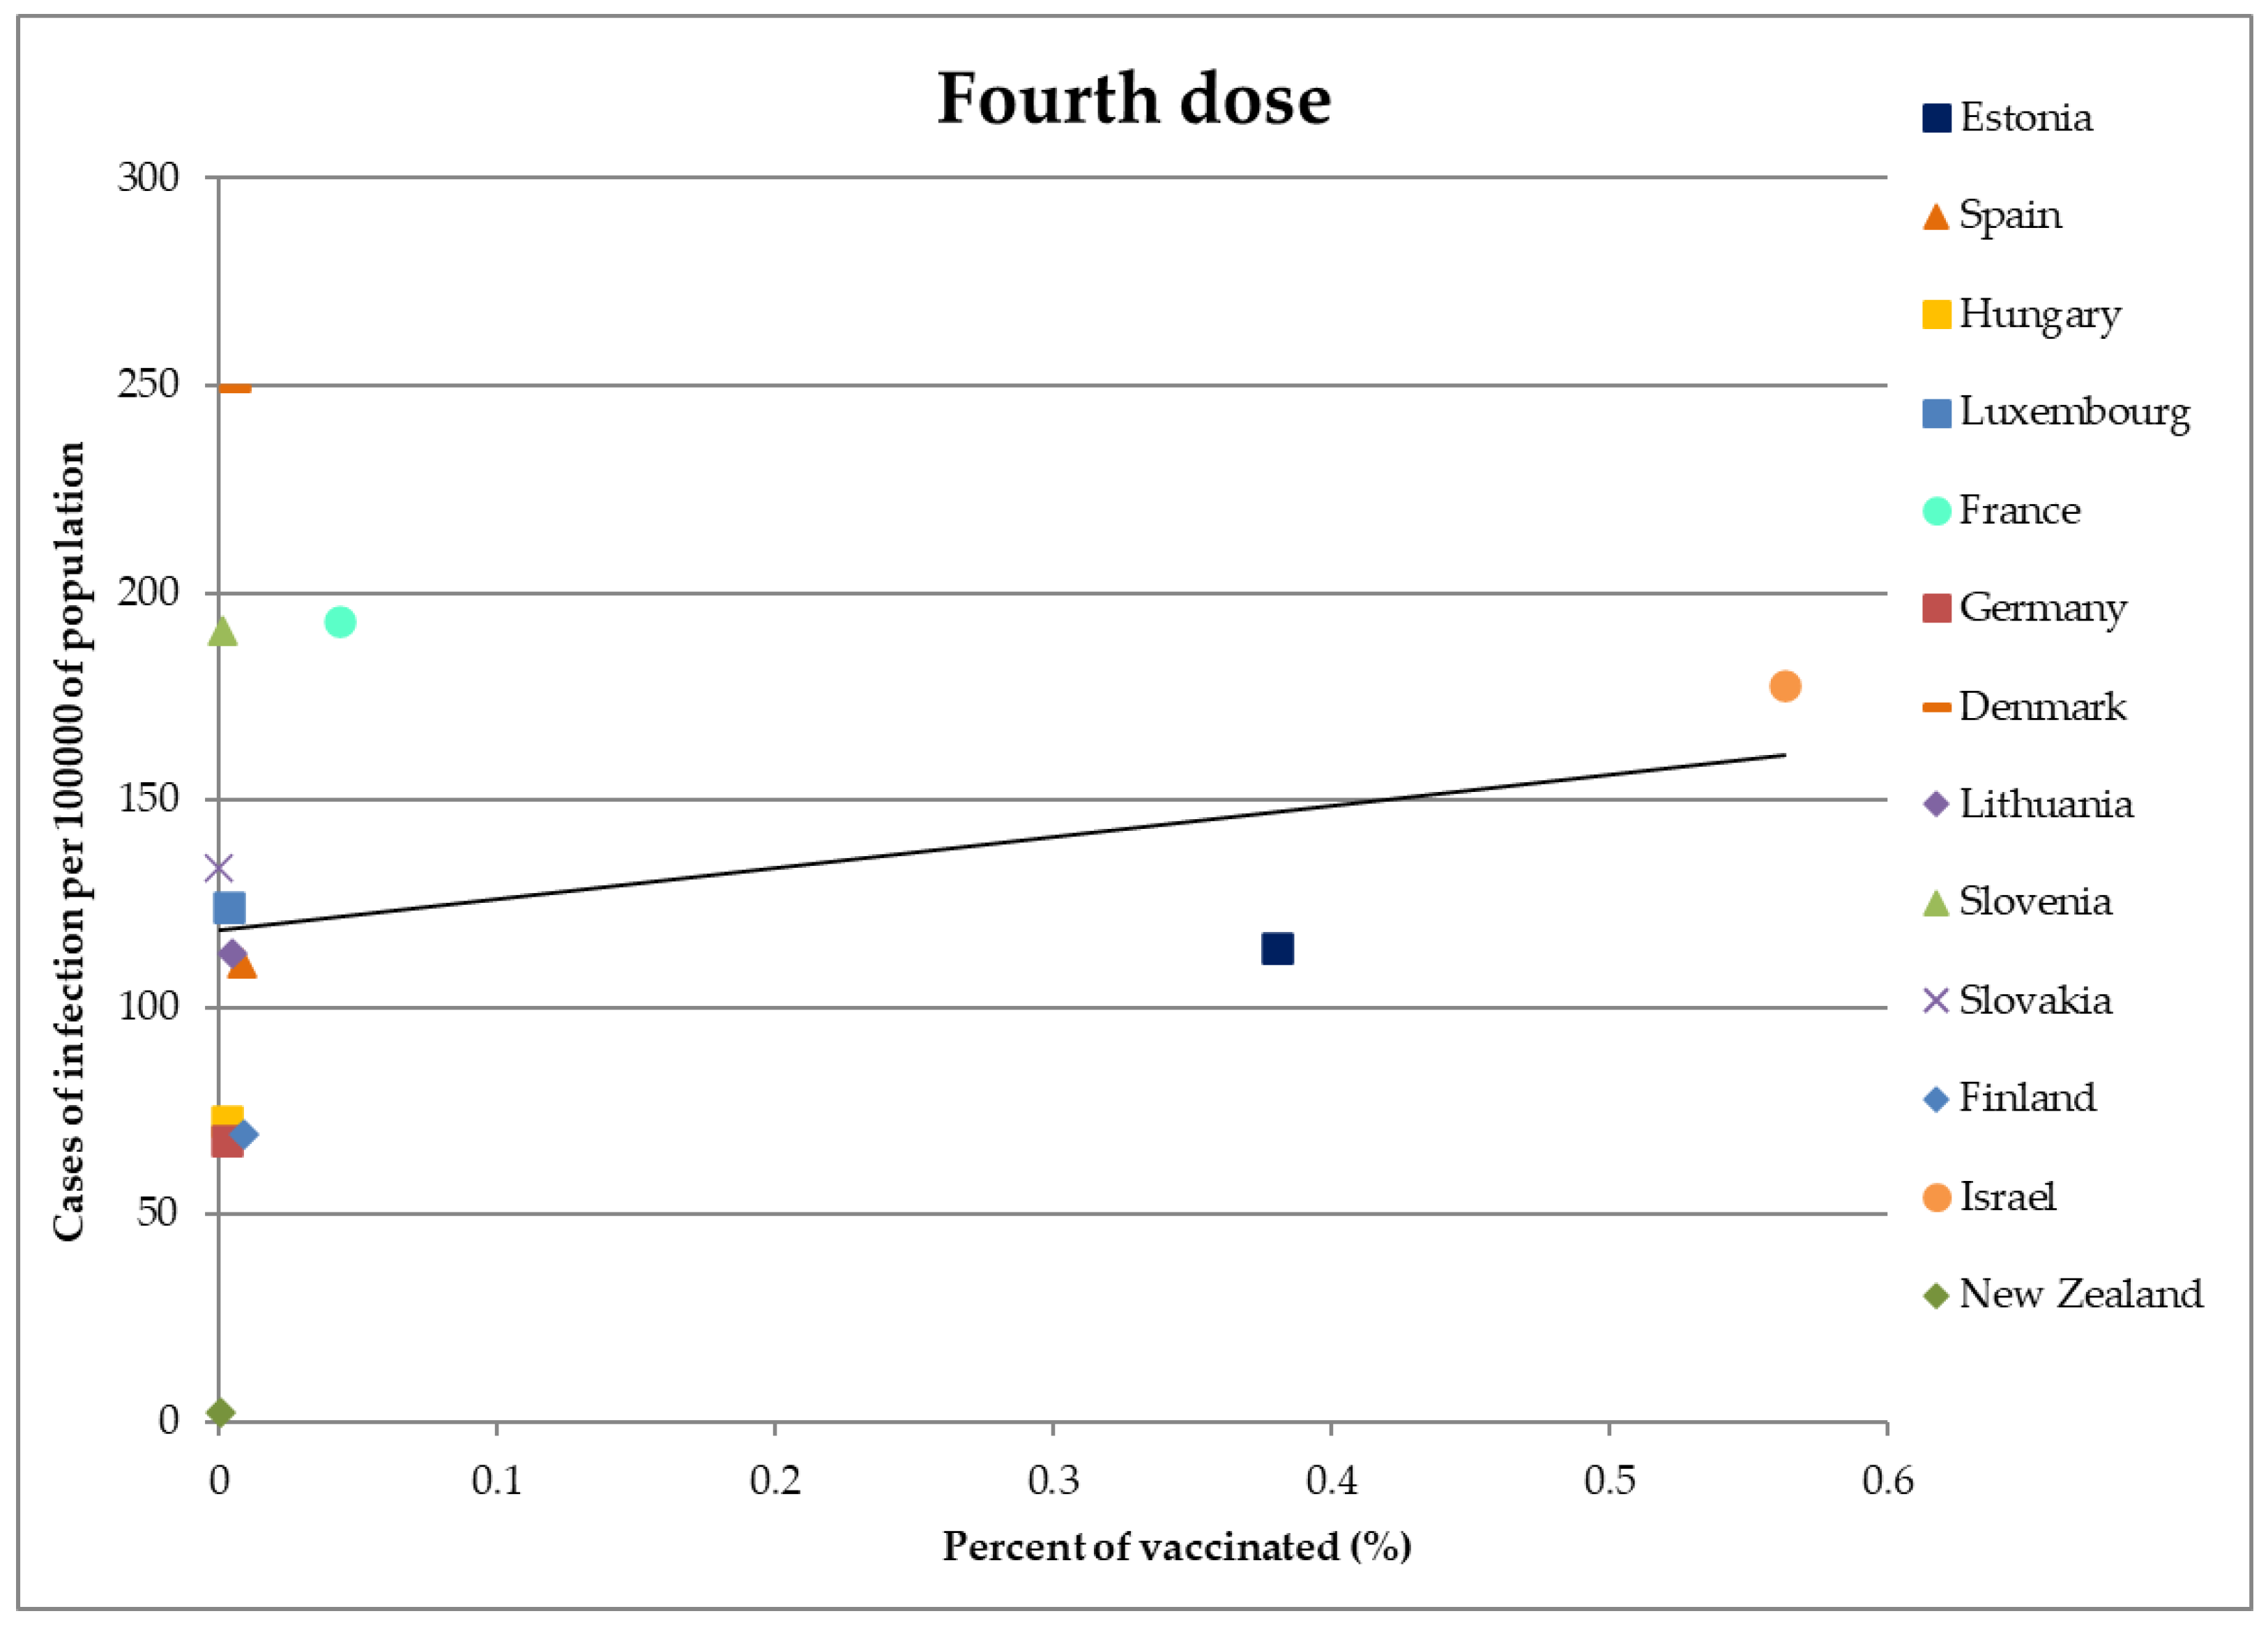
  • Vaccinated with four doses.
According to availability, daily or weekly vaccination data of these groups were derived from several ministries of health, health agencies, and groups [52,53,54,55,56,57,58,59,60,61,62,63,64,65,66,67,68,69,70,71], as well as the European Centre for Disease Prevention and Control [72], and the average number for each vaccination status was used as a percentage of the population for each country. More analytically, for the sources of vaccination, the data of 16 countries were derived from the European Centre for Disease Prevention and Control, the data of seven countries were taken from their ministries of health, the data of eleven countries were taken from other governmental agencies and institutes of public health, and the data of one country were taken from a private research group and the country’s ministry of health. The software deployed for the processing of data was Microsoft Excel 2016. Since the analysis demanded one representative percentage of each vaccination category for the whole examined trimester, both weekly and daily data were acceptable to compute the mean value of each subgroup of vaccination statuses. One main difficulty of this analysis was the collection of vaccination data. Even though some countries uploaded their vaccination data in data tables, a large number of them didn’t offer the option of manageable data files such as CSV and XML. As a result, a large amount of data was manually extracted from daily/weekly health reports of ministries of health and organized in Excel data tables for each day (out of 91 days in total) or week (out of 13 weeks in total) for each of the six vaccination categories.
It is useful to add here that we didn’t use the numbers of “fully vaccinated” and “unvaccinated”, because individuals classified as “fully vaccinated” in databases are not necessarily immune to the virus. It is a commonly accepted fact that vaccine efficacy tends to wane after some months and the “fully vaccinated” lose their immunity, but in popular databases, the number of “fully vaccinated” never decreases. It should be logical to expect the number of recorded “fully vaccinated” to decline and the number of “unvaccinated” to grow, even temporarily, until individuals are vaccinated again with a booster shot. It is possible to have a group of people that completed the full vaccination program but never proceeded to get the booster shot. This group is statistically lost, as well as the “partially vaccinated” one, in this type of vaccination recording. By using the aforementioned six groups, we aim to statistically represent as many groups of vaccination statuses as possible.
In order to suppose that the number of vaccinated are fully immunized and affected by the vaccine, recording of the vaccinations began two weeks before the recording of the cases. This is explained by the fact that a vaccinated individual is not considered fully protected immediately after vaccination, as a specific time frame must pass for the vaccine effects to take place.
The statistical method used to process the data of the analysis is quite simple. The first step was to find the number of cases per capita, meaning the total sum of daily new infections per 100,000 people in each country. This per capita number was used to objectively compare the situations in all the countries and to draw reliable conclusions. For vaccinations, the average number of each vaccination status was calculated and was expressed as a percentage (%). It is important to add here that in each category the maximum number of doses is depicted. For example, in the subgroup vaccinated with two doses the percentage of the population vaccinated only with two doses is depicted, while the group of people vaccinated with more than two doses is excluded from it. With this method, the whole population of each country is divided in absolute percentages according to their vaccination status.
Subsequently, these numbers were used to plot six scatter diagrams. Each of them depicts the percentage of each vaccination status according to the population in relation to the total cases per capita during the aforementioned period in each country. Each dot represents a country, with 35 countries in total. The United Kingdom was removed from the second, third, and fourth dose scatter plots because data related to the booster doses were unclear. Finally, it is important to note here that some countries that were gravely impacted by the virus, with elevated infection rates in relation to the examined countries, weren’t included in the study. Although it would be very interesting to examine the pandemic conditions in severely affected countries, it was impossible due to a lack of data. Table 1 clearly indicates some of the countries that could have provided interesting information for the scatter plots had they published sufficient data with clear segregations of each dose and type of vaccine. The table contains the daily infections per 100,000 people, as in the scatter plots, and the average percentage of the “fully vaccinated” for the examined period as uploaded by the Our World in Data database [50].
A trend line was added to detect possible trends in the data, and the correlation coefficient and R2 were measured in each case to further examine the statistical relation of the two variables of cases and vaccinations.

3. Results

The first and most important hypothesis was that vaccination had a positive role in stopping the spread of the virus. As several official health sources stated that fully vaccinated individuals are less likely to be infected [73,74,75], measures were taken according to these statements. If this condition was true, that would mean that in the scatter plots, countries with a smaller percentage of vaccinated people would have higher numbers of infections. Likewise, countries with higher vaccination percentages would have fewer infections than countries with low percentages and little to no announced infections at all, as sources said that high vaccination coverage would potentially eradicate the virus.
On the other hand, the scatter plots of our research depict otherwise. Initially, in Figure 2, where the percentage of people who have not received any dose of vaccine is portrayed, there is a clear decrease in cases as the percentage of unvaccinated people increases. It must be noted that at that time there were very few countries that still had large percentages of unvaccinated people and detailed records of vaccinations.
Figure 3 shows the small percentages of people who are considered “partially vaccinated”, having received one dose of vaccine from the complete two-dose schedule. From the trend line, a very small, almost imperceptible, negative slope can be observed, which indicates that cases decreased as the percentage of the partially vaccinated increased.
At a first glance, it can be concluded that the two factors examined are not particularly related to each other. In contrast, the negative slope is more prominent in Figure 4, which plots the percentages of people who have received a dose of the single-dose vaccine. It is the only graph to indicate that vaccines had a positive impact on lowering the cases of infection, since the trend line demonstrates that as the percentage of people vaccinated with the single-dose vaccine increased, the number of cases decreased. However, the majority of the countries have not used this type of vaccination at all, and the percentages in those that have used it are too small (<14%) to draw a reliable conclusion.
Continuing with Figure 5, which shows the percentages of people who have received both doses of the vaccination schedule but did not proceed to the third dose, a slight upward trend is observed. One could deduce that this result is justified since the immunity of the double dose has started to wane, especially for those vaccinated six months before.
However, an interesting interpretation of the diagram can be achieved synergistically with Figure 2 and Figure 6. If it is assumed that those remaining vaccinated only with the second dose are no longer considered immune and have lost the protection of the vaccine, this means that they should exhibit the same characteristics as the unvaccinated in Figure 2. On the contrary the exact opposite situation is observed, as those vaccinated with two doses imitate the results of those vaccinated with three doses in Figure 6. Comparing Figure 5 with the results of the next diagram (Figure 6), it is clearly visible that there is a significantly stronger positive relationship as the doses increase. There is a strong and distinct positive trend in Figure 6, while a decrease in cases was expected in contrast to Figure 5. Therefore, although the double vaccinated individuals cannot be considered as unvaccinated, since they would present similar characteristics to Figure 2, they cannot be considered fully vaccinated, since they do not have the strong positive slope of Figure 6. In addition, the double vaccinated people are in an unclear situation similar to the partially vaccinated, with the only difference being that in Figure 3 the cases have a small tendency to decrease, while in Figure 5 they increase.
Finally, the last diagram in Figure 7 presents the percentages of the fourth dose in relation to the cases of that time, but important information cannot be extracted since the percentages of individuals who were vaccinated with the fourth dose at that time were close to zero.
Table 1 presents a number of notable examples of countries which were excluded from the analysis due to a lack of data and which would otherwise have provided valuable information. More specifically, several countries (such as Italy, Greece, Portugal, Iceland, and the Netherlands) which were severely impacted by the virus and could have provided interesting and valuable perspectives for our analysis unfortunately lacked available vaccination data specifically divided according to doses and brands. As stated earlier, the term “fully vaccinated” is insufficient to provide concrete evidence, but there seems to be an underlying trend where countries with higher percentages of “fully vaccinated” individuals also have higher number of cases per 100,000 people, as shown in Table 1.
In Table 2, the correlation coefficients and R-squared numbers of the six scatter plots are summarized. There is a moderate negative correlation for the unvaccinated group. The correlation coefficients are positive and tend to get higher with each dose, while in the partially vaccinated category (“First dose”), vaccination seems unrelated to the number of infections.

4. Discussion

4.1. Discussion of the Results and Interpretation

As the subject of COVID-19 transmission is quite complicated, it is impossible to deduce with certainty whether vaccination had a positive or a negative impact on this matter. However, by taking some publications of the scientific literature into consideration, including our own research, there are various indications that vaccination could not inhibit the spread of the virus.
Figure 5 and Figure 6 provide interesting information concerning the vaccinated. An intriguing example is that of Denmark, which presents the extreme scenario of having the highest rate of infections while also having relatively high rates of vaccination. Denmark was the first country to end COVID-19 restrictions due to high vaccination rates (80%+) [76], only to later enforce strict measures for the unvaccinated because of too many infections [77], as shown in our scatter plots for that time period (see Figure 2, Figure 3, Figure 4, Figure 5, Figure 6 and Figure 7).The unvaccinated individuals were less than the 20% of the Danish population, or even lower if we exclude the partially vaccinated party. Out of this group, it is reasonable for a portion of the unvaccinated to already have natural immunity from a previous COVID-19 infection and thus to be unable to transmit the virus for a considerable amount of time. Taking this fact into consideration, it is logical to assume that the percentage of the unvaccinated that was able to transmit was even lower. This observation could only mean that it is highly unlikely that the unvaccinated were solely responsible for the surge of cases, as the requirement of frequent testing only for the unvaccinated people rendered the scenario of them spreading the virus alone even more impossible. Since the vaccinated with unknown and potentially dangerous health statuses could enter public venues and workplaces freely, the continuation of the pandemic in Denmark under these conditions proves that the strategy of segregation was inefficient and dangerous.
Similar examples resembling the case of Denmark include France, Belgium, Israel, and Ireland.
As shown in Figure 6, even though Israel has the highest rate of vaccination with the third dose and the unvaccinated percent is smaller than 35% of the population (Figure 2), it has one of the highest rates of cases out of all the countries examined.
In France strict measures related to the COVID-19 pass were taken in order to restrain the virus. By August 2021 the health pass was mandatory for citizens to access public venues and many other settings [78], and by September 2021 health care workers were obligated to get vaccinated to avoid losing their jobs [79]. However, for the trimester of November 2021–January 2022 examined in Figure 2, Figure 3, Figure 4, Figure 5, Figure 6 and Figure 7, France had the second highest rate of infections and less than 25% of population was unvaccinated (Figure 2).
In Table 2, it is confirmed that, statistically, vaccination seems unrelated to the number of cases. More specifically, the only number that supports the theory that vaccination lowered the number of infections is the correlation coefficient of the single dose (−0.519) which implies a moderate negative correlation. However, the rates of vaccination with the single dose vaccination program are too low to draw a reliable conclusion. A negative moderate correlation is also observed in the category of the unvaccinated (−0.479), which is in agreement with the strong positive correlation (+0.652) in the category of those vaccinated with three doses. The group of the “partially vaccinated” (First dose) has a correlation coefficient close to zero and is thus considered completely unrelated to the number of infections.
Uniting all the results, one should recognize the possibility that vaccination alone wasn’t enough to inhibit the spread of the virus. Based on this assumption, several measures and restrictions imposed during the pandemic were implemented in vain.
First and foremost, the strategy of removing unvaccinated workers from their workplace amidst a severe worldwide economic crisis was an injustice that further aggravated the problem of unemployment and left this minority struggling financially and socially. A distinct example is that of unvaccinated healthcare workers who were not allowed to work for a long period of time, a fact that could easily lead to their financial destruction, as Mavridis et al. debated in their study [44]. It is also important to add here that their removal in a time of a health crisis when every worker’s contribution was crucial created understaffing in healthcare units. Inevitably, this lack of staff might have been responsible for the degradation of healthcare quality, a condition that leads to more medical complications and deaths for patients and thus more financial stress to national healthcare systems. A famous study of Lytras and Tsiodras [80] that sparked controversy in Greece revealed that one source of elevated COVID-19 mortality rates in Greece was regional disparities that were caused by the chronic understaffing of hospitals (especially outside of metropolitan areas) that couldn’t be covered successfully during the pandemic. Low-quality healthcare can lead to complications, longer hospital stays, the need for intensive care, and eventually death. All of these consequences negatively affect the financial situations of national healthcare systems, as they need more resources to combat the pandemic conditions. Unvaccinated workers, especially those in the healthcare sector, were stigmatized as irresponsible, even though vaccination was not a matter of social responsibility after all, but rather a personal protective measure. Moreover, the financial burden of frequent testing may have not been felt equally among workers of various incomes, since workers with low income find it more challenging to afford testing, a condition that can deteriorate existing socioeconomic inequalities. Acts such as these go against the main principles of sustainability, which aim to establish equity and social cohesion regarding prevailing and future working and living conditions.
Another crucial matter to discuss is the failure to protect workers from a risk that would have been otherwise easy to prevent. Since both parties could potentially transmit the virus, regardless of vaccination status, it should have been fair and wise to oblige all individuals to frequent testing in order to avoid further transmission in the workplace. Naturally, individuals that recovered from the virus and obtained natural immunity would be excluded from this obligation. From the aspect of occupational health, ensuring workers are healthy before they enter the workplace is a strategy that could minimize the possibilities of COVID-19 spreading to the work environment. However, since the vaccinated were able to transmit, their non-obligation to test and their false sense of security might have caused a hazardous situation [38]. This could potentially mean that the unvaccinated were not to blame for the surge of cases, since they were a minority and all of them were required to test before they entered their workplace and other public places. Instead of forcing the unvaccinated to test regularly each week at their own expense as a punitive act, a good idea would have been for governments or businesses to actually find a way to cover the cost of frequent testing for both parties. Cost-wise, that investment in testing along with other protective measures such as remote working, social distancing, and frequent disinfection in the workplace might have been less damaging than the loss of productivity and the costs of recurring sick leaves (and deaths) due to COVID-19. Faulty strategies that were implemented during the pandemic should be examined in order to be better prepared for a possible future situation. This perspicacious behavior lies at the core of all the pillars of sustainability and supports the aim of preparing and taking all the necessary actions to ensure a safe and viable future.

4.2. Limitations

This study is subject to some limitations, as follows:
(i) The first and most important limitation is that the rate of positivity in relation to the daily number of tests should not be overlooked. In our scatter plots, we use the daily new infections announced per 100,000 people in each country, but not the positive tests from the total tests being performed. This has been done for two reasons: accurate testing data with no gaps are extremely difficult to find for a satisfactorily large sample of countries, and numbers of tests don’t represent the whole population, as a person can test and state the results almost every day. For this reason, the image of cases for each country may not accurately represent reality, although it is expected to be approximately close.
(ii) Secondly, the transmission of the virus may be affected by several different factors which are not mentioned in our study. Those factors could include age, gender, various medical conditions, density of population, climatic conditions, and isolation measures and restrictions followed in each country. In the scientific literature there are numerous studies that examine the relations between those factors and different stages of the virus (transmission, morbidity, mortality). Transmission of SARS-CoV-19 is a complex matter that cannot be attributed solely to a single factor.
(iii) The fact that some states that were severely impacted by the virus with relatively higher rates of cases are missing from the analysis (for example, Italy, the Netherlands, Portugal, and Greece) is another limitation of the study.
(iv) A phenomenon that this study has not sufficiently investigated is the regional difference in the spread of the pandemic in various countries. For instance, in Italy, the first pandemic wave mainly affected the north, while there were no cases in the south. The difference between various parts of the country remained notable throughout the pandemic period. The north, with traditionally more efficient health services, has always had more vaccinated people, but also more sick people than the south.
(v) The spread of the virus has acted as a push for vaccination. This article studied the effect of vaccinations on the spread of cases. However, the opposite point of view cannot be excluded, i.e., the number of cases can favor the number of vaccinations.
(vi) To be fully effective, different vaccines may need more than the time frame of 14 days we used, although the general guideline seems to be a two-week period. That could possibly mean that, depending on the type of vaccine and each person’s unique immunological response, the number of the fully immune from the vaccinated group in our research may be slightly overestimated or underestimated.
(vii) Correlation does not mean causation, and thus we cannot be certain and draw absolute conclusions. The scatter plots of this study require careful interpretation.

4.3. Future Research Directions

(i) Possible future research of great value would be a large-scale statistical analysis of infections categorized by vaccination status. Data can include the total tests performed on vaccinated and unvaccinated individuals and the positivity rate of each category. Certainly, such analysis can only be conducted under the assumption that the required data will be published or available to researchers in the near future. Some countries with this type of open data are the United Kingdom, the Czech Republic, Israel, and Switzerland, with the latter having many data gaps for tests with unknown vaccination status. An examination based on testing data can surpass the limitations of our study and provide concrete evidence and undeniable conclusions.
(ii) The time frame of our research (the forty-fourth week of 2021 to the fourth week of 2022) was a turning point between the Delta variant and the gradual prevalence of the Omicron variant, meaning another interesting development could be the examination and the comparison of data from different variants of the virus. The investigation of the responses of the different variants to each vaccine and dose could be a complex process, but it could potentially show whether the ability of the virus to be transmitted was reduced by different vaccination statuses and segregation policies over time.
(iii) Different workplaces may have distinct characteristics that could influence the impact of vaccination policies, and thus, taking this issue into account, future work could benefit from an exploration of the variability in workplace environments within the sustainable engineering systems sector.

5. Conclusions

Eight important conclusions can be drawn from our research:
  • Indications that vaccination could not stop vaccinated individuals from transmitting the virus should not be disregarded.
  • It was crucial to control the pandemic through workplaces, since humans spend almost half of their waking day working and they have a greater chance of getting infected in the workplace.
  • Ignoring the possibility of both parties (vaccinated and non-vaccinated employees) transmitting the virus to the work environment, segregation measures and restrictions taken to divide workers by their vaccination status were unjust and inefficient.
  • From the OSH point of view, such behavior posed a threat and a workplace risk, as vaccinated workers were not obligated to be tested and they entered the workplace with an unknown and possibly dangerous health condition.
  • The absolute privilege of vaccinated employees to enter their workplaces without mandatory COVID-19 testing intensified the virus transmission, escalated occupational risk, downgraded the safety level at the worksites of sustainable engineering systems, and amplified the OSH risk management difficulties.
  • Failure to establish efficient OSH policies to protect workers from the virus endangered their health and well-being, their financial status, and their social life.
  • The financial charge of compulsory unemployment and repeated COVID-19 testing was not justified and economically viable for unvaccinated people in the midst of a worldwide economic crisis.
  • Τhe topic is very complex and it is necessary to be very cautious in interpreting the observations made from the graphs.
As a general conclusion, lessons should be learned from past mistakes with a mentality of sustainability to focus on possible future conditions similar to the pandemic and the right policies needed to control such crises. Thus, the mistakes in the crisis management during the last pandemic (e.g., people discrimination in different categories, like vaccinated and non-vaccinated, partial application of measures in association with this discrimination, like partial virus testing, partial imposing of financial fines, etc.) must not be repeated. Being proactive and careful to ensure a better future and more viable and efficient solutions to possible occurring problems is always in favor of the philosophy of sustainability.

Author Contributions

Conceptualization, methodology, validation, formal analysis, investigation, data curation, writing—original draft preparation, writing—review and editing, visualization, supervision by S.F.T. and P.K.M. All authors have read and agreed to the published version of the manuscript.

Funding

This research received funding from the program with title “Systems’ & Work Safety: Risk Analysis & Assessment—Probabilistic Approaches & Modeling” (ETAA/TSMEDE program, grant number KE82999, Scientific Responsible: P.K. Marhavilas) through the Special Account for Research Funds (SARF) of the Democritus University of Thrace (DUTh), Greece.

Institutional Review Board Statement

Not applicable.

Informed Consent Statement

Not applicable.

Data Availability Statement

The data are available in a publicly accessible repository. In other words, the data presented in this study are openly available, and they can be found at the sites referred to the section of “References”.

Conflicts of Interest

The authors declare no conflict of interest.

References

  1. World Health Organization. Available online: https://www.who.int/docs/default-source/coronaviruse/getting-workplace-ready-for-covid-19.pdf (accessed on 17 July 2023).
  2. World Health Organization. Available online: https://www.who.int/publications/i/item/WHO-2019-nCoV-Adjusting_PH_measures-Workplaces-2020.1 (accessed on 17 July 2023).
  3. Occupational Health and Safety Administration (OSHA). Available online: https://www.osha.gov/sites/default/files/publications/OSHA3990.pdf (accessed on 17 July 2023).
  4. International Labour Organization (ILO). Available online: https://www.ilo.org/wcmsp5/groups/public/---ed_norm/---normes/documents/genericdocument/wcms_739937.pdf (accessed on 17 July 2023).
  5. European Agency for Safety and Health at Work (EU-OSHA). Available online: https://oshwiki.osha.europa.eu/en/themes/covid-19-back-workplace-adapting-workplaces-and-protecting-workers (accessed on 17 July 2023).
  6. European Parliament. Directive 2000/54/EC of the European Parliament and of the Council of 18 September 2000 on the protection of workers from risks related to exposure to biological agents at work (seventh individual directive within the meaning of Article 16(1) of Directive 89/391/EEC). Off. J. Eur. Commun. 2000, L262/2. Available online: https://eur-lex.europa.eu/legal-content/EN/TXT/?uri=celex%3A32000L0054 (accessed on 17 July 2023).
  7. European Parliament. Commission Directive (EU) 2020/739 of 3 June 2020 amending Annex III to Directive 2000/54/EC of the European Parliament and of the Council as regards the inclusion of SARS-CoV-2 in the list of biological agents known to infect humans and amending Commission Directive (EU) 2019/1833. Off. J. Eur. Union 2020, L175/11. Available online: https://eur-lex.europa.eu/eli/dir/2020/739/oj (accessed on 18 July 2023).
  8. Melnick, J.P.; Ioannidis, E.R. Should governments continue lockdown to slow the spread of COVID-19. BMJ 2020, 369, m1924. [Google Scholar] [CrossRef]
  9. Atalan, A. Is the lockdown important to prevent the COVID-19 pandemic? Effects on psychology, environment and economy-perspective. Ann. Med. Surg. 2020, 56, 38–42. [Google Scholar] [CrossRef]
  10. Moser, D.A.; Glaus, J.; Frangou, S.; Schechter, D.S. Years of life lost due to the psychosocial consequences of COVID-19 mitigation strategies based on Swiss data. Eur. Psychiatry 2020, 63, e58. [Google Scholar] [CrossRef]
  11. European Parliament. Regulation (EU) 2021/953 of the European Parliament and of the Council of 14 June 2021 on a framework for the issuance, verification and acceptance of interoperable COVID-19 vaccination, test and recovery certificates (EU Digital COVID Certificate) to facilitate free movement during the COVID-19 pandemic (Text with EEA relevance). Off. J. Eur. Union 2021, L211/1. Available online: https://eur-lex.europa.eu/legal-content/EN/TXT/?uri=CELEX%3A32021R0953 (accessed on 25 July 2023).
  12. Austria Passes Covid Vaccine Mandate, but Question Marks Linger over Enforcement. Available online: https://www.theguardian.com/world/2022/feb/04/austria-passes-covid-vaccine-mandate-but-question-marks-linger-over-enforcement (accessed on 10 August 2023).
  13. Hellenic Government. Definition of the procedure for determining principals and imposition of administrative pecuniary penalty in paragraph 4 of Article 24 of Law 4865/2021 (A’ 238). Off. Gaz. Hell. Repub. 2022, B’608. Available online: https://www.et.gr/api/DownloadFeksApi/?fek_pdf=20220200608 (accessed on 10 August 2023). (In Greek).
  14. Oglesby, K. Unvaccinated to Take Daily Covid Test to Enter Workplace. Available online: https://www.luxtimes.lu/luxembourg/unvaccinated-to-take-daily-covid-test-to-enter-workplace/1335640.html (accessed on 19 March 2023).
  15. Douglas, E. COVID: New Restrictions for Germany’s Unvaccinated. Available online: https://www.dw.com/en/covid-new-rules-for-the-unvaccinated-in-germany/a-59261647 (accessed on 19 March 2023).
  16. Lee, J.; Jackson, M. COVID-19: Vaccines to be Compulsory for Frontline NHS Staff in England. Available online: https://www.bbc.com/news/health-59215282 (accessed on 19 March 2023).
  17. Trois Milles oignants suspendus: L’estimation «Parcellaire» d’Olivier Véran. Available online: https://www.lemonde.fr/les-decodeurs/article/2021/09/20/3-000-soignants-suspendus-l-estimation-parcellaire-d-olivier-veran_6095356_4355770.html (accessed on 19 March 2023).
  18. Garamone, J. Service Members Must Be Vaccinated or Face Consequences, DOD Official Says. Available online: https://www.defense.gov/News/News-Stories%20/Article/Article/2881481%20/service-members-must-be-vaccinated-or-face-consequences-dod-official-says/ (accessed on 19 March 2023).
  19. Oliu-Barton, M.; Pradelski, B.S.R.; Woloszko, N.; Guetta-Jeanrenaud, L.; Aghion, P.; Artus, P.; Fontanet, A.; Martin, P.; Wolff, G.B. The effect of COVID certificates on vaccine uptake, health outcomes, and the economy. Nat. Commun. 2022, 13, 3942. [Google Scholar] [CrossRef]
  20. Mills, M.C.; Rüttenauer, T. The effect of mandatory COVID-19 certificates on vaccine uptake: Synthetic-control modelling of six countries. Lancet Public Health 2022, 7, e15–e22. [Google Scholar] [CrossRef]
  21. Karaivanov, A.; Kim, D.; Lu, S.E.; Shigeoka, H. COVID-19 vaccination mandates and vaccine uptake. Na.t Hum. Behav. 2022, 6, 1615–1624. [Google Scholar] [CrossRef]
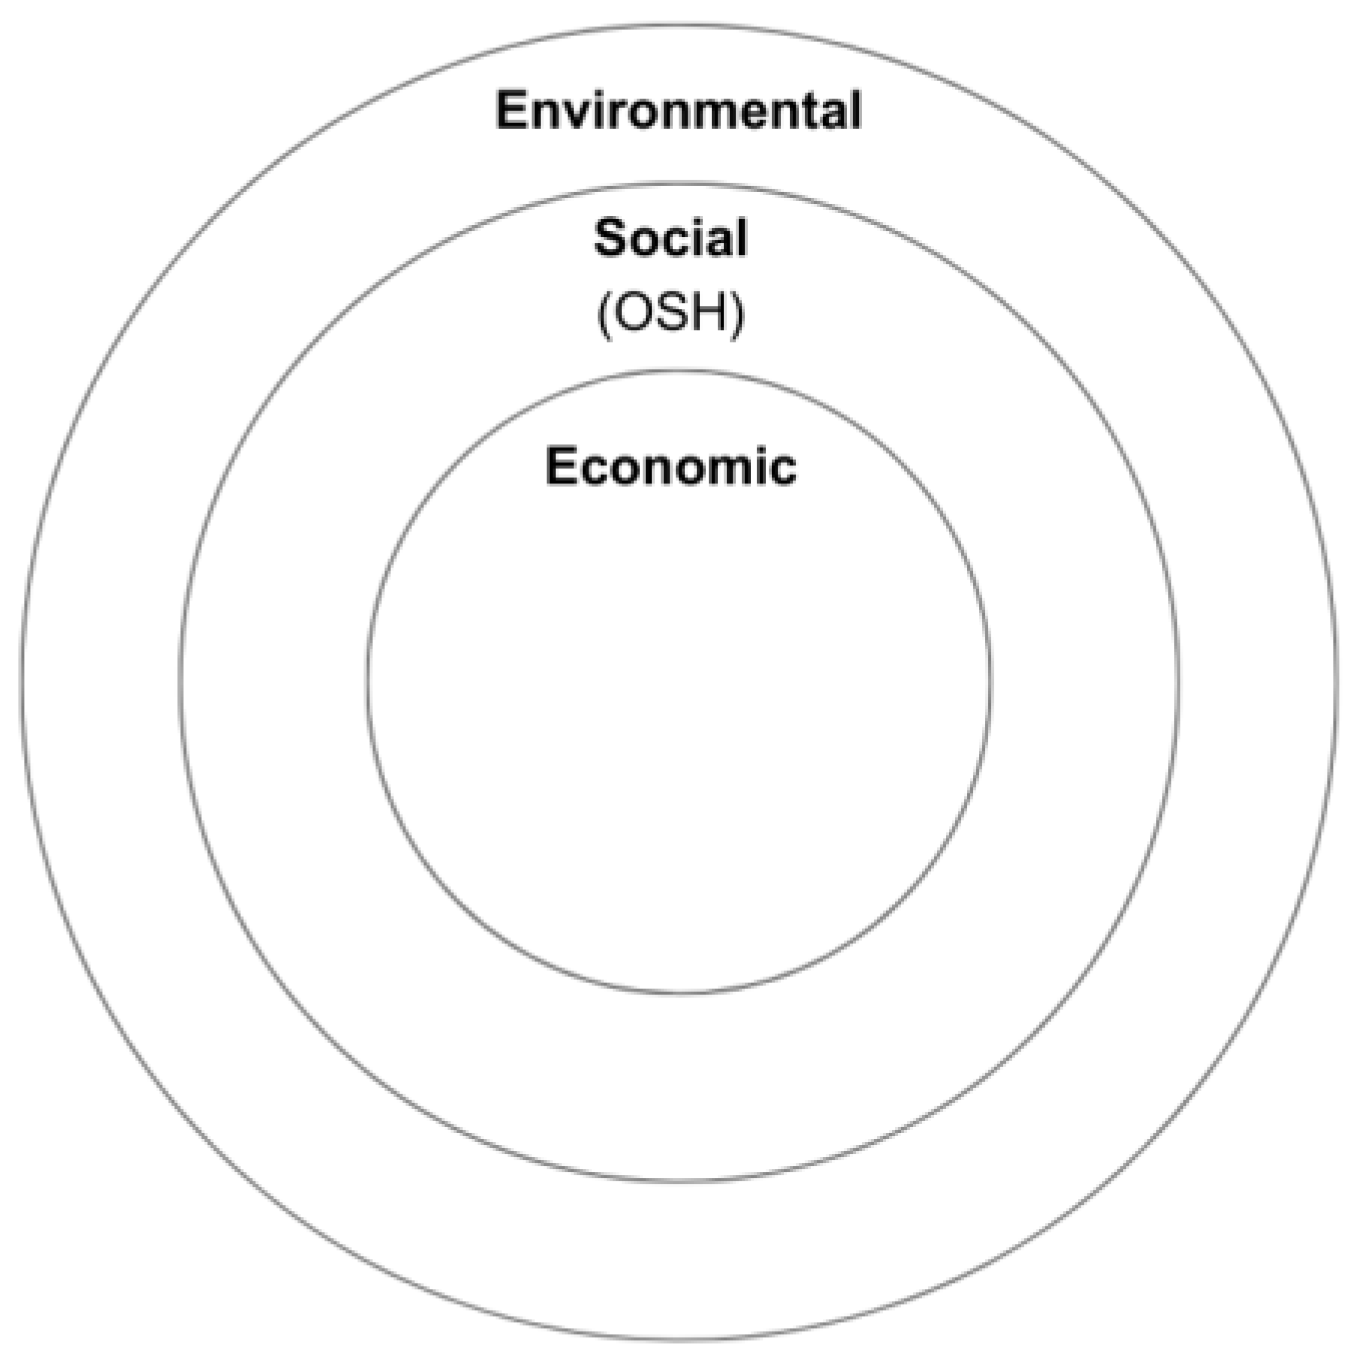
  22. Butler Harrington, L.M. Sustainability Theory and Conceptual Considerations: A Review of Key Ideas for Sustainability, and the Rural Context. Pap. Appl. Geogr. 2016, 2, 365–382. [Google Scholar] [CrossRef]
  23. Purvis, B.; Mao, Y.; Robinson, D. Three pillars of sustainability: In search of conceptual origins. Sustain. Sci. 2019, 14, 681–695. [Google Scholar] [CrossRef]
  24. Fernandes, N. Economic Effects of Coronavirus Outbreak (COVID-19) on the World Economy; IESE Business School Working Paper No. WP-1240-E; Rochester: New York, NY, USA, 2020. [Google Scholar] [CrossRef]
  25. Feyisa, H.L. The World Economy at COVID-19 Quarantine: Contemporary Review. Int. J. Econ. Financ. Manag. Sci. 2020, 8, 63–74. [Google Scholar] [CrossRef]
  26. Nicola, M.; Alsafi, Z.; Sohrabi, C.; Kerwan, A.; Al-Jabir, A.; Iosifidis, C.; Agha, M.; Agha, R. The socio-economic implications of the coronavirus pandemic (COVID-19): A review. Int. J. Surg. 2020, 78, 185–193. [Google Scholar] [CrossRef] [PubMed]
  27. Kalogiannidis, S.; Chatzitheodoridis, F.; Kontsas, S. An Eclectic Discussion of the Effects of COVID-19 Pandemic on the World Economy During the First Stage of the Spread. Int. J. Financ. Res. 2020, 11, 137–153. [Google Scholar] [CrossRef]
  28. Mou, J. Research on the Impact of COVID-19 on Global Economy. IOP Conf. Ser. Earth Environ. Sci. 2020, 546, 032043. [Google Scholar] [CrossRef]
  29. Reis, C.; Oliveira, C.; Braga, P.; Silva, J.F.; Silva, L.T. Occupational Health and Safety-Sustainable Development and the Changes in Organizations. In Occupational and Environmental Safety and Health II, 1st ed.; Arezes, P.M., Ed.; Studies in Systems, Decision and Control; Springer Nature Switzerland AG: Cham, Switzerland, 2020; Volume 277, pp. 677–687. [Google Scholar] [CrossRef]
  30. Jilcha, K.; Kitaw, D. Industrial occupational safety and health innovation for sustainable development. Eng. Sci. Technol. Int. J. 2016, 20, 372–380. [Google Scholar] [CrossRef]
  31. Kavouras, S.; Vardopoulos, I.; Mitoula, R.; Zorpas, A.A.; Kaldis, P. Occupational Health and Safety Scope Significance in Achieving Sustainability. Sustainability 2022, 14, 2424. [Google Scholar] [CrossRef]
  32. Johanson, U.; Aboagye, E.; Yao, J. Integrating business model for sustainability and performance management to promote occupational health and safety—A discussion of value. Front. Sustain. 2022, 3, 950847. [Google Scholar] [CrossRef]
  33. Cutler, D.M.; Summers, L.H. The COVID-19 Pandemic and the $16 Trillion Virus. JAMA 2020, 324, 1495–1496. [Google Scholar] [CrossRef]
  34. Murphy, Κ. The social pillar of sustainable development: A literature review and framework for policy analysis. Sustain. Sci. Pract. Policy 2012, 8, 15–29. [Google Scholar] [CrossRef]
  35. Magnavita, N.; Soave, P.M.; Antonelli, M. Treating Anti-Vax Patients, a New Occupational Stressor—Data from the 4th Wave of the Prospective Study of Intensivists and COVID-19 (PSIC). Int. J. Environ. Res. Public Health 2022, 19, 5889. [Google Scholar] [CrossRef]
  36. Subramanian, S.V.; Kumar, A. Increases in COVID-19 are unrelated to levels of vaccination across 68 countries and 2947 counties in the United States. Eur. J. Epidemiol. 2021, 36, 1237–1240. [Google Scholar] [CrossRef]
  37. Muttappallymyalil, J.; ChandrasekharNair, S.; Changerath, R.; Sreejith, A.; Manda, S.; Sreedharan, J. Vaccination Rate and Incidence of COVID-19 and Case Fatality Rate (CFR): A Correlational Study Using Data from 2019 to 2021. Cureus 2022, 14, e28210. [Google Scholar] [CrossRef]
  38. Greiner, A.; Owusu, B. Effects of the vaccination against SARS-CoV-2 on infections and on hospitalizations in European countries. SN Bus. Econ. 2023, 3, 67. [Google Scholar] [CrossRef]
  39. Kampf, G. The epidemiological relevance of the COVID-19-vaccinated population is increasing. Lancet Reg. Health Eur. 2021, 11, 100272. [Google Scholar] [CrossRef]
  40. Brown, C.M.; Vostok, J.; Johnson, H.; Burns, M.; Gharpure, R.; Sami, S.; Sabo, R.T.; Hall, N.; Foreman, A.; Schubert, P.L.; et al. Outbreak of SARS-CoV-2 Infections, Including COVID-19 Vaccine Breakthrough Infections, Associated with Large Public Gatherings—Barnstable County, Massachusetts, July 2021. Morb. Mortal. Wkly. Rep. 2021, 70, 1059–1062. [Google Scholar] [CrossRef]
  41. Ko, L.; Malet, G.; Chang, L.L.; Nguyen, H.; Mayes, R. COVID-19 Infection Rates in Vaccinated and Unvaccinated Inmates: A Retrospective Cohort Study. Cureus 2023, 15, e44684. [Google Scholar] [CrossRef]
  42. Salvatore, P.P.; Lee, C.C.; Sleweon, S.; McCormick, D.W.; Nicolae, L.; Knipe, K.; Dixon, T.; Banta, R.; Ogle, I.; Young, C.; et al. Transmission potential of vaccinated and unvaccinated persons infected with the SARS-CoV-2 Delta variant in a federal prison. Vaccine 2023, 41, 1808–1818. [Google Scholar] [CrossRef]
  43. Singanayagam, A.; Hakki, S.; Dunning, J.; Madon, K.J.; Crone, M.A.; Koycheva, A.; Derqui-Fernandez, N.; Barnett, J.L.; Whitfield, M.G.; Varro, R.; et al. Community transmission and viral load kinetics of the SARS-CoV-2 delta (B.1.617.2) variant in vaccinated and unvaccinated individuals in the UK: A prospective, longitudinal, cohort study. Lancet Infect Dis. 2022, 22, 183–195. [Google Scholar] [CrossRef] [PubMed]
  44. Mavridis, C.; Aidonidis, G.; Evangelou, M.; Kalogeridis, A. Mandatory vaccinations, the segregation of citizens, and the promotion of inequality in the modern democracy of Greece and other democratic countries in the era of COVID-19. Hist. Philos. Life Sci. 2022, 44, 72. [Google Scholar] [CrossRef]
  45. Bardosh, K.; de Figueiredo, A.; Gur-Arie, R.; Jamrozik, E.; Doidge, J.; Lemmens, T.; Keshavjee, S.; Graham, J.E.; Baral, S. The unintended consequences of COVID-19 vaccine policy: Why mandates, passports and restrictions may cause more harm than good. BMJ Glob. Health 2022, 7, e008684. [Google Scholar] [CrossRef]
  46. Voo, T.C.; Savulescu, J.; Schaefer, O.; Ling, A.H.Z.; Tam, C.C. COVID-19 differentiated measures for unvaccinated individuals: The need for clear goals and strong justifications. Vaccine 2022, 40, 5333–5337. [Google Scholar] [CrossRef]
  47. Agba, A.M.O.; Ocheni, S.I.; Agba, M.S. COVID-19 and the World of Work Dynamics: A Critical Review. JESR 2020, 10, 119–130. [Google Scholar] [CrossRef]
  48. Dehghani, F.; Omidi, F.; Yousefinejad, S.; Taheri, E. The hierarchy of preventive measures to protect workers against the COVID-19 pandemic: A review. Work 2020, 67, 771–777. [Google Scholar] [CrossRef]
  49. Ingram, C.; Downey, V.; Roe, M.; Chen, Y.; Archibald, M.; Kallas, K.A.; Kumar, J.; Naughton, P.; Uteh, C.O.; Rojas-Chaves, A.; et al. COVID-19 Prevention and Control Measures in Workplace Settings: A Rapid Review and Meta-Analysis. Int. J. Environ. Res. Public Health 2021, 18, 7847. [Google Scholar] [CrossRef]
  50. Mathieu, E.; Ritchie, H.; Rodés-Guirao, L.; Appel, C.; Giattino, C.; Hasell, J.; Macdonald, B.; Dattani, S.; Beltekian, D.; Ortiz-Ospina, E.; et al. Coronavirus Pandemic (COVID-19). Available online: https://ourworldindata.org/coronavirus (accessed on 21 August 2022).
  51. European Centre for Disease Prevention and Control. Available online: https://www.ecdc.europa.eu/en/publications-data/download-historical-data-20-june-2022-weekly-number-new-reported-covid-19-cases (accessed on 19 July 2022).
  52. UK Health Security Agency. Available online: https://coronavirus.data.gov.uk/details/vaccinations?areaType=overview&areaName=United%20Kingdom (accessed on 19 July 2022).
  53. Prime Minister’s Office of Japan. Available online: https://www.kantei.go.jp/jp/headline/kansensho/vaccine.html (accessed on 13 August 2022).
  54. Institute for Public Health FB&H. Available online: https://www.zzjzfbih.ba/pregled-epidemioloske-situacije-covid-19/ (accessed on 8 December 2022).
  55. Ministry of Health of Albania. Available online: https://shendetesia.gov.al/ (accessed on 19 August 2022).
  56. Government of Ireland. Available online: https://covid-19.geohive.ie/search (accessed on 20 November 2022).
  57. Ministry of Health of Armenia. Available online: https://www.moh.am/#1/News (accessed on 19 August 2022).
  58. Government of the Republic of Croatia. Available online: https://www.koronavirus.hr/o-cijepljenju/dnevna-izvjesca-o-cijepljenju/953 (accessed on 20 August 2022).
  59. Public Health France. Available online: https://www.data.gouv.fr/fr/datasets/donnees-relatives-aux-personnes-vaccinees-contre-la-covid-19-1/ (accessed on 18 August 2022).
  60. Ministry of Health of Israel. Available online: https://datadashboard.health.gov.il/portal/dashboard/corona (accessed on 14 August 2022).
  61. Ministry of Health of Austria. Available online: https://impfdaten.at/ (accessed on 13 August 2022).
  62. Robert Koch Institute and Federal Ministry of Health of Germany. Available online: https://impfdashboard.de/daten (accessed on 13 August 2022).
  63. Statens Serum Institut. Available online: https://covid19.ssi.dk/overvagningsdata%20/download-fil-med-vaccinationsdata (accessed on 13 August 2022).
  64. Finnish Institute for Health and Welfare. Available online: https://sampo.thl.fi/pivot/prod/en/vaccreg/cov19cov/fact_cov19cov?column=measure-533185.533172.433796.533175&row=cov_vac_dose-533174L (accessed on 16 October 2022).
  65. Government of the Republic of Moldova. Available online: https://vaccinare.gov.md/rapoarte-saptaminale (accessed on 18 August 2022).
  66. Ministry of Health of New Zealand. Available online: https://www.health.govt.nz/covid-19-novel-coronavirus/covid-19-data-and-statistics/covid-19-vaccine-data (accessed on 17 August 2022).
  67. National Institute for Public Health of Slovenia. Available online: https://app.powerbi.com/view?r=eyJrIjoiYWQ3NGE1NTMtZWJkMi00NzZmLWFiNDItZDc5YjU5MGRkOGMyIiwidCI6ImFkMjQ1ZGFlLTQ0YTAtNGQ5NC04OTY3LTVjNjk5MGFmYTQ2MyIsImMiOjl9 (accessed on 15 October 2022).
  68. Statistics Lithuania State Data Agency. Available online: https://experience.arcgis.com/experience/cab84dcfe0464c2a8050a78f817924ca/page/Atviri-duomenys/ (accessed on 9 October 2022).
  69. Department of Health and Aged Care of the Government of Australia. Available online: https://www.health.gov.au/resources/collections/covid-19-vaccination-rollout-update (accessed on 19 August 2022).
  70. Covid Base AU. Available online: https://covidbaseau.com/vaccinations/ (accessed on 19 August 2022).
  71. Ministry of Health of the Republic of Kosovo. Available online: https://www.facebook.com/Ministria.Shendetesise.RKS (accessed on 1 November 2022).
  72. European Centre for Disease Prevention and Control. Available online: https://www.ecdc.europa.eu/en/publications-data/data-covid-19-vaccination-eu-eea (accessed on 9 December 2022).
  73. Centers for Disease Control and Prevention. CDC Real-World Study Confirms Protective Benefits of mRNA COVID-19 Vaccines. Available online: https://www.cdc.gov/media/releases/2021/p0329-COVID-19-Vaccines.html (accessed on 29 August 2023).
  74. UK Government. Available online: https://www.gov.uk/government/news/react-study-shows-fully-vaccinated-are-three-times-less-likely-to-be-infected (accessed on 29 August 2023).
  75. European Centre for Disease and Control. Available online: https://www.ecdc.europa.eu/en/news-events/ecdc-report-examines-sars-cov-2-transmission-risk-vaccinated-previously-infected-individuals (accessed on 29 August 2023).
  76. After More than 500 Days, Denmark Has Ended Its COVID Restrictions. Available online: https://www.npr.org/2021/09/10/1036136246/covid-denmark-eu-restrictions (accessed on 31 August 2023).
  77. Denmark Proposes Corona Pass Mandate for Workers. Available online: https://www.reuters.com/world/europe/denmark-proposes-corona-pass-mandate-workers-2021-11-12/ (accessed on 31 August 2023).
  78. Where France’s COVID-19 ‘Health Pass’ Is Now Mandatory. Available online: https://www.france24.com/en/france/20210802-france-s-covid-19-health-pass-where-it-is-mandatory-and-what-will-change-on-august-9 (accessed on 7 September 2023).
  79. France Suspends 3,000 Unvaccinated Health Workers without Pay. Available online: https://www.theguardian.com/world/2021/sep/16/france-suspends-3000-unvaccinated-health-workers-without-pay-covid-jab (accessed on 31 August 2023).
  80. Lytras, T.; Tsiodras, S. Total patient load, regional disparities and in-hospital mortality of intubated COVID-19 patients in Greece, from September 2020 to May 2021. Scand. J. Public Health 2022, 50, 671–675. [Google Scholar] [CrossRef] [PubMed]
Figure 1. The three pillars of sustainability.
Safety 10 00006 g001
Figure 2. Scatter plot depicting the total cases of infection per 100,000 people in relation to the average rates of the unvaccinated (%) from the forty-fourth week of 2021 to the fourth week of 2022.
Safety 10 00006 g002
Figure 3. Scatter plot depicting the total cases of infection per 100,000 people in relation to the average rates of the partially vaccinated with one dose (%) from the forty-fourth week of 2021 to the fourth week of 2022.
Safety 10 00006 g003
Figure 4. Scatter plot depicting the total cases of infection per 100,000 people in relation to the average rates of the vaccinated with the single-dose vaccine (%) from the forty-fourth week of 2021 to the fourth week of 2022.
Safety 10 00006 g004
Figure 5. Scatter plot depicting the total cases of infection per 100,000 people in relation to the average rates of the vaccinated with two doses (%) from the forty-fourth week of 2021 to the fourth week of 2022.
Safety 10 00006 g005
Figure 6. Scatter plot depicting the total cases of infection per 100,000 people in relation to the average rates of the vaccinated with three doses (%) from the forty-fourth week of 2021 to the fourth week of 2022.
Safety 10 00006 g006
Figure 7. Scatter plot depicting the total cases of infection per 100,000 people in relation to the average rates of the vaccinated with four doses (%) from the forty-fourth week of 2021 to the fourth week of 2022.
Safety 10 00006 g007
Table 1. Examples of countries which were excluded from the study due to a lack of data. Total cases are expressed per 100,000 people in relation to the average percentage of the “fully vaccinated” from the forty-fourth week of 2021 to the fourth week of 2022.
CountryCases per CapitaVaccination Coverage (%)
Portugal162.4682.86
Iceland151.3276.37
Netherlands144.2667.65
Greece124.0265.47
Italy114.1575.13
Serbia78.2745.62
Lebanon53.6231.58
Jordan34.1633.59
Belarus16.1633.63
Azerbaijan13.3144.79
Table 2. Correlation coefficients and R-squared numbers of the scatter plot analysis.
Vaccination StatusCorrelation CoefficientR-Squared
Single dose−0.5190.269
No doses−0.4790.230
First dose−0.0740.005
Second dose0.1350.018
Third dose0.6520.425
Fourth dose0.2050.042
Disclaimer/Publisher’s Note: The statements, opinions and data contained in all publications are solely those of the individual author(s) and contributor(s) and not of MDPI and/or the editor(s). MDPI and/or the editor(s) disclaim responsibility for any injury to people or property resulting from any ideas, methods, instructions or products referred to in the content.

