You are currently viewing a new version of our website. To view the old version click .
Journal of Imaging
  • Article
  • Open Access

13 February 2023

Novel Light Convolutional Neural Network for COVID Detection with Watershed Based Region Growing Segmentation

,
,
and
1
Software Engineering Insitute, East China Normal University, Shanghai 200062, China
2
School of Data Science and Engineering, East China Normal University, Shanghai 200062, China
3
School of Information Engineering, Southwest University of Science and Technology, Mianyang 621010, China
4
Department of Computer Science, University of Turbat, Turbat 92600, Pakistan
This article belongs to the Special Issue Computer Vision and Deep Learning: Trends and Applications

Abstract

A rapidly spreading epidemic, COVID-19 had a serious effect on millions and took many lives. Therefore, for individuals with COVID-19, early discovery is essential for halting the infection’s progress. To quickly and accurately diagnose COVID-19, imaging modalities, including computed tomography (CT) scans and chest X-ray radiographs, are frequently employed. The potential of artificial intelligence (AI) approaches further explored the creation of automated and precise COVID-19 detection systems. Scientists widely use deep learning techniques to identify coronavirus infection in lung imaging. In our paper, we developed a novel light CNN model architecture with watershed-based region-growing segmentation on Chest X-rays. Both CT scans and X-ray radiographs were employed along with 5-fold cross-validation. Compared to earlier state-of-the-art models, our model is lighter and outperformed the previous methods by achieving a mean accuracy of 98.8% on X-ray images and 98.6% on CT scans, predicting the rate of 0.99% and 0.97% for PPV (Positive predicted Value) and NPV (Negative predicted Value) rate of 0.98% and 0.99%, respectively.

1. Introduction

Coronaviruses represent a diverse potential source of infection. Coronaviruses acquires their name from the spike proteins that emerge from them, giving them a crown-like appearance. These spike proteins are crucial to the viruses’ metabolism. The spike protein is the portion of the virus that infects a human cell and allows it to multiply and spread to other cells. The SARS-CoV-2 virus, which causes COVID-19, was identified in Wuhan, China, in December 2019. Shortness of breath, muscle aches, fever, sore throat, and some severe disorders, including Middle East respiratory syndrome (MERS) and severe acute respiratory syndrome (SARS) caused by COVID-19 []. Symptoms appear in 2 to 14 days after inoculation of the virus. A person infected with the coronavirus can be dangerous to others for up to two days before clinical signs appear and for 10 to 20 days after that, depending on the patient immune system and the seriousness of their infection. COVID-19 is a contagious disease; therefore, its mutation may allow the coronavirus to transmit more quickly from person to person, as seen with the delta and omicron variations.
According to the World Health Organization, the overall number of cases has already surpassed 516,900,683, and the total number of deaths has exceeded 6,259,945. Regarding reported cases worldwide, Europe and America were top of the list []. The medical community faced additional hurdles as a result of this infection. Infected persons had no access to medical wards or ventilators, and even a scarcity of physicians and nurses in hospitals. Various governments have introduced new policies and adopted new ways of living. Many specialists and scientists worked on making vaccines to prevent the virus; however, the vaccines slow the virus’s spread and make it easier to develop immunity by forming specific antibodies. A vaccine was just a prevention strategy, not a cure. Therefore, numerous challenges were encountered with vaccine administration, especially vaccine availability. The RT-PCR of respiratory tract samples was the most prevalent and standard approach for diagnosing COVID-19. RT-PCR test kits were often used to identify COVID-19. However, the RT-PCR test’s complexity, low sensitivity, and time consumption caused a lot of concern. The shortage of test kit availability can create a crucial problem. Additionally, it will become quite difficult and expensive to run these tests frequently and regularly for the population as the number of infected individuals grows. As a result, specialists have switched to chest CT scans and X-rays to detect COVID-19, which is faster and more accurate than the RT-PCR test. However, using these CT scans or X-ray imaging techniques can sometimes be challenging since experts cannot always make a distinction between COVID-19 and other respiratory infections such as seasonal flu [].
Processing medical images have become increasingly popular. Deeper and more accurate network models that can compete with humans in terms of speed and accuracy have recently received much interest and increased medical research considerably. Researchers have been working with doctors and clinical professionals to detect coronavirus infections early. Computer-assisted diagnostic methods that can assist radiologists in immediately and precisely interpreting radiography images are very popular. Deep learning models have proven to be effective for image classification and detection. Medical imaging has recently gained much attention due to the rise of deep-learning approaches for computer-aided analysis of respiratory illnesses. Creating automated systems for COVID-19 detection is only possible using Chest X-rays or CT scan images. For the early diagnosis of coronavirus infection from images such as CT scans or X-ray images, many researchers have already applied a variety of deep learning and machine learning approaches to detect the virus. However, any automated system that intends to be used in practice must have a high detection rate and reliable performance on testing datasets. Data that are multimodal and of acceptable performance can yield it to trial. Therefore, in our research, we used a Novel light Convolutional Neural Network model along with a Region-based Watershed Image segmentation technique to classify COVID-19, Pneumonia, and Normal images. We conducted extensive research and used CT scans and X-ray images to enhance the effectiveness of COVID-19 detection and more accurately analyze the performance of our proposed model by using 5-fold cross-validation.

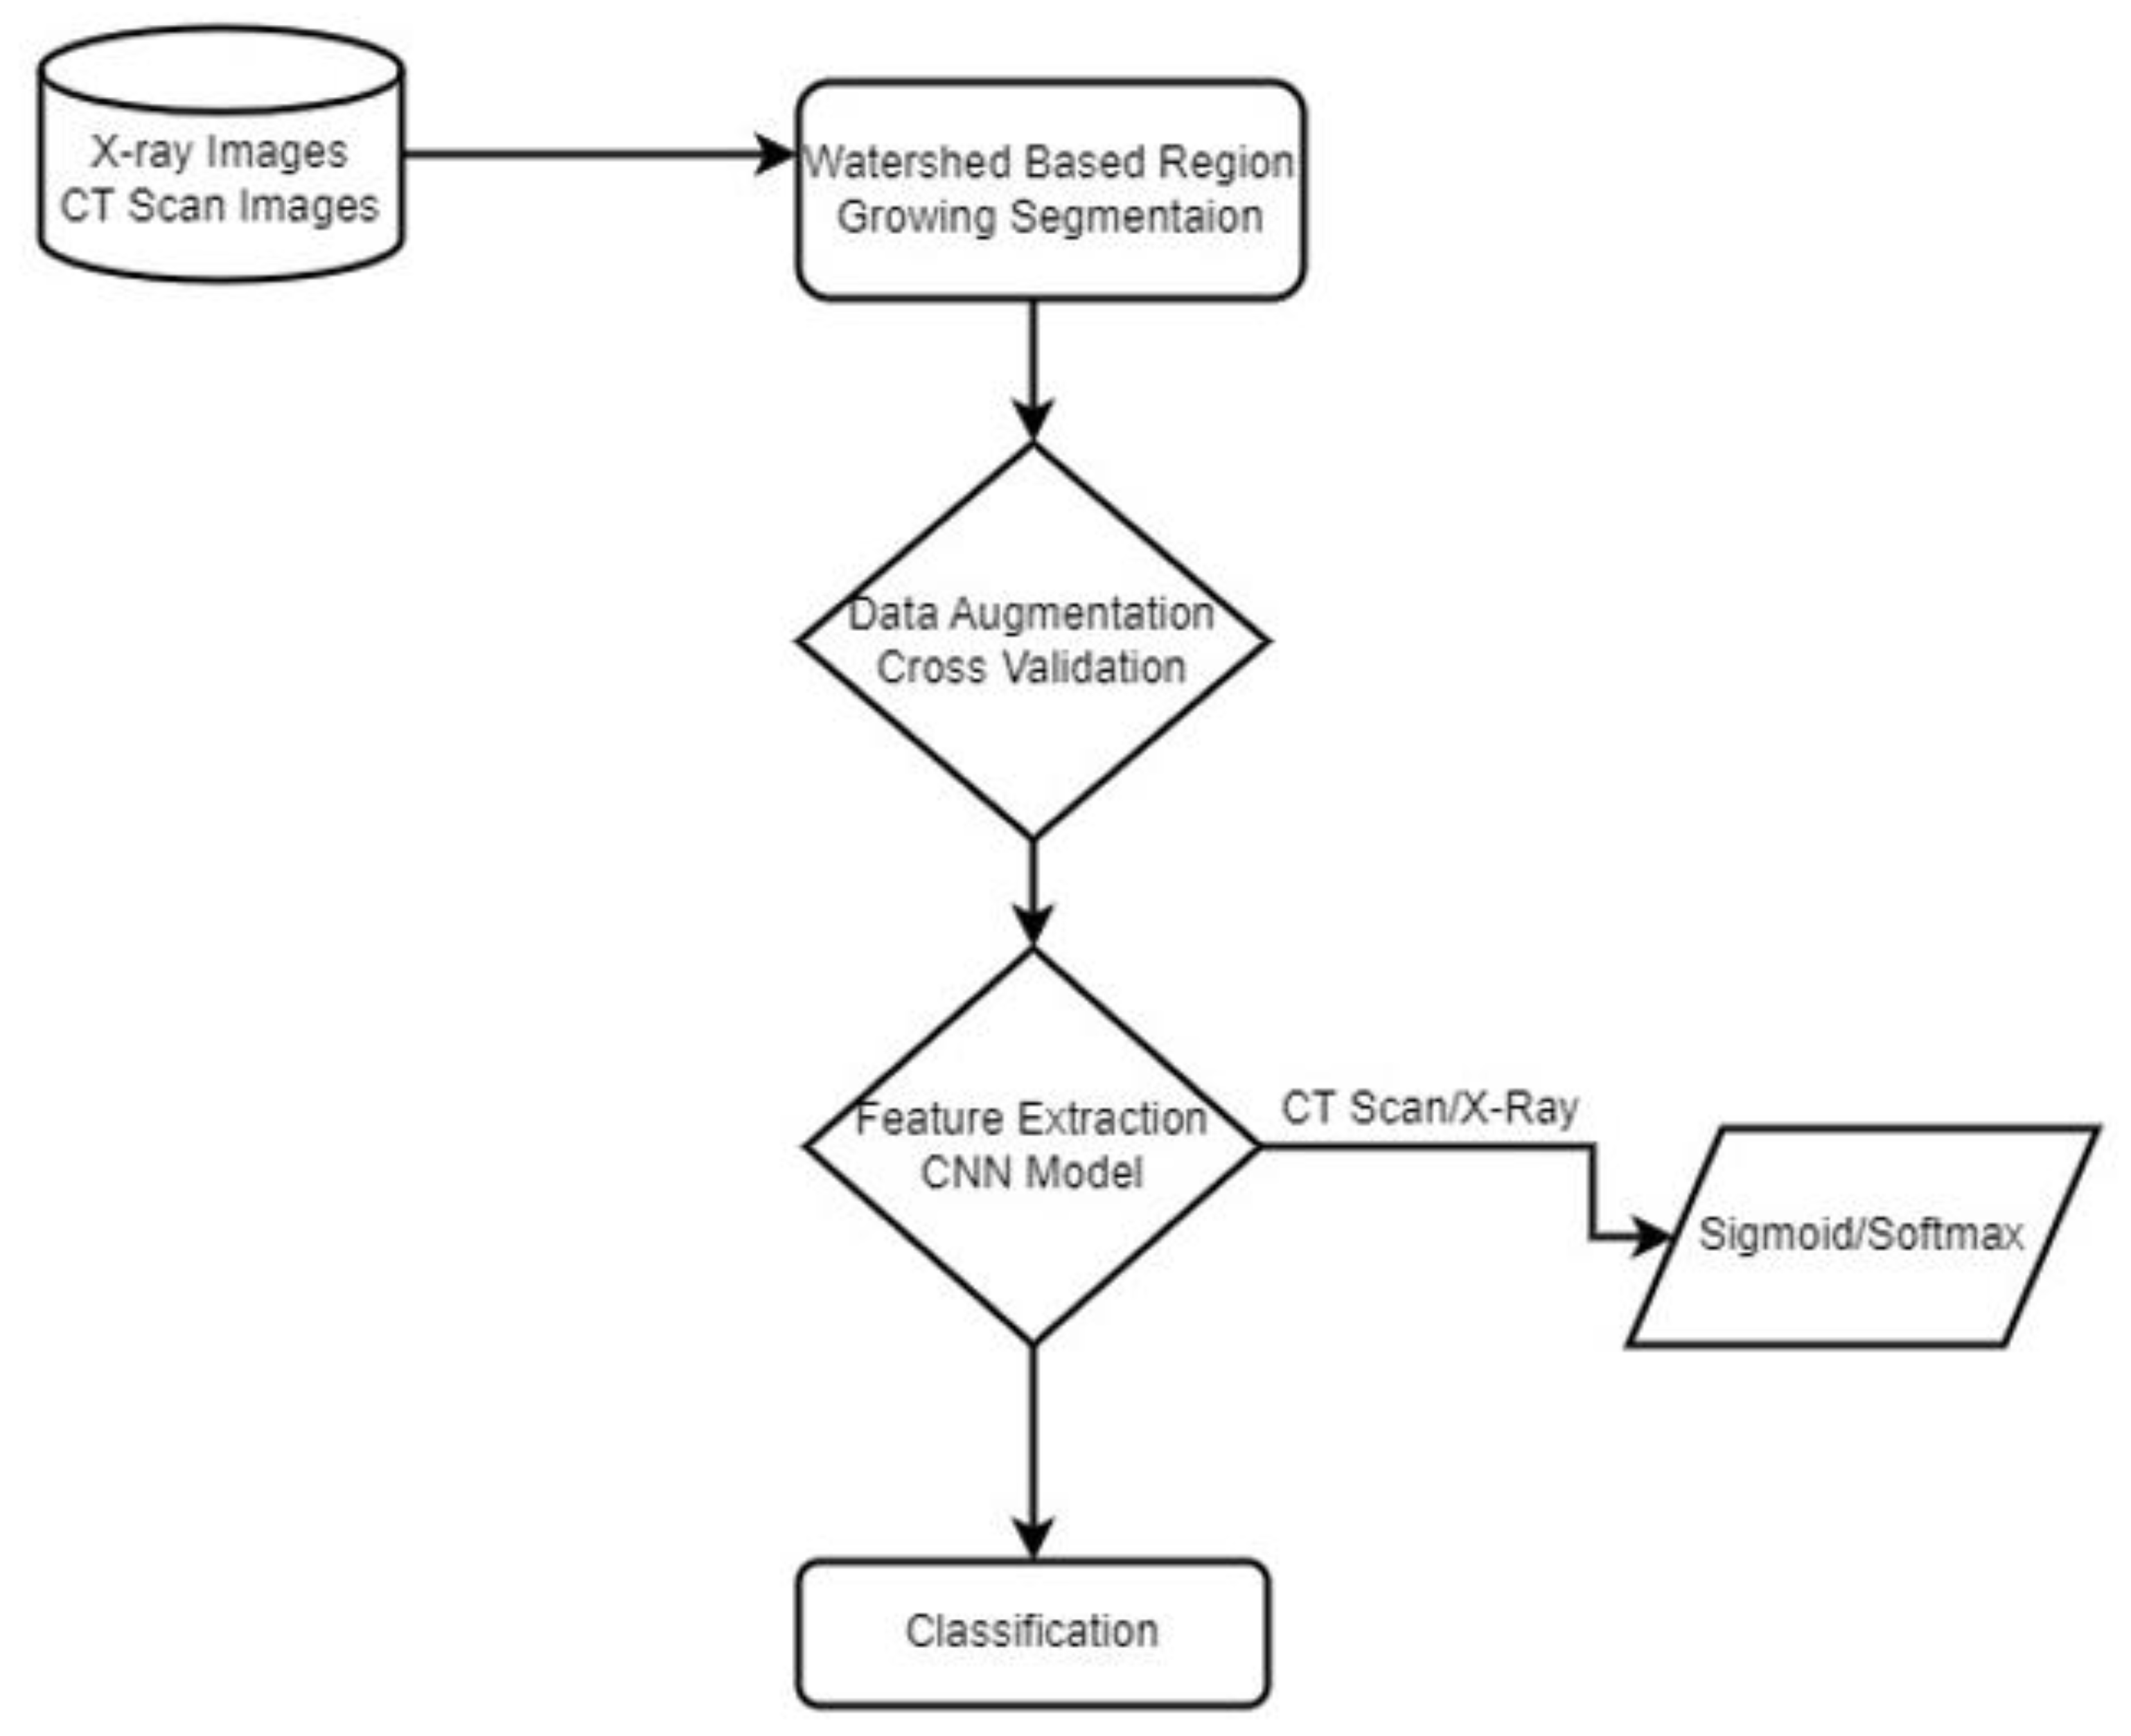
3. Materials and Method
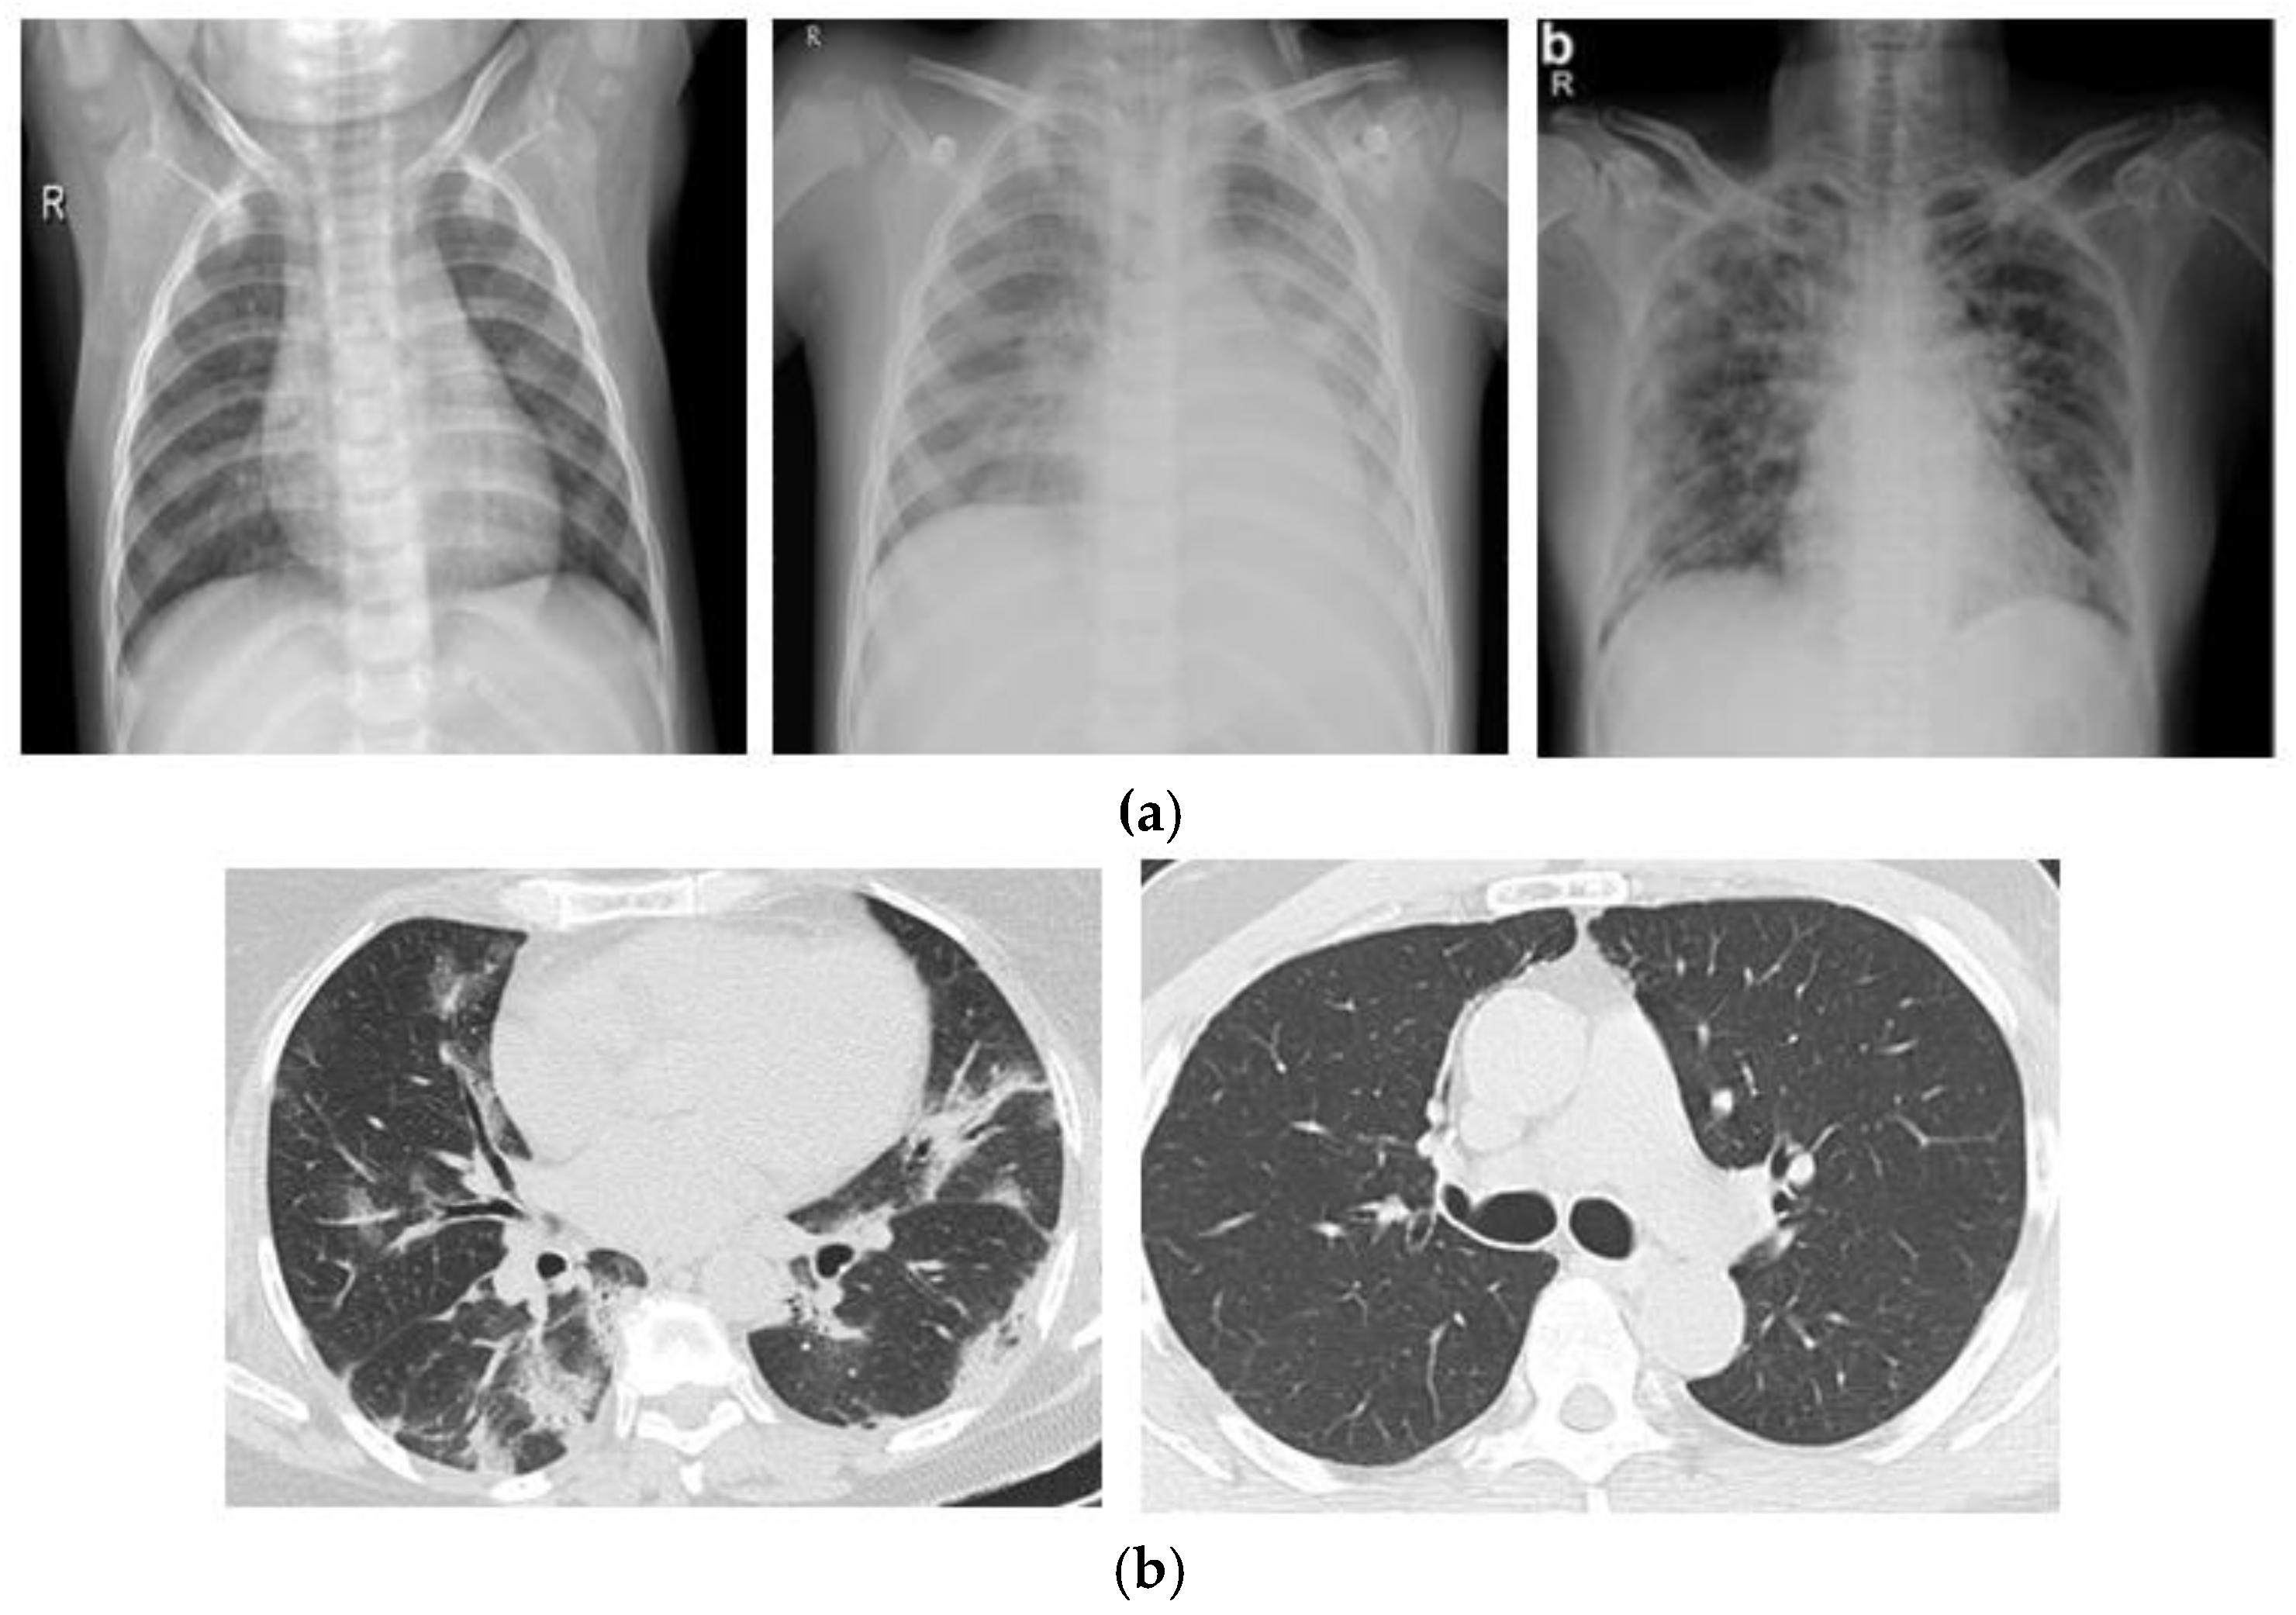
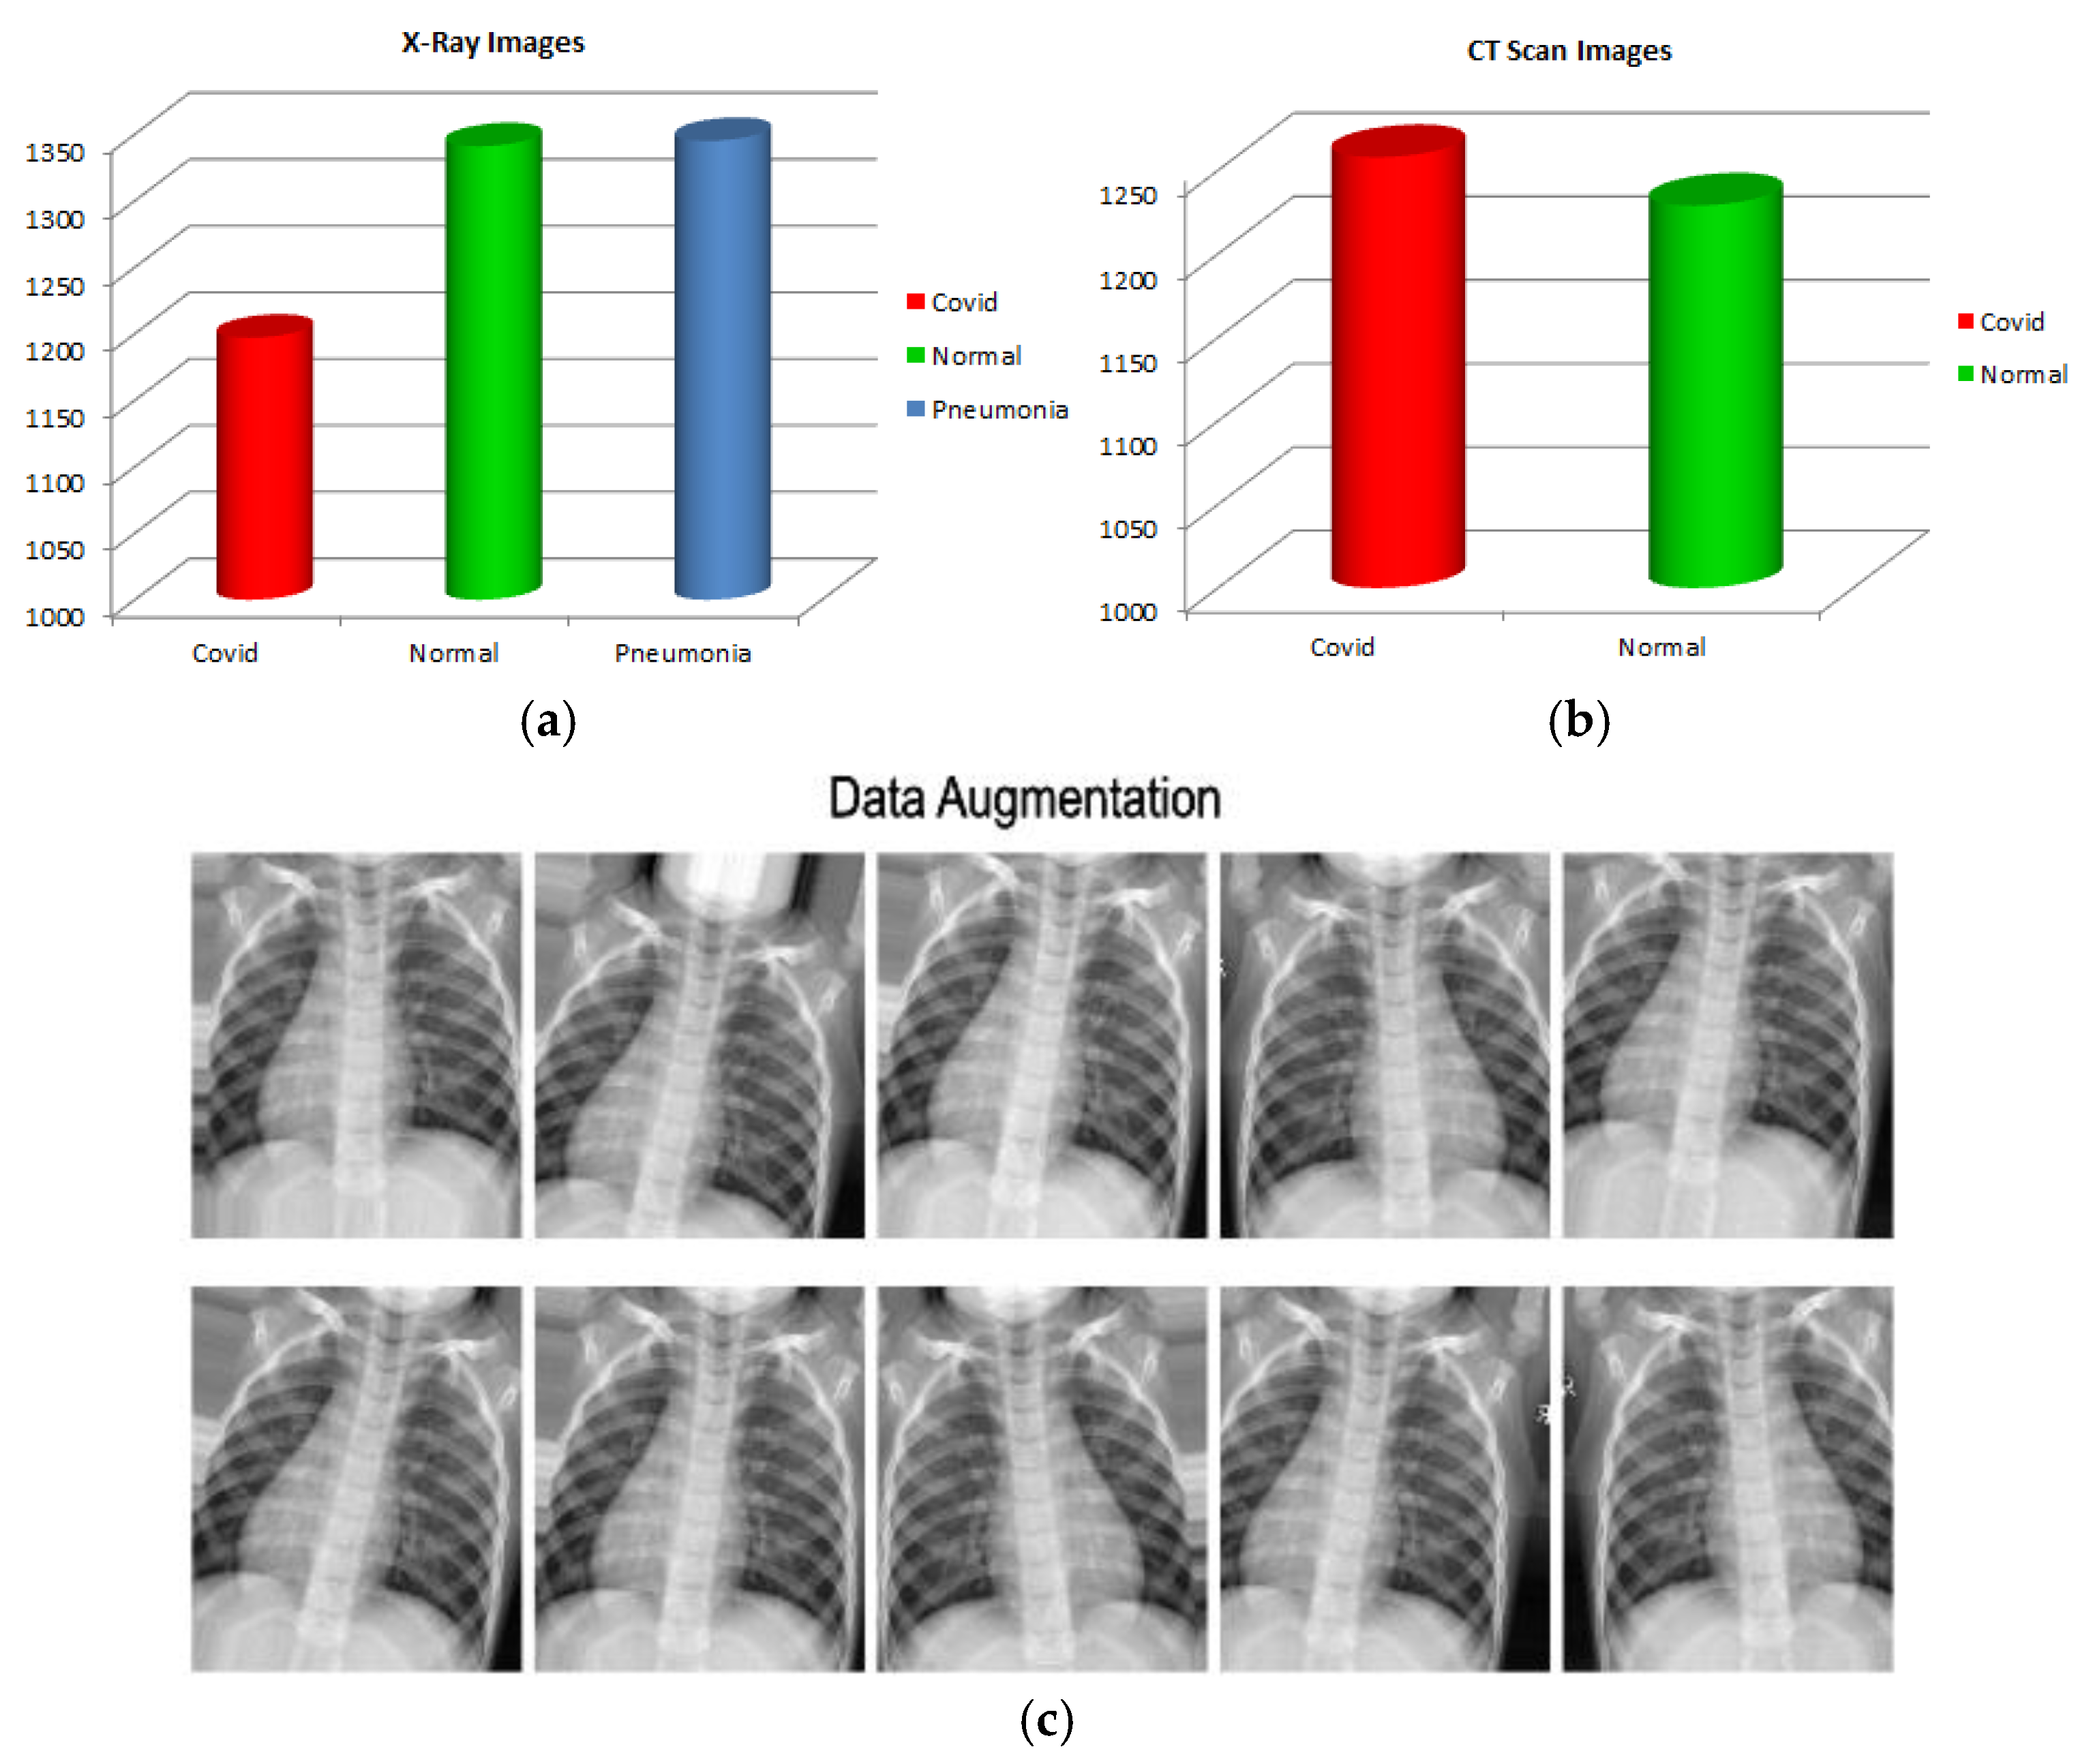
In the proposed method, we used two different datasets and first applied image processing techniques to remove noise and segment the region of interest in COVID-19 X-ray images. Then we applied data augmentation and proposed a Sequential novel light CNN model for classification with 5-fold cross-validation on our dataset to obtain an optimal model. We compared our model accuracy with the previous state of the Arts. An overview of the proposed model is shown in Figure 1.
Figure 1. Proposed Methodology.

3.1. Dataset

In our study, we conducted experiments utilizing two different kinds of image datasets. One is X-ray radiographs of the chest, which have extensively been employed in previous research. The X-ray radiograph dataset consists of three classes: normal, pneumonia, and COVID patient chest X-rays. The COVID-19 radiography database was developed by a team of medical experts and researchers worldwide, and it is publicly available on Kaggle []. The dataset contains 3829 X-rays images of Normal, Pneumonia, and COVID-19 patients. The second dataset consists of CT scan images containing 2482 CT scans of Normal and COVID patients. The data were obtained from patients diagnosed at hospitals in Sao Paulo, Brazil, and are openly accessible for study and research development []. The most common diagnostic imaging test is the X-ray, which is easily accessible. CT scans are more time-consuming than X-rays but are quick and precise. Therefore, we only used the image processing technique on X-ray images in our dataset. The dataset from the CT scan images had already been processed. Two separate datasets are displayed in Figure 2.
Figure 2. (a) X-ray Radiographs of normal, pneumonia and COVID patients. (b) CT Scan images of COVID and normal patients.

3.2. Watershed Based Region Growing Segmentation

Raw images were used as input in previous case studies; however, it may not be better to apply classification methods directly to original datasets because the accuracy result is altered, which causes misclassification. Other issues encompass image imbalance difficulties and the fact that patients’ chest X-ray images are not often aligned. The position of the lungs varies from one image to another. Using X-ray images, the chest has to be the region of interest for COVID-19 diagnosis. As a result, the segmentation method has been used to segregate the pixels of interest and detect the active contours in X-ray images, enabling the classifier to produce more accurate predictions. The efficacy of conducting lung segmentation by applying CNN on CXR images to identify COVID-19 is evaluated by Lucas O. Teixeira et al. []. However, as we can see in the mentioned literature, the segmentation was done using U-Net and CNN. That requires a lot of computational power, Moreover, for classification purposes, they used a transfer learning approach and used pre-trained models such as VGG, RestNet, and Inception. However, we employed a watershed-based region-growing segmentation method, which grows regions nonlinearly by integrating neighbor pixels that are similar and associated to the seed pixel and removing pixels with irregularly shaped watersheds. When no neighbor pixels fulfill the similarity condition, the growth ends. The watershed algorithm considers the values of pixels to be a local topography (elevation). The method floods basins from the markers until watershed lines connecting various basins meet.
In our experiment, first, we converted our X-ray images into grayscale. Then we used a Sobel edge detection filter to compute the estimated absolute gradient at each region in the grayscale image. After applying Sobel edge detection to emphasize edges on our images, we employed an elevation map to display the various altitudes in a region. Contour lines connect points on a map showing areas with similar elevation levels and are used to illustrate elevation on maps. After that, we set our markers on these X-ray images. Then, we employed a morphological watershed transformation technique to segment watershed regions. The watershed can run and identify the exact boundaries due to our defined markers. We fill the regions separated from the background by thin patches during the watershed. Finally, we plotted overlays and contours around the processed image and cropped the segmented chest images from the X-ray images. The segmentation process is displayed in Figure 3. The real X-ray image, as seen in Figure 3, has many black pixels around the borders, and there is some texture information on the X-ray image; if we feed this image straight to our CNN model, it will extract these dark edges portions as well. As a result, we segmented the area of interest in the X-ray images and provided only the region of interest as an input to our neural network model.
Figure 3. Watershed based region growing segmentation: (a) real X-ray image, (b) Sobel edge detection and elevation map, (c) setting markers, (d) watershed transformation, (e) plotting overlays, for segmentation, and (f) image cropping.

3.3. Data Augmentation

In image processing or computer vision, data imbalance is a major problem, particularly in the medical field. Data augmentation helps to enhance the number of samples and provide diversity in the dataset without collecting new samples. It rectifies the class imbalance by producing synthetic examples of classes with fewer objects. The input images for every batch were normalized during data augmentation. On each image, translation and rotation were applied. To improve the variety of data available, rotation creates the same image at several angles, and in translation, images are moved across the X or Y axes. These procedures alter the image’s shape and pixel values so that the human visual system can observe it easily. Thus, the data augmentation feature offers more effective training as more diverse images were used in the deep neural network’s training. Therefore, we used the data augmentation approach on both CT scans and segmented X-ray images by flipping and rotating the images between 0 and 360 angles, along with images normalization. Figure 4 displays the data’s class imbalance and multiple augmented images created from a single image.
Figure 4. (a) X-ray images class imbalance, (b) CT scan class imbalance, and (c) data augmentation.

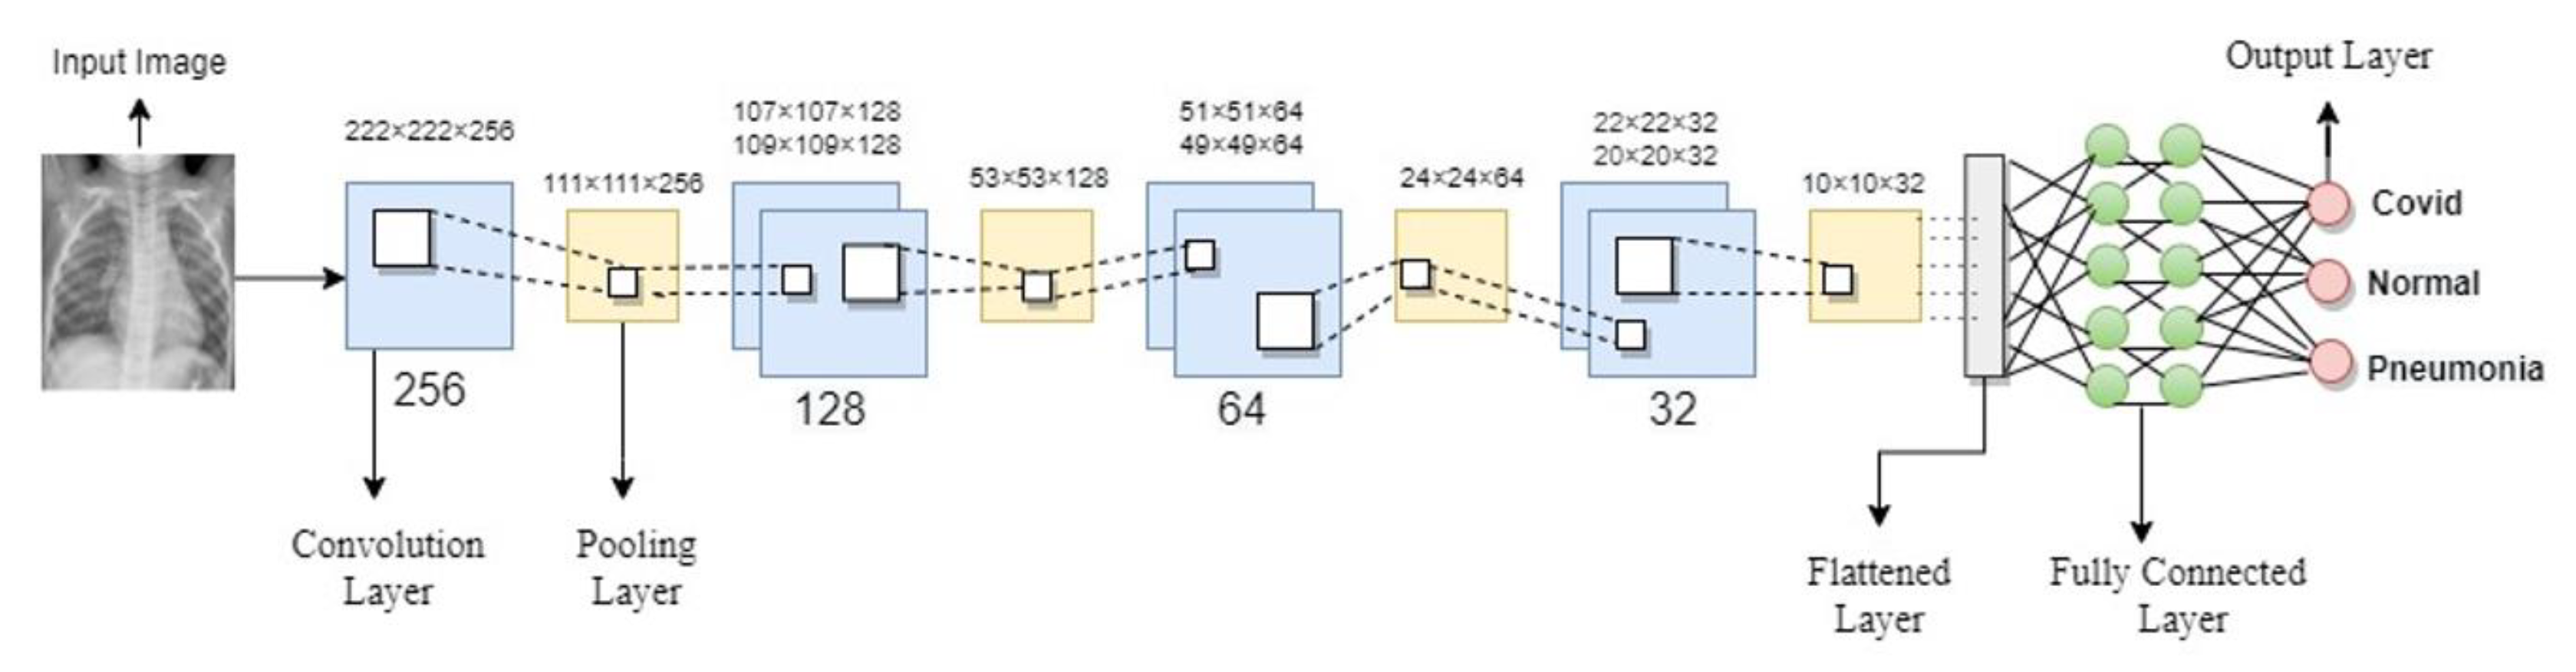
3.4. Convolutional Neural Network

A CNN deep learning model comprises many convolutional layers that extract detailed and discrete features from the input images, a pooling layer to reduce the network’s parameters and computations, and fully connected layers that add weight matrices and bias vectors to the input to help classify the data. Sometimes, rather than developing a new CNN framework from scratch, an alternatively pre-trained CNN model was used that has already been proved in terms of accuracy and performance. These pre-trained models were employed using a transfer learning approach. Most approaches employed in the prior literature for COVID-19 detection had utilized transfer learning techniques. However, in our study, we put forward a novel light convolutional neural network model to detect COVID-19 cases in both X-ray and CT scan images. We developed a novel light CNN model to extract features from X-ray and CT images having 224 × 224 input sizes. Figure 5 depicts the architecture of the model we proposed.
Figure 5. Proposed CNN Model Architecture.
Our proposed model has only seven convolution layers, making it more efficient and requiring less computational power during the training phase. The receptive field is as small as it can be to obtain the feature map. In our model, every hidden layer has a Rectifier linear unit (ReLU) activation function that can produce a real zero value for negative inputs. ReLU avoids the issue of vanishing gradients due to its linear behavior, which makes gradients proportional to node activation. In the first hidden layer, we added a single convolution layer of 256 filters with a rectifier linear unit (ReLU) function with a pooling layer on top of the convolutional layer to calculate the maximum pixels to sum the patches of the convolution layer. Then we reduced the convolutional layers filters to 128, 64, and 32. We added two fully connected layers with a dropout layer of 0.5 in addition to the convolutional and pooling layers that were followed by an output layer with a softmax and sigmoid function. Since both binary and categorical classification are involved, sigmoid is utilized for binary classification and softmax for categorical classification.
S i g m o i d   x = 1 1 + e x
S o f t m a x   Z j = e z i j = 1 K e z j
In addition, we employed binary cross entropy for CT scan images and categorical cross entropy for X-ray images to calculate the loss between algorithmically predicted values and the actual label’s value.
J z =   y   log   P y + 1   y   log 1   P y  
P(y) represents predicted labels, whereas y represents actual labels. Since y is multiplying by log, the whole first term will be zero when the actual labels have a value of 0. Additionally, when y equals 1, the second term will equal zero (1-y), and it will be multiplied by the log.
A = i = 1   ( y i   l o g   P y i )
A = y 1   l o g   P y 1 y 2   l o g   P y 2 y n   l o g   P y 2
The labels are one hot encoded in categorical cross-entropy, and only the positive class label will be 1 while the others will be 0. Therefore, because there are 0 target labels when the term is multiplied by log, it will result in 0. The loss function will only retain the positive class term that is 1.

3.5. Optimization

After calculating the difference between our actual and predicted values through the loss function, we attempt to minimize the difference by updating the weights and learning rates in an optimization method. Depending on the algorithm used for optimization, weights and learning rates may need to be adjusted to minimize the loss. Therefore, we applied the Adaptive Moment Estimation (Adam) optimizer to reduce the loss in the experiment’s performance. The Adam optimizer is Stochastic Gradient Descent with Momentum and RMS prop combination.
W = W η V d W   S d W   + ε    
b = b η V d b   S d b   + ε  
η is the learning rate with a range of values, while Sdw and Sdb are the exponentially weighted means of the squares of the previous gradients (RMS Prop) for the corrected weights and bias, respectively; Vdw and Vdb are the exponentially weighted means of past gradients (SGD). Epsilon Ɛ inhibits the division of zero.

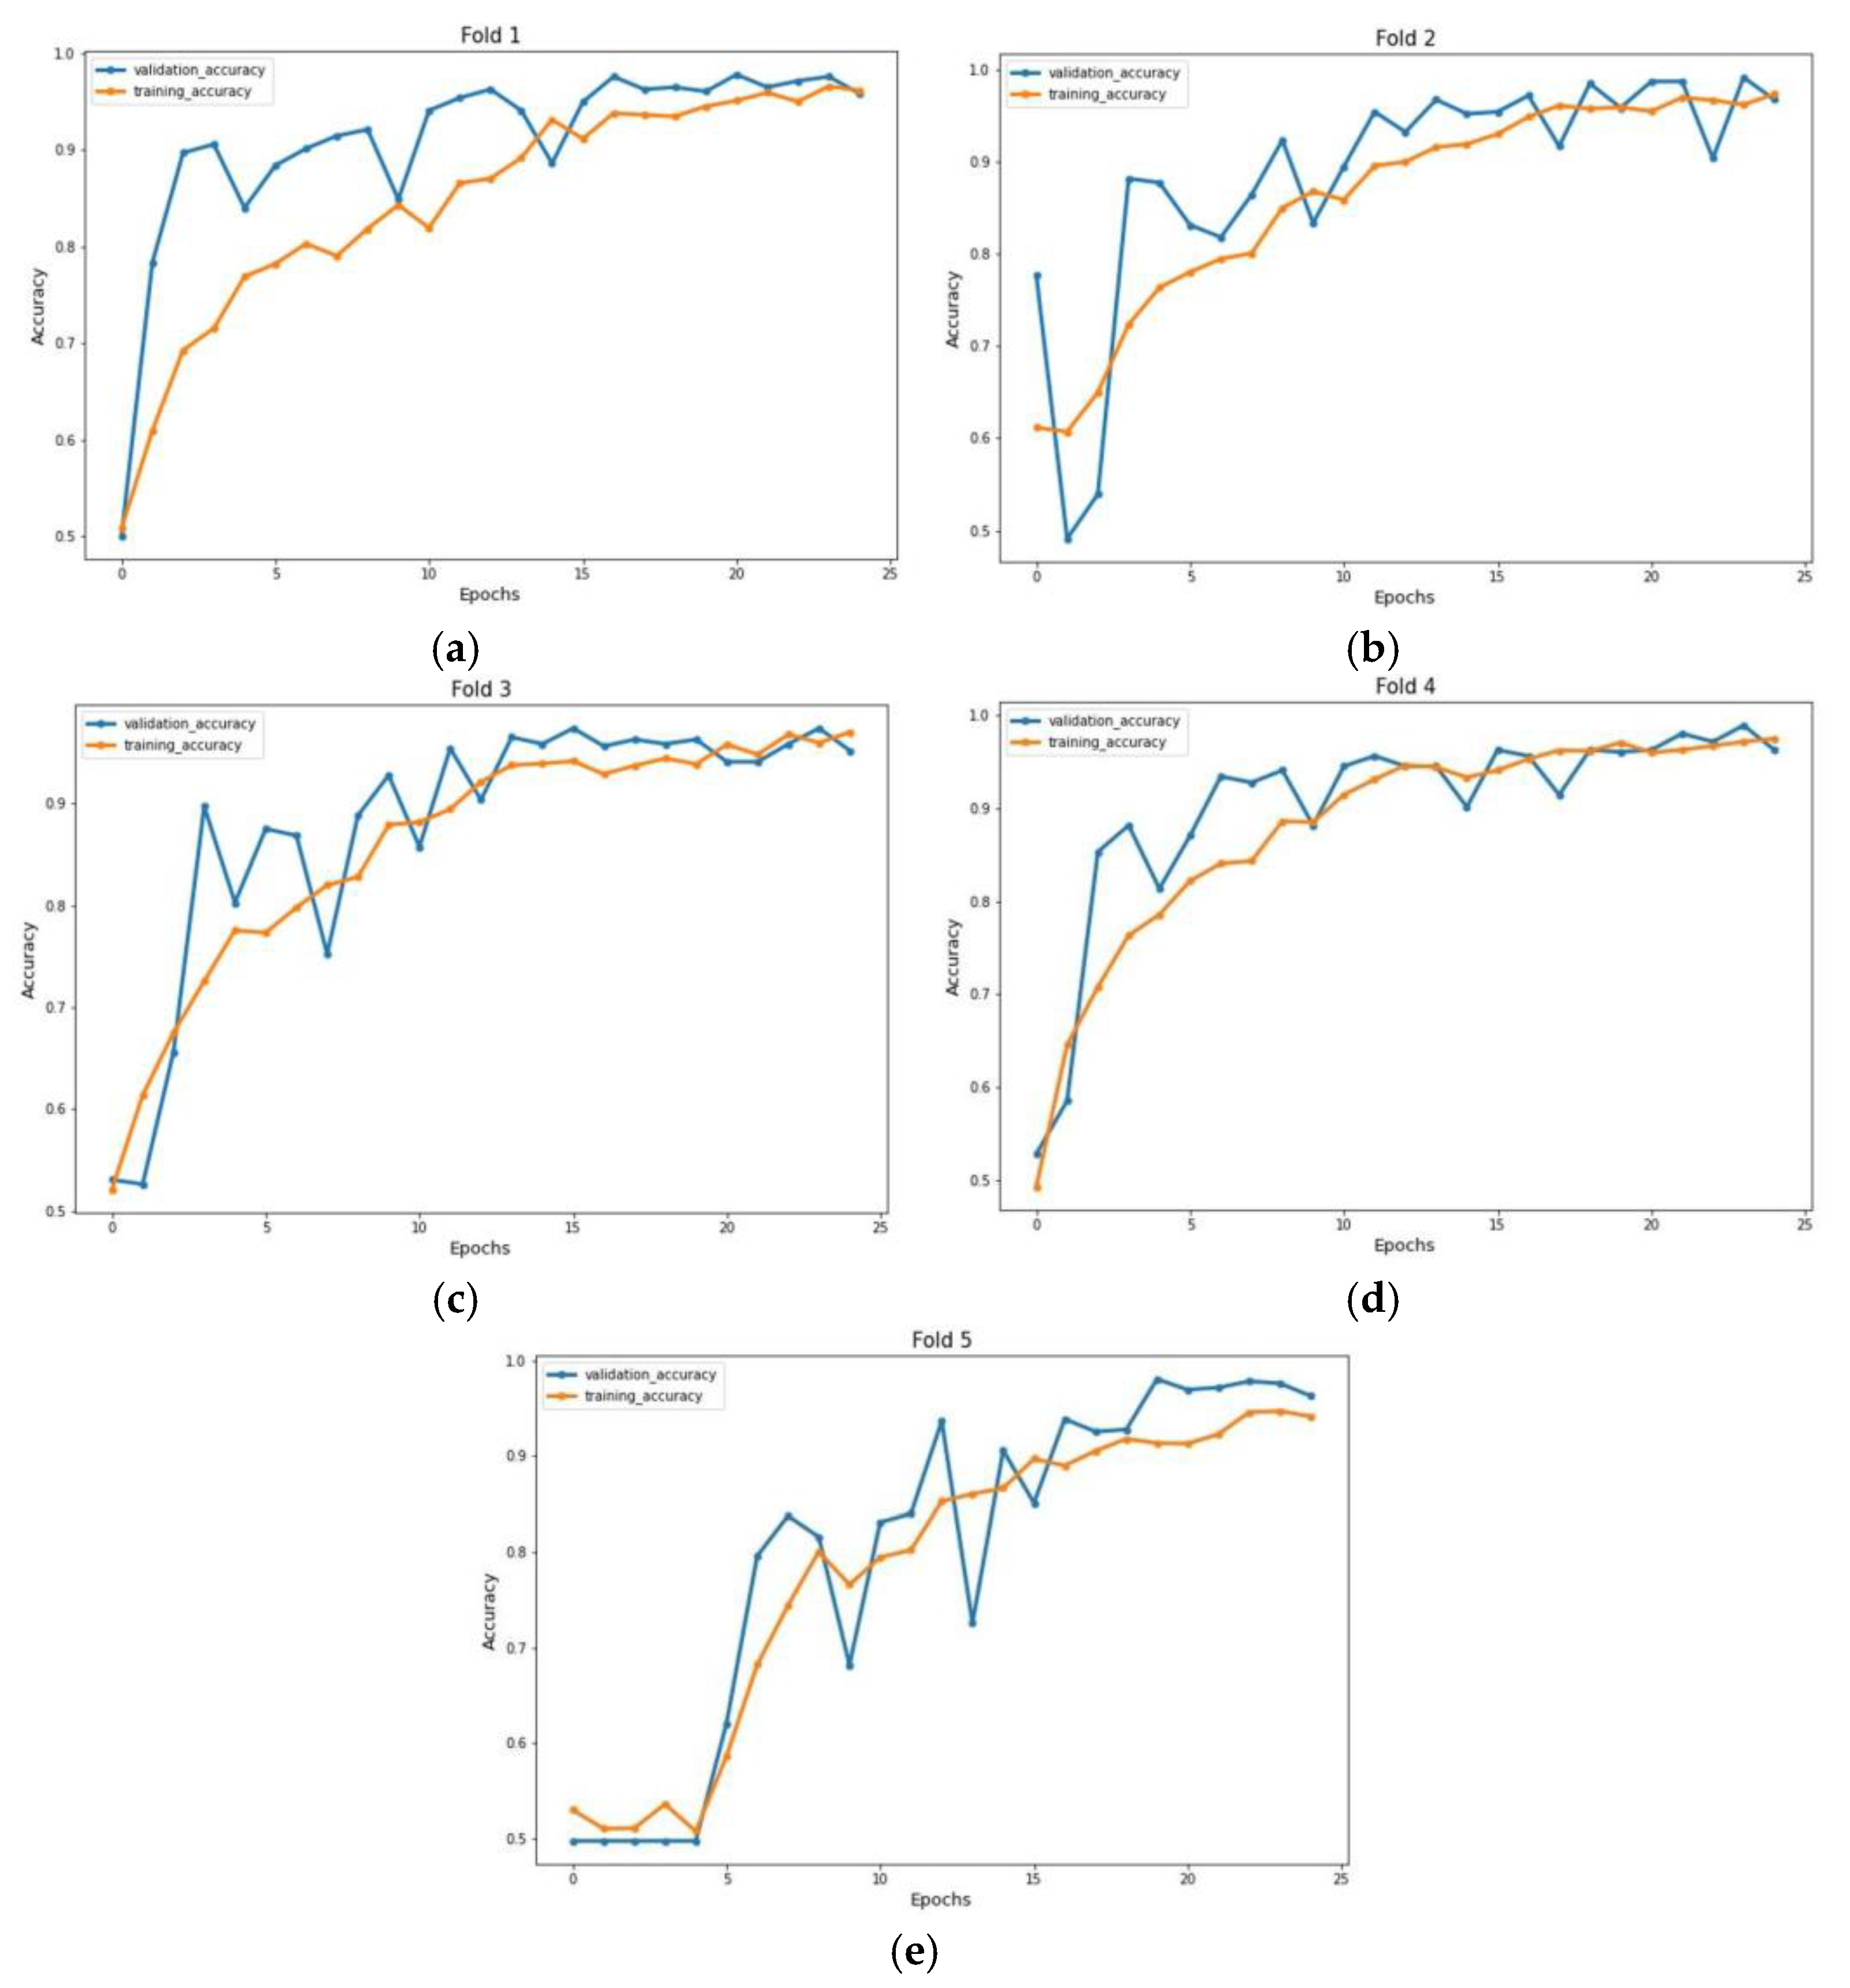
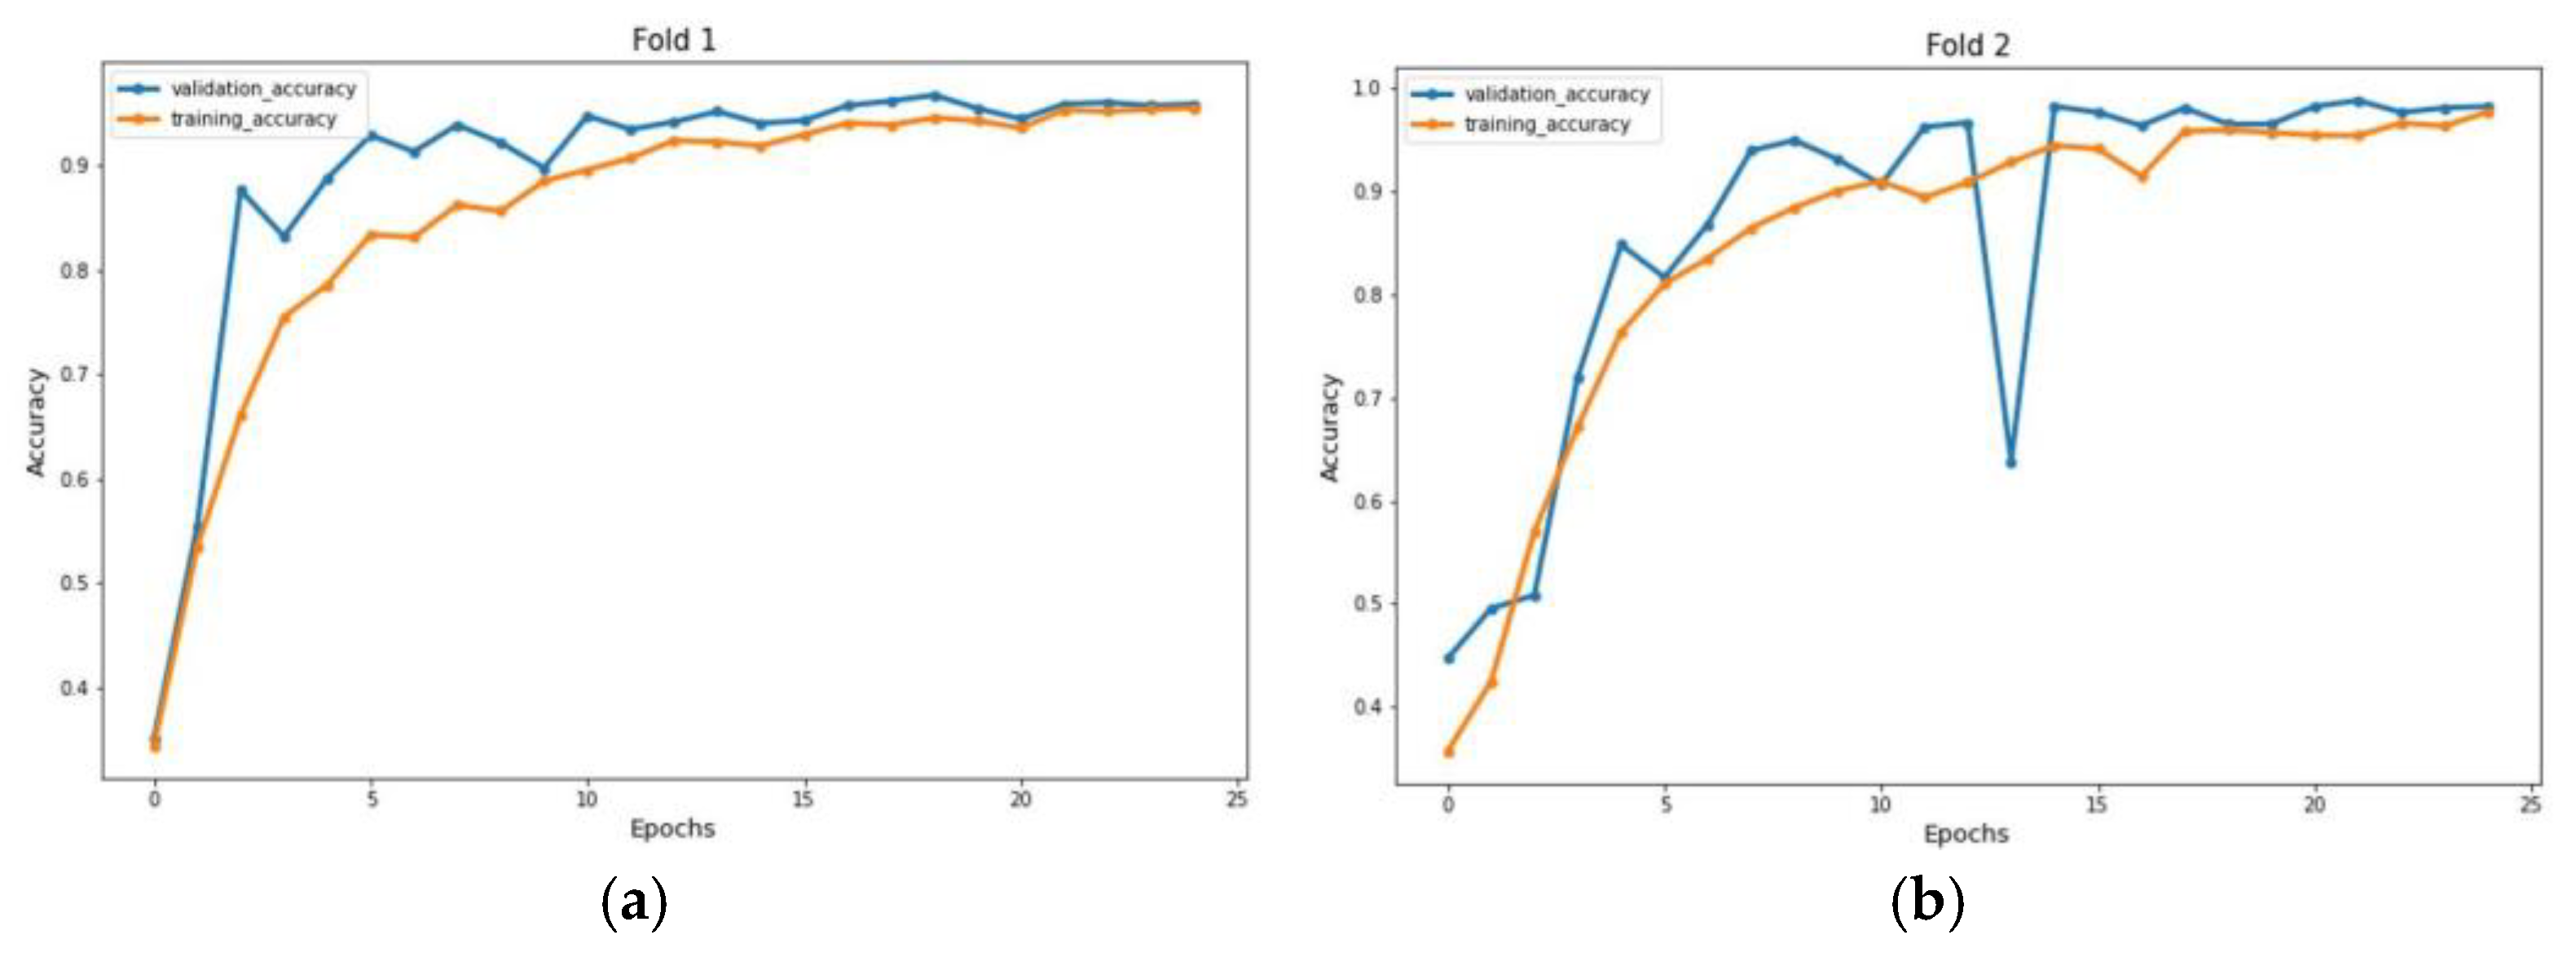
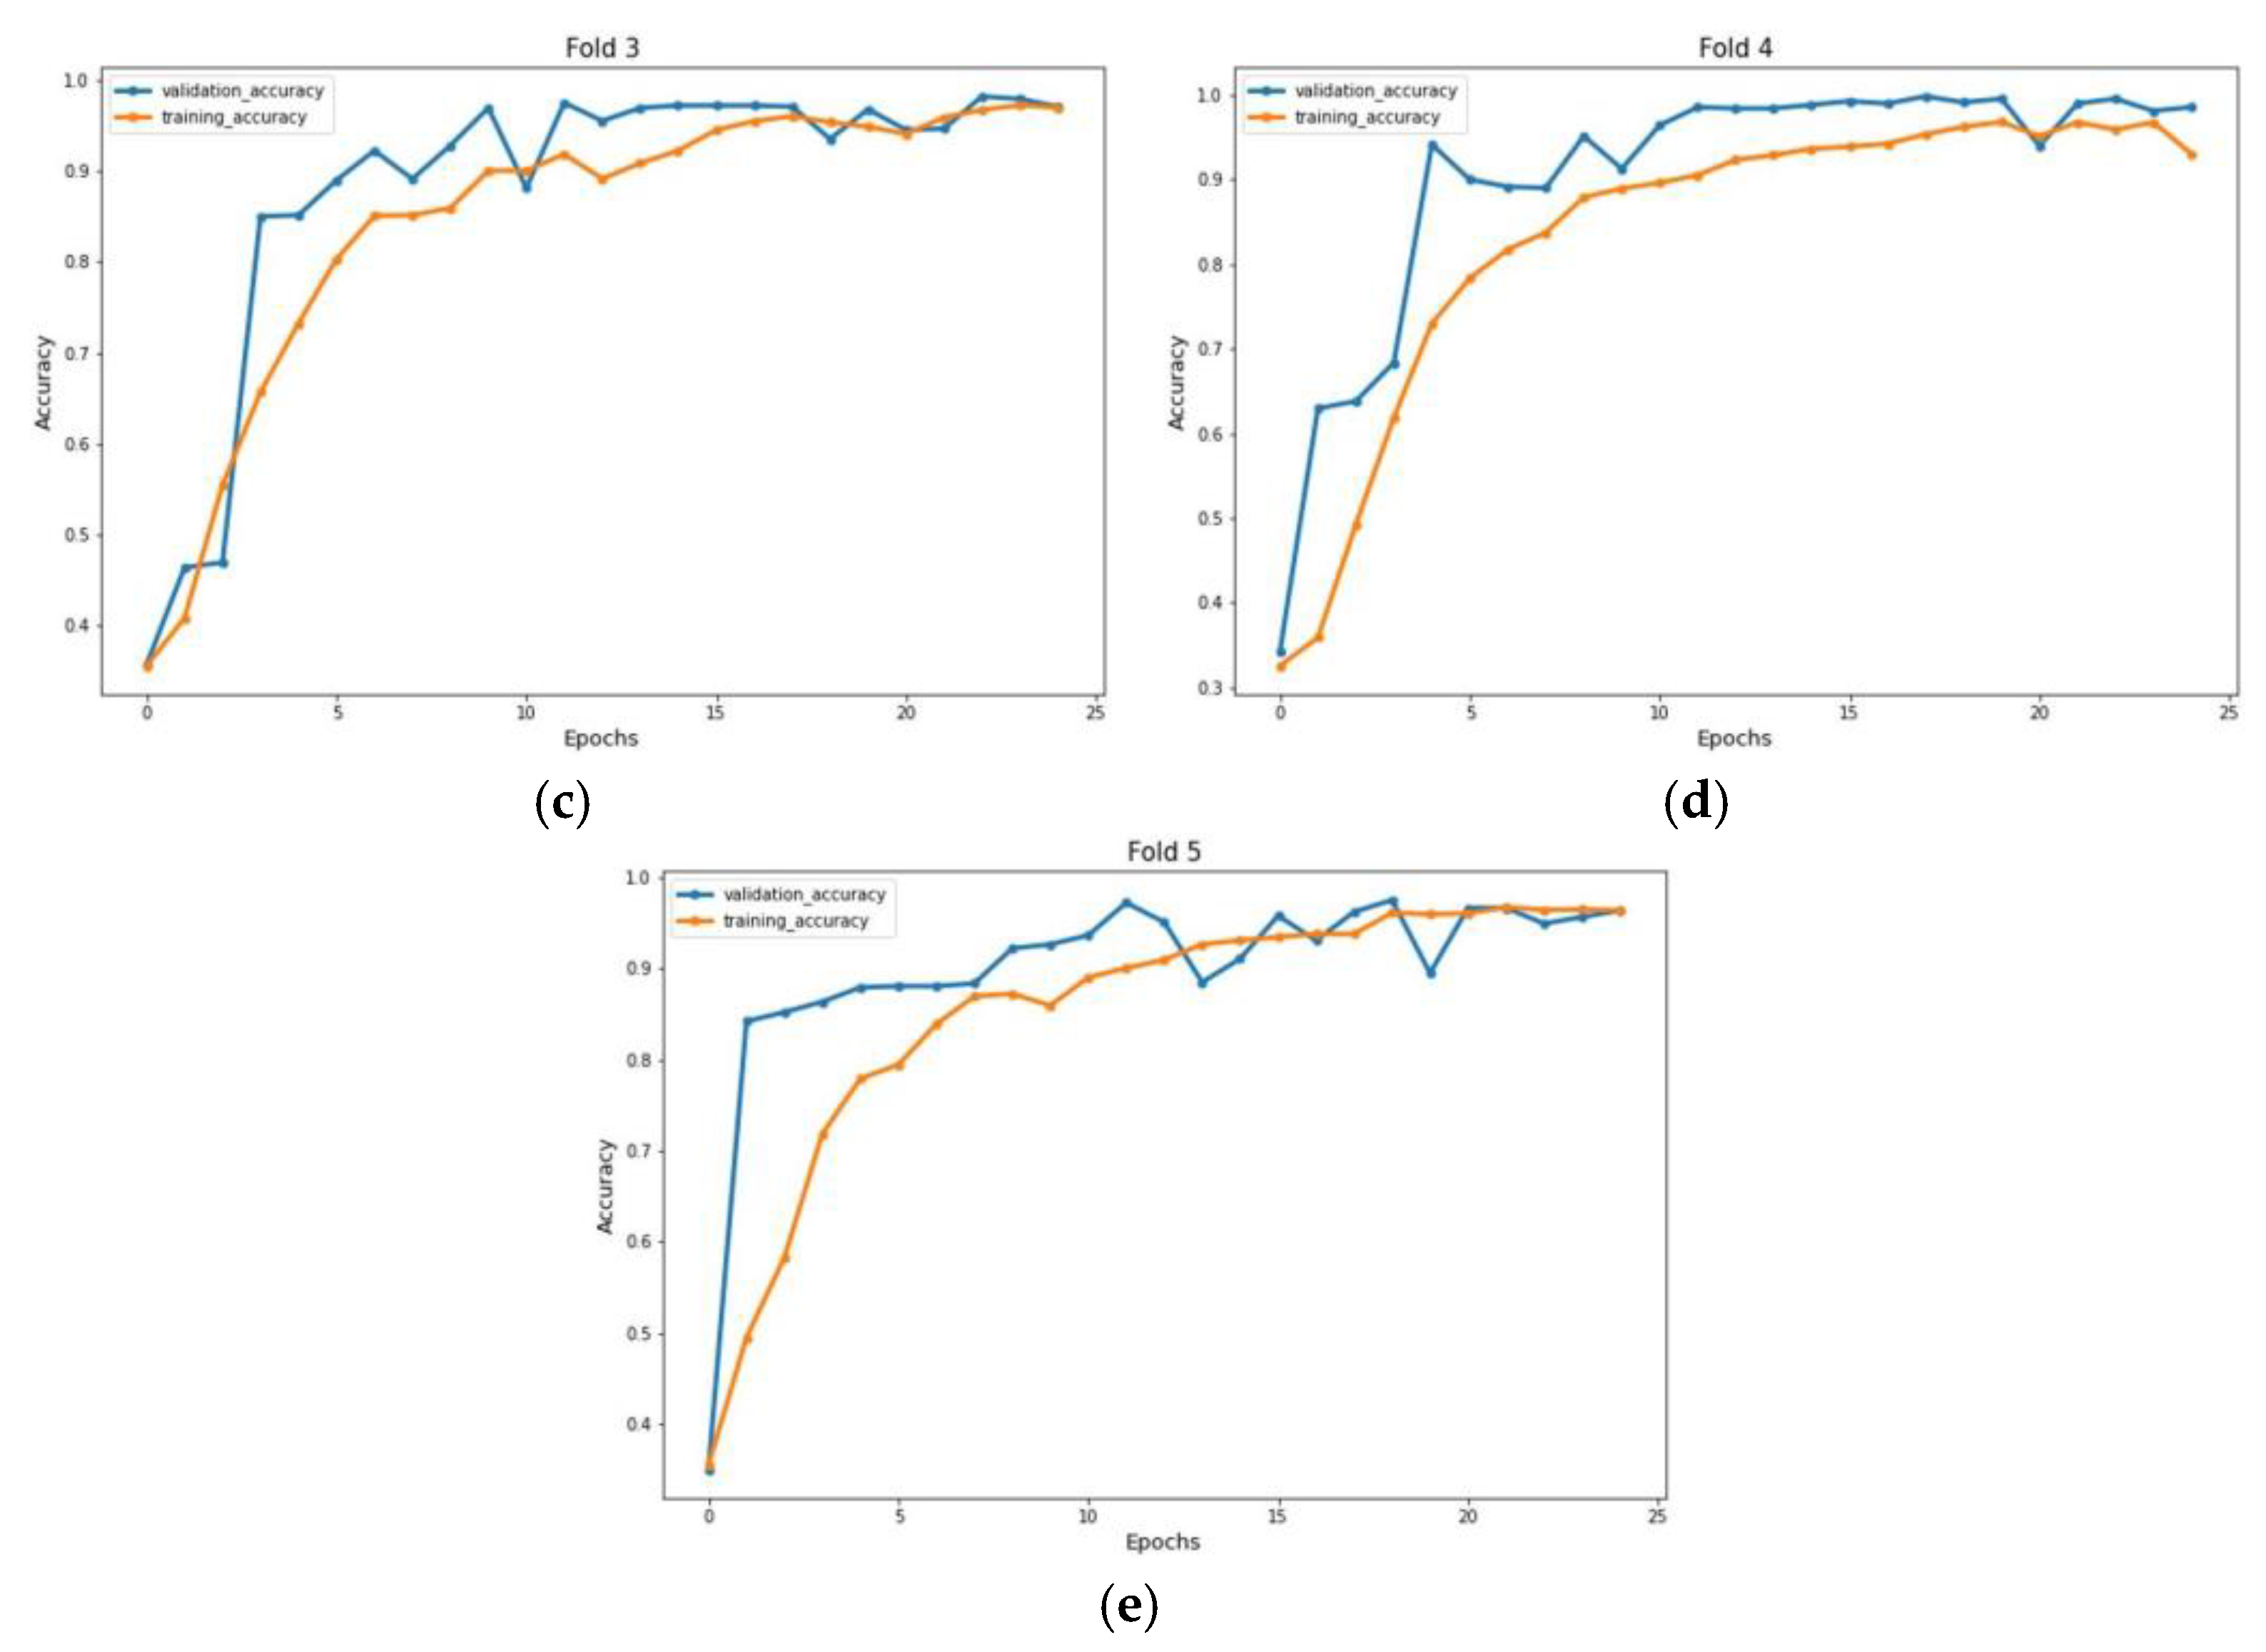
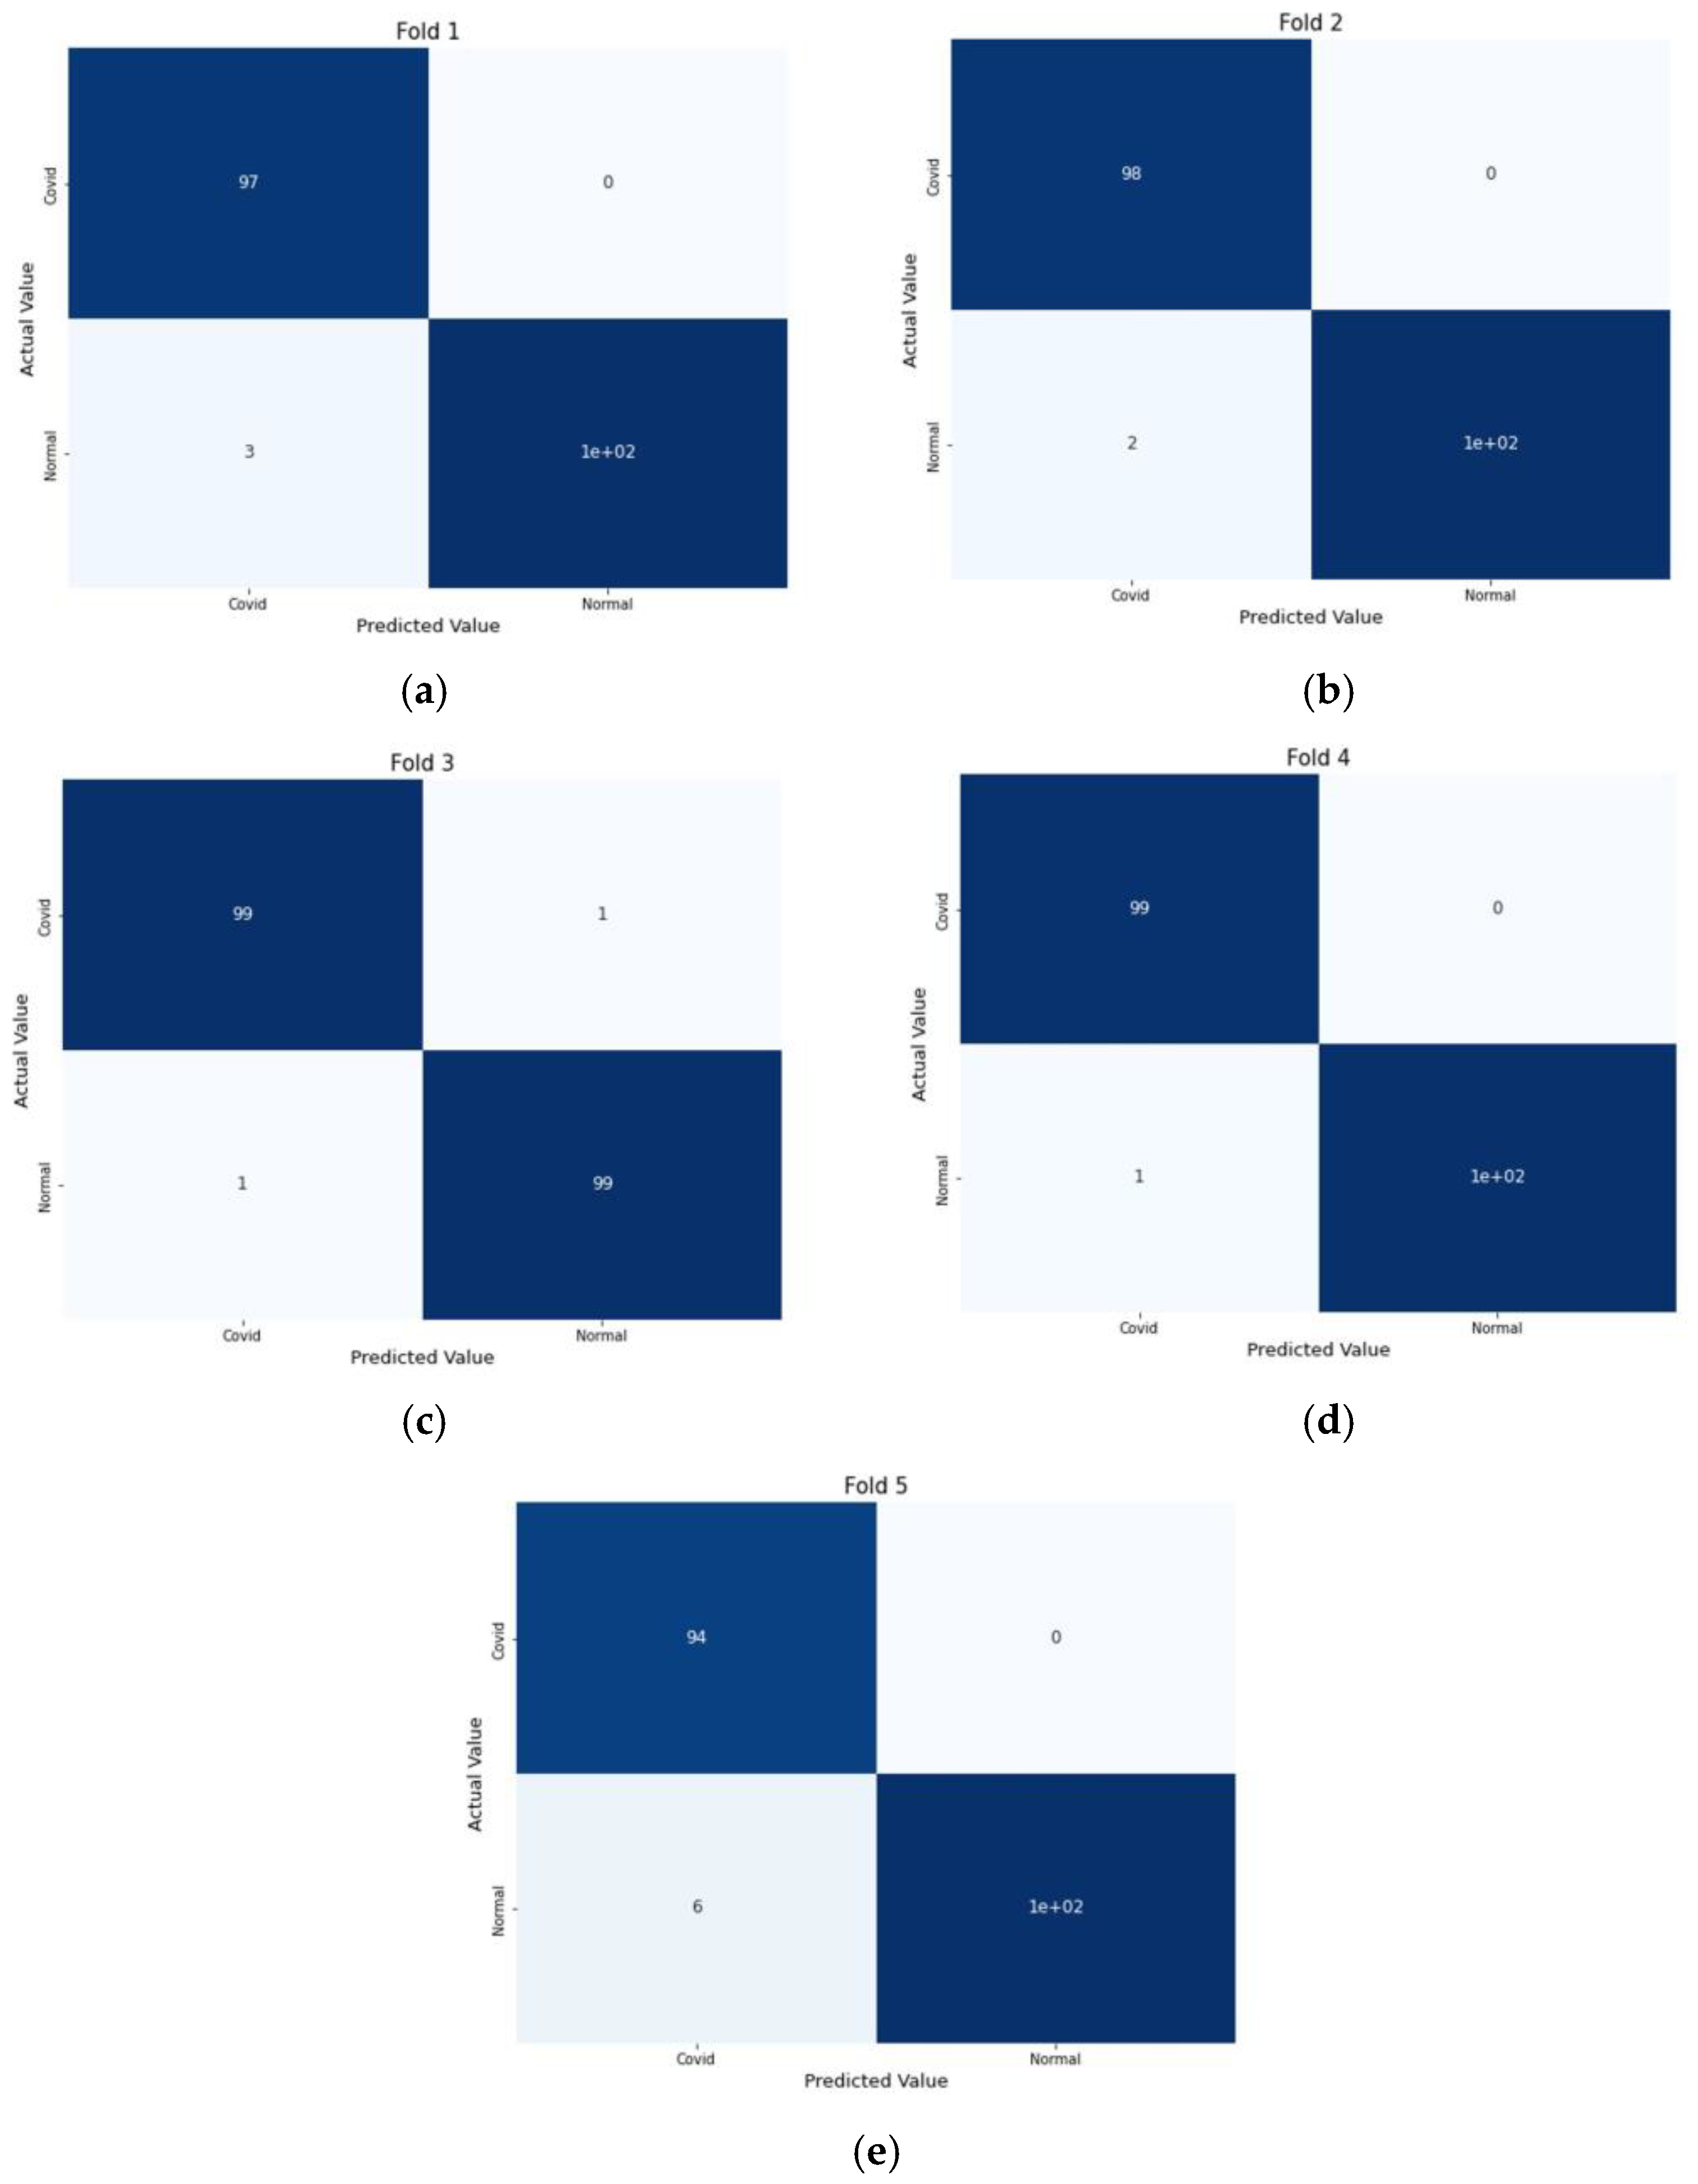
4. 5-Fold Cross Validation

Sometimes, due to the scarcity of a large dataset, a cross-validation approach is utilized in the medical imaging area to evaluate a model’s robustness and performance. The dataset is partitioned into k sections using k-fold cross-validation. One partition is preserved as validation data for testing the model, while the remaining k-1 partitions are used as training data. The cross-validation process is then repeated k times. Consequently, K-fold cross-validation was used to assess the performance of our model, with a k value of 5. For training data, it will be k-1 so four chunks for training data and one chunk for testing data. The cross-validation procedure was carried out five times. Each time, the dataset was shuffled before creating the data chunks. The 5-fold cross-validation’s core mechanism is shown in Figure 6.
Figure 6. 5-Fold Cross Validation.

5. Results and Discussion

The experiment was carried out on two distinct COVID-19 datasets. The first dataset consisted of CT scans images, and the second was X-ray images. This COVID-19 image dataset was compiled from publicly available websites. We used python language in jupyter notebook and employed the Keras library with Tensorflow 2 as a backend. The NVIDIA RTX 32GB GPU was used for the experiment. We trained the model for 25 epochs having a batch size of 64. Moreover, we applied data augmentation using the Keras Image Data Generator function. Our proposed model used a checkpoint to retain the maximum validation accuracy during the epochs training. The training and testing phases do not encompass modifying the chosen hyper parameters except for the loss and activation function in the final layer. Figure 7 and Figure 8 illustrate the accuracy of training and validation data for CT scans and X-ray images for each fold.
Figure 7. Accuracy graph of CT scan images during training phase: (a) Fold 1, (b) Fold 2, (c) Fold 3, (d) Fold 4, and (e) Fold 5.
Figure 8. Accuracy graph of X-ray radiographs during training phase: (a) Fold 1, (b) Fold 2, (c) Fold 3, (d) Fold 4, and (e) Fold 5.
We compute the accuracy, positively predicted value, and negative predicted value on each testing datum from each fold of our dataset to analyze the performance of our proposed model. Here, the ratio of patients diagnosed with positive COVID to all who had positive COVID test results is the positive predicted value. In contrast, the negative predicted value shows the fraction of people who have received a true negative diagnosis for COVID compared to all negative test results of COVID. Table 1 shows the accuracy, positive predicted value (PPV), and negative predicted value (NPV). PPV and NPV are calculated as
P o s i t i v e   P r e d i c t e d   V a l u e = T r u e   P o s i t i v e T r u e   P o s i t i v e + F a l s e   P o s i t i v e
N e g a t i v e   P r e d i c t e d   V a l u e = T r u e   N e g a t i v e T r u e   N e g a t i v e + F a l s e   N e g a t i v e
A c c u r a c y =   T r u e   P o s i t i v e + T r u e   N e g a t i v e T o t a l   N o   o f   P r e d i c t i o n s × 100
Table 1. Model classification performance.
For performance evaluation, the confusion matrix was additionally presented for each fold both for CT scans and X-ray images Figure 9 and Figure 10.
Figure 9. Confusion Metrics for CT scans on 5-fold: (a) Fold 1, (b) Fold 2, (c) Fold 3, (d) Fold 4, and (e) Fold 5.
Figure 10. Confusion Metrics for X-ray images on 5-fold: (a) Fold 1, (b) Fold 2, (c) Fold 3, (d) Fold 4, and (e) Fold 5.

6. Performance Comparison

Table 2 compares the accuracy level between our research and the previous state of the arts. Considering this, the suggested approach is analogous to earlier state-of-the-art research. Compared to prior studies, this study is successful due to two key factors. The lungs portion, the region of interest, was first separated from the original images and given to the proposed CNN model. The second is that, as we are familiar with, CT scan images are processed differently from X-ray images. Thus, we employed two unique datasets of CT scan and X-ray images and proposed a novel light CNN model for extraction. Additionally, we used 5-fold cross-validation on our dataset to assess the stability of our CNN model. It can be seen from Table 2 that the proposed approach significantly outperforms the existing methods with a 98.8% and 98.6% mean accuracy rate.
Table 2. Performance Comparison with previous state of arts.

7. Conclusions

Prevention of the COVID-19 pandemic depends on early diagnosis. For early detection, different states of the arts were proposed by researchers using deep learning models. This work proposed a novel light method for detecting COVID-19 patients from X-ray and CT scan images. One of the most critical elements influencing the accuracy is the segmentation of lung areas in X-ray images. Therefore, we employed watershed-based region-growing segmentation to identify the region of interest in our images. Second, for the feature extraction, we proposed a novel light convolutional neural network model. Comparing our light neural network architecture to the previous state of arts, it requires lower computation power as our model is very light, having only seven convolutional layers, and it is certainly applicable in a realistic scenario, allowing it to perform multimodal COVID-19 detection employing both X-ray and CT scan images. Attributes from multiple datasets will probably have varying sizes and meanings. The CNN architecture should be adaptable to the kind of data we feed to our CNN model to deliver the interpretation and meaning from different datasets. We employ two types of datasets for categorical and binary classification. In order to effectively identify COVID-19, our proposed methodology is quite useful.
Moreover, relatively few publications in the literature employed cross-validation on a dataset, whereas we used 5-fold cross-validations on our dataset. We contrasted the performance of our proposed approach with the most recent ones mentioned in the section related to work. Our model’s performance resulted in the highest accuracy among the models being studied.

Author Contributions

Conceptualization, H.A.K.; methodology, H.A.K.; software, H.A.K. and F.B.; Writing—original draft, H.A.K.; Supervision, X.G.; Funding acquisition, X.G.; Project administration, X.G. and H.A.K.; Formal analysis, F.B.; Writing—review & editing, R.A. All authors have read and agreed to the published version of the manuscript.

Funding

This research received no specific grant from any funding agency in the public or commercial sector.

Institutional Review Board Statement

Not Applicable.

Data Availability Statement

Publicly available datasets were analyzed in this study. These data can be found here: https://www.kaggle.com/datasets/tawsifurrahman/covid19-radiography-database/versions/2 (accessed on 7 July 2022).

Conflicts of Interest

The authors declare no conflict of interest.

References

  1. NHS. Coronavirus (COVID-19) Symptoms in Adults. 2022. Available online: https://www.nhs.uk/conditions/coronavirus-covid-19/symptoms/main-symptoms/ (accessed on 7 July 2022).
  2. WHO. WHO Coronavirus (COVID-19) Dashboard. 2022. Available online: https://covid19.who.int/ (accessed on 7 July 2022).
  3. CDC. Center of Disease Control and Prevention: Covid-19 Testing. 2021. Available online: https://www.cdc.gov/coronavirus/2019-ncov/symptoms-testing/testing.html (accessed on 9 July 2022).
  4. Aslan, M.F.; Sabanci, K.; Durdu, A.; Unlersen, M.F. COVID-19 diagnosis using state-of-the-art CNN architecture features and Bayesian Optimization. Comput. Biol. Med. 2022, 142, 105244. [Google Scholar] [CrossRef] [PubMed]
  5. Gour, M.; Jain, S. Uncertainty-aware convolutional neural network for COVID-19 X-ray images classification. Comput. Biol. Med. 2022, 140, 105047. [Google Scholar] [CrossRef] [PubMed]
  6. Sarki, R.; Ahmed, K.; Wang, H.; Zhang, Y.; Wang, K. Automated detection of COVID-19 through convolutional neural network using chest X-ray images. PLoS ONE 2022, 17, e0262052. [Google Scholar] [CrossRef]
  7. Loey, M.; El-Sappagh, S.; Mirjalili, S. Bayesian-based optimized deep learning model to detect COVID-19 patients using chest X-ray image data. Comput. Biol. Med. 2022, 142, 105213. [Google Scholar] [CrossRef] [PubMed]
  8. Bassi, P.R.A.S.; Attux, R. A deep convolutional neural network for COVID-19 detection using chest X-rays. Res. Biomed. Eng. 2022, 38, 139–148. [Google Scholar] [CrossRef]
  9. Absar, N.; Mamur, B.; Mahmud, A.; Bin Emran, T.; Khandaker, M.U.; Faruque, M.; Osman, H.; Elzaki, A.; Elkhader, B.A. Development of a computer-aided tool for detection of COVID-19 pneumonia from CXR images using machine learning algorithm. J. Radiat. Res. Appl. Sci. 2022, 15, 32–43. [Google Scholar] [CrossRef]
  10. Aftab, M.; Amin, R.; Koundal, D.; Aldabbas, H.; Alouffi, B.; Iqbal, Z. Classification of COVID-19 and Influenza Patients Using Deep Learning. Contrast Media Mol. Imaging 2022, 2022, 8549707. [Google Scholar] [CrossRef]
  11. Muralidharan, N.; Gupta, S.; Prusty, M.R.; Tripathy, R.K. Detection of COVID19 from X-ray images using multiscale Deep Convolutional Neural Network. Appl. Soft Comput. 2022, 119, 108610. [Google Scholar] [CrossRef] [PubMed]
  12. Islam, M.R.; Nahiduzzaman, M. Complex features extraction with deep learning model for the detection of COVID19 from CT scan images using ensemble based machine learning approach. Expert Syst. Appl. 2022, 195, 116554. [Google Scholar] [CrossRef]
  13. Kogilavani, S.V.; Prabhu, J.; Sandhiya, R.; Kumar, M.S.; Subramaniam, U.; Karthick, A.; Muhibbullah, M.; Imam, S.B.S. COVID-19 Detection Based on Lung Ct Scan Using Deep Learning Techniques. Comput. Math. Methods Med. 2022, 2022, 7672196. [Google Scholar] [CrossRef] [PubMed]
  14. Huang, M.-L.; Liao, Y.-C. A lightweight CNN-based network on COVID-19 detection using X-ray and CT images. Comput. Biol. Med. 2022, 146, 105604. [Google Scholar] [CrossRef] [PubMed]
  15. Baghdadi, N.A.; Malki, A.; Abdelaliem, S.F.; Balaha, H.M.; Badawy, M.; Elhosseini, M. An automated diagnosis and classification of COVID-19 from chest CT images using a transfer learning-based convolutional neural network. Comput. Biol. Med. 2022, 144, 105383. [Google Scholar] [CrossRef] [PubMed]
  16. Hasija, S.; Akash, P.; Hemanth, M.B.; Kumar, A.; Sharma, S. A novel approach for detection of COVID-19 and Pneumonia using only binary classification from chest CT-scans. Neurosci. Inform. 2022, 2, 100069. [Google Scholar] [CrossRef]
  17. Canayaz, M.; Şehribanoğlu, S.; Özdağ, R.; Demir, M. COVID-19 diagnosis on CT images with Bayes optimization-based deep neural networks and machine learning algorithms. Neural Comput. Appl. 2022, 34, 5349–5365. [Google Scholar] [CrossRef]
  18. Chowdhury, M.E.H.; Rahman, T.; Khandakar, A.; Mazhar, R.; Kadir, M.A.; Mahbub, Z.B.; Islam, K.R.; Khan, M.S.; Iqbal, A.; Al-Emadi, N.; et al. Can AI help in screening Viral and COVID-19 pneumonia? IEEE Access 2020, 8, 132665–132676. [Google Scholar] [CrossRef]
  19. Soares, E.; Angelov, P.; Biaso, S.; Froes, M.; Abe, D. SARS-CoV-2 CT-scan dataset: A large dataset of real patients CT scans for SARS-CoV-2 identification. medRxiv 2007, 2020.04.24.20078584. [Google Scholar]
  20. Teixeira, L.O.; Pereira, R.M.; Bertolini, D.; Oliveira, L.S.; Nanni, L.; Cavalcanti, G.D.C.; Costa, Y.M.G. Impact of Lung Segmentation on the Diagnosis and Explanation of COVID-19 in Chest X-ray Images. Sensors 2021, 21, 7116. [Google Scholar] [CrossRef]
Disclaimer/Publisher’s Note: The statements, opinions and data contained in all publications are solely those of the individual author(s) and contributor(s) and not of MDPI and/or the editor(s). MDPI and/or the editor(s) disclaim responsibility for any injury to people or property resulting from any ideas, methods, instructions or products referred to in the content.

Article Metrics

Citations

Article Access Statistics

Multiple requests from the same IP address are counted as one view.