Abstract
Circular economy and Industry 4.0 principles are increasingly shaping industrial practices. In the textile sector, environmental impacts and low recyclability make circularity a critical priority. This study focuses on enhancing both circularity and operational efficiency in a Portuguese manufacturer of labels and trimmings. Achieving this requires the collection of relevant data and identification of the factors that most influence operational performance, while linking these to circularity outcomes. To support this effort, the paper presents two complementary methodologies: Multi-layer Stream Mapping (MSM) for evaluating manufacturing efficiency and the Overall Circularity Index (OCI) for assessing circularity performance. MSM provides a detailed analysis of process efficiency, identifying sources of waste and summarizing results through user-friendly scorecards that highlight high-impact improvement areas. The OCI measures a company’s circularity on a scale from 0 to 1—where 1 represents full circularity—using strategic indicators across environmental, material, economic, and social dimensions. The MSM revealed an overall efficiency of 71%, whereas the OCI resulted in a final score of 0.516. When applied together, MSM and the OCI form a straightforward, iterative, and effective framework for diagnosing strengths and weaknesses in the manufacturing process, supporting evidence-based decision-making and guiding the company’s transition toward more circular and efficient operations.
1. Introduction
The circular economy (CE) is a renowned concept that aims to reduce the exploitation of natural resources and minimize waste, taking into consideration social changes, environmental protection, and socioeconomic benefits [1,2,3]. The linear method of production and consumption is contributing to the corrosion of ecosystems as a result of climate change and environmental contamination [4]. The European Union (EU) has pushed the subject even further, urging the adoption of greener supply chain practices by implementing goals and measures for industries in Europe [5]. The circular economy can facilitate the achievement of sustainable development, which encompasses the improvement of environmental quality, the promotion of economic prosperity, and the attainment of social inclusiveness [1,5]. With the aim of achieving a sustainable equilibrium between environmental protection and industrial development, numerous industries have turned their attention to the concept of the CE, which they view as a vital economic direction for the upcoming future [1].
In light of these developments, the evolution of Small- and Medium-sized Enterprises (SMEs) towards a reduced environmental impact, which takes into consideration technological alterations and social changes, has become a priority for the worldwide outline [2]. The transition to a CE presents a weighty challenge, requiring innovative approaches to material design, product life extension, and waste management systems [6]. Companies ought to adopt new policies that are sustainable and improve the circularity of their product by reducing the need for virgin materials and increasing the recyclability, reusability, and durability of their products [7]. The textile and clothing industry, as one of the most harmful industries to the environment and accounting for more than 37% of total European industrial activity, is particularly concerning when it comes to circularity due to the lack of recyclability of the products and the large volumes of energy and water used for the manufacturing process [8,9,10,11,12,13]. The textile industry is responsible for the consumption of 98 million tons of non-renewable resources on an annual basis, including oil and the raw materials utilized in the production of fertilizers and treatment chemicals [14]. It ranks third in water and land use and fifth in resource use and greenhouse gas emissions [11]. Textile consumption has the world’s third largest negative impact on the environment and climate change, after food and housing and transport [11]. Globally, annual textile consumption has risen from 7 to 13 kg per person, exceeding 100 million tons [11]. Nevertheless, some solutions regarding a circular economy may be applied in the textile industry, such as utilizing waste by-products [12]. When textile waste is discarded, 73% of it is either burned or landfilled, 12% is recycled, and only 1% is reused [15]. One of the core principles of the CE is that waste can be viewed as a resource for the creation of future products. This implies that all materials and products can be regarded as temporary reservoirs of materials or nutrients, which will then be incorporated into new products after their respective lifecycles [16]. Therefore, a closed-loop CE supply chain in the textile industry, which can be defined as “the design, control, and operation of a system to maximize value creation over the entire life cycle of a product with dynamic recovery of value from different types and volumes of returns over time”, can be a way to develop a system to address the 9Rs, i.e., refuse, rethink, reduce, reuse, repair, refurbish, remanufacture, repurchase, recycle, and recover, which can eliminate the gaps in the environment protection system of the whole manufacturing process [12,17].
Sustainable directives, defined by the EU, and the sustainable development goals (SDG) defined by the United Nations have pushed companies towards commitment, so the need to properly assess circularity has risen, which leads to the development of assessment methodologies. These assessment methodologies are able to assess the circularity of products by taking a life cycle perspective, considering all phases, such as the extraction of raw materials, manufacturing process, and lastly, the end of life, either by disposal or recycling. As stated by the Ellen MacArthur Foundation, the implementation of a CE in the textile industry offers a sustainable and regenerative approach to minimize waste and environmental impact, which emphasizes the design, production, and application of textiles in a manner that promotes durability, use, recycling, and responsible disposal [8]. The Material Circularity Indicator (MCI) by Ellen MacArthur is a tool for measuring how circular the material flows of a product are, resulting in a score between 0 and 1. A higher value means more circular material flows. Its limitation includes the narrow focus on technical cycles, without reflecting the different qualities of recycling (e.g., downcycling vs. closed-loop recycling) [7,9]. The MCI is founded upon a material flow analysis, which gauges the maximum restorative flow and the minimum linear flow of a given product [10]. In addition to the product-only assessment, there are also methodologies that go further by evaluating a company’s circularity as a whole. The Sustainable Circularity Index (SCI), as one example, also creates an index with a score between 0 and 1, but it focuses on four dimensions instead of just the material aspect of the product [18]. The four dimensions (environmental, economic, social, and circularity) cover Key Performance Indicators (KPIs) of the target company, which are then attributed a certain weight according to their importance [18]. The KPIs then undergo a normalization process and, finally, the index is constructed by an aggregation method. Its limitation lies with the single focus on indicators that assess the harm the product creates, rather than the comprehensive vision of it [18]. Another methodology worth noting is one that assesses circularity in building construction and its refurbishment activities [19]. It focuses on three key aspects: energy, water, and materials consumption, while also regarding the social and economic impacts. The use of KPIs is also approached in this assessment of the construction process as well as the indexes for all key areas [19]. The Circularity Measurement Toolkit comprises Framework Development, Verification, and Validation, and is designed to assist SMEs in refocusing on environmental initiatives and organizing data for circularity assessments [20]. An approach focused on SMEs entails the creation of a model for calculating a Composite Sustainable Development Index, which tracks social, environmental, and economic performance over time [21]. The Circularity Indicators Project Methodology places significant emphasis on the utilization of circularity indicators, with the MCI serving as the primary metric for the assessment of the restorative aspect of a company’s material flows, which are defined as the proportion of materials that are reused or recycled [7].
Even though there are a few methodologies previously developed to quantify the level of circularity, these may or may not be satisfactory depending on the target of such assessment. Currently, the methodologies are not mainly focused on the circularity of industrial processes, but rather the product itself, considering both the sustainability component as well as the material and waste management of the product. If the target is a manufacturing process, then the methodologies discussed so far are not applicable. In that case, a methodology that could assess the environmental impact of the process and the product, as well as the human interaction and the economic advantage of the product’s production, would provide a complete circular analysis. Such is the capability of the Overall Circularity Index (OCI), a newly designed framework [22], which will be implemented to determine the circularity index of a Portuguese textile company. Considering the impact of the production process in terms of resources consumption (raw materials, energy, and water, among others), it is important to combine OCI with a methodology that assesses the overall performance of the manufacturing process. The Multi-layer Stream Mapping (MSM) approach was implemented in this work for this purpose. In addition to evaluating the productivity and the efficiency of the resources used, this method allows us to determine costs related to process inefficiencies, as presented in previous studies [23]. By using an intuitive scorecard, MSM is a relevant tool for decision support, identifying the process steps that induce stronger inefficiencies in terms of resource consumption and the operational domain. Even though MSM has never been applied to the textile industry, it is easily adaptable for this kind of industrial process.
By combining MSM with the OCI, a complete analysis showcasing the strengths and weaknesses of the process on all aspects can be conducted. While the OCI provides a wider and critical viewpoint of the process, taking into account the whole “loop” of the product, MSM provides a detailed and focused outlook on the manufacturing process, providing important data that can complement the circularity analysis of the company. In this context, this work focuses on the implementation of both MSM and the OCI as an integrated application for the evaluation of the process efficiency and circularity index of a textile company, providing a relevant contribution for the industrial sector by integrating a simple and intuitive framework that clearly identifies the critical factors that impact the circularity index. With this analysis, important guidelines will be provided in order to improve the overall performance of the manufacturing process, consequently improving the overall circularity index.
2. Materials and Methods
2.1. Multi-Layer Stream Mapping (MSM)
The MSM approach was designed with the goal to assess a production process and resource efficiency by mapping the process’ system [24]. It is intended to be a tool for analytical mapping and support decision-making in terms of operational management. The MSM tool gathers a number of KPIs analyzed for the system and divides the production process in steps and sub-steps, presenting them in a dashboard visually resembling a matrix. Figure 1 illustrates an example of the structure of the MSM tool, showing process steps at the top line and KPIs in the first column. The results are presented in terms of efficiency [24].
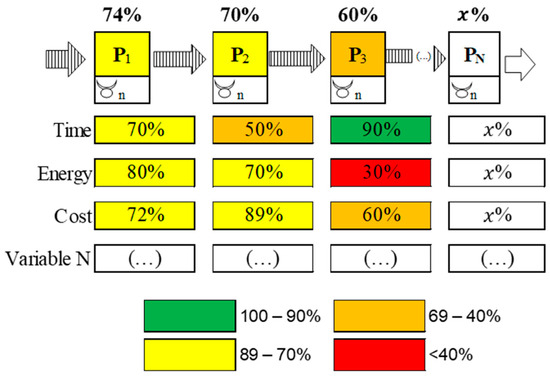
Figure 1.
MSM structure example and colour map (P as in phase of a certain process, as a given efficiency).
To deploy the MSM tool, the following steps must be performed:
- Identification of the system’s boundaries and process phases. In this step, the chosen process must be broken down into phases and tasks/activities, ideally with participation of the production team (operators and process manager, etc.) to identify the relevant variables to evaluate.
- Definition of the types of KPIs to be used for each of the previously identified variables (always ranging from 0 to 100%).
- Identification of the Value Added (VA) and Non-Value Added (NVA) activities that compose each process phase, when possible.
- Definition of reference values (expected values, historic results, and industry standards, etc.) for KPIs that cannot be measured by VA and NVA segregation.
- Analysis of the results, identifying the most inefficient variables/stages, prioritizing and studying improvement actions.
- Implementation of improvement actions and assessment of gains achieved in terms of efficiency and cost reduction.
For better visual management practices, the MSM tool presents the results in a dashboard with a colour scale associated with a range of efficiencies (red if the score is <40%, orange if 40% ≤ score ≤ 69%, yellow if 70% ≤ score ≤ 89%, and green if score ≥ 90%), as depicted in Figure 1.
2.2. Overall Circularity Index (OCI)
The OCI works as a step-by-step methodology, as suggested by Figure 2. The “Target characterization” phase serves as a preliminary step of the methodology, where the assessor must define precisely what it must be evaluated, for example, a product, a process, or a company, etc.
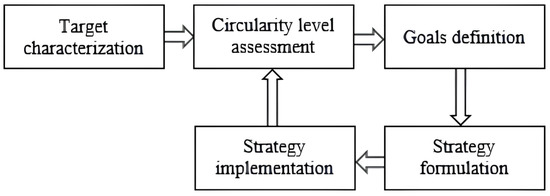
Figure 2.
Methodology strategy scheme [22].
After defining the target to evaluate in the “Circularity level assessment” phase, a few KPIs segregated by four domains—environmental, material, economic, and social—are defined and indexes are calculated. For each domain, a group of KPIs is defined in order to characterize the target in that specific domain. The environmental KPIs focus on energy usage and sources, effluents, emissions, water usage, and anything that causes a negative environmental impact. As for the material KPIs, these address the recyclability, reusability, and second life of whatever product is being assessed, or even the consumables used in the process. The economic KPIs are about the economic sustainability of the target and the rewards of adopting circular practices. Lastly, the social KPIs depicts the human interaction, worker satisfaction, and overall impact that the target has on the community. Assessing social indicators is crucial in CEs because it ensures that the transition from a linear to a circular model not only benefits the environment and economy, but also supports social well-being, equity, and inclusiveness in the company [25,26].
After selecting all the KPIs, the data collected goes through a normalization process, as the data comes in different units and the KPIs cannot be compared between them. The normalization process transforms the data into scores between 0 and 1, according to the criteria defined, for each KPI. The average of the group of KPI scores in each domain make the domain’s index. Then, the OCI is the result of the average of the domains’ indexes. The company is free to assign weights to the domains it deems more or less important. For example, if the environment is a strategic priority to a company, then its weight could be 40% and the other domains would have less weight. The closer the final index is to 1, the more circular the target is.
After this assessment, in the “Goals definition” phase, the evaluator may interpret the results obtained, confirming which weaknesses lower the OCI and which strengths increase it. The assessor sets objectives to improve the circular indexes in this phase. Then, in the “Strategy formulation” phase, the evaluator devises a plan to correct and improve the weak points revealed in the low-scoring KPIs. Depending on the domain and the set of KPIs, different strategies must be planned. It is in this phase that the assessor must find exactly what is undermining the target’s circularity. There are some pre-determined ideas for each domain: for the environmental and material domains, the inefficiencies of the process can be revealed through the MSM methodology as a way to find which issues should be tackled. Changes in the product’s design may also affect both domains. For the social domain, questionnaires are the simplest ways to obtain feedback and find possible solutions to potential problems; the changes in the economic domain are mostly dependent on the other domains.
The changes to the target will be made in the “Strategy implementation” phase according to the devised plans, upgrading the target to reach the new goal for the OCI. After all the strategized changes are made, the evaluator must recalculate all the indexes and collect the new data for the same set of KPIs, returning to the “Circularity level assessment” phase. The resulting new OCI will then reveal new weaknesses and the evaluator then repeats the whole process, working on increasing the circularity of the target in a continuous improvement way. Further details can be found in [22].
2.3. Use-Case Description
The two methodologies, MSM and the OCI, were applied on a Portuguese labels and trimmings company (a form of textile industry), focusing on the factory where they produce elastics bands, cords and laces, badges, labels, and straps from yarn to sell to various types of industries, including the automotive and clothing industry.
The company receives yarn feedstock that follows either the “Jacquard” or “Ratière” process, each producing different types of products. The “Ratière” route uses a single web thread and mainly elastic yarn. It begins with beaming, where yarns are prepared by colour, quantity, and material according to client specifications and arranged for weaving. The prepared loom is then assembled, and weaving proceeds through shed opening, weft insertion, and the beating rhythm that compacts the threads into fabric. After weaving, the product moves to dyeing and then to finishing.
“Jacquard” weaving allows for complex designs because each web thread can be individually controlled and different wefts can be inserted in each passage. Most web bodies for this process are purchased, while smaller ones are produced in the beaming section. The operator uploads the design electronically and supplies the loom with the required wefts, as defined in the service order. The finished weave then passes through cutting and final finishing before shipment. The application of both methodologies, MSM and the OCI, focused on these two production lines.
2.4. Methodology Implementation—MSM
After the identification of the process phases, the KPIs were selected for the efficiency assessment of both the “Jacquard” and “Ratière” processes. This selection was conducted conjointly by the research team, with the company’s validation, ensuring that the KPIs reflected the most critical areas of focus. The selected KPIs were then grouped into three main categories, as presented in Table 1, which monitored operational performance; resource management focused on raw material consumption and sustainability through recycled material usage and cost efficiency targeted the control of costs like materials and labour. Moving forward, the next steps in the MSM implementation involved the identification of VA and NVA activities within the production process, followed by defining reference values for KPIs that could not be measured by VA and NVA segregation.

Table 1.
List of efficiency key performance indicators.
2.5. Methodology Implementation—OCI
Following the OCI methodology’s order of thinking, a set of KPIs was defined with the aid of the company to create a baseline. The set of KPIs was devised by selecting indicators whose data were possible to measure and the company had interest in analyzing in the future. Taking the factory and the manufacturing process as the targets, the four groups of KPIs can be visualized in Appendix A, segregated by domain.
The environmental group of KPIs touch on various important matters such as energy, waste, and water management, as well as emissions. The renewable energy percentage indicates the auto consumption of electricity, and it is more advantageous the more the company produces its own energy. The total energy usage should be as low as possible while maintaining the same productivity level. The machine efficiency, actually provided by the MSM assessment, evaluates if the production machines of the “Jacquard” and “Ratière” processes have an efficient use, as they are responsible for most energy usage in the factory. Heat recovery is a system planned to be installed in the dyeing room, as considerable heat is produced in the process. The pollutant gases are measured throughout the chimneys present across the shop floor. During manufacturing, some wastes are generated, either originating from the feedstock or the consumables of the process. These wastes fall into one of two categories—dangerous or non-dangerous for the environment. The company classifies the wastes based on legal procedures set by the community and registers them accordingly. Although the process does not require much water, the company still records it and has a way to reuse it.
The material KPIs could be divided into two groups, one that concerns the feedstock management and one that concerns the rest of the consumables. The first three material KPIs evaluate the quantity of virgin, reutilized, and recyclable feedstock incorporated in the products. The wasted feedstock rate in the process registers the natural waste that the manufacturing process has in its phases, as some of it is always lost amid it. The last three material KPIs reflect the management of consumables like plastic, paper, cones, and coils, etc. Consumables that are needed during the various phases of the process (to transport, hold, and save, etc.) and that can be reutilized or recycled are recorded as well as those that simply go to landfill.
The economic KPIs account for the investments made in sustainable matters, such as the company’s instalment of solar photovoltaics to produce its own electricity. A simple way to measure this is by calculating the return of investment (ROI), whose value increases the longer it has been since the instalment. The productivity of the manufacturing process is also assessed here as a way to measure the financial sustainability of the factory. Other circular activities that could translate to financial gains are represented in the “Sale of residues” and “Product post-use policies” KPIs. The “Gross cost of opportunity” represents the lost possible gains as feedstock is thrown away to landfill instead of being sold.
Finally, the social KPIs attempt to gauge the workers’ satisfaction, well-being, and equality in the company. It serves to measure the social aspect of circularity and how sustainable the company is in the matter. As the company transitioned from a linear to circular economy, it was seen as important to track how new circular strategies affect people, jobs, and well-being.
The data necessary for the KPIs were measured through various methods. Sensors (ex: flowmeters) and energy analysers installed in the factory were able to collect data for most of the environmental KPIs (Renewable energy percentage, Total energy usage in factory, and Water circularity rate and usage in the process). “Pollutant gas emissions”, for example, was the only KPI only measured on audits, once a year. Most of the KPIs of the other domains were measured through a manual registry of the company’s enterprise resource planning (ERP) and a few calculations. Most of the consumables were already registered on a monthly basis and by production stage by the company. All the material usage and losses were converted in kilograms, the energy in kilowatt-hours, and ratios in percentages. All the information was compiled and organized in an excel file, segregating the data by month, and then the average of the 12 months dictated the final value for each KPI. The data used to create the baseline was relative to the year 2023.
After all the data were gathered, the next step was to use a normalization process to convert all the different data into scores ranging between 0 and 1. The normalization method used was Multiple-Attribute Decision Making (MADM) [27], where one of three different equations is used depending on the condition if the indicator variable satisfies “the larger the better” condition, “the smaller the better” condition, or approaches the ideal value. The minimum, maximum, and ideal values were defined for each KPI that needed to go through the normalization process. Due to the lack of existing benchmarks and published studies for this type of industry (trimming and label), the minimum/maximum/ideal values were based on the company’s data in the five previous years. These data dictated the reference values for each KPI.
3. Results
3.1. Efficiency Analysis Results
The process’ efficiency analysis was conducted using a set of KPIs, presented in Section 2, to measure various operational aspects. Each KPI was assessed against a reference value, allowing for a clear understanding of the company’s current performance in comparison to industry benchmarks or ideal internal targets. These reference values are critical for evaluating where the company stands in terms of operational efficiency, resource usage, and costs, providing actionable insights into areas for potential improvement. By examining metrics such as productive time, conformity rate, production flow, and material consumption, the analysis revealed how closely the company’s operations aligned with best practices, as well as opportunities for increasing sustainability and reducing waste. Below was the rationale behind each KPI’s efficiency calculation:
- Productive Time: Based on the total available time for the machines. While VA time was considered when the machines were actively working, NVA time was used when the machines were turned on but not operating. The machines considered for the VA/NVA data were all the machines the yarn had to go through, either in the “Jacquard” or the “Ratière” processes, including the weaving, beaming, and finishing machines. This metric reflects the efficiency in utilizing the machines’ operational time to generate production.
- Conformity Rate: This KPI was directly measured by the company’s quality control team. The reference value came from the proportion of products that meet the required specifications, indicating the quality of the production output.
- Production Flow: Calculated by dividing the total volume produced by the productive time. The reference value used for comparison was based on an ideal scenario where the productive time reaches 100%. This helped the company understand how delays or inefficiencies in the process impact output.
- Raw Material Consumption: Based on actual data provided by the company. To evaluate efficiency, a reference value was established, which represents the raw material that would have been consumed if the company had achieved only a 1% reject rate, corresponding to a 4-sigma level of quality. This KPI highlights potential material waste due to quality issues.
- Recycled Material Usage: The reference value was derived from industry benchmarks, with McKinsey indicating that the textile industry should aim for a recycled material usage rate between 18 and 26% by 2030 [28]. An 18% target was chosen for this analysis to assess how the company aligns with future sustainability goals.
- Sustainable Energy Consumption: The reference value for this KPI was based on the average rate of solar energy usage in Portugal, reflecting the company’s alignment with national trends in sustainable energy adoption.
- Material Cost per Production: The reference value was set based on historical data from the company’s previous production runs. This allowed the company to track how changes in efficiency impact production costs over time.
- Labour Cost per Production: Measured against a reference value where a 100% conformity rate was achieved. This provided insight into how labour efficiency is affected by variations in production quality.
- Total Operational Cost: Calculated as a cumulative measure of all the reference costs. This KPI provides a comprehensive view of how changes in efficiency, quality, and material consumption affect the overall cost of production.
- Cost of Non-Quality: This KPI evaluates the cost impact of defects and quality issues. The reference value was set assuming a 99% conformity rate, corresponding to a 4-sigma level of quality. By comparing actual costs to this benchmark, the company can assess the financial impact of quality-related inefficiencies.
With that, the efficiency results of the company were structured following the MSM’s scorecards, as presented in Figure 3. Through the methodology’s typical colour scheme, it was possible to identify the areas with strong performance, while highlighting the metrics that require further attention. This method also facilitated an immediate comparison between the process phases, offering an intuitive overview of the key areas to improve.
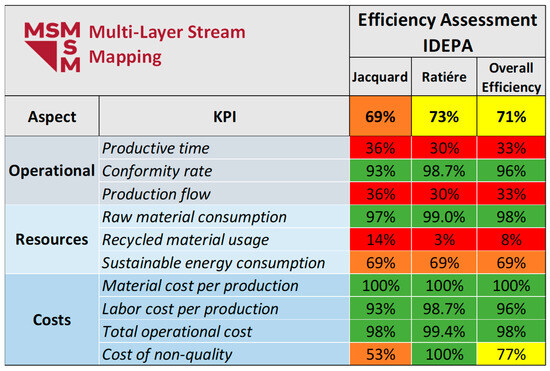
Figure 3.
MSM scorecard results (100% to 90% green highlight; 89% to 70% yellow highlight; 69% to 40% orange highlight; less than 40% red highlight).
While the results present an average overall efficiency (71%), several potential areas for optimization can be observed, particularly, productive time, production flow, and recycled material usage, which significantly underperform relatively to other KPIs. The low efficiency in productive time and production flow indicates operational bottlenecks or downtime issues, suggesting that there might be inefficiencies in the coordination between process phases or resource allocation, which should be addressed to increase throughput.
That is particularly important, when understanding the origin of the NVA data. The VA and NVA data were collected from the “Jacquard” and “Ratière” machines over the 2023 year, segregating the number of hours by months. Machine status (processing, stopped, and idle with machine running) was recorded using the machines’ internal monitoring systems and validated by the operators to ensure reliability. NVA time was defined as periods during which the machines were powered and operational but not actively processing material, thereby consuming energy without generating output.
Similarly, the utilization of recycled materials presents an opportunity for improvement to enhance the company’s sustainability and reduce overall material costs. However, it is important to note that the reference value used is a desired value for 2030, indicating that this metric should not be considered as a definitive performance result for the current year, but rather a reflection of how far the process is from the 2030 objective. Meanwhile, metrics such as raw material consumption, operation costs, and conformity rate attained values close to the reference consumption, which contributed with the overall efficiency results.
3.2. Circularity Assessment Results
Before calculating the scores, the user first must indicate which KPIs fit which criteria so that the equations are correctly applied. If it fits the “the larger the better” condition, then Equation (1) should be applied, where corresponds to the value obtained in 2023 and corresponds to the reference value obtained through the average of the past five years.
For the “the smaller the better” condition, Equation (2) should be used, as it is the inverse of Equation (1).
If the results of either equation surpass the value of one, then the score stays as one. If the resulting scores have a value below 0, then the score stays as 0. The rest of the KPI data can be turned to an index without the need to collect the data of previous years, as they come in percentages or ratios.
The environmental indicators that follow the “the smaller the better” criteria are identified in Table A1 in Appendix A. The rest of the indicators whose data comes in percentage form have their data directly converted into indexes, called the “direct conversion” criteria.
For the material indicators, Table A2 shows the criteria used for their index calculation, either by “the smaller the better”, “the larger the better”, or a direct conversion. There are some KPIs that follow a specific formula, identified as “other”. The index for the “Percentage of virgin material in the product” was calculated by comparing the virgin material rate applied in the product with the minimum virgin material rate possible, according to the company’s standards. The index of the “Quantity of reutilized consumables” indicator is the ratio between the real quantity registered of reutilized consumables and the possible estimated one.
The criteria for the economic KPIs are shown in Table A3. As for the “other” criteria KPIs, the ROI indicator follows its own formula and the “Sale of residues” index represents the residues sold among the total generated. The “Product post-use recovery politics” indicator values any type of strategy that enables the reselling or reutilization of the company’s products after sale, contributing to an extension of the lifecycle of the product while providing a financial advantage to the company.
At last, the social KPI’s index calculation criteria are identified in Table A4. For the “Annual training hours per worker” indicator to reach a score of 1, the company must provide its workers the standard 40 h of training in 2023. It should be noted that the productivity indicators in this domain correspond to workers’ productivity, measured by speed of task completion.
After all the calculations, each domain results in a sub-index, which is the average of all the KPIs’ indexes that make up that domain. Different weights were not attributed to any KPI, so they all have the same influence on the final index. The OCI is, then, the average of the four sub-indexes. The resulting indexes of all the KPIs are presented in Appendix B, segregated by domain. Table 2 showcases the resulting four sub-indexes, along with the overall circular index.
Table 2.
Sub-indexes and final OCI.
4. Discussion
4.1. Efficiency Analysis
The efficiency analysis suggests that the company has effectively managed costs and product quality in their process, which are critical for maintaining its competitive edge. However, the inefficiencies in production time and production flow remain key areas for improvement to increase overall productivity. Applying optimization and waste reduction principles can help the company streamline its processes, thus improving the production flow. Furthermore, a great source of the detected inefficiency lies in the time that the machines are functioning but not producing. A shop floor assessment is advisable to detect if the downtime is due to high setup or maintenance times, or unbalanced production planning. In the first case, the company may want to consider an upgrade of their equipment to reduce downtime, whereas in the second case, the production schedule should receive special focus to optimize operational planning.
Additionally, both process phases (“Jacquard” and “Ratière”) received similar efficiency scores throughout the metrics, with the exception being the cost of non-quality KPIs. That difference highlights distinct inefficiencies in quality control and defect management, with the lower cost in the “Jacquard” process suggesting better control mechanisms, reduced defect rates, and more efficient production, while the higher cost in the “Ratière” process points to quality issues, leading to higher rework and scrap costs. This discrepancy implies that focused improvements in the “Ratière” process, such as enhanced quality monitoring and tighter production controls, could yield substantial cost savings and bring its performance closer to that of the “Jacquard” process. To that end, the company benefits from adopting advanced statistical methods, such as control charts, to continuously monitor key metrics in the production flow and adjust the equipment’s parameters as soon as necessary.
4.2. Circularity Analysis
The overall circular index revealed an average value of 0.516. This index is neither bad nor good, making the company only slightly more circular than linear. The OCI revealed that although there is room for improvement, it is not a concerning matter, and that the company takes circular economy into consideration in its everyday practices. The social and environmental domains have above-average results, upping the OCI, whereas the economic domain appears to be the lowest of the four domains and the material domain one has a medium index. A recent assessment on a tannery factory revealed an OCI value of 0.352 [22], a lower value than the trimming and label industry since the former has high water consumption in its processes, greatly lowering the environmental domain’s score.
The environmental KPIs that used the MADM normalization process all contributed to an increase in the domain index, showcasing that in comparison to previous years, 2023 was a good year regarding environmental matters. The “Machines efficiency” data were directly fed by the overall efficiency in the MSM analysis of both the “Jacquard” and “Ratière” processes. Both “Heat recovery rate” and “Water circularity rate” had an index of 0 as it was not possible to precisely measure and collect these data due to a lack of strategic sensors and registry. In order to improve the environmental index, the company should invest further in sensors like flowmeters, which would make it possible to determine the real consumption of water in the process and internal consumption, as well as understand how much exactly are they saving water with their internal rain water reutilization system. These two indicators represent approximately one-fifth of the total score weight, meaning that when the company registers data, the environmental score will increase considerably. On a best-case scenario, both scoring 1, the environmental score would go up to 0.820. The renewable energy index can only significantly increase with further investment in these systems.
In the material domain, the KPIs that required the MADM normalization process, once again, are among the highest indexes in the group, along with the “Wasted material rate in the process” KPI. As for the indicator “Quantity of reutilized consumables”, the company certainly should improve this KPI by promoting more reutilization of its consumables instead of sending these to landfill. It should be noted that these consumables are not the same as the ones mentioned in the “Quantity of recycled consumables”, so these two KPIs are not dependent of each other. Both the “Percentage of recyclable material in the product” and “Percentage of reused material in the product” indicators have an index of zero, since the product does not incorporate nor register reused threads and recyclable cloth. The material circularity index could improve by increasing these last two indicators as well as using the lowest possible amount of virgin material in the product.
The economic domain is the lowest of the four, but it should also be noted that it has the least amount of KPIs and each one has considerable weight on the sub-index. The “Productivity of the line of production” indicator accounts for the financial aspect in the “Jacquard” and “Ratière” processes, only considering the income from the resulting products. As such, with an index of one, it reveals that the company has grown considerably in profits in 2023 compared to previous years. The ROI indicator index is zero, but this is not a concerning matter since the investment was only made recently and that is why the profit has not achieved the value of the initial investment. With time, this index will increase on its own. The “Sale of residues” indicator translates into the percentage of residues sold among the total quantity of residues generated. With such a low index, it means that the company makes very little profit over its residues, not providing them a higher chance of having a second life. To increase this index, the company should look for means to recover the wastes’ value through a marketplace, for example. The “Product post-use recovery politics” KPI showcases, with an index of 0, that the company has no sort of strategy to recover a finished product to resell it or reuse/retrieve any of the feedstock in it. On the other hand, the “Gross cost of opportunity” indicator reveals positive results, as the company had less wasted feedstock in 2023 compared to the previous years. The cost of the feedstock from different years was provided by the data used in the MSM.
The social domain has the highest index of all, conveying a relatively stable and pleasant workplace. The “Number of accidents per year” in 2023 was low compared to previous years, scoring a high index. Many of the social KPIs display positive results, except for two KPIs: the “Annual training hours per worker” indicator, which reveals that the company does not complete all the required training hours per Portuguese law; and the “Internal promotion rate” KPI, which indicates that no worker is promoted and all the high positions in the company are hired or outsourced.
It should be noted that the OCI relies heavily on correct data measurement; so, in the case of a lack of data, the score is considerably affected. In order to mitigate this point, if there are no ways to measure the data, the assessor could use estimates or proxy indicators instead of leaving it at zero, so the score is not so strongly affected.
4.3. Conjoint Analysis—Circularity and Efficiency
The overall analysis of the “Jacquard” and “Ratière” processes was effectuated by two methodologies as a conjoint work. When it comes to a deep analysis of the processes within the company, it was more advantageous to have these methodologies applied together than only applying one of them. Otherwise, the analysis would be incomplete. The MSM methodology provides a detailed analysis of the manufacturing process, segregating it by various phases and obtaining the efficiency of each of them for different aspects through thorough calculations and data gathering. However, when considering the whole “loop” of the product, only performing the efficiency analysis of the process itself is not enough. On the other hand, the OCI methodology is also incomplete by itself, for the opposite reason. This methodology assesses the circularity on various aspects without actually going into full detail on any of them, but still evaluating the process on various fronts, considering the whole “loop” from the feedstock management to the end of life of the product while still taking into account social and economic aspects of the company. Although it is able to identify issues in a general viewpoint, it cannot provide detailed information on how to proceed and what the exact causes for the inefficiencies are.
As such, it provides an undeniable advantage to join the two methodologies together as process evaluation to provide both a wide and detailed input on the process’ efficiency and sustainability. It is possible to incorporate the MSM results into the OCI methodology, as shown with the “Machines efficiency” and the “Gross cost of opportunity” KPIs whose data came directly from the MSM, as examples of one methodology complementing the other. And at the same time, the OCI permits the provision of more general view on the process, without focusing solely on the production machines, providing a more critical overview of the process. Comparing the overly positive result of the MSM, 71%, with the barely above-average OCI of 0.516, it is possible to confirm that if the assessor only opted for one of the two methodologies, they would have had an inaccurate idea of the process. This way, by analyzing the data provided by both methodologies, the assessor has the knowledge on what aspects of the process could be improved and the impact that some changes could have.
There are a few reasons that could explain the discrepancy between the OCI and MSM results. First, there are some domains that pull the OCI score down (material and economical) that are not reflected on the MSM KPIs. Since MSM only focuses on the production process, the environmental and social dimensions are invisible to it. Second, a high MSM score can coexist with a mediocre OCI because a process can be efficient while operating within a linear model, and the OCI penalizes linear material flows. Lastly, the MSM result only affects two KPIs in the OCI application (“Machines efficiency” and “Gross cost of opportunity”), which has little impact on the final circularity assessment.
A comparison of the two methodologies in terms of results reinforced that the combined MSM and OCI assessment provides a comprehensive overview of the company. To illustrate this, the high-cost efficiency identified in the MSM is related to the production process, while the low economic values of the OCI relate to the product and company, indicating to decision makers that the focal point of improvements should be in the product itself, rather than the process. On the other hand, the low operational efficiency identified on the MSM, combined with the higher productivity results of the OCI, shows that the key aspect for operational improvement should be the process. These results highlight the fact that both methodologies complement one another when detecting the key aspect that the company should focus its efforts to optimize—the product, the process, or both.
5. Conclusions
In this paper, the presentation and application of two different methodologies to assess the efficiency and circularity of a manufacturing process in a trims and label company is demonstrated. The two methodologies used were MSM for the analysis of machine efficiency and the OCI for the assessment of the process’ circularity. Both methodologies focused mainly on the two most common manufacturing processes, the “Jacquard” and the “Ratière”. While the MSM reached an overall efficiency of the process of 71%, taking into account aspects such as cost, resources, and operations, the OCI took a broader perspective into analysis, including all four domains (environmental, material, economic, and social), and reached an overall index of 0.516 on a range from 0 to 1.
In order to fully assess a process, just applying one of the proposed methodologies makes the analysis incomplete, as MSM provides a detailed but small outlook on the manufacturing process, whereas the OCI provides a wider but more general and critical viewpoint of the process, taking into account the whole “loop” of the product as well. That is why it is recommended for the assessor to use both of these methodologies as complementing each other. In doing so, the user can thoroughly understand its process inefficiencies and issues and learn how to correct and improve these.
To effectively implement these methodologies in similar manufacturing enterprises, a sequential and integrated approach is recommended for the same period of time, starting with MSM and then the OCI. This way, the results from the efficiency analysis can be incorporated in the circularity assessment, and the OCI will complement this by identifying lifecycle-level weaknesses within the process. The combined interpretation of both results enables the assessor to prioritize improvement actions; a low MSM score indicates the need for operational and technological intervention, and a low OCI suggests a primary focus on product design, material selection, and circular practices.
Author Contributions
Methodology, B.F.O. and M.M.S.; validation, L.F. and V.L.; formal analysis, B.F.O., T.I.G. and M.M.S.; investigation, B.F.O. and M.M.S.; resources, L.F. and V.L.; writing—original draft preparation, B.F.O., T.I.G. and M.M.S.; writing—review and editing, F.V.B.; visualization, B.F.O.; supervision, F.V.B. All authors have read and agreed to the published version of the manuscript.
Funding
This work has been supported by the European Union under the Next Generation EU, through a grant of the Portuguese Republic’s Recovery and Resilience Plan (RRP) Partnership Agreement, within the scope of the project PRODUTECH R3—“Agenda Mobilizadora da Fileira das Tecnologias de Produção para a Reindustrialização”. Total project investment: EUR 166,988,013.1; total grant: EUR 97,111,730.27. The authors acknowledge Fundação para a Ciência e a Tecnologia (FCT) for its financial support via the project UIDB/50022/2020 (LAETA Base Funding).
Data Availability Statement
The data presented in this study are available on request from the corresponding author due to confidentiality restrictions.
Conflicts of Interest
Authors Liane Ferreira and Victor Lourenço were employed by the company Idepa. The remaining authors declare that the research was conducted in the absence of any commercial or financial relationships that could be construed as a potential conflict of interest.” The funders had no role in the design of the study; in the collection, analyses, or interpretation of data; in the writing of the manuscript; or in the decision to publish the results.
Abbreviations
The following abbreviations are used in this manuscript:
| MSM | Multi-layer Stream Mapping |
| OCI | Overall Circularity Index |
| CE | Circular Economy |
| EU | European Union |
| SME | Small- and Medium-sized Enterprise |
| SDG | Sustainable Development Goals |
| MCI | Material Circularity Indicator |
| SCI | Sustainable Circularity Index |
| KPI | Key Performance Indicator |
| VA | Value Added |
| NVA | Non-Value Added |
| ROI | Return Of Investment |
| ERP | Enterprise Resource Planning |
| MADM | Multiple-Attribute Decision Making |
Appendix A. OCI KPI Identification
Table A1.
Environmental KPIs.
Table A1.
Environmental KPIs.
| KPI | Unit | Criteria |
|---|---|---|
| Renewable energy percentage | % | Direct conversion |
| Total energy usage in factory | % | The smaller the better |
| Machines efficiency | % | Direct conversion |
| Heat recovery rate | % | Direct conversion |
| Pollutant gas emissions | kg/h | The smaller the better |
| Dangerous waste generated | kg | The smaller the better |
| Non-dangerous waste generated | kg | The smaller the better |
| Water circularity rate | % | Direct conversion |
| Water usage in the process | m3 | The smaller the better |
Table A2.
Material KPIs.
Table A2.
Material KPIs.
| KPI | Unit | Criteria |
|---|---|---|
| Percentage of virgin feedstock in the product | % | Other |
| Percentage of recyclable feedstock in the product | % | Direct conversion |
| Percentage of reused feedstock in the product | % | Direct conversion |
| Wasted feedstock rate in the process | % | Direct conversion |
| Quantity of material sent to landfill | kg | The smaller the better |
| Quantity of reutilized consumables | kg | Other |
| Quantity of recycled consumables | kg | The larger the better |
Table A3.
Economic KPIs.
Table A3.
Economic KPIs.
| KPI | Unit | Criteria |
|---|---|---|
| Return of Investment (ROI) of the solar photovoltaics power plant implementation | EUR | Other |
| Productivity of the line of production | EUR/24 h | The larger the better |
| Sale of residues | EUR | Other |
| Gross cost of opportunity | EUR | The smaller the better |
| Product post-use recovery policies | EUR | Other |
Table A4.
Social KPIs.
Table A4.
Social KPIs.
| KPI | Unit | Criteria |
|---|---|---|
| Number of accidents per year | - | The smaller the better |
| Absenteeism rate due to casualties | % | Direct conversion |
| Worker turnover | % | Direct conversion |
| Productivity in “Ratière” section | % | Direct conversion |
| Productivity in “Jacquard” section | % | Direct conversion |
| Annual training hours per worker | h/year | Other |
| Ratio between permanent and temporary workers | % | Direct conversion |
| Ratio between women and men | % | Direct conversion |
| Internal promotion rate | % | Direct conversion |
Appendix B. KPI Indexes Resulting from OCI Analysis
Table A5.
KPI indexes resulting from OCI analysis.
Table A5.
KPI indexes resulting from OCI analysis.
| KPI | Index |
|---|---|
| Environmental | |
| Renewable energy percentage | 0.180 |
| Total energy usage in factory | 1.000 |
| Machines efficiency | 0.710 |
| Heat recovery rate | 0 |
| Pollutant gas emissions | 1.000 |
| Dangerous waste generated | 0.780 |
| Non-dangerous waste generated | 0.892 |
| Water circularity rate | 0 |
| Water usage in the process | 0.821 |
| Material | |
| Percentage of virgin material in the product | 0.310 |
| Percentage of recyclable material in the product | 0 |
| Percentage of reused material in the product | 0 |
| Wasted material rate in the process | 0.959 |
| Quantity of material sent to landfill | 0.708 |
| Quantity of reutilized consumables | 0.008 |
| Quantity of recycled consumables | 1.000 |
| Economical | |
| Return of Investment (ROI) of the solar photovoltaics power plant implementation | 0 |
| Productivity of the line of production | 1.000 |
| Sale of residues | 0.026 |
| Gross cost of opportunity | 0.819 |
| Product post-use recovery politics | 0 |
| Social | |
| Number of accidents per year | 0.875 |
| Absenteeism rate due to casualties | 0.956 |
| Worker turnover | 0.853 |
| Productivity in “Ratière” section | 0.600 |
| Productivity in “Jacquard” section | 0.800 |
| Annual training hours per worker | 0.125 |
| Ratio between permanent and temporary workers | 0.930 |
| Ratio between women and men | 0.900 |
| Internal promotion rate | 0 |
References
- Lee, H.; Juan, Y.K.; Han, Q.; de Vries, B. An investigation on construction companies’ attitudes towards importance and adoption of circular economy strategies. Ain Shams Eng. J. 2023, 14, 102219. [Google Scholar] [CrossRef]
- Ferradás-González, A.; Pérez-Rico, C.; Ada-Lameiras, A. Transforming Sorted and Performance of Waste Recovery Companies: Circular Economy, Sustainability Technology and SDGs. Sustain. Technol. Entrep. 2024, 3, 100082. [Google Scholar] [CrossRef]
- Tosi, D.; Gusmerotti, N.M.; Testa, F.; Frey, M. How companies navigate circular economy paradoxes: An organizational perspective. J. Environ. Manag. 2024, 353, 120269. [Google Scholar] [CrossRef]
- Fischer, A.; Pascucci, S. Institutional incentives in circular economy transition: The case of material use in the Dutch textile industry. J. Clean. Prod. 2017, 155, 17–32. [Google Scholar] [CrossRef]
- Matos, F.; Perello-Marin, M.R. Circular Economy Challenges within the Road Freight Transport: Case Study of Portuguese Companies. Procedia Comput. Sci. 2024, 232, 2181–2190. [Google Scholar] [CrossRef]
- Chenavaz, R.Y.; Dimitrov, S. From waste to wealth: Policies to promote the circular economy. J Clean. Prod. 2024, 443, 141086. [Google Scholar] [CrossRef]
- Ellen MacArthur Foundation Project Team (In Alphabetical Order). 2019. Available online: http://www.ellenmacarthurfoundation.org/circularity-indicators/ (accessed on 21 November 2024).
- Saha, K.; Dey, K.; Kumar, V. A comprehensive review of circular economy research in the textile and clothing industry. J. Clean. Prod. 2024, 444, 141252. [Google Scholar] [CrossRef]
- Moraga, G.; Huysveld, S.; De Meester, S.; Dewulf, J. Development of circularity indicators based on the in-use occupation of materials. J. Clean. Prod. 2021, 279, 123889. [Google Scholar] [CrossRef]
- Sazdovski, I.; Bojovic, D.; Batlle-Bayer, L.; Aldaco, R.; Margallo, M.; Fullana-i-Palmer, P. Circular Economy of Packaging and Relativity of Time in Packaging Life Cycle. Resour. Conserv. Recycl. 2022, 184, 106393. [Google Scholar] [CrossRef]
- European Commission. Communication from the Commission to the European Parliament, the Council, the European Economic and Social Committee and the Committee of the Regions—EU Strategy for Sustainable and Circular Textiles. 2022. Available online: https://ec.europa.eu/eurostat (accessed on 1 December 2024).
- Chowdhury, N.R.; Paul, S.K.; Sarker, T.; Shi, Y. Implementing smart waste management system for a sustainable circular economy in the textile industry. Int. J. Prod. Econ. 2023, 262, 108876. [Google Scholar] [CrossRef]
- Jia, F.; Yin, S.; Chen, L.; Chen, X. The circular economy in the textile and apparel industry: A systematic literature review. J. Clean. Prod. 2020, 259, 120728. [Google Scholar] [CrossRef]
- Luoma, P.; Penttinen, E.; Tapio, P.; Toppinen, A. Future images of data in circular economy for textiles. Technol. Forecast. Soc. Change 2022, 182, 121859. [Google Scholar] [CrossRef]
- Papamichael, I.; Voukkali, I.; Economou, F.; Loizia, P.; Demetriou, G.; Esposito, M.; Naddeo, V.; Liscio, M.C.; Sospiro, P.; Zorpas, A.A. Mobilisation of textile waste to recover high added value products and energy for the transition to circular economy. Environ. Res. 2024, 242, 117716. [Google Scholar] [CrossRef]
- Corona, B.; Shen, L.; Reike, D.; Carreón, J.R.; Worrell, E. Towards sustainable development through the circular economy—A review and critical assessment on current circularity metrics. Resour. Conserv. Recycl. 2019, 151, 104498. [Google Scholar] [CrossRef]
- Simões, S.S.C. Barriers to a Circular Economy Transition for the Use of Recycled Plastics in the Textile Industry. Master’s Thesis, University of Coimbra, Coimbra, Portugal, 2022. Available online: https://estudogeral.uc.pt/handle/10316/103117 (accessed on 22 November 2024).
- Azevedo, S.G.; Godina, R.; de Oliveira Matias, J.C. Proposal of a sustainable circular index for manufacturing companies. Resources 2017, 6, 63. [Google Scholar] [CrossRef]
- González, A.; Sendra, C.; Herena, A.; Rosquillas, M.; Vaz, D. Methodology to assess the circularity in building construction and refurbishment activities. Resour. Conserv. Recycl. Adv. 2021, 12, 200051. [Google Scholar] [CrossRef] [PubMed]
- Garza-Reyes, J.A.; Valls, A.S.; Nadeem, S.P.; Anosike, A.; Kumar, V. A circularity measurement toolkit for manufacturing SMEs. Int. J. Prod. Res. 2019, 57, 7319–7343. [Google Scholar] [CrossRef]
- Lemke, C.; Bastini, K. Embracing multiple perspectives of sustainable development in a composite measure: The Multilevel Sustainable Development Index. J. Clean. Prod. 2020, 246, 118884. [Google Scholar] [CrossRef]
- Oliveira, B.F.; Gonçalves, T.I.; Sousa, M.M.; Pimenta, S.M.; Ramalho, O.F.; Cruz, J.B.; Barbosa, F.V. Methodology to Assess the Circularity of Industrial Processes. Int. J. Ind. Manuf. Eng. 2024, 18, 393–404. [Google Scholar]
- Lourenço, E.J.; Pereira, J.; Barbosa, R.; Baptista, A.J. Using Multi-layer Stream Mapping to Assess the Overall Efficiency and Waste of a Production System: A Case Study from the Plywood Industry. Procedia CIRP 2016, 48, 128–133. [Google Scholar] [CrossRef][Green Version]
- Aguiar, J. Application and Development of Multi-Layer Stream Mapping Methodology-An Extension of MSM 1.0 for Resource Efficiency and Productivity Management-Applied to a Heating Device Production System in a Metalworking Industry; University of Lisbon: Lisboa, Portugal, 2019. [Google Scholar]
- Padilla-Rivera, A.; do Carmo, B.B.T.; Arcese, G.; Merveille, N. Social circular economy indicators: Selection through fuzzy delphi method. Sustain. Prod. Consum. 2021, 26, 101–110. [Google Scholar] [CrossRef]
- Luthin, A.; Traverso, M.; Crawford, R.H. Assessing the social life cycle impacts of circular economy. J. Clean. Prod. 2023, 386, 135725. [Google Scholar] [CrossRef]
- Zhou, P.; Ang, B.W.; Poh, K.L. Comparing aggregating methods for constructing the composite environmental index: An objective measure. Ecol. Econ. 2005, 59, 305–311. [Google Scholar] [CrossRef]
- McKinsey & Company. McKinsey Study: At Least One-Fifth of Textile Waste Could Be Reused for New Garments. Available online: https://www.mckinsey.com/fi/news/mckinsey-study-at-least-one-fifth-of-textile-waste-could-be-reused-for-new-garments#/ (accessed on 21 November 2025).


Disclaimer/Publisher’s Note: The statements, opinions and data contained in all publications are solely those of the individual author(s) and contributor(s) and not of MDPI and/or the editor(s). MDPI and/or the editor(s) disclaim responsibility for any injury to people or property resulting from any ideas, methods, instructions or products referred to in the content. |
© 2026 by the authors. Licensee MDPI, Basel, Switzerland. This article is an open access article distributed under the terms and conditions of the Creative Commons Attribution (CC BY) license.