Abstract
The definition of the recycling and recyclability rates used today relies too heavily on the mass of the recycled materials, to the disadvantage of less dense materials such as polymers. In order to help with this issue, two indices have been created to, respectively, evaluate the retrievability of materials in their end-of-life stage and their reintegrability in new equipment once they have been recycled. These two indices comprise four indicators each, which are themselves divided into 23 sub-indicators. The six formal mathematical principles of the construction of these entities are presented, along with the formulas used for their calculation. Then, a case study is presented: the data of an equipment from a French EEE and sports and leisure distributor have been collected, and all sub-indicators, indicators and indices have been calculated for this equipment, hence assessing the retrievability and reintegrability of its constitutive materials. In conclusion, the precise nature of the indicators and sub-indicators has allowed us to give eco-design recommendations on different aspects of the design process, such as the choice of materials, the mechanical connections and modularity of the product, and its insertion into the waste treatment chain.
1. Introduction
As defined by the “5R” hierarchy of treatment methods for products: Refuse, Reduce, Reuse, Repurpose and Recycle [1], the reduction in the waste stream is deemed one of the most efficient ways to decrease our environmental impact. One way to achieve this goal is to design our products in a more sustainable way, to reduce the quantity of waste generated by human activities.
Hence, in order for this eco-design to be relevant, the design choices and the treatment of end-of-life (EoL) products must be evaluated. To do so, performance indicators can be used to transmit information to and from the different stages of the life cycle of a product.
If we take the example of the treatment of waste electrical and electronic equipment (WEEE), we first have to define the perimeter of the treatment chain. Figure 1 depicts a generic treatment chain for WEEE, with the different masses at each point of interest [2,3,4].
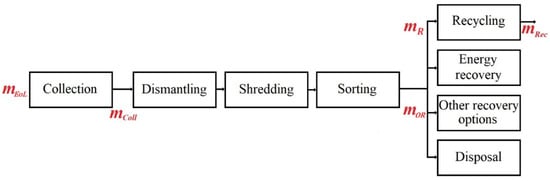
Figure 1.
Generic treatment chain for WEEE. is the total mass of products arriving at the end-of-life stage, is the mass of EoL products collected by the official scheme, is the mass of collected products sent to be recycled, is the mass of products actually recycled, and is the mass of products recovered by other treatment options.
For each process, an indicator can be used to assess its performance. For instance, we can define [5,6]
where
: Total mass of products arriving at the end-of-life stage;
: Mass of EoL products collected by the official scheme;
: Mass of collected products sent to be recycled;
: Mass of products actually recycled;
: Mass of products recovered by other treatment options.
Hence, many performance indicators currently used focus solely on the mass of treated materials, without consideration for their reuseability or the quality of the recycling process.
Thus, significant gaps can form between the recycling rates of different materials. Table 1 summarises the calculation of such indicators, first for the entire category of computer and telecom equipment, and then for the polymers contained in this WEEE category [7,8,9].

Table 1.
Comparison of the treatment results for EoL WEEE and EoL polymers.
Here we can see that the proportion of plastics in the plastic fraction is only 78%. This means that 22% of the total mass of this fraction is made up of contaminants that will have a negative impact on the WEEE recycling process [8]. Public authorities often communicate the recovery rate for WEEE, but as we can see, it is also important to break down this rate to see which materials are recycled and which are sent for energy recovery.
Another problem with plastics from WEEE that are actually recycled is their low circularity. In fact, less than 3% was reintegrated into the manufacture of new equipment in 2019 [9]. According to the same study, most of these plastics have been sent to other application sectors, such as agriculture or construction, where they are used in low-demand products such as agricultural tarpaulins or the filling of concrete blocks [10].
To address this issue, we need to propose new ways of communicating data on the properties and availability of recycled plastics.
One of the most widespread indicators used to evaluate the recycling potential of products is the recyclability indicator. Unlike the recycling rate, which is calculated on the basis of actual data, recyclability is a theoretical calculation that must be assessed during the product design stage. In European legislation, this rate is calculated as follows [11,12]:
where
: Recyclability rate;
: Mass of component i;
: Theoretical recycling rate of component i with the predicted treatment option;
: Total mass of the equipment.
The recyclability rate is therefore based on projected scenarios. Once again, this is a mass rate, which favours dense materials such as metals over materials with a lower density, such as plastics. This is why specific methods, which are not based solely on indicators assessing the mass of waste recycled, have been created to take into account the actual data from the recycling sectors. These methods will be presented later in this article.
In the end, the performance of the sectors is only assessed by mass rates; the regulatory targets are, in fact, imposed in terms of collection, reuse and recycling rates, and recovery, all expressed as mass percentages. The indicators used, therefore, only consider the mass of material recycled, and not the circularity of the materials, the quality of the material, or the environmental aspects of recycling. The current indicators are inadequate for assessing the performance of waste management, as the aim of recycling processes is not only to preserve the mass of materials, components or products, but also to preserve their functional value.
In this paper, we are going to propose a set of indicators that will allow for a thorough evaluation of the eco-design of products. The aim of this study is to provide a way to assess the design of a product without having to carry out an entire LCA study. This research was conducted in partnership with stakeholders from the sector of EEE, which allowed us to obtain data on one equipment, on which we are going to conduct a case study, to verify that our set of indicators is indeed usable in a concrete situation.
2. Results
2.1. Contents of the Section
In this section, we are going to present the entities that we have constructed for this study. They consist of three levels of indicators: sub-indicators, indicators, and indices.
The mathematical construction of these entities is presented in the Methods section.
Then, this set of indicators will be used to assess the design of an EEE equipment. The equipment will be presented, along with the calculation of the corresponding indicators.
2.2. Construction of the Retrievability Index
2.2.1. Disassembly Indicator
Several methods already exist to evaluate the dismantling potential of a product, which take into account the use of fastening elements (FEs), modularity, reusability, and complexity [6,13,14,15]. Based on all these definitions, we are going to calculate our disassembly indicator based on four sub-indicators. De Aguiar et al. (2016) [13] have developed a solid set of indicators for the disassembly of products. However, their methods of calculation make the indicators fluctuate between 1 and 4, without ever reaching 0. We are going to adapt these indicators to our construction method (presented in Section 4.1).
First of all, regarding the concentration in FE, the denser it is, the more difficult the dismantling process is [13]:
where
: Sub-indicator of concentration in FE;
: Number of FE pertaining to the component;
: Total number of FE in the equipment.
Then, we adapted the proposed method of De Aguiar [13] for the evaluation of the type of FE so that its value fluctuates between 0 and 1. A table depicting this method can be found in Table A1 (Appendix A).
The disassembly indicator also takes into account the variety of FE used. For instance, a mechanical connection ensured by screws and glue will account for two different FE regardless of the number of screws or glued areas. The sub-indicator is presented in Table 2.
Table 2.
Sub-indicator of the number of types of FE.
Eventually, the accessibility of the FE is measured in a qualitative way, depending on the fact that the mechanical linkage is directly accessible, needs the disassembly of other pieces before being accessible, or is totally unattainable. Originally, this indicator fluctuates between the values 1 and 4, with a calculation based on the perceived accessibility of the linkage; >50% accessibility would result in a better evaluation than <50% accessibility. However, we find this very difficult to evaluate and make the decision to simplify this sub-indicator. Thus, the sub-indicator A is presented in Table 3.
Table 3.
Sub-indicator of FE accessibility.
The disassembly indicator is thus composed of four sub-indicators. It would be unnecessary to calculate it in a more complicated way than their average value. As a consequence, it is calculated as follows:
where
: Disassembly index;
: Concentration in FE;
: Type of FE;
: Number of types of FE;
: Accessibility of the connection.
2.2.2. Indicator of Material Separability
The second indicator is the separability of materials. First, we are going to introduce the compatibility sub-indicator. Two materials that are incompatible with one another, but present in the same waste stream and recycled together, will not be correctly treated, and one or both of them will not be reusable, especially in the case of polymers [16]. The sub-indicator is presented in Table 4.
Table 4.
Sub-indicator of material compatibility.
Then, the material hazard is evaluated by looking at the inherent hazardous or reactive nature of the material. This sub-indicator is presented in Table 5.
Table 5.
Sub-indicator of material hazardousness.
Eventually, we are going to add a contamination sub-indicator , which indicates the risk of cross-contamination of the waste stream due to this material (e.g., mercury in halogen lamps, etc.). Its calculation is very simple, as shown in Table 6.
Table 6.
Sub-indicator of material contamination.
The calculation of these three sub-indicators is derived from De Aguiar et al. (2016) [13], adapted to our premises of having sub-indicators fluctuating between 0 and 1.
Just like the disassembly indicator, the material separability indicator is composed of the three previously mentioned sub-indicators. However, this time, each one of the evaluated aspects must be punitive, as the use of incompatible, hazardous, or contaminating materials should be discouraged. Hence, the separability indicator is calculated as follows:
where
: Separability indicator;
: Material compatibility sub-indicator;
: Material hazardousness sub-indicator;
: Material contamination sub-indicator.
Using a series of multiplications, we ensure that only one of the sub-indicators being equal to zero means that the value of the separability is zero too. Indeed, when evaluating aspects such as these, the compensation of one by the others should be unacceptable.
2.2.3. Treatment Facility Availability Indicator
This indicator aims to assess how difficult it will be to find a dedicated facility to disassemble and recycle a product. To do so, we can evaluate the existence and geographical location of such facilities. It is composed of two sub-indicators:
We are going to try and reward the most local treatment method to avoid excessive waste transportation steps. To do so, we are going to use two different aggregation methods, depending on the situation:
- If the disassembly and regeneration facilities are the same, we just calculate the average of the two values.
- If the disassembly and regeneration facilities are different, it means that additional transportation steps will be necessary. This must be reflected in the value of the indicator. Hence, instead of calculating the average value, we are going to multiply the two sub-indicators.
Therefore, we, respectively, obtain
where
: Sub-indicator of treatment facility availability;
: Sub-indicator of disassembly facility availability;
: Sub-indicator of regeneration facility availability.
2.2.4. Material Recyclability Indicator
We are going to use the definition of the recyclability rate as defined in the norm EN 45555 [12]. It has already been presented in Section 1 (Equation (6)).
However, we also know that this indicator alone is not sufficient to evaluate the circularity of materials. We are thus going to associate it with other sub-indicators in order to broaden its perimeter.
The material diversity represents the number of different materials used for the manufacturing of a product. Several authors have given various mathematical definitions, but this parameter seems difficult to gauge [6,14]. Indeed, if a product is built with many different materials, their individual recycling will be more difficult; however, their respective masses also seem to be a crucial parameter.
We propose to adapt the indicator suggested by Dostatni et al. [14] and to evaluate the diversity of materials with an indicator of dominant material proportion:
where
: Sub-indicator of dominant material proportion;
: Total mass of the most used material in the product;
: Mass of the most used material in the component.
Eventually, we are going to add a collection rate sub-indicator. Indeed, the collection of equipment is still a struggle in Europe, as only around 50% of all equipment is collected in official schemes. This could entice producers to set up specialised collection points, such as return policies at the distribution stores for their products.
Hence, we obtain
where
: Material recyclability indicator;
: Sub-indicator of the collection rate of the product;
: Sub-indicator of the recyclability rate of the product;
: Sub-indicator of dominant material proportion.
2.2.5. The Retrievability Index
Table 9 finally summarises the different indicators constructed in this section.
Table 9.
Composition of the retrievability index.
By using a formal method of construction (established in Section 4.1), the retrievability index is calculated as follows:
where represents the four indicators mentioned in the previous table.
2.3. Construction of the Reintegrability Index
2.3.1. Indicator of Material Availability
This indicator is meant to gauge the supply of materials. Two aspects have been taken into consideration: the presence of the material in the waste stream deposit (Table 10) and the potential production volume of the supplier (Table 11).
Table 10.
Sub-indicator of the volume of material in the waste deposit.
Table 11.
Sub-indicator of the potential production volume.
Hence, the material availability indicator is calculated as follows:
where
: Indicator of material availability;
: Sub-indicator of volume of material in the waste deposit;
: Sub-indicator of potential production volume.
2.3.2. Material Purity Indicator
The purity rate is a very important parameter for recycled materials. For metals, this rate fixes the mechanical properties as well as the price [17]. For polymers, it is also commonly observed that a high proportion of contaminants will lower the mechanical properties of the plastic batch [18,19,20].
Three sub-indicators are used for the calculation of the purity indicator.
First, we selected the sub-indicator of main material rate, which is calculated by assessing the proportion of target raw material used to produce the studied component (Table 12). For instance, a component made of ABS, manufactured with a batch of recycled plastic granules consisting of 98.5% ABS, will induce a value of 0.985 for this sub-indicator.
Table 12.
Sub-indicator of the main material rate.
The contamination rate depends on the proportion of particle contaminants, additives, fillers, and minerals contained in the batch of raw materials used to manufacture the studied component.
For the manufacturing of polymers, the filtration level determines the size of the biggest contaminating particle contained in the raw material batch. For metals, a value of 1 can be assumed for this sub-indicator.
Table 13.
Sub-indicator of the contaminant rate.
Table 14.
Sub-indicator of the filtration level.
In order to best take into account the issue of contaminants, the purity indicator is calculated as follows:
with
: Indicator of material purity;
: Sub-indicator of contaminants rate;
: Sub-indicator of proportion of main material;
: Sub-indicator of filtration level.
Furthermore, a low purity rate will indicate that the materials used will most likely not be usable again when recycled at their end-of-life stage, because of a high rate of contaminants or an insufficient proportion of target material.
2.3.3. Environmental Impact Indicator
The environmental impact is determined by the recycled material proportion of the studied component (Table 15), the carbon savings associated (Table 16), and the criticality of the materials used.
Table 15.
Sub-indicator of recycled material rate.
Table 16.
Sub-indicator of carbon savings.
Carbon savings can be difficult to evaluate; for this reason, a consensus has been reached with stakeholders of the polymers recycling chain to give a lower weighting coefficient to this sub-indicator.
Material criticality is a complex metric that evaluates the different constraints upon the use of a specific material. The criticality of a material can be assessed to be low, medium, high, or not critical [21,22].
We are going to use these criticality levels to build our sub-indicator:
where
: Sub-indicator of material criticality;
: Number of studies where the material was deemed highly critical;
: Number of studies where the material was given a medium criticality;
: Number of studies where the material was given a low criticality;
: Number of studies where the material was deemed critical.
If , it shall be assumed that .
Thus, the environmental impact indicator is calculated as follows:
where
: Environmental impact indicator;
: Sub-indicator of recycled material rate;
: Sub-indicator of carbon savings;
: Sub-indicator of material criticality.
2.3.4. Material Traceability Indicator
The traceability indicator is used to check the background information on a material. The idea behind this indicator is to evaluate the transmission of information on the materials used in the studied product.
In the case of recycled materials, the category of origin of the waste (based on European regulation [23]) used to produce them can have an impact on the final properties of the batch of said recycled materials (Table 17). For virgin materials, a value of 1 can be assumed.
Table 17.
Sub-indicator of the category of origin of the waste.
The geographical origin of the waste follows the same logic (Table 18). Waste from Europe is subject to strict regulations, making it generally easier to recycle than waste from outside Europe, which does not always respect European regulations.
Table 18.
Sub-indicator of the geographical origin of the waste.
As a consequence, the goal of the sub-indicator of regulation compliance is to check if the materials used in the manufacturing of the studied product respect the regulation; in this case, the three most prominent European directives are Reach, RoHS and the directive POP on persistent organic pollutants [24,25,26] (Table 19).
Table 19.
Sub-indicator of regulation compliance.
The evaluation of this sub-indicator is very strict, as a non-compliant product cannot enter the market.
Thus, to include the crucial nature of the regulation compliance, the traceability indicator is calculated as follows:
where
: Indicator of material traceability;
: Sub-indicator of the category of origin of the waste;
: Sub-indicator of the geographical origin of the waste;
: Sub-indicator of regulation compliance.
2.3.5. The Reintegrability Index
Table 20 summarises the different indicators constructed in this section.
Table 20.
Composition of the reintegrability index.
By using a formal method of construction (it will be presented in Section 4.1), the reintegrability index is calculated as follows:
where represents the four indicators mentioned in the previous table.
2.4. Presentation of the Studied Equipment
The studied equipment is a laser gun, used, for example, in laser tag facilities (Figure 2).

Figure 2.
Equipment studied: laser tag pistol.
The French company Decathlon provided us with a complete bill of materials for this product, on the condition of confidentiality. Hence, we will not give out any information that is not publicly available.
The product has a total mass of 485 g, is labelled “100% repairable and dismantlable”, and is given a 10-year lifespan by the distributor. It is composed of four main materials: steel and three polymer types used in similar quantities (PC, PP, and ABS). Additionally, there are seven different types of FE.
We are going to present the practical calculation of all sub-indicators introduced in the previous section. To do so, we will be using the right half of the barrel as an example and calculate all sub-indicators associated with this component (Figure 3).
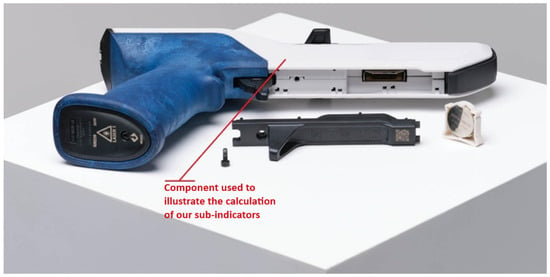
Figure 3.
Component used to demonstrate the calculation of our sub-indicators.
The calculations will be detailed for this component, and then the results will be presented for all others.
2.5. Calculation of the Retrievability Index Sub-Indicators
- Dismantlability
- −
- Concentration of FE
In the product under study, we can find ten separate FE, two of which are used to hold the right half of the barrel in position. According to the calculation method presented in the previous section (Equation (7)), we must therefore give the value of to the FE concentration sub-indicator.
- − Connection accessibility
In the case of the barrel, this is an external part, directly accessible for dismantling. The value of the link accessibility sub-indicator is therefore 1 for this component.
- − Number of types of FE
The equipment has a total of seven types of FE. The purpose of this sub-indicator is to check that they are not all used for the same connection. In the case of our example component, only one type of FE is used, so we give this sub-indicator a value of 1.
- − Type of FE
As a reminder, the calculation for the type of FE can be found in Table A1 (Appendix A).
In the case of the right half of the barrel, the associated type of FE is easy to dismantle, and gives a value of 0.95 to this sub-indicator.
Product dismantlability thus takes into account the four sub-indicators set out in Table A2 (see Appendix B).
The value of the product’s dismantlability indicator is the following:
- Material separability
- −
- Material compatibility
The two polymers used in the manufacturing of the right half of the barrel are theoretically chemically compatible, although it would be preferable to separate them before the regeneration stage, which is not possible in this case. We can therefore assign a value of 0.5 to the materials accounting sub-indicator for this component.
- − Material hazardousness
As with regulatory compliance, the hazardousness of materials is a blocking factor. Here, we would expect each component to score 1, which would mean that they are made of an inert, non-hazardous material.
- − Material contamination
Similarly, this sub-indicator only exists to ensure that the product complies with health and safety standards. For example, a halogen bulb containing mercury would be considered a contaminant for the waste stream.
In our case study, no component was deemed to be contaminating in the health sense of the term. The value of this sub-indicator for all product components is therefore 1.
The material separability indicator comprises three sub-indicators, whose values are presented in Table A3 (Appendix B).
The value of this indicator for our case study is the following:
- Treatment availability
- −
- Availability of dismantling facilities
The example component is made from two materials that can be recycled in France, but we have no information on where the product will be sent when it reaches the end of its life. We are therefore considering a scenario where the equipment is sent for treatment, but we do not know its geographical location. We therefore consider that the dismantling infrastructure is national and not local, which means that the value of the sub-indicator is 0.75.
- − Availability of recycling facilities
In our case study, for electrical and electronic equipment, dismantling and regeneration infrastructures are often the same. In the case of the category of small mixed appliances (to which the equipment we are studying belongs), regeneration infrastructures exist in several regions of France. For the same reason as for the availability of dismantling infrastructures, we will consider a national and not a local perimeter for this sub-indicator
Thus, the availability of treatment infrastructures is evaluated by the two sub-indicators shown in Table A4 (Appendix B).
Calculating this indicator for our case study gives us the following value:
- Material recyclability
- −
- Theoretical recycling rate
The right half of the barrel is a product made from a polymer that is theoretically 90% recyclable, which gives us a theoretical recycling sub-indicator of 0.9.
- − Collection rate
The collection rate for this type of equipment (small mixed appliances) is 48% according to Ademe [27], and no specialised collection channel has been set up by the distributor. We therefore give the equipment studied a value of 0.48 for this sub-indicator.
- − Diversity of materials
The material making up the straight barrel is made up of two polymer resins. We have to take each one into account when calculating this diversity, and cannot consider that the right half of the barrel is made of a single material. Indeed, it seems very difficult to imagine a recycling scenario in which both materials are regenerated.
This sub-indicator is calculated as the ratio of the mass of the material used for the component to the total mass of the equipment. The value of the material diversity sub-indicator for this component is 0.14.
The product recyclability indicator is calculated from these three sub-indicators. The results are shown in Table A5 (Appendix B), and the formula used to calculate this indicator is shown below:
2.6. Calculation of the Reintegrability Index Sub-Indicators
- Material availability
- −
- Volume of the deposit
For all the polymers used in this case study, an estimate of the quantity available in the deposit was given by the RPM suppliers. In the case of our example component, this information is known for this type of polymer. The value of the available material volume sub-indicator is therefore 1.
- − Volume of production
The same logic was applied to the supplier’s production volume sub-indicator. In the case of the right half of the barrel, suppliers indicate their annual production capacity, and that a volume contract is possible. The value of the production volume sub-indicator is therefore 1.
The values of the two sub-indicators taken into account in the calculation of the material availability indicator are given in Table A6 (Appendix B).
By using the calculation formula presented in the previous section (Equation (14)), we thus have the following:
- Purity rate
- −
- Proportion of the main material
The part we have taken as an example is made from two different resins. The proportion of the main resin indicated by the suppliers is 95%. The value of the main resin proportion sub-indicator is therefore 0.95 for this component.
- − Proportion of contaminants
The proportion of contaminants is often the complement of one of the proportions of the main resin if there is no secondary resin, which is the case for the example component. The contaminant content of the materials used in our case is 5%. (According to the supplier, this polymer reference contains no additives.)
- − Filtration level
In the case of our example component, one RPM supplier gave us a filtration level of 130 μm, and another supplier gave us a value of 120 μm, which both correspond to a value of 0.75 for the filtration before the granulation sub-indicator.
The purity rate is based on the three sub-indicators whose values are presented in Table A7 (Appendix B).
For each component i, we calculate the purity rate and calculate the arithmetic average. For our case study, we therefore have, according to the calculation method previously presented (Equation (15)):
- Environmental impact
- −
- Proportion of recycled material
The right half of the barrel is made of two polymers, for which we once again have data from RPM suppliers. The proportion of recycled material for these two polymers is 100%, giving a value of 1 to the proportion of recycled material sub-indicator for this component.
- − Carbon savings
For the resins making up the example component, the method of calculating carbon savings has been given, but not the results of this study. We will therefore give this sub-indicator a value of 0.5.
- − Material criticality
In the case of the right half of the barrel, the constituent polymer is a petroleum product. We must therefore consider the criticality of hydrocarbons. We use the literature review by Schrijvers et al. [22], in which an in-depth survey of the results of criticality studies was carried out.
In the case of petroleum products, two studies were carried out, one showing high criticality and the other medium criticality. According to the method for calculating the criticality sub-indicator introduced earlier (Equation (16)), we must therefore give it a value of .
The environmental impact indicator is calculated based on the values of the three sub-indicators presented in Table A8 (Appendix B).
The environmental impact indicator is calculated as follows (see Equation (17)):
- Traceability
- −
- Category of origin of the waste
Suppliers have indicated the origin of the waste from which they extracted their raw materials. In the case of the right half of the barrel, the two polymers used in its manufacture were extracted from waste electrical and electronic equipment. We are therefore in the case of closed-loop recycling, which leads us to a value of 1 for this sub-indicator.
- − Geographical origin of the waste
For our example component, the waste comes exclusively from the European Union, which brings the value of the sub-indicator to 1.
- − Regulation compliance
Regulatory compliance is a key issue for any product placed on the market. If a product is not compliant, it cannot be sold. In the case of our product, all its components comply with current European standards, so it is no surprise that we have a value of 1 for each component. This indicator only exists to ensure that the product does not contain any hazardous substances that would prevent it from being recycled.
The values used for the calculation can be found in Table A9 (Appendix B).
Here is the result of the calculation of the materials traceability indicator (see Equation (18)):
2.7. Retrievability Index
As a reminder, the calculation method for the retrievability index was presented in Section 2.2.5:
If we calculate this index using the indicator values obtained for this case study, we obtain the following:
The value of the recoverability index has been significantly reduced by the low indicator of material recyclability. A quick study of the results shows that this low value is due to a very low material diversity sub-indicator. In addition, we can see that some components have a theoretical recyclability sub-indicator of 0, which also lowers the final value of the recoverability index.
We will therefore be able to give eco-design recommendations to improve these aspects.
2.8. Reintegrability Index
As a reminder, the calculation method for the reintegrability index was presented in Section 2.3.5:
By using the numeric values of the indicators previously calculated, we have the following:
We can observe that the reintegration index was negatively impacted by the low value of the environmental impact indicator. A study of the equipment immediately shows that this low value can be explained by the use of virgin and critical raw materials. There is also a second problem: the sub-indicators for CO2 savings, chain of origin and geographical origin all too often show a value of 0. This is simply due to poor transmission of information, but this aspect could still be the subject of an eco-design recommendation.
2.9. Conclusions of the Case Study
A summary of the results of the calculation of all indicators and indices can be found in Table 21 below.
Table 21.
Summary of the results of the calculation of all indicators and indices.
A first eco-design recommendation would therefore be to avoid using dark-coloured plastics, as their presence in a product effectively implies over-sorting at the polymer separation stage. Indeed, black plastics often contain hazardous substances, such as antimony or brominated flame retardants [28,29]; as such, they are often eliminated from the waste stream. Because of this, the recyclability evaluation of black components was on the low end, leading to a low recyclability indicator for the whole equipment.
Secondly, we can see that the material diversity sub-indicator was very low. This problem is also linked to the relatively low value of the material compatibility sub-indicator for most of the components. The obvious conclusion is that too many different materials are used, especially within the same component. A second eco-design recommendation would therefore be to use as few different materials as possible, and if not, not to put them in non-dismantlable contact.
In addition, the reintegration index faces other problems, more specifically with regard to the sub-indicators of CO2 savings and material criticality on the one hand, and the sub-indicators of origin and geographical origin on the other.
The first two sub-indicators can be increased by using recycled materials, which would increase CO2 savings and avoid the extraction of critical virgin material.
As for the last two, they tend to favour closed-loop recycling. However, it is difficult to give an eco-design recommendation on an aspect that the producer may not be able to control. However, we could use materials that the producing company or companies in the vicinity can recycle themselves.
On a positive note, we can acknowledge the fact that the product obtained a rather high dismantling indicator, which supports the fact that the product has been designed with particular care given to dismantling, if we refer to the fact that the product was labelled “100% dismantlable”, as mentioned in Section 2.4.
3. Discussion
Our work aimed at laying out a potential innovative method for the assessment of product ecodesign. It has been presented to and carried out in partnership with the industrial and academic partners of the Urban Mines Chair, a consortium of recycling companies, EEE producers, and a French government-affiliated PRO (ecosystem). As such, we were able to have contacts with different EEE-producing companies. The ones which accepted to provide us with data were specialised in small electric appliances. Hence, other studies on different waste categories should be carried out to improve and validate our model.
Furthermore, we need to recognise the limitations of our sub-indicators. Indeed, we designed them to be usable during the product design phase and usable by someone who is not necessarily an expert in eco-design. This means making the indicators easy to calculate, sometimes to the detriment of a precise quantitative assessment based on a numeric value.
For instance, we are aware that the criteria used to assess the environmental impact of the product in this method are insufficient. It is, indeed, very difficult to obtain sufficient information from suppliers, not to mention their own difficulties in analysing their products. This work has been carried out through a doctoral thesis, and we did not have access to extremely precise data. On the other hand, an organisation with more resources and capable of performing a complete LCA on several material references could most likely do so. The goal was to build a tool for design teams, not necessarily specialised in eco-design, but the authors themselves had difficulty gathering some of the data.
All these assessments raise the issue of data collection for non-specialised design experts when using our set of indicators.
In general, our method focuses largely on the assessment of MPRs, and there are few solutions in our method to replace indicators that only concern MPRs with others that are more likely to assess other materials. The scope of the indicators should be broadened to include options for assessing non-ferrous and precious metals, and especially non-removable electronic components (e.g., printed circuit boards and batteries).
This would also make it possible to extend this method to other complex categories of waste belonging to different sectors, such as end-of-life vehicles or infrastructure waste. Indeed, this research was carried out in partnership with a French PRO, specialised in EEE treatment; hence, we had access to the BOM of EEE products. Thus, further investigation seems necessary to study the repeatability of the evaluation of product design with this set of indicators, and to ensure that it is transferable to other waste categories.
4. Methods
4.1. Indicators for the Ecodesign of WEEE, Centred on the Use of Recycled Polymers
As previously mentioned in Section 1, the integration of recycled plastic materials (RPMs) into new equipment is insufficient. Hence, two indices have been created in order to evaluate the circularity of materials, with a specific approach centred around recycled polymers, as presented in Section 2.
4.1.1. Selection of Eco-Design Indicators
The first index is the retrievability rate. It evaluates the capacity of a material to be extracted from an EoL product. It includes the evaluation of the dismantlability of the product, the separability of materials composing it, the existence of treatment facilities for this kind of waste, and the recyclability of the product, although evaluated with more data than the recyclability rate suggested by the European Union (as shown in Equation (6)). Indeed, a sole mass rate cannot thoroughly evaluate the circularity of materials; it can only evaluate the efficiency of recycling processes.
The second created index is the reintegrability rate, which evaluates the capacity of a material, once it has been retrieved and recycled, to be used for the manufacturing of new equipment. It is composed of a material availability indicator, to address the lack of data on the supply of RPM, a material purity indicator, which evaluates the chemical quality of the material, an environmental impact evaluation, which, although simple, gives information about the use of recycled materials, the carbon savings, and the criticality assessment of the materials used. Eventually, being of utmost importance, the traceability of materials is evaluated to ensure a satisfactory transmission of data throughout the life cycle of the material.
Table 22 details the composition of the indices and indicators into sub-indicators.
Table 22.
Details of the composition of the retrievability and reintegrability rates (FE: fastening element).
The 23 sub-indicators are calculated from measurable values; they are then aggregated into 8 indicators, which are themselves aggregated to form the two final indices.
4.1.2. Calculation and Construction of the Indicators
First, we must clearly define the three mathematical entities we are going to introduce:
- An indicator is a tool for the evaluation of a physical measure.
- An index is a function which takes the indicators as arguments. It expresses a synthesis of information of different natures.
- A sub-indicator is, in our case, an entity based directly on a measurable value. In other words, there is a causal relationship between the sub-indicator and the physical measure. The indicator itself is the synthesis of several sub-indicators.
The authors are now going to present the mathematical principles used for the calculation and aggregation of these entities.
4.1.3. Homogeneity and Normalisation Principles
To allow for an easier comparison, all indicators should be centred around a common value , chosen by the user, as shown in the following Equation (30).
where
: Calculated indicator;
: Common value;
: Measured quantity;
: Reference quantity.
To choose , one has to remember that the calculated indicators () will attain the common value when the measured quantity equals the reference quantity .
The value is only used to create a scale or measurement; it is always chosen, even unknowingly, by the user. For example, De Aguiar et al. (2016) [13] chose to evaluate the disassembly indicators with values between 1 and 4, the European Union chose to evaluate the repairability index by using a value between 0 and 10 [30], and Martinez-Leal (2019) chose to use a scale between 0 and 1 [6]. All these differences stem from a different choice for , but they do not hinder the comparability of studies. The only thing one should be careful about is to choose the same for all indicators in the same set; otherwise, aggregation could be more difficult or lead to the misrepresentation of results.
Let us take the example of an indicator that evaluates the purity rate of a material batch. First, this purity rate is measured on a target batch. Now, if this batch is only 95% pure, it means that it contains 5% more contaminants compared to a reference batch that would contain none. This then means that
- equals 100% since the batch taken for reference is totally pure;
- equals 95% since it is the value that has been measured.
So, the choice of basically determines the variation interval of the indicator. If one wants the purity indicator to vary between 0 and 100, with a value of 95 for this batch, then must be equal to 100. On the other hand, if the purity indicator should vary between 0 and 1 with a value of 0.95, then we have , etc.
The summary is as follows:
- Principle 1: By calculating all the indicators using a reference quantity , they become homogeneous and can be compared and used for aggregation even if the measured values were not of the same physical quantity.
- Principle 2: by setting all indicators to a common value , they have indeed been normalised. This principle is used to make all indicators vary within the same interval, thus making them easier to compare.
- Principle 3: if these two principles are respected for all mathematical entities (indices, indicators, and sub-indicators), we ensure that they will all be part of the same ensemble, hence avoiding any mathematical errors.
4.1.4. Transformation and Aggregation
Once the indicators have been homogenised and normalised, they need to be transformed with a function f which must respect three other principles:
- Principle 4: Invariance by permutation of indicators.
- Principle 5: Monotony of the transformation function.
- Principle 6, the “efficiency” principle: The aggregated entity must highlight the efforts made on the worst argument. This is to encourage the users of this method to try and improve the worst indicators instead of trying to compensate them by increasing the value of already good ones.
Eventually, the homogenised and transformed indicators can be aggregated into a global index by an aggregation function g. This function should, if possible, respect the principle of separation of the following variables: average and dispersion. To this end, the indicators previously mentioned can be defined as
where
: Average value of the ensemble of indicators;
: Deviation from the average of the indicator ;
: Variable dispersion.
The dispersion can be useful to compare the independent influences of the average value and the deviation on the aggregation function. The global index is thus the composition function of f and g applied to the homogenised indicators. Figure 4 summarises this process [6].
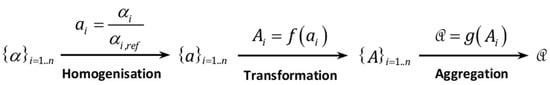
Figure 4.
Construction process of an aggregated entity [4].
Mathematical proof of these principles has been sought after for five different families of functions by Maurin [31]. Table 23 summarises the results [4].
Table 23.
Analysis of different families of transformation functions [4].
The function , although complex, respects all mathematical principles previously mentioned. Fortunately, the function can be simplified by defining the constant c as follows:
Now, we should define for our study. We would like a simple scale that is easy to read, interpret, and allows for the comparison of different entities. In this paper, we chose to have our indicators fluctuate between the values 0 and 1. Hence, we should simply have .
This gives us , and as such, we have
The function is relatively easy to use and respects all principles.
As for the aggregation, it is interesting to note that the function (average), constitutes the vast majority (87%) of aggregation methods used in the literature. Indeed, when the transformation function is adequately chosen, the average function is sufficient, and very simple to use [6,32]
In order to calculate our retrievability and reintegrability indices, we will thus use this function:
This composition of functions is robust as it respects all principles mentioned and is not needlessly complex.
Note that, even though the weighting of indicators is not inherently wrong, one must be careful when implementing it, as weighted indicators can prevent an objective analysis of the situation, or even orient the results [31,32].
4.1.5. Construction of the Mathematical Entities for Our Study
Based on the construction rules previously mentioned, we selected and constructed 23 sub-indicators, eight indicators and two indices. The ground rules were hence established; we were able to set some additional common rules for all our entities.
Thus, all our entities—sub-indicators, indicators and indices—will vary in the interval [0;1], and for all of them, the value 1 corresponds to the best-case scenario, and the value 0 refers to the worst one.
This choice was deliberately made so that anyone using our indicators is instantly able to see where the problems lie, without having to check the calculation method of an entity before knowing if its value refers to a flaw or an optimal choice.
In the case of indicators (constructed by the aggregation of sub-indicators), several aggregation options will be used:
- Arithmetic average value: A , n > 0;
- Multiplication of indicators:
- Complements to 1:
- Hybrid forms , n > 0.
The use of either of these functions will be determined by the specific situation in which they appear.
As for sub-indicators, four different options will be used for the calculation of their values: linear progression, discrete values, Boolean values, or a hybrid of linear and discrete values. If discrete qualitative levels are needed, two main options will be used, unless stated otherwise for specific cases: [0; 0.5; 1] or [0; 0.25; 0.5; 0.75; 1]. This way, we allow for a more “flexible” evaluation of some of the design aspects, without having too much difference between the calculation methods of the indicators. The use of an odd number of possible thresholds (3 or 5) allows for five levels of evaluation, providing the possibility of a middle, “neutral” value.
5. Conclusions
The objective of this study was to give design teams the opportunity to choose to incorporate plastics that can be reused in other equipment, and to ensure that their product is constructed in such a way that these plastics can be recovered. Furthermore, throughout this paper, we have emphasised the central role of recycling chains, and we wish to encourage their development through the tools and methods we have developed.
We constructed indicators of product dismantlability, material separability, availability of processing infrastructure and product recyclability. These four indicators form the recoverability index. In addition, we selected the indicators of material availability, material purity, environmental impact and material traceability to form the reintegration index. The efficiency principle presented in Section 4.1 ensures that the efforts on the lowest value are well represented in the aggregated indicator; however, a model with 23 sub-indicators would benefit from a sensitivity analysis in order to identify which ones contribute the most to the final index values, and if all 23 sub-indicators are indeed all necessary.
We selected a series of indicators focused on topics that we deemed relevant to the design phase, namely the choice of materials, the product architecture, and the overall integration of the latter into an end-of-life chain. However, we were unable to include economic indicators or quantitative supply indicators. We assume that these two aspects will always be evaluated by design teams in an industrial context, but it is true that we would have liked to add these dimensions to the set of indicators used in our method.
Author Contributions
Conceptualisation, N.N.; Methodology, N.N.; Validation, N.P., C.C., and S.P.; Investigation, N.N.; Data curation, N.N.; Writing—original draft preparation, N.N.; Writing—review and editing, N.N. and S.P.; visualisation, N.N. and S.P.; supervision, N.P., C.C., and S.P. All authors have read and agreed to the published version of the manuscript.
Funding
This research was funded with a doctoral thesis grant (attribution 20 3178 071 CL71) from the non-profit public French PRO ecosystem, through the Chaire Mines Urbaines, Scientific Chair for Research and Formation.
Data Availability Statement
The datasets presented in this article are not readily available because legal reasons (NDA agreement). Requests to access the datasets should be directed to the corresponding author.
Conflicts of Interest
The authors declare no conflicts of interest.
Abbreviations
The following abbreviations are used in this manuscript:
| CO2 | Carbon dioxide |
| EoL | End of life |
| FEs | Fastening elements |
| RPM | Recycled plastic material |
| WEEE | Waste electrical and electronic equipment |
Appendix A
Numerical Calculation of Disassembly Indicators
Table A1.
Adaptation of the calculation of the sub-indicator “Type of fastening element”. Adapted from De Aguiar et al., 2016 [13].
Table A1.
Adaptation of the calculation of the sub-indicator “Type of fastening element”. Adapted from De Aguiar et al., 2016 [13].
| Measured Physical Value | Corresponding Value | Magnetic bond | Nut and bolt | Circlip | Clip | Nail | Nylon cord | Interlock | Glue | Pin | Rivet | |
| tD: time for disassembly (s) | from 0 to 13 s | 1 | 1 | 0.66 | 1 | 1 | 0.33 | 1 | 1 | 0.66 | 0.66 | 0 |
| from 13.1 to 16 s | 0.66 | |||||||||||
| from 16.1 to 40 s | 0.33 | |||||||||||
| >40 s | 0 | |||||||||||
| Nt: number of tools necessary | 0 | 1 | 1 | 0.66 | 0.66 | 1 | 0.66 | 0.66 | 1 | 0.33 | 0.66 | 0 |
| 1 | 0.66 | |||||||||||
| 2 | 0.33 | |||||||||||
| > 3 | 0 | |||||||||||
| SD: Necessary strength (N) | from 0 to 12 N | 1 | 0.33 | 1 | 1 | 0.66 | 0 | 0.33 | 1 | 0 | 1 | 0 |
| from 12.1 to 25 N | 0.66 | |||||||||||
| 25.1 to 47 N | 0.33 | |||||||||||
| >47 N | 0 | |||||||||||
| Da: Destructivity | Non-destructive, no residue | 1 | 1 | 1 | 1 | 1 | 1 | 1 | 1 | 0.66 | 1 | 0.33 |
| Non-destructive, with residue | 0.66 | |||||||||||
| Destructive, no residue | 0.33 | |||||||||||
| Destructive, with residue | 0 | |||||||||||
| Sum | 3.33 | 3.33 | 3.66 | 3.66 | 2 | 3 | 4 | 1.66 | 3.33 | 0.33 | ||
| Average value | 0.83 | 0.83 | 0.92 | 0.92 | 0.5 | 0.75 | 1 | 0.42 | 0.83 | 0.08 | ||
| Normalised value: | 0.85 | 0.85 | 0.95 | 0.95 | 0.55 | 0.8 | 1 | 0.45 | 0.85 | 0.1 | ||
Appendix B
Numerical Calculation of Several Sub-Indicators
Table A2.
Numerical calculation of the sub-indicators composing the dismantlability indicator.
Table A2.
Numerical calculation of the sub-indicators composing the dismantlability indicator.
| Component | Sub-Indicator of Type of FE | Sub-Indicator of Number of Types of FE | Sub-Indicator of Connection Availability | Sub-Indicator of FE Concentration |
|---|---|---|---|---|
| Forward weight | 0.85 | 0.50 | 0.50 | 0.70 |
| Backwards weight | 0.85 | 0.50 | 0.50 | 0.70 |
| Right half of the barrel | 0.95 | 1.00 | 1.00 | 0.80 |
| Left half of the barrel | 0.95 | 1.00 | 1.00 | 0.80 |
| Battery hood | 0.95 | 1.00 | 0.50 | 0.80 |
| Outer casing | 0.85 | 0.50 | 1.00 | 0.80 |
| Handle hood | 0.85 | 1.00 | 1.00 | 0.80 |
| Internal lever | 0.85 | 1.00 | 0.50 | 0.70 |
| Reload lever | 0.85 | 1.00 | 0.50 | 0.70 |
| Trigger | 0.85 | 1.00 | 0.50 | 0.80 |
| Vertical camera | 0.85 | 1.00 | 1.00 | 0.80 |
| Handle—first half | 0.85 | 0.50 | 1.00 | 0.70 |
| Handle—second half | 0.85 | 0.50 | 1.00 | 0.70 |
| Battery | 0.85 | 1.00 | 0.50 | 0.80 |
| Battery support | 0.45 | 1.00 | 0.50 | 0.80 |
| Active electronic component | 0.85 | 1.00 | 0.50 | 0.80 |
| Electro-mechanical component | 0.85 | 1.00 | 0.50 | 0.80 |
| Printed circuit board | 0.85 | 1.00 | 0.50 | 0.80 |
| Passive electronic component | 0.85 | 1.00 | 0.50 | 0.80 |
| LASER module | 0.85 | 1.00 | 0.50 | 0.80 |
| Printed circuit board frame | 0.45 | 1.00 | 0.50 | 0.80 |
Table A3.
Numerical calculation of the sub-indicators composing the separability indicator.
Table A3.
Numerical calculation of the sub-indicators composing the separability indicator.
| Component | Sub-Indicator of Material Compatibility | Sub-Indicator of Material Hazardousness | Sub-Indicator of Material Contamination |
|---|---|---|---|
| Forward weight | 1.00 | 1.00 | 1.00 |
| Backwards weight | 1.00 | 1.00 | 1.00 |
| Right half of the barrel | 0.50 | 1.00 | 1.00 |
| Left half of the barrel | 0.50 | 1.00 | 1.00 |
| Battery hood | 0.50 | 1.00 | 1.00 |
| Outer casing | 0.50 | 1.00 | 1.00 |
| Handle hood | 0.50 | 1.00 | 1.00 |
| Internal lever | 0.50 | 1.00 | 1.00 |
| Reload lever | 0.50 | 1.00 | 1.00 |
| Trigger | 0.50 | 1.00 | 1.00 |
| Vertical camera | 0.50 | 1.00 | 1.00 |
| Handle—first half | 1.00 | 1.00 | 1.00 |
| Handle—second half | 1.00 | 1.00 | 1.00 |
| Battery | 0.75 | 1.00 | 1.00 |
| Battery support | 0.00 | 1.00 | 1.00 |
| Active electronic component | 0.75 | 1.00 | 1.00 |
| Electro-mechanical component | 0.75 | 1.00 | 1.00 |
| Printed circuit board | 0.75 | 1.00 | 1.00 |
| Passive electronic component | 0.75 | 1.00 | 1.00 |
| LASER module | 0.75 | 1.00 | 1.00 |
| Printed circuit board frame | 0.00 | 1.00 | 1.00 |
Table A4.
Numerical calculation of the sub-indicators composing the treatment availability indicator.
Table A4.
Numerical calculation of the sub-indicators composing the treatment availability indicator.
| Component | Sub-Indicator of Dismantling Availability | Sub-Indicator of Recycling Availability |
|---|---|---|
| Forward weight | 0.75 | 0.75 |
| Backwards weight | 0.75 | 0.75 |
| Right half of the barrel | 0.75 | 0.75 |
| Left half of the barrel | 0.75 | 0.75 |
| Battery hood | 0.75 | 0.75 |
| Outer casing | 0.75 | 0.75 |
| Handle hood | 0.75 | 0.75 |
| Internal lever | 0.75 | 0.75 |
| Reload lever | 0.75 | 0.75 |
| Trigger | 0.75 | 0.75 |
| Vertical camera | 0.75 | 0.75 |
| Handle—first half | 0.75 | 0.75 |
| Handle—second half | 0.00 | 0.00 |
| Battery | 0.75 | 0.75 |
| Battery support | 0.75 | 0.75 |
| Active electronic component | 0.75 | 0.75 |
| Electro-mechanical component | 0.75 | 0.75 |
| Printed circuit board | 0.75 | 0.75 |
| Passive electronic component | 0.75 | 0.75 |
| LASER module | 0.75 | 0.75 |
| Printed circuit board frame | 0.75 | 0.75 |
Table A5.
Numerical calculation of the sub-indicators composing the recyclability indicator.
Table A5.
Numerical calculation of the sub-indicators composing the recyclability indicator.
| Component | Sub-Indicator of Material Diversity | Sub-Indicator of Collection Rate | Sub-Indicator of Theoretical Recycling Rate |
|---|---|---|---|
| Forward weight | 0.42 | 0.48 | 0.95 |
| Backwards weight | 0.42 | 0.48 | 0.95 |
| Right half of the barrel | 0.14 | 0.48 | 0.90 |
| Left half of the barrel | 0.14 | 0.48 | 0.90 |
| Battery hood | 0.14 | 0.48 | 0.00 |
| Outer casing | 0.14 | 0.48 | 0.90 |
| Handle hood | 0.14 | 0.48 | 0.00 |
| Internal lever | 0.14 | 0.48 | 0.90 |
| Reload lever | 0.14 | 0.48 | 0.90 |
| Trigger | 0.14 | 0.48 | 0.00 |
| Vertical camera | 0.14 | 0.48 | 0.00 |
| Handle—first half | 0.13 | 0.48 | 0.90 |
| Handle—second half | 0.09 | 0.48 | 0.00 |
| Battery | 0.00 | 0.48 | 0.75 |
| Battery support | 0.07 | 0.48 | 0.50 |
| Active electronic component | 0.00 | 0.48 | 0.50 |
| Electro-mechanical component | 0.00 | 0.48 | 0.50 |
| Printed circuit board | 0.00 | 0.48 | 0.50 |
| Passive electronic component | 0.00 | 0.48 | 0.50 |
| LASER module | 0.00 | 0.48 | 0.50 |
| Printed circuit board frame | 0.07 | 0.48 | 0.50 |
Table A6.
Numerical calculation of the sub-indicators composing the material availability indicator.
Table A6.
Numerical calculation of the sub-indicators composing the material availability indicator.
| Component | Sub-Indicator of Production Volume | Sub-Indicator of Deposit Volume |
|---|---|---|
| Forward weight | 1.00 | 1.00 |
| Backwards weight | 1.00 | 1.00 |
| Right half of the barrel | 1.00 | 1.00 |
| Left half of the barrel | 1.00 | 1.00 |
| Battery hood | 1.00 | 1.00 |
| Outer casing | 1.00 | 1.00 |
| Handle hood | 1.00 | 1.00 |
| Internal lever | 1.00 | 1.00 |
| Reload lever | 1.00 | 1.00 |
| Trigger | 1.00 | 1.00 |
| Vertical camera | 1.00 | 1.00 |
| Handle—first half | 1.00 | 1.00 |
| Handle—second half | 0.00 | 0.00 |
| Battery | 0.00 | 0.50 |
| Battery support | 0.00 | 0.00 |
| Active electronic component | 0.00 | 0.50 |
| Electro-mechanical component | 0.00 | 0.50 |
| Printed circuit board | 0.50 | 0.50 |
| Passive electronic component | 0.00 | 0.50 |
| LASER module | 0.00 | 0.50 |
| Printed circuit board frame | 0.00 | 0.00 |
Table A7.
Numerical calculation of the sub-indicators composing the material purity indicator.
Table A7.
Numerical calculation of the sub-indicators composing the material purity indicator.
| Component | Sub-Indicator of Proportion of Main Material | Sub-Indicator of Proportion of Contaminants | Sub-Indicator of Filtration Before Granulation |
|---|---|---|---|
| Forward weight | 1.00 | 1.00 | 1.00 |
| Backwards weight | 1.00 | 1.00 | 1.00 |
| Right half of the barrel | 0.95 | 0.90 | 0.75 |
| Left half of the barrel | 0.95 | 0.90 | 0.75 |
| Battery hood | 0.95 | 0.90 | 0.75 |
| Outer casing | 0.95 | 0.90 | 0.75 |
| Handle hood | 0.95 | 0.90 | 0.75 |
| Internal lever | 0.95 | 0.90 | 0.75 |
| Reload lever | 0.95 | 0.90 | 0.75 |
| Trigger | 0.95 | 0.90 | 0.75 |
| Vertical camera | 0.95 | 0.90 | 0.75 |
| Handle—first half | 0.95 | 0.94 | 0.75 |
| Handle—second half | 1.00 | 1.00 | 1.00 |
| Battery | 1.00 | 1.00 | 1.00 |
| Battery support | 1.00 | 1.00 | 1.00 |
| Active electronic component | 1.00 | 1.00 | 1.00 |
| Electro-mechanical component | 1.00 | 1.00 | 1.00 |
| Printed circuit board | 1.00 | 1.00 | 1.00 |
| Passive electronic component | 1.00 | 1.00 | 1.00 |
| LASER module | 1.00 | 1.00 | 1.00 |
| Printed circuit board frame | 1.00 | 1.00 | 1.00 |
Table A8.
Numerical calculation of the sub-indicators composing the environmental impact indicator.
Table A8.
Numerical calculation of the sub-indicators composing the environmental impact indicator.
| Component | Sub-Indicator of Carbon Savings | Sub-Indicator of Material Criticality | Sub-Indicator of Proportion of Recycled Content |
|---|---|---|---|
| Forward weight | 0.00 | 0.59 | 0.00 |
| Backwards weight | 0.00 | 0.59 | 0.00 |
| Right half of the barrel | 0.50 | 0.17 | 1.00 |
| Left half of the barrel | 0.50 | 0.17 | 1.00 |
| Battery hood | 0.50 | 0.17 | 1.00 |
| Outer casing | 0.50 | 0.17 | 1.00 |
| Handle hood | 0.50 | 0.17 | 1.00 |
| Internal lever | 0.50 | 0.17 | 1.00 |
| Reload lever | 0.50 | 0.17 | 1.00 |
| Trigger | 0.50 | 0.17 | 1.00 |
| Vertical camera | 0.50 | 0.17 | 1.00 |
| Handle—first half | 0.50 | 0.17 | 1.00 |
| Handle—second half | 0.00 | 1.00 | 0.00 |
| Battery | 0.00 | 0.31 | 0.00 |
| Battery support | 0.50 | 0.17 | 0.00 |
| Active electronic component | 0.00 | 0.10 | 0.00 |
| Electro-mechanical component | 0.00 | 0.10 | 0.00 |
| Printed circuit board | 0.00 | 0.10 | 0.00 |
| Passive electronic component | 0.00 | 0.10 | 0.00 |
| LASER module | 0.00 | 0.10 | 0.00 |
| Printed circuit board frame | 0.50 | 0.17 | 0.00 |
Table A9.
Numerical calculation of the sub-indicators composing the traceability indicator.
Table A9.
Numerical calculation of the sub-indicators composing the traceability indicator.
| Component | Sub-Indicator of Regulation Compliance | Sub-Indicator of Geographical Origin | Sub-Indicator of Waste Category of Origin |
|---|---|---|---|
| Forward weight | 1.00 | 0.00 | 0.00 |
| Backwards weight | 1.00 | 0.00 | 0.00 |
| Right half of the barrel | 1.00 | 1.00 | 1.00 |
| Left half of the barrel | 1.00 | 1.00 | 1.00 |
| Battery hood | 1.00 | 1.00 | 1.00 |
| Outer casing | 1.00 | 1.00 | 1.00 |
| Handle hood | 1.00 | 1.00 | 1.00 |
| Internal lever | 1.00 | 1.00 | 1.00 |
| Reload lever | 1.00 | 1.00 | 1.00 |
| Trigger | 1.00 | 1.00 | 1.00 |
| Vertical camera | 1.00 | 1.00 | 1.00 |
| Handle—first half | 1.00 | 1.00 | 1.00 |
| Handle—second half | 1.00 | 0.00 | 0.00 |
| Battery | 1.00 | 0.00 | 0.00 |
| Battery support | 1.00 | 0.00 | 0.50 |
| Active electronic component | 1.00 | 0.00 | 0.00 |
| Electro-mechanical component | 1.00 | 0.00 | 0.00 |
| Printed circuit board | 1.00 | 0.00 | 0.00 |
| Passive electronic component | 1.00 | 0.00 | 0.00 |
| LASER module | 1.00 | 0.00 | 0.00 |
| Printed circuit board frame | 1.00 | 0.00 | 0.50 |
References
- Directive (UE) 2018/851 Du Parlement Européen et Du Conseil Du 30 Mai 2018 Modifiant La Directive 2008/98/CE Relative Aux Déchets (Texte Présentant de l’intérêt Pour l’EEE). Available online: https://eur-lex.europa.eu/eli/dir/2018/851/oj?locale=fr (accessed on 5 January 2021).
- Buekens, A.; Yang, J. Recycling of WEEE Plastics: A Review. J. Mater. Cycles Waste Manag. 2014, 16, 415–434. [Google Scholar] [CrossRef]
- Martinez Leal, J.; Charbuillet, C.; Pompidou, S.; Perry, N. Recycling Chains: A Proposal for an Exhaustive Definition. In Proceedings of the 10th International Conference on Society & Materials, SAM10, Rome, Italy, 9–10 May 2016. [Google Scholar]
- Nève, N. Proposition d’un Outil D’écoconception des Équipements Électriques et Électroniques Alimenté par des Indicateurs centrés sur L’intégration de Matières Plastiques Recyclées Issues de DEEE dans le cadre d’une Économie Circulaire. Ph.D. Thesis, ENSAM, Paris, France, 2024. [Google Scholar]
- EU Parliament Directive 2012/19/UE du Parlement Européen et du Conseil DU 4 Juillet 2012 Relative Aux Déchets D’équipements Électriques et Électroniques (DEEE). Available online: https://eur-lex.europa.eu/legal-content/FR/ALL/?uri=CELEX%3A32012L0019 (accessed on 3 June 2021).
- Martinez-Leal, J. Développement D’outils D’aide à la Décision en Conception Pilotés par L’analyse Multicritère de la Valorisabilité du Produit et L’outillage des Lignes Directrices D’écoconception Pour la fin de vie. Text; ENSAM: Bordeaux, France, 2019. [Google Scholar]
- Fangeat, E.; Deprouw, A.; Jover, M.; Borie, M.; Tonsart, O. ADEME—Rapport Annuel du Registre des Déchets D’équipements Électriques et Électroniques; ADEME: Montrouge, France, 2020; p. 102. [Google Scholar]
- Horta, R.; Grimaud, G.; Martinez-Leal, J.; Perry, N.; Laratte, B.; Pompidou, S.; Alix, T.; Charbuillet, C. Influence of Scope Definition in Recycling Rate Calculation for European E-Waste Extended Producer Responsibility. Waste Manag. 2019, 84, 256–268. [Google Scholar] [CrossRef] [PubMed]
- Plastics Europe Plastics-the Facts 2020. 2020. Available online: https://plasticseurope.org/knowledge-hub/plastics-the-facts-2020/ (accessed on 6 September 2023).
- Kaliyavaradhan, S.K.; Prem, P.R.; Ambily, P.S.; Mo, K.H. Effective Utilization of E-Waste Plastics and Glasses in Construction Products—A Review and Future Research Directions. Resour. Conserv. Recycl. 2022, 176, 105936. [Google Scholar] [CrossRef]
- IEC/TR 62635:2012; Guidelines for End-of-Life Information Provided by Manufacturers and Recyclers and for Recyclability Rate Calculation of Electrical and Electronic Equipment. AFNOR: La Plaine Saint-Denis, France, 2012. Available online: https://www.boutique.afnor.org/norme/iec-tr-626352012/-/article/805943/xs124796 (accessed on 24 June 2021).
- CEN/CLC/TC EN 45555:2019; General Methods for Assessing the Recyclability and Recoverability of Energy-Related Products. 2019; p. 25. Available online: https://standards.iteh.ai/catalog/standards/cen/a6432062-6e44-4011-9720-fcbc99e61feb/en-45555-2019?srsltid=AfmBOoq9fWTO-P0FZdZ8cG3Xyp_6tDrV27WNvOm5_qpcPLL-p0xhp6D6 (accessed on 5 September 2023).
- De Aguiar, J.; De Oliveira, L.; Oliveira Da Silva, J.; Bond, D.; Kovacs Scalice, R.; Becker, D. A Design Tool to Diagnose Product Recyclability during Product Design Phase. J. Clean. Prod. 2017, 141, 219–229. [Google Scholar] [CrossRef]
- Dostatni, E.; Diakun, J.; Grajewski, D.; Wichniarek, R.; Karwasz, A. Multi-Agent System to Support Decision-Making Process in Design for Recycling. Soft Comput. 2016, 20, 4347–4361. [Google Scholar] [CrossRef]
- Mathieux, F.; Lescuyer, L.; Moenne-Loccoz, G.; Brissaud, D. Proposition of New Recoverability Indicators as Support for the Product Design Process: The Electr(on)Ic Sector Experience; G-SCOP, University of Grenoble: Grenoble, France, 2008; p. 6. [Google Scholar]
- Peeters, J.R.; Vanegas, P.; Tange, L.; Van Houwelingen, J.; Duflou, J.R. Closed Loop Recycling of Plastics Containing Flame Retardants. Resour. Conserv. Recycl. 2014, 84, 35–43. [Google Scholar] [CrossRef]
- Grimaud, G. Conception des Scénarios de Recyclage Pilotée par L’évaluation des Performances des Proceeds; Text; ENSAM: Bordeaux, France, 2019. [Google Scholar]
- Alassali, A.; Barouta, D.; Tirion, H.; Moldt, Y.; Kuchta, K. Towards a High Quality Recycling of Plastics from Waste Electrical and Electronic Equipment through Separation of Contaminated Fractions. J. Hazard. Mater. 2020, 8, 121741. [Google Scholar] [CrossRef] [PubMed]
- Caro, D.; Albizzati, P.F.; Cristobal, G.J.; Saputra, L.I.; Garcia-Gutierrez, P.; Juchtmans, R.; Garbarino, E.; Blengini, G.; Manfredi, S.; De, M.S.; et al. Towards a Better Definition and Calculation of Recycling. Available online: https://publications.jrc.ec.europa.eu/repository/handle/JRC131531 (accessed on 14 November 2023).
- Stenvall, E.; Tostar, S.; Boldizar, A.; Foreman, M.R.S.; Möller, K. An Analysis of the Composition and Metal Contamination of Plastics from Waste Electrical and Electronic Equipment (WEEE). Waste Manag. 2013, 33, 915–922. [Google Scholar] [CrossRef] [PubMed]
- Ioannidou, D.; Heeren, N.; Sonnemann, G.; Habert, G. The Future in and of Criticality Assessments. J. Ind. Ecol. 2019, 23, 751–766. [Google Scholar] [CrossRef]
- Schrijvers, D.; Hool, A.; Blengini, G.A.; Chen, W.-Q.; Dewulf, J.; Eggert, R.; van Ellen, L.; Gauss, R.; Goddin, J.; Habib, K.; et al. A Review of Methods and Data to Determine Raw Material Criticality. Resour. Conserv. Recycl. 2020, 155, 104617. [Google Scholar] [CrossRef]
- CEN EN 15343:2008; Plastics—Recycled Plastics—Plastics Recycling Traceability and Assessment of Conformity and Recycled Content. 2008. Available online: https://standards.iteh.ai/catalog/standards/cen/a1a8ffaf-bf7d-4b1c-ba13-f8b368625569/en-15343-2007 (accessed on 29 November 2022).
- Comission Européenne Règlement (UE) 2019/1021 du Parlement Européen et du Conseil DU 20 Juin 2019 Concernant Les Polluants Organiques Persistants. 2019, p. 33. Available online: https://eur-lex.europa.eu/legal-content/FR/TXT/PDF/?uri=CELEX:32019R1021 (accessed on 5 May 2023).
- EU Parliament Regulation (EC) No 1907/2006 of the European Parliament and of the Council of 18 December 2006 Concerning the Registration, Evaluation, Authorisation and Restriction of Chemicals (REACH). 2006, p. 552. Available online: https://eur-lex.europa.eu/eli/reg/2006/1907/oj/eng (accessed on 14 April 2022).
- Parlement Européen. Directive 2011/65/UE du Parlement Européen et du Conseil du 8 Juin 2011 Relative à la Limitation de L’utilisation de Certaines Substances Dangereuses dans les Équipements Électriques et Électroniques Texte Présentant de L’intérêt Pour l’EEE. 2011. Volume 174. Available online: https://eur-lex.europa.eu/legal-content/fr/ALL/?uri=CELEX:32011L0065 (accessed on 24 April 2022).
- Deprouw, A.; Borie, M.; Rouquette, L.; Moriceau, S. Equipements Électriques et Électroniques: Données 2021; Rapport Annuel; ADEME: Montrouge, France, 2022; p. 112. [Google Scholar]
- Nève, N.; Mackré-Delannoy, X.; Fayolle, B.; Gervais, M.; Pompidou, S.; Charbuillet, C.; Sollogoub, C.; Perry, N. A Review of Methods and Data on the Recycling of Plastics from the European Waste Stream of Electric and Electronic Equipment. Recycling 2025, 10, 148. [Google Scholar] [CrossRef]
- Turner, A. Black Plastics: Linear and Circular Economies, Hazardous Additives and Marine Pollution. Environ. Int. 2018, 117, 308–318. [Google Scholar] [CrossRef] [PubMed]
- Product Reparability Scoring System: Specific Application to Smartphones and Slate Tablets; Publications Office of the European Union: Luxembourg, 2022; ISBN 978-92-76-52268-3.
- Maurin, M. Pour une Construction Formelle D’indice Global Agrégé en Pollution de l’air (Projet PIE. L’environnement et son Évaluation). 2009. Available online: https://www.researchgate.net/publication/238735605_Pour_une_construction_formelle_d’indice_global_agrege_en_pollution_de_l’air (accessed on 15 November 2023).
- Gan, X.; Fernandez, I.C.; Guo, J.; Wilson, M.; Zhao, Y.; Zhou, B.; Wu, J. When to Use What: Methods for Weighting and Aggregating Sustainability Indicators. Ecol. Indic. 2017, 81, 491–502. [Google Scholar] [CrossRef]


Disclaimer/Publisher’s Note: The statements, opinions and data contained in all publications are solely those of the individual author(s) and contributor(s) and not of MDPI and/or the editor(s). MDPI and/or the editor(s) disclaim responsibility for any injury to people or property resulting from any ideas, methods, instructions or products referred to in the content. |
© 2025 by the authors. Licensee MDPI, Basel, Switzerland. This article is an open access article distributed under the terms and conditions of the Creative Commons Attribution (CC BY) license (https://creativecommons.org/licenses/by/4.0/).