Abstract
Ammonia emissions in poultry houses are common and pose health concerns for animals and workers. However, effective control of these emissions with sustainable products is lacking. Therefore, we investigated if an agricultural byproduct, cottonseed hulls, could be recycled through pyrolysis and used to remove ammonia from air. In this study, the efficacy of ammonia removal was observed using cottonseed hull biomaterials pyrolyzed at seven different temperatures: 250, 300, 350, 400, 500, 600, and 700 °C. In this study, ammonia was passed through a column filled with pyrolyzed material, and ammonia in the filtered air was monitored. The results showed that materials pyrolyzed at intermediate temperatures of 350 and 400 °C were the most efficient at ammonia removal and were able to adsorb approximately 3.7 mg NH3/g of material. Despite extensive characterization, ammonia adsorption could not be linked to intrinsic material properties. Evaluation of the materials showed that the carbon in the pyrolyzed materials would be stable over time should the spent material be used as a soil amendment.
1. Introduction
Lignocellulosic agricultural byproducts represent an underutilized and sustainable source of material that is of little value. One such material is cottonseed hulls, and it has the potential for recycling or upcycling. Cottonseed hull is a byproduct from cottonseed oil processing and accounts for approximately 25–38% of the fuzzy whole cotton seed [1]. While not all cotton seed is used for oil, the cottonseed hull stream could be as high as 1.5 × 10⁹ kg per year based on 2020 data [2,3]. The current and proposed uses of cottonseed hulls include animal feed, fertilizer, mulch, mushroom substrate, packing material, and furfural production [4,5,6,7,8]. Cottonseed hulls’ potential for upgrading via pyrolysis has been noted before. Nanda et al. [9] considered their use as a fuel and soil conditioner. Pyrolyzed cottonseed hulls have been investigated for removing mercury from flue gases and stabilizing heavy metals in soil [10,11,12]. This study aims to provide insights into the effect of the pyrolysis temperature on the capability of pyrolyzed cottonseed hull to remove ammonia from air.
Ammonia (NH3) emissions from the poultry industry, either from raising broilers or egg laying, are of increasing concern. It is predicted that by 2030, ammonia emissions from poultry operations may reach 7.89 × 10⁸ kg per year [13]. The emission of ammonia into the environment can cause soil acidification, eutrophication, and aerosol formation [14]. Ammonia gas is not only detrimental to the environment and workers in poultry houses but also negatively impacts the health and well-being of the poultry. Noticeable behavioral changes can be seen in poultry at ammonia concentrations of 25 ppmv [15]. At greater concentrations, poultry can experience respiratory system irritation and disorders, changed food intake, reduced weigh gain, and death [15,16,17,18,19,20]. The permissible human exposure limit for ammonia is 50 ppmv over a period of 8 h. The National Institute for Occupational Safety and Health (NIOSH) has recommended exposure limits of 25 ppmv [21].
Due to these concerns, different methods have been developed to reduce the ammonia levels in poultry houses. Aeration and ventilation can help decrease the concentration of ammonia. However, due to the initial investment and operating costs during cold weather, these methods are not often implemented [22,23]. Changing to low-moisture bedding and lowering the pH of litter reduces ammonia production [22], as normal conditions are optimal for ammonia volatilization [13,22,24,25]. Spraying floors with acidic water and oil, using air biofilters, and air acid scrubbers have been documented as mitigation strategies [22]. There have been studies regarding the use of pyrolyzed material to decrease ammonia emissions. Early work by Fitzmorris et al. [26] showed effective ammonia adsorption by pyrolyzed poultry litter. This work was later confirmed by Ro et al. [27], who used pyrolyzed materials made from poultry litter and wood shavings using various activation strategies. Ramlogan et al. [28] found that pyrolyzed wood materials were a superior ammonia adsorbent compared to dairy or swine biosolids (natural or heat-treated). Acid activation with phosphoric acid (applied pre-pyrolysis) increased wood shavings’ ammonia-sorption capacity [27]. Others have found that the post-pyrolysis treatment of pyrolyzed materials with sulfuric acid also improved ammonia-adsorption capacity [29]. The acid activation of other carbonous materials, such as activated carbon, has been used to improve the adsorption capacity [30]. The oxidation of pyrolyzed maple wood together with pretreatment using CO2 (and NH3) has also been used to alter the surface chemistry and thus the adsorption potential [31] A pyrolyzed corn-cob-based material has also been combined with selected bacteria, which resulted in a slight reduction in ammonia emissions when the material was added to poultry litter [32]. Others have found that ammonia gas emissions from compost bioreactors could be reduced significantly by passing the bioreactor vent gas through a filter made with a pyrolyzed wood material [33]. An excellent review of the use of pyrolyzed materials for the treatment of air pollutants (including ammonia) has recently been published [34].
Adding pyrolyzed material to chicken manure composting has also been studied, and adding 10% pyrolyzed wood was shown to decrease ammonia emissions by 20% as compared to the untreated compost [35]. Other studies have shown that care must be taken when adding pyrolyzed materials to chicken manure compost as it may increase the pH and cause an increase in ammonia emissions [36]. The post-pyrolysis sequential treatment of pyrolyzed material with nitric acid and sodium hydroxide showed a decrease in ammonia nitrogen release to soil [37]. Zhao et al. [34] reported on several studies that added pyrolyzed materials (or biochars) in anaerobic digestion or composting operations to reduce ammonia emissions. Innovative methods such as adding pyrolyzed material to poultry feed reduced NH3 production; however, it negatively impacted the animals’ weight gain [38].
As previously mentioned, the objective of this work was to investigate the suitability of pyrolyzed cottonseed hulls to be used as an adsorbent for ammonia in air, specifically, how pyrolysis conditions impacted acidity and how the functional surface groups may have impacted performance. The knowledge that pyrolysis temperatures impact the pyrolyzed material’s pH [39,40] and surface acidic groups [27,41] warranted the study. Among studies of air pollutants removed by pyrolyzed material, Zhao et al. [34] reported, in 2022, that ammonia stands out as one of the least studied compounds. They also suggested that its removal by pyrolyzed materials deserves more studies. In addition to the ammonia adsorption studies, we evaluated and speculated on the suitability of the materials to be used for soil amendments to improve soil quality and retain carbon [42].
2. Results and Discussion
2.1. Characterization of Pyrolyzed Materials
The pyrolysis of the cottonseed hulls resulted in yields between 27 and 71% of the starting material. Higher pyrolysis temperatures resulted in a decrease in the yield up to 600 °C, where it plateaued (Table 1). This type of yield reduction is natural as more of the biomass material is vaporized as the pyrolysis temperature increases [12,43]. There are compositional changes that also occur with an increasing pyrolysis temperature. On a dry basis (db), the volatile matter decreased, the fixed carbon increased, and the ash increased with an increasing pyrolysis temperature (Table 1). Between pyrolysis temperatures of 250 and 500 °C, there was a significant increase in the alkalinity (measured as pH) of the pyrolyzed material. This type of behavior has been shown for different pyrolyzed materials made from a variety of sources, according to a meta study by Roshan et al. [39]. At higher pyrolysis temperatures, the materials became slightly less alkaline, a phenomenon also noted by others [40]. Surface analysis showed that pore-specific surface areas (Brunauer, Emmett, and Teller; BET) and micropore volumes were very low or non-existent in the materials, regardless of the pyrolysis conditions. Previous pyrolysis experiments with cottonseed hulls have shown pore surface area development at higher temperatures (e.g., 800 °C) [12].

Table 1.
Product yield and characteristics using various methods of analysis.
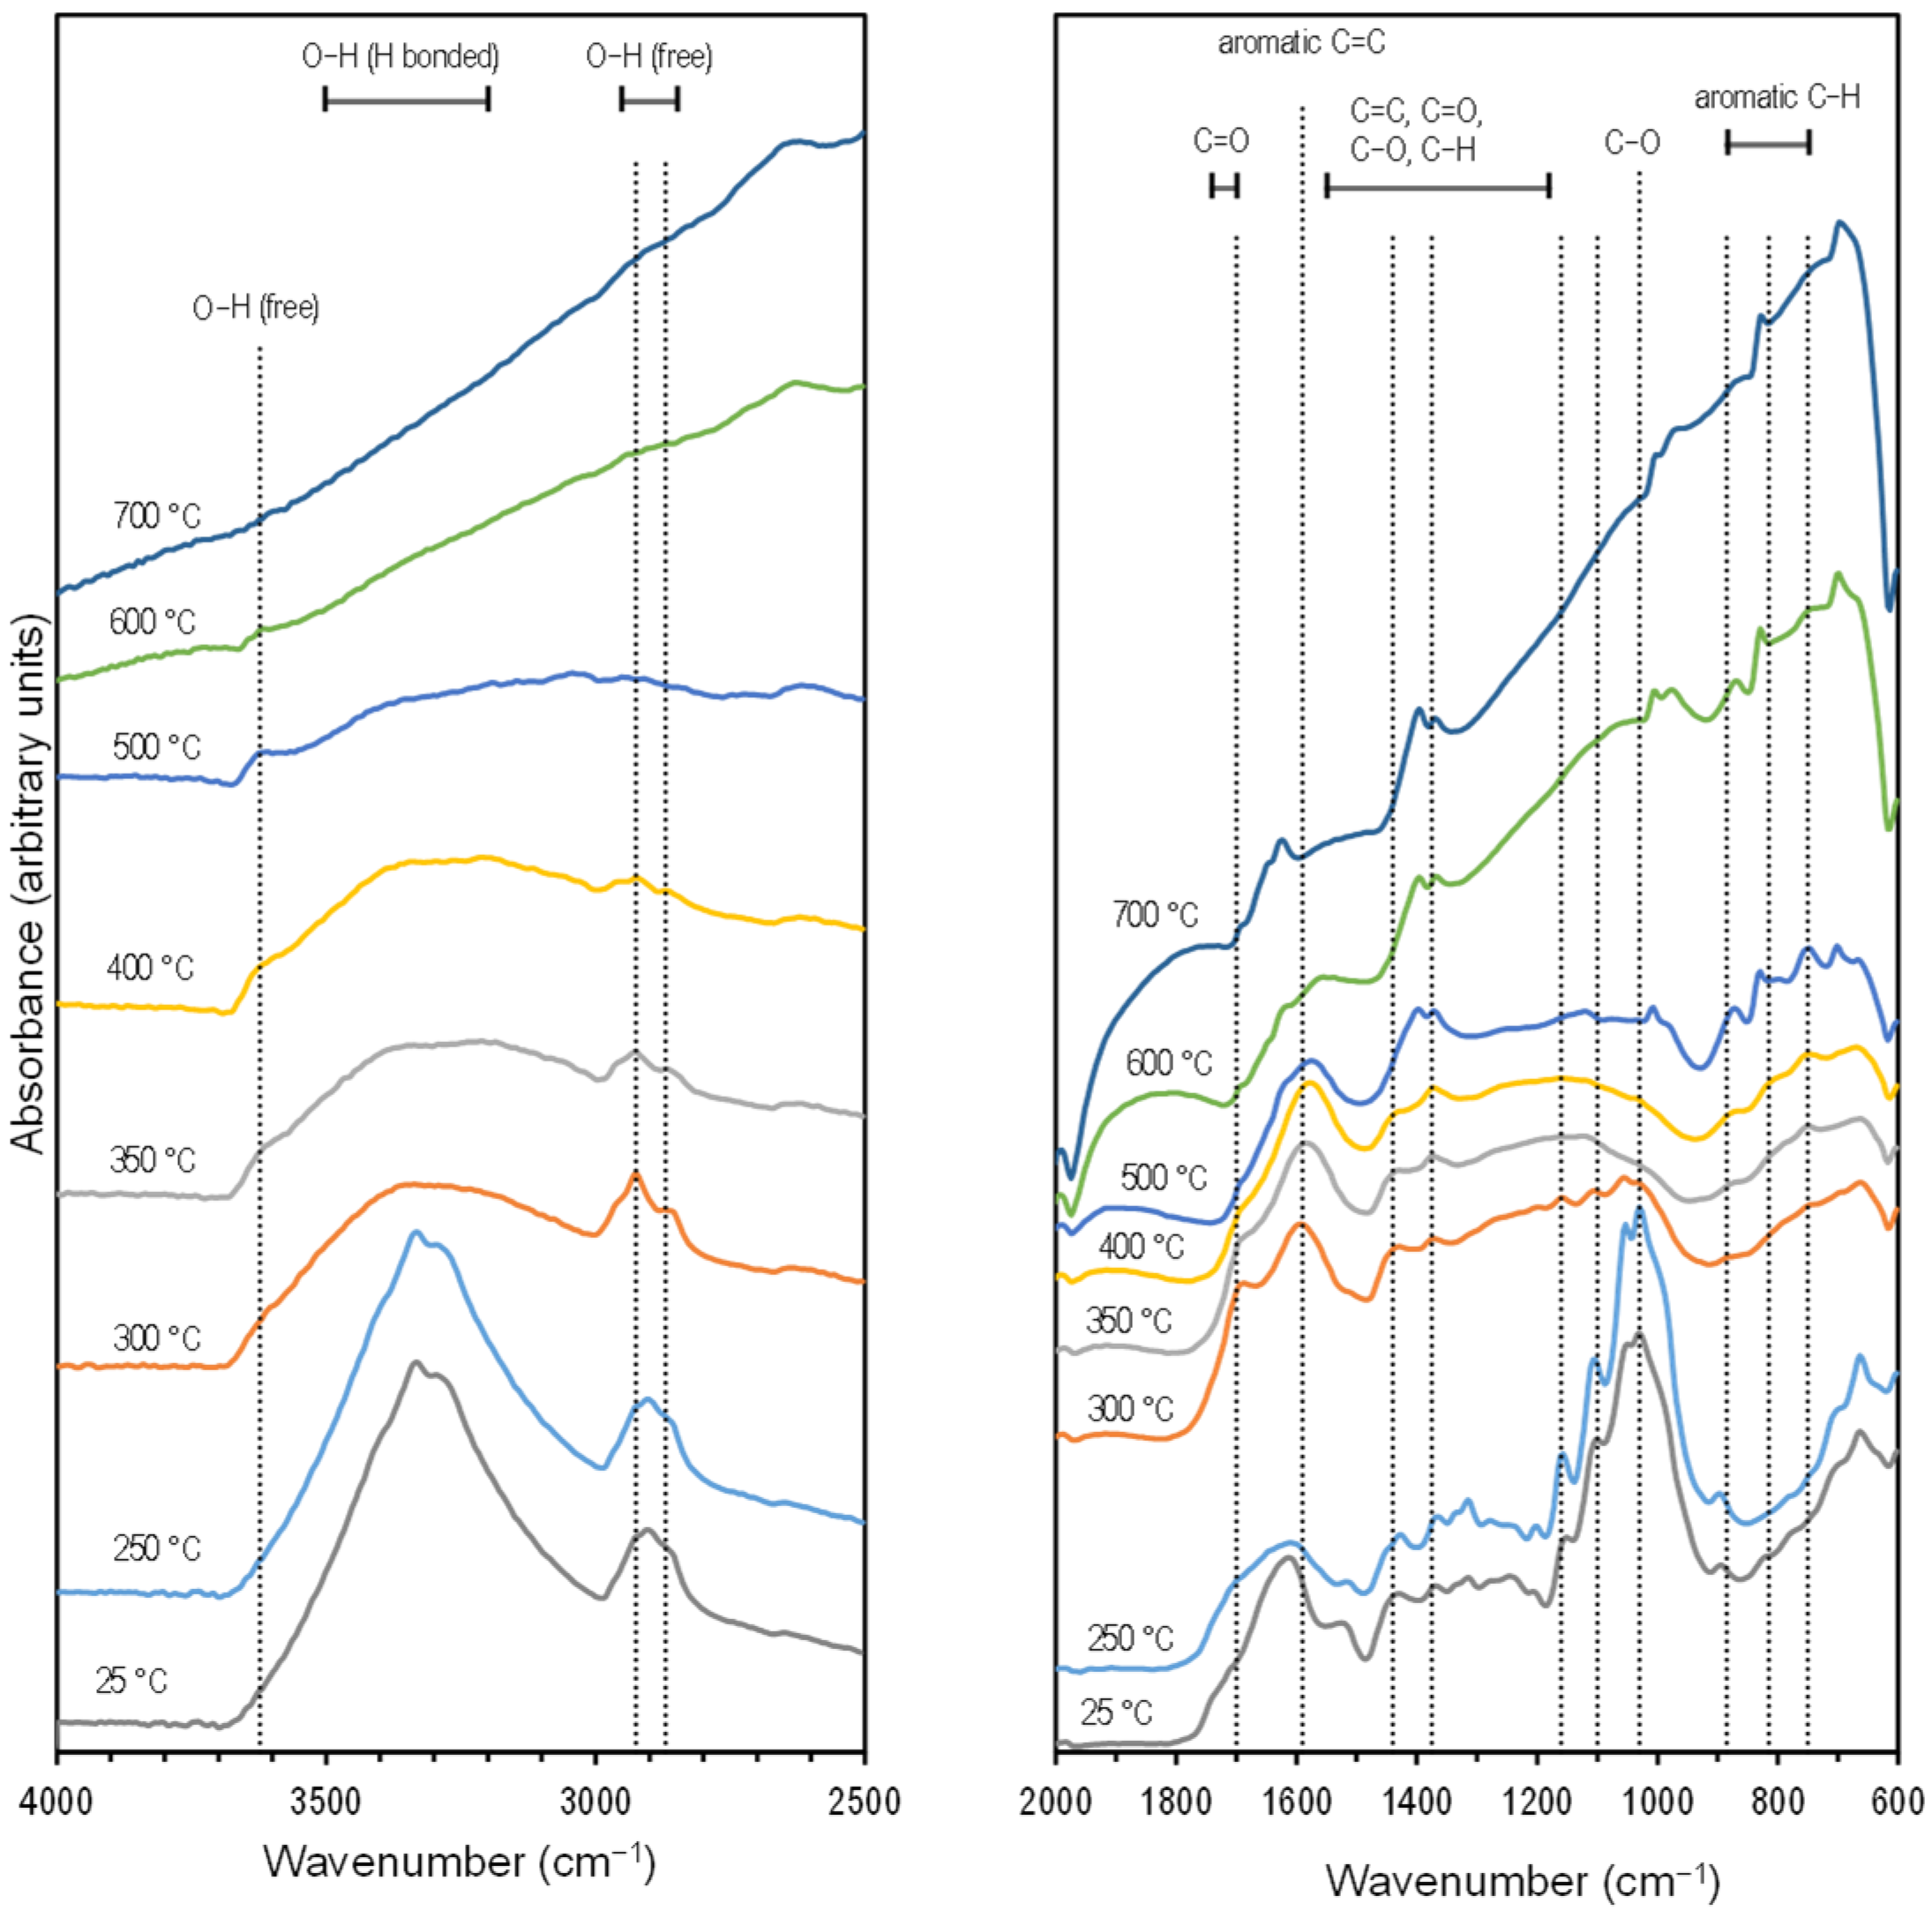
The Fourier Transform Infrared (FTIR) spectra (Figure 1) showed the typical dehydration of lignocellulosic components [44] after pyrolysis with a size reduction in the broad peak at 3500–3200 cm−1. At the same time, there was an increase in intensity and peak definition for the aromatic region 885–750 cm−1, especially noticeable at a 500 °C pyrolysis temperature. Separate from the interpretation of the FTIR spectra, the carbon aromaticity for this material was estimated at 93% based on the correlations with the hydrogen/carbon (H/C) ratio [45]. The reduction of defined features in the spectra as the pyrolysis temperature was increased is typical for cottonseed hulls [46], wood, and grass [44] as the material becomes more graphitic [46]. The results from the thermogravimetric analysis and infrared spectroscopy (TG-IR) characterization are presented in Section 2.3.
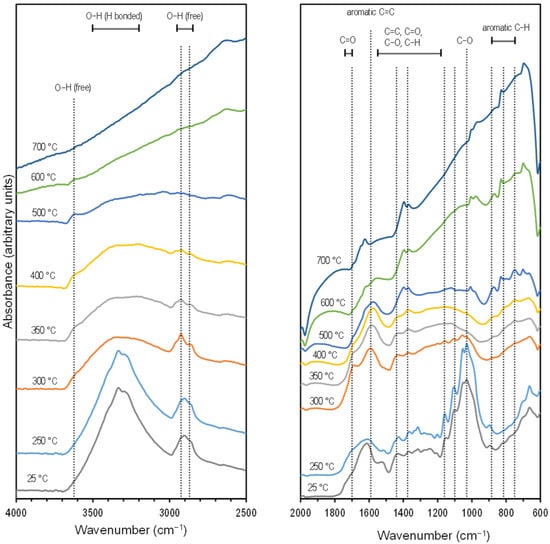
Figure 1.
Stacked FTIR spectra of cottonseed hulls at different pyrolysis temperatures. Offsets (within panels) and scales (between panels) were introduced to help with visualization.
2.2. Removal of Ammonia from Air by Pyrolyzed Materials
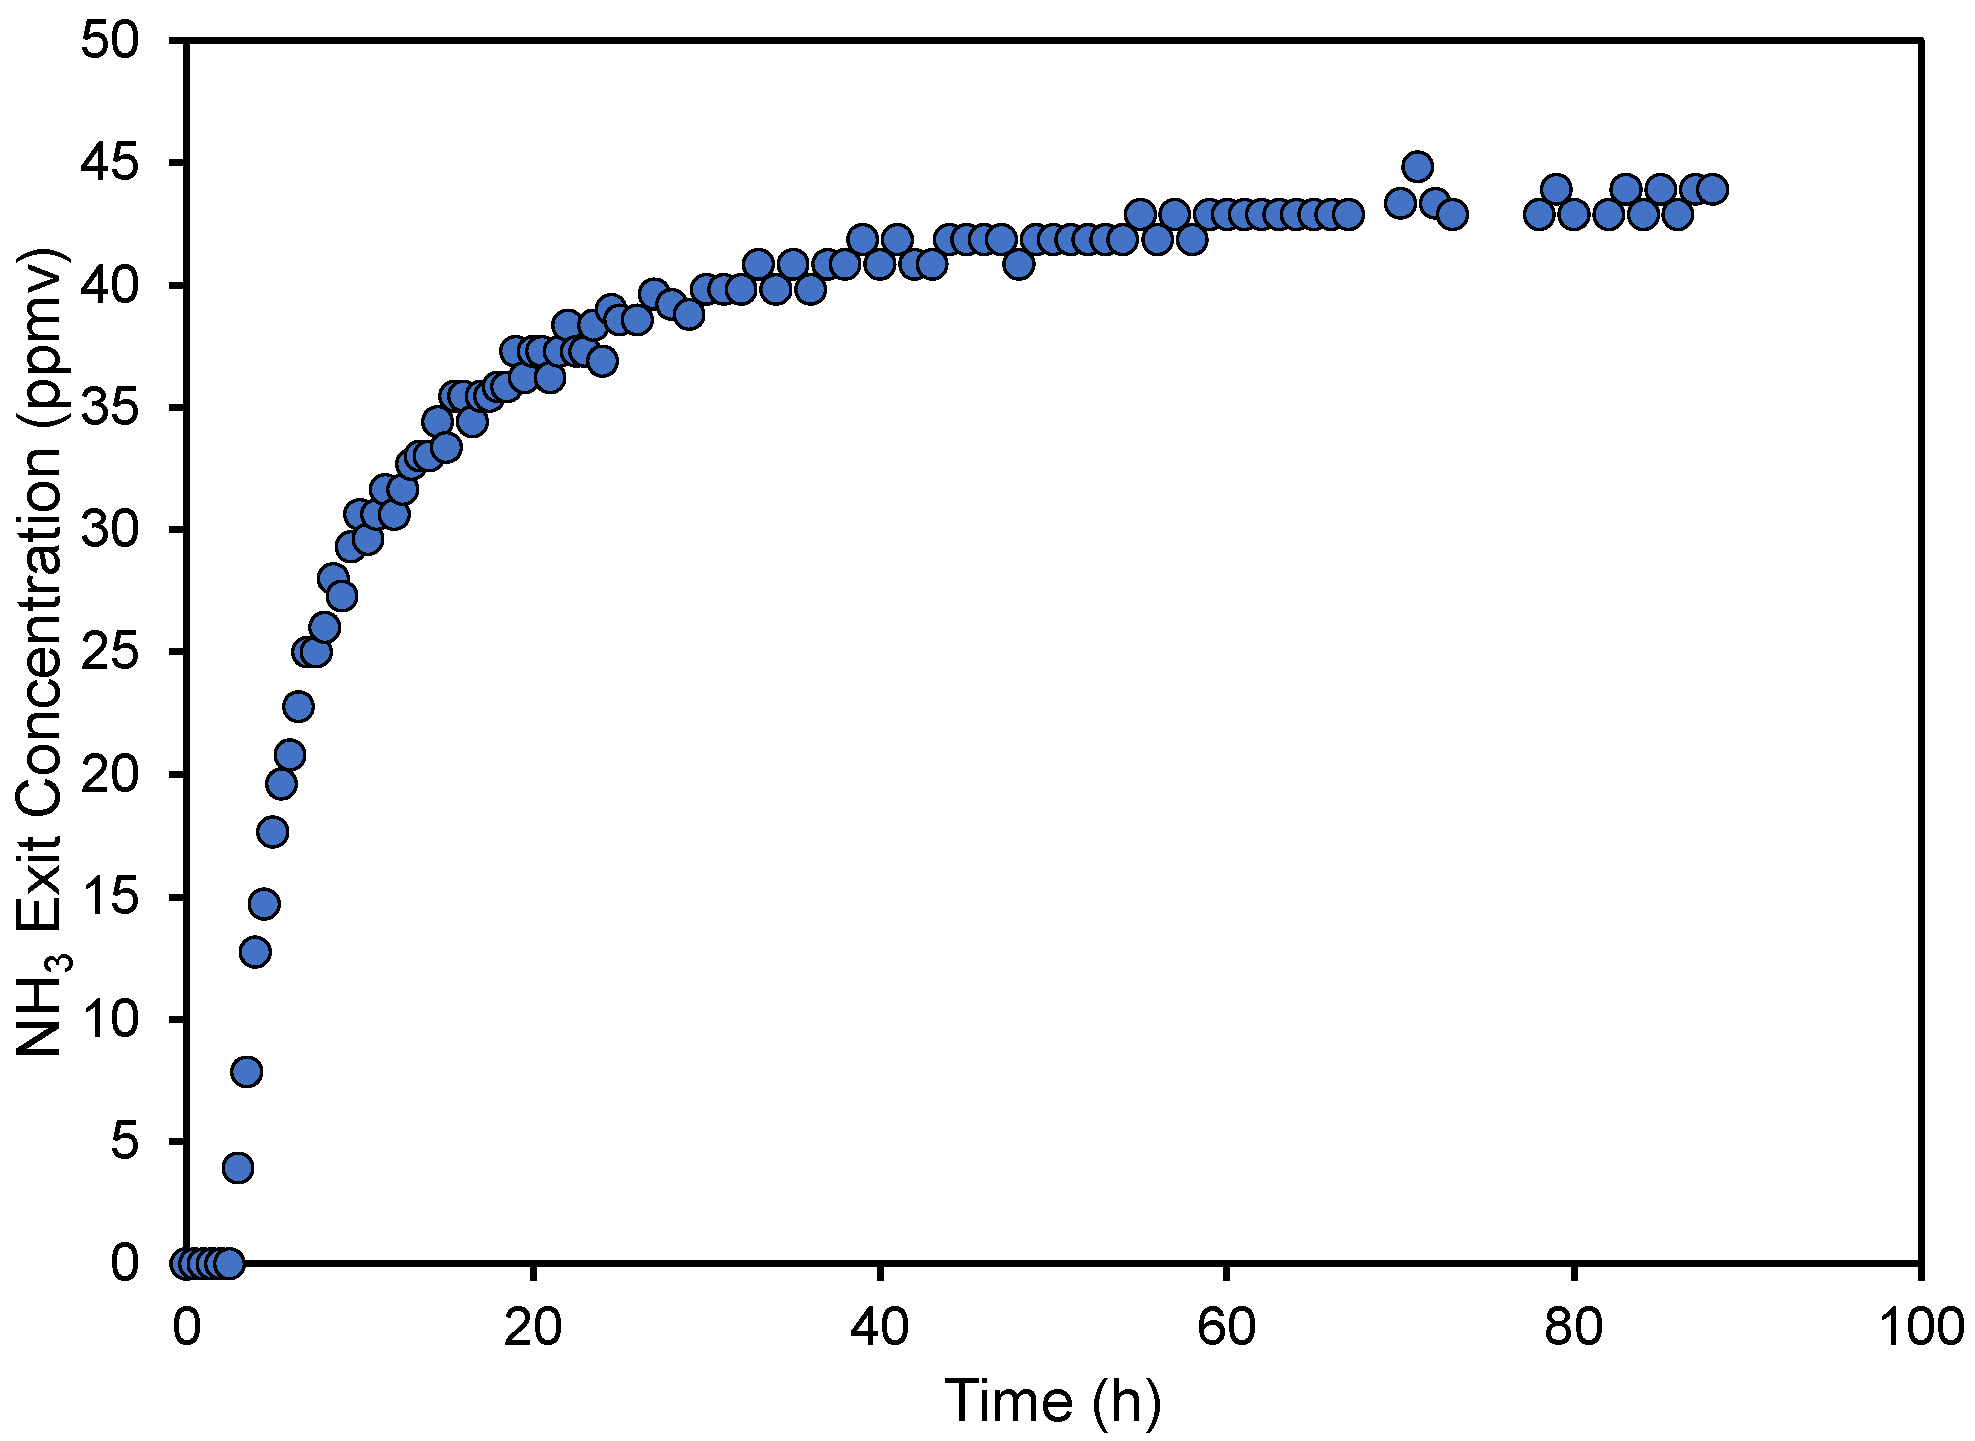
Typical results from one of the column experiments can be seen in Figure 2. As is noted, there is a section at the beginning of the experiment where the exit ammonia concentration is zero. Then, the exit concentration increases rather rapidly, followed by a slowdown and asymptotic increase towards the entry concentration. This type of breakthrough behavior may look unusual for column studies but is similar to what was observed with unactivated pyrolyzed materials created from wood shavings [27] and with acid activated carbon [47]. It can be indicative of performance when the length of the column is shorter than the mass transfer zone [48] or when flow channels are formed [49]. This is common with column material that is not uniform (in size and shape), like in our case. Normally, our experiments were not allowed to run for as long as the one displayed in Figure 2 but were terminated when the exit concentration was above the maximum desired limit of 25 ppmv.
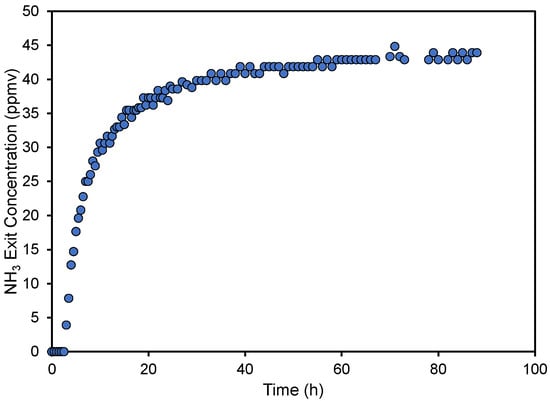
Figure 2.
Ammonia concentration of the treated air at the column exit as a function of run time for pyrolyzed cottonseed hulls created at a temperature of 250 °C.
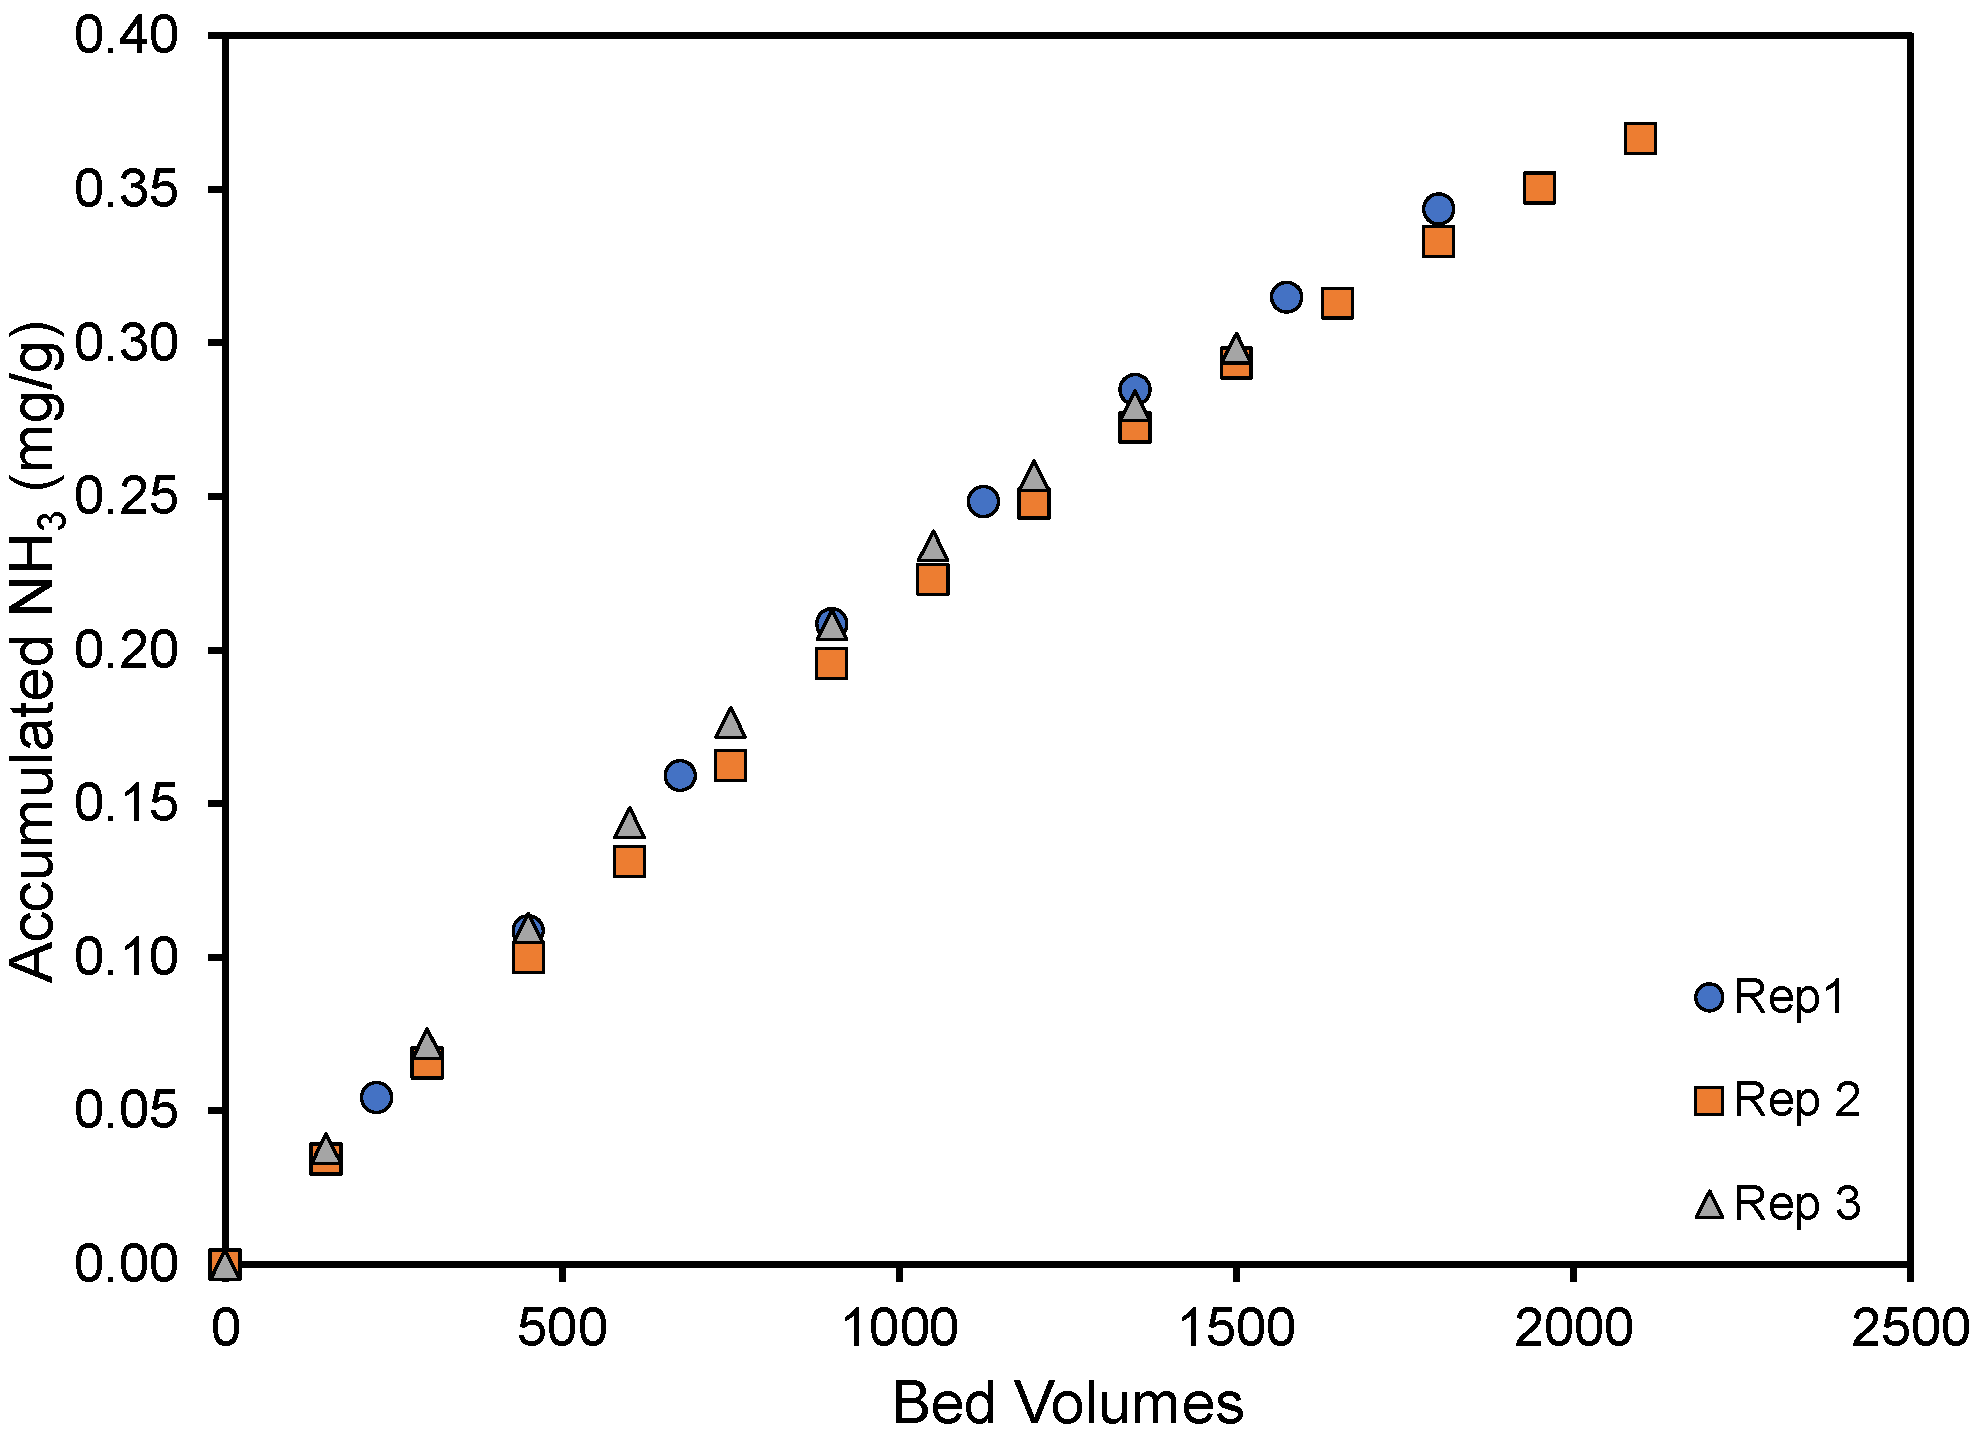
The reproducibility of the column experiments is illustrated in Figure 3, where the amount of ammonia removed per gram of material has been plotted as a function of the gas volume treated (expressed as bed volumes) for triplicate experiments. As is noted, very good agreement was noted between replicate experiments. Here, the small 10 mL columns were able to treat 2000 bed volumes, or 20 L, of ammonia-containing air before the ammonia in the exit stream reached 25 ppmv.
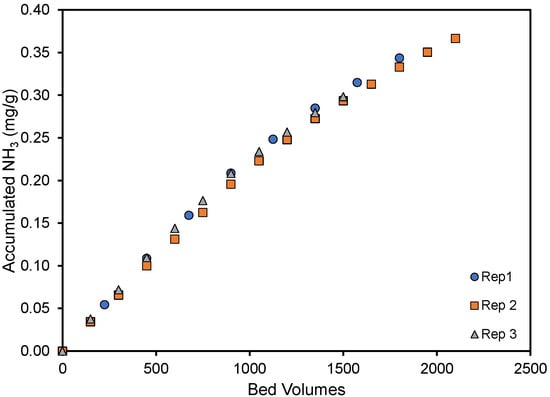
Figure 3.
Accumulated NH3 per gram pyrolyzed material until the exit concentration was 25 ppmv. Two thousand bed volumes correspond to approximately 6 h and 45 min of column use. The cottonseed hulls were pyrolyzed at 250 °C.
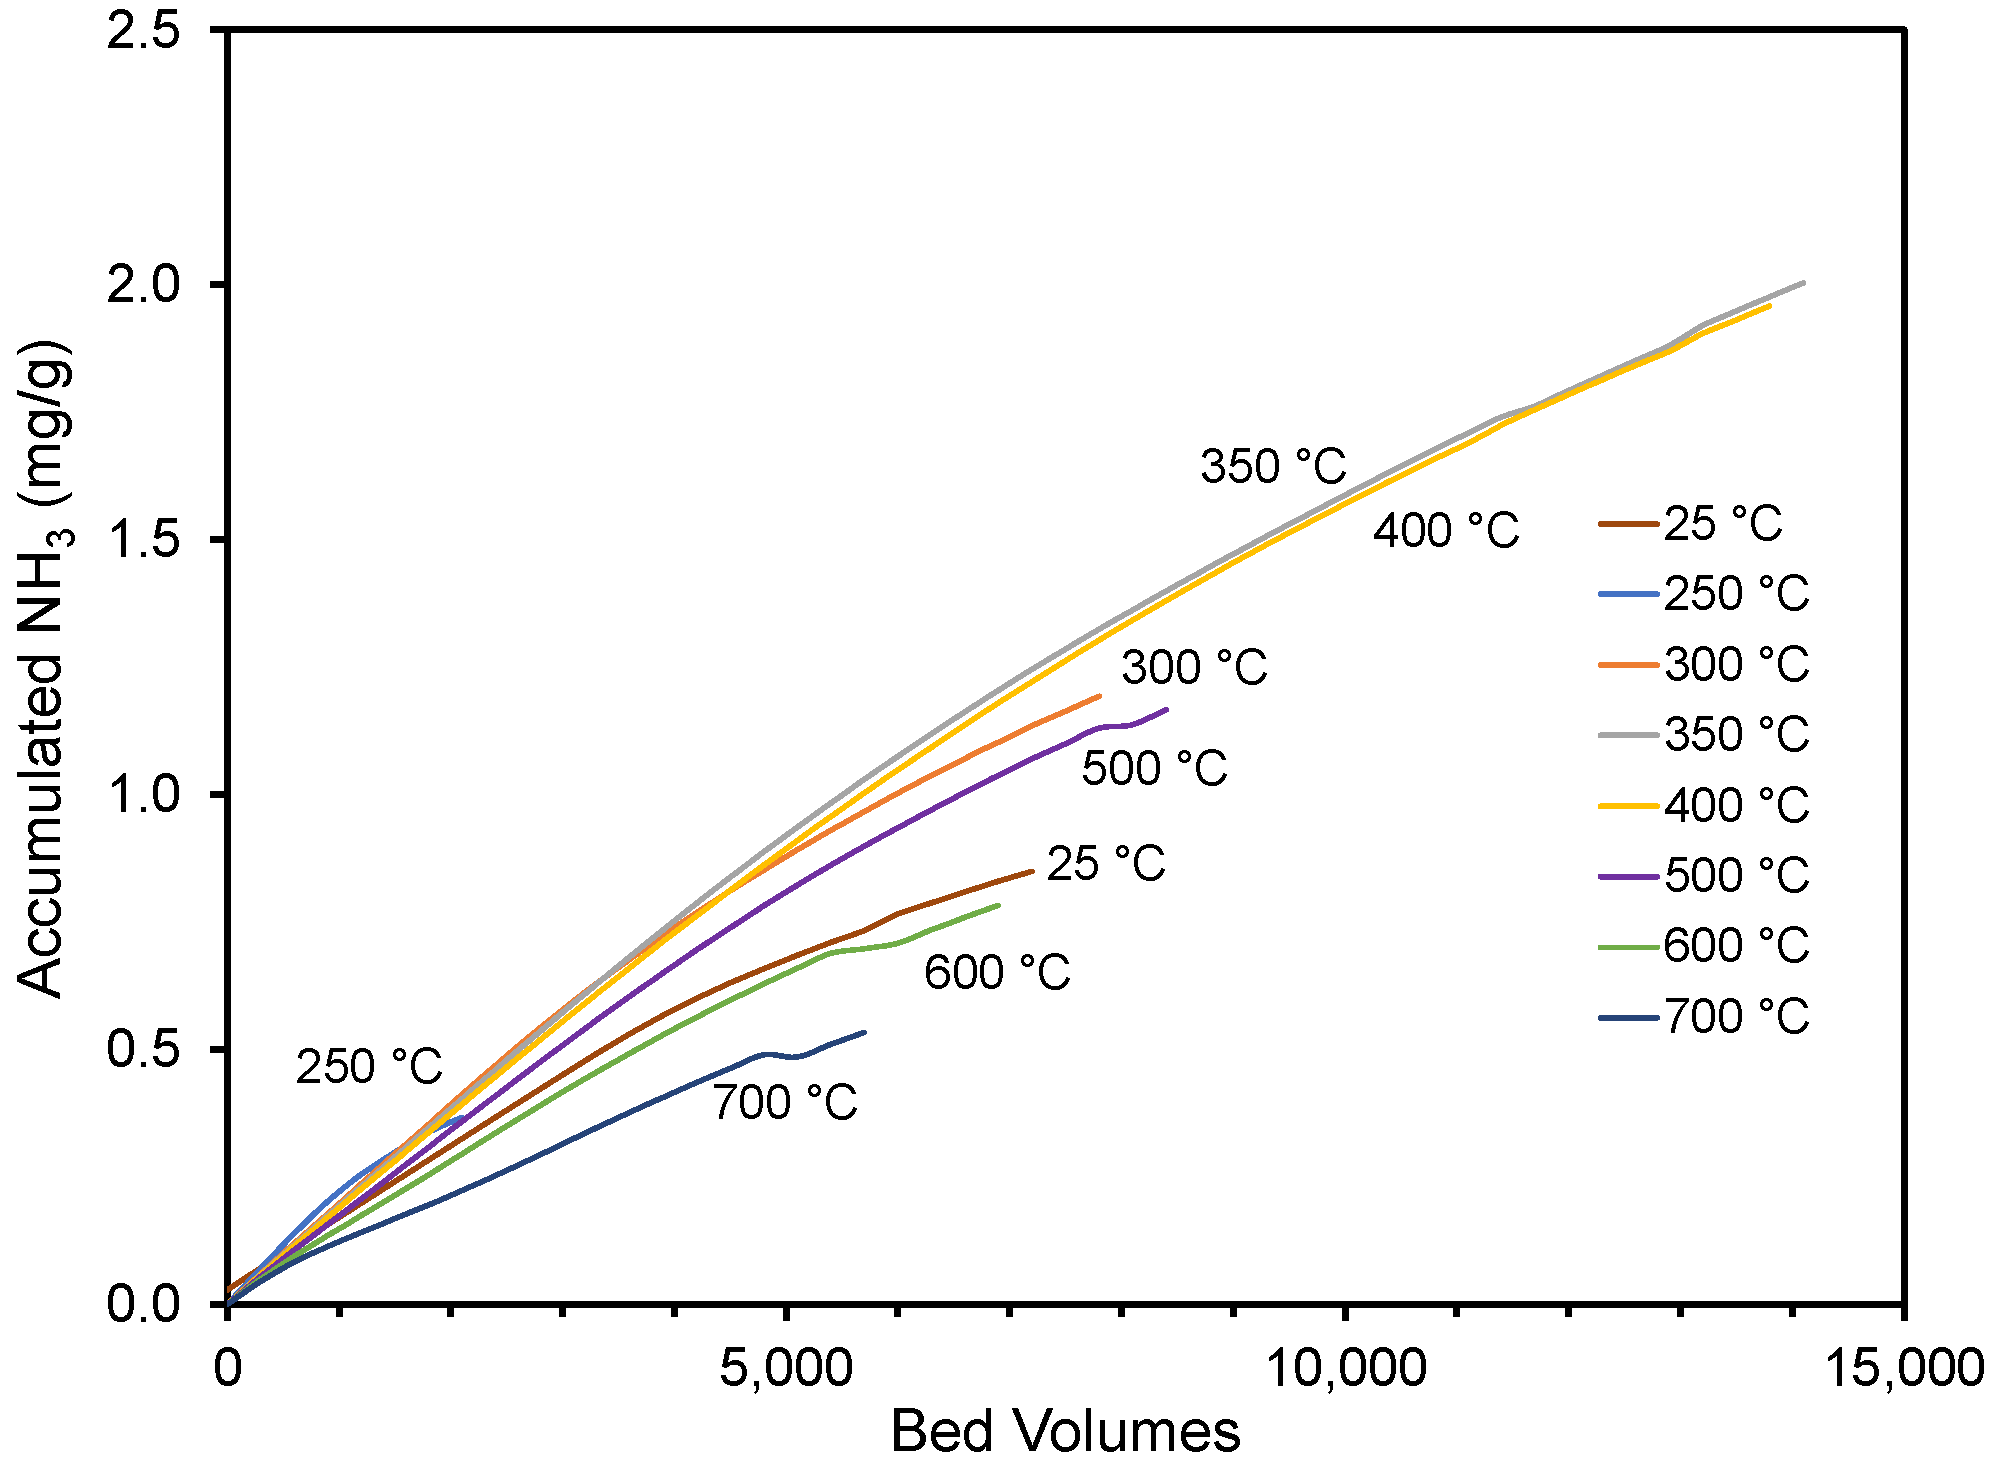
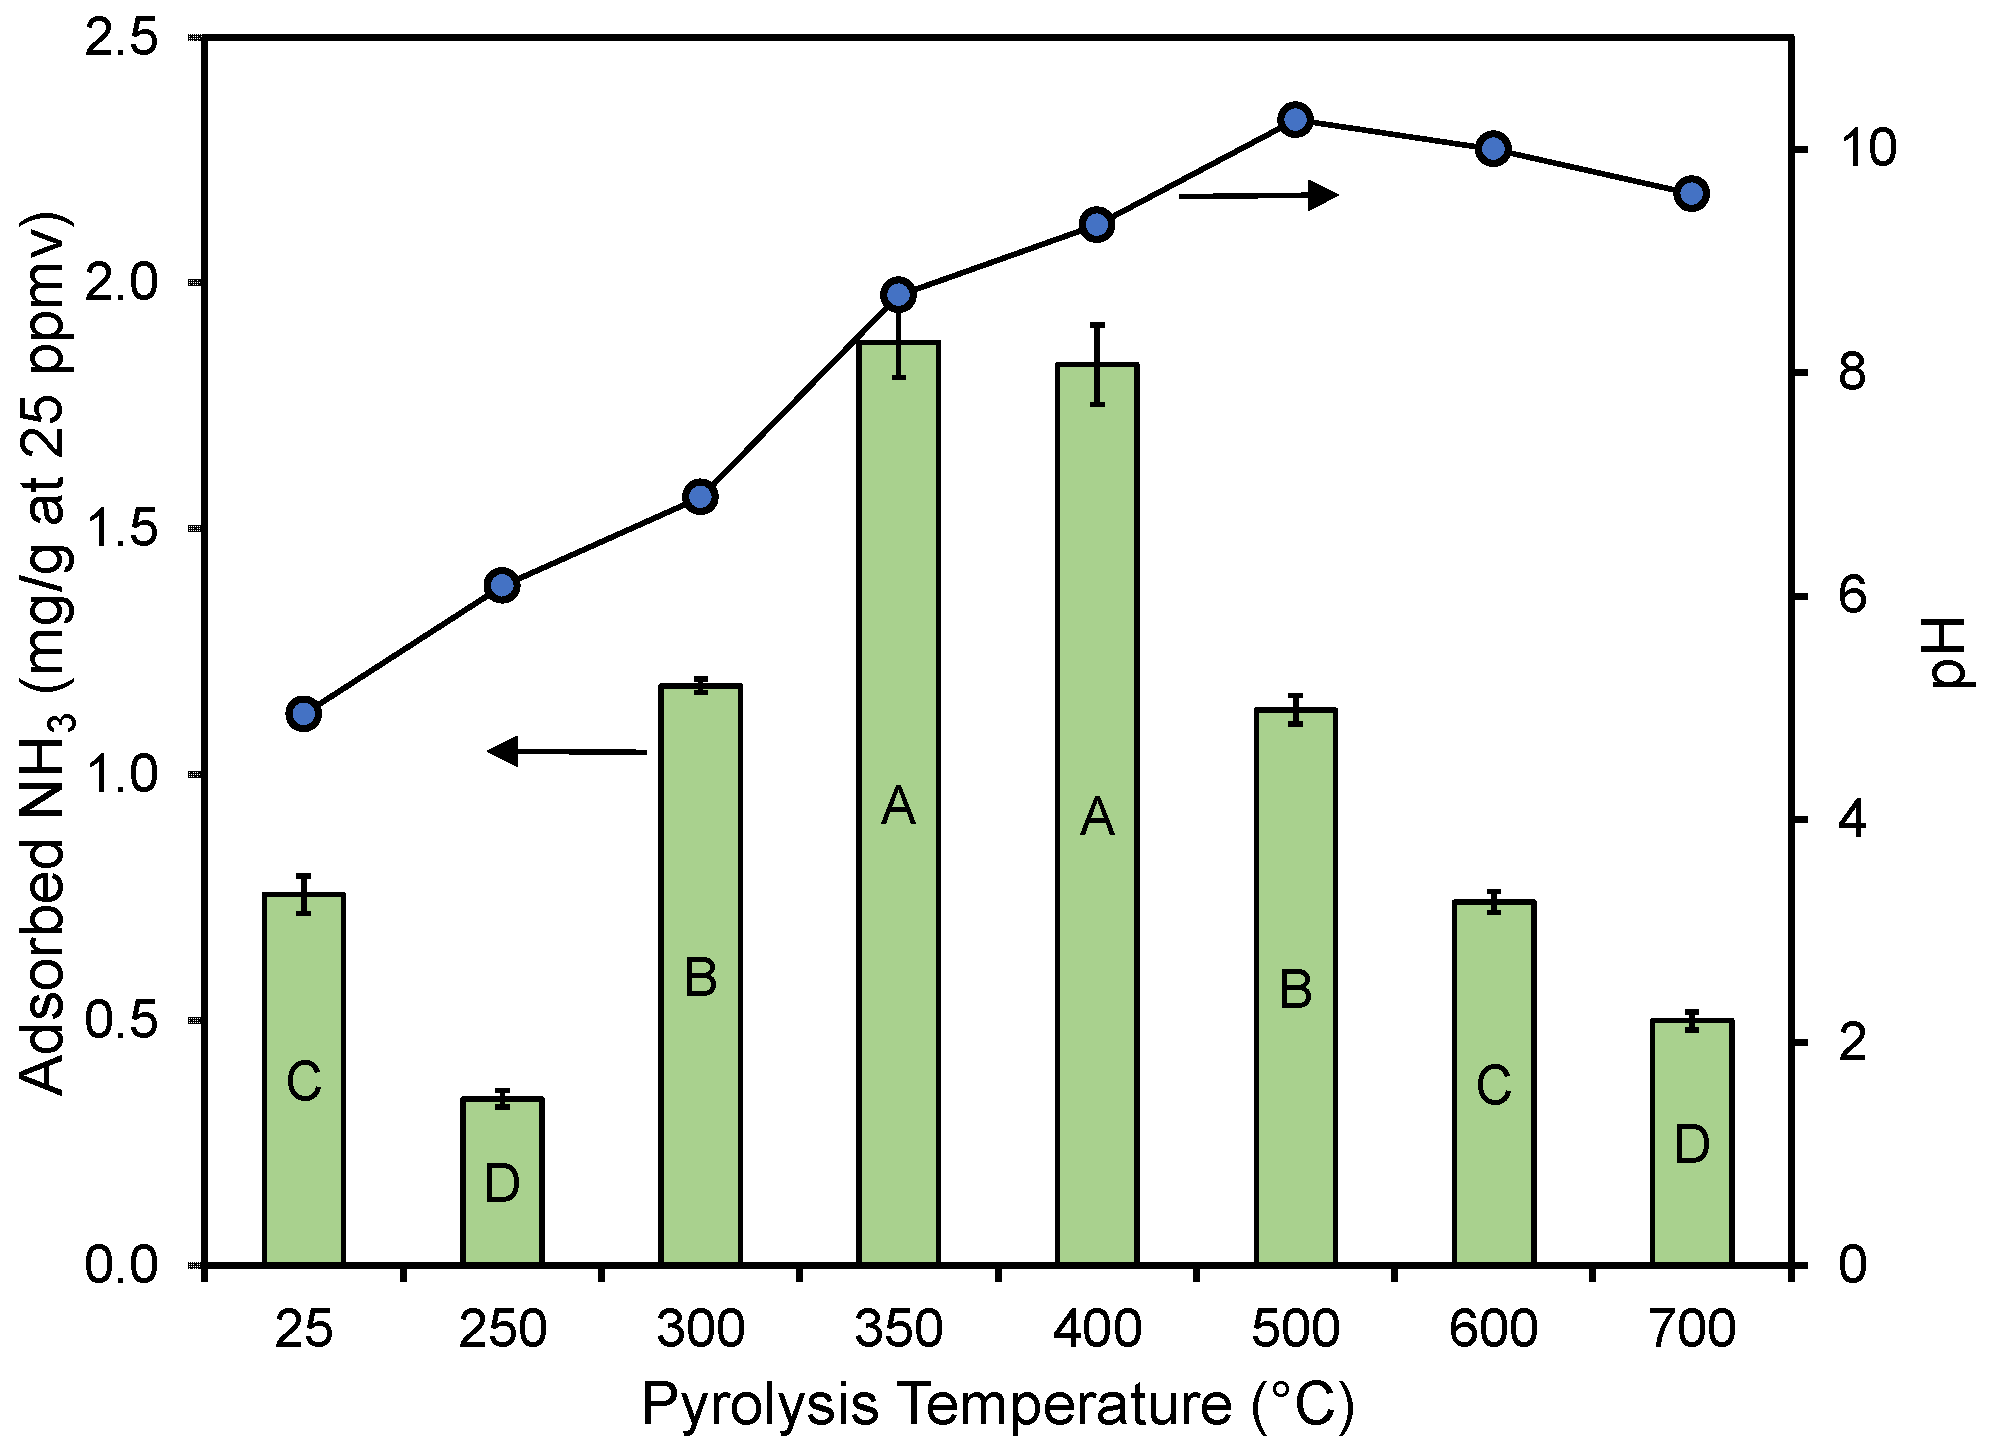
In Figure 4, the average adsorption performance in replicate experiments is shown for the different materials. While a slight curvature exists, the accumulated adsorbed ammonia amount was nearly linear with the bed volumes treated, regardless of the pyrolysis temperature. The end of each curve corresponds to the accumulated amount when the 25 ppmv breakthrough was observed. The impact of pyrolysis temperature on performance has been summarized in Figure 5, where the performance and material’s pH (see Table 1) have been plotted against the pyrolysis temperature. The results show that materials created at ≤300 and ≥500 °C did not perform as well as the materials created at 350–400 °C. The un-charred material performed statistically better than the material created at 250 and 700 °C and equal to the material created at 600 °C. A similar trend was reported by Hitomi et al. [43], who found that a pyrolysis temperature of 400 °C was better than higher temperatures for ammonia adsorption.
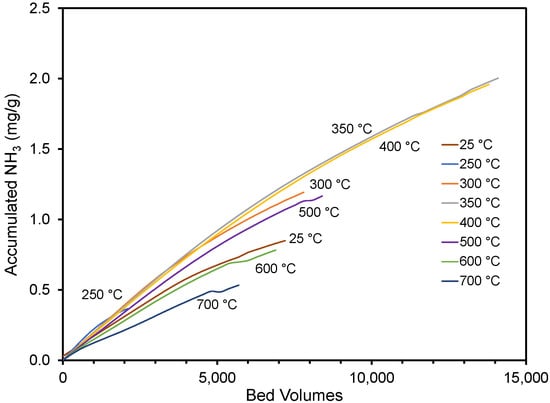
Figure 4.
Accumulated NH3 per gram pyrolyzed material until the exit concentration was 25 ppmv. Ten thousand bed volumes correspond to approximately 34 h of column use. The cottonseed hulls were pyrolyzed at various temperatures. Accumulation on un-pyrolyzed cottonseed hulls is also shown.
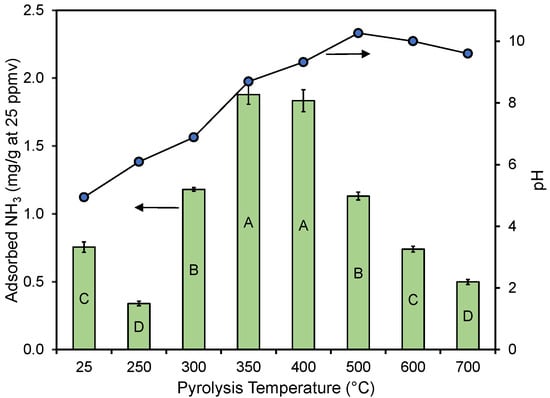
Figure 5.
Ammonia removal efficiency and pH as a function of the pyrolysis temperature. Error bars correspond to standard errors of means in triplicate column experiments. Significant differences in results between different treatments are represented by different letters inside the bars using Tukey’s HSD [50] with α = 0.05.
Under application conditions, adsorption columns such as the ones tested are rarely used in a single column configuration. Instead, columns are installed in series with a configuration that allows a column to be completely spent (i.e., reached its maximum capacity) before replacement. For design purposes, it is reasonable to assume that the maximum capacity is twice that of the capacity when the exit concentration reaches 50% of the inlet concentration [51,52,53]. In Table 2, this calculated maximum capacity is shown for each of the materials. This value can be seen as a single point on an isotherm, indicating the capacity at an equilibrium concentration of 50 ppmv.

Table 2.
Measured and estimated ammonia-adsorption capacity of cottonseed hulls and its pyrolyzed products. Significant differences (Tukey’s HSD, α=0.05) between measured capacities are represented by different capital letters.
The estimated average capacity of the best performing materials was approximately 3.7 mg NH3/g of material, considering the result for materials made at 350–400 °C. This is higher than the capacities of non-washed steam-activated and un-activated pyrolyzed materials created from softwood shavings obtained by Ro et al. [27]. They reported capacities of 0.62–2.9 mg NH3/g of adsorbent with 20–100 ppmv of ammonia in air. It is significantly lower than the capacities (25–53 mg/g) obtained by the same authors when they used acid-activated pyrolyzed materials [27]. Fitzmorris et al. [26] showed that steam-activated materials from chicken litter and a commercial steam-activated carbon removed ammonia in a small-column experiment and had capacities of 2.4 and 1.2 mg NH3/g sorbent, respectively. However, the estimated inlet ammonia concentrations in these experiments were significantly higher (>1600 ppmv). Wystalska and Kwarciak-Kozlowska [33] reported that a filter with 500 g of material removed approximately 130 mg of ammonia over 7 days, which calculates to 0.26 mg NH3/g of material with an inlet concentration of 10–64 ppmv. In a column study with mixed gases, Bhandari et al. [30] reported a capacity of 8 mg NH3/g of pyrolyzed switchgrass when the gas contained 300 ppmv of NH3. A similar value of 7.2 mg/g can be calculated from the work by Tsutomu et al. [54], who used pyrolyzed Japanese cedar, contacting it with 10 ppmv of ammonia. A significantly higher adsorption capacity, 42–51 mg/g, was noted by Ramlogan et al. [28,55], when pyrolyzed wood materials were used in batch studies with 50 ppmv ammonia in nitrogen. This is an unusually high value, considering that this material was not listed as pre-treated or activated. It is similar to a value of 42 mg NH3/g of nitric-acid-treated activated carbon obtained by Huang et al. in column studies with 10,000 ppmv NH3 in helium [47].
2.3. Linking Performance to the Pyrolyzed Material’s Properties
Pyrolysis had a clear impact on the pH of the resulting char product, with the pH increasing with an increasing pyrolysis temperature up to about 500 °C, after which the pH of the material was near constant (Table 1 and Figure 5). Acidity shifts the NH3 to NH4+ equilibrium to the non-volatile NH4+. Note that the pH of the two materials made at 250 and 300 °C and the raw material (25 °C) (Figure 5) were well below the pKa value of 9.25 for NH4+ [56]. This should theoretically be beneficial for the adsorption of NH3 as the molecule would be fully protonated on these materials. However, based on the results presented in Figure 5, the pH of the material and its performance did not appear linked in any way (also see Supplementary Materials). The absence of a correlation between the char bulk pH and ammonia adsorption was also noted by Ro et al. [27], who studied several types of activated and non-activated pyrolyzed materials.
Ammonia-uptake performance has previously been attributed to acidic surface oxygen groups. In an extensive review of the literature, Zhao et al. [34] concluded that acidic groups (–SO3H, –COOH, and –OH) had more impact than the pore structure on the ammonia-adsorption capacity. Huang et al. [47] found that the ammonia breakthrough capacity was correlated with the total number of acidic groups on modified activated carbons. Goncalves et al. [41] was able to correlate surface pH and carbon dioxide (CO2) release from acidic oxygen surface groups, during thermal degradation analysis, with the capacity of activated carbon to adsorb ammonia. Ro et al. [27] could correlate some (but not all) of the ammonia-adsorption capacity with the release of CO2 during a similar thermal degradation analysis. It should be pointed out that these highlighted studies focused mostly on materials that had been activated or oxidized [27,41,47], where the materials would have undergone significant changes to increase the oxygen-containing acidic surface groups.
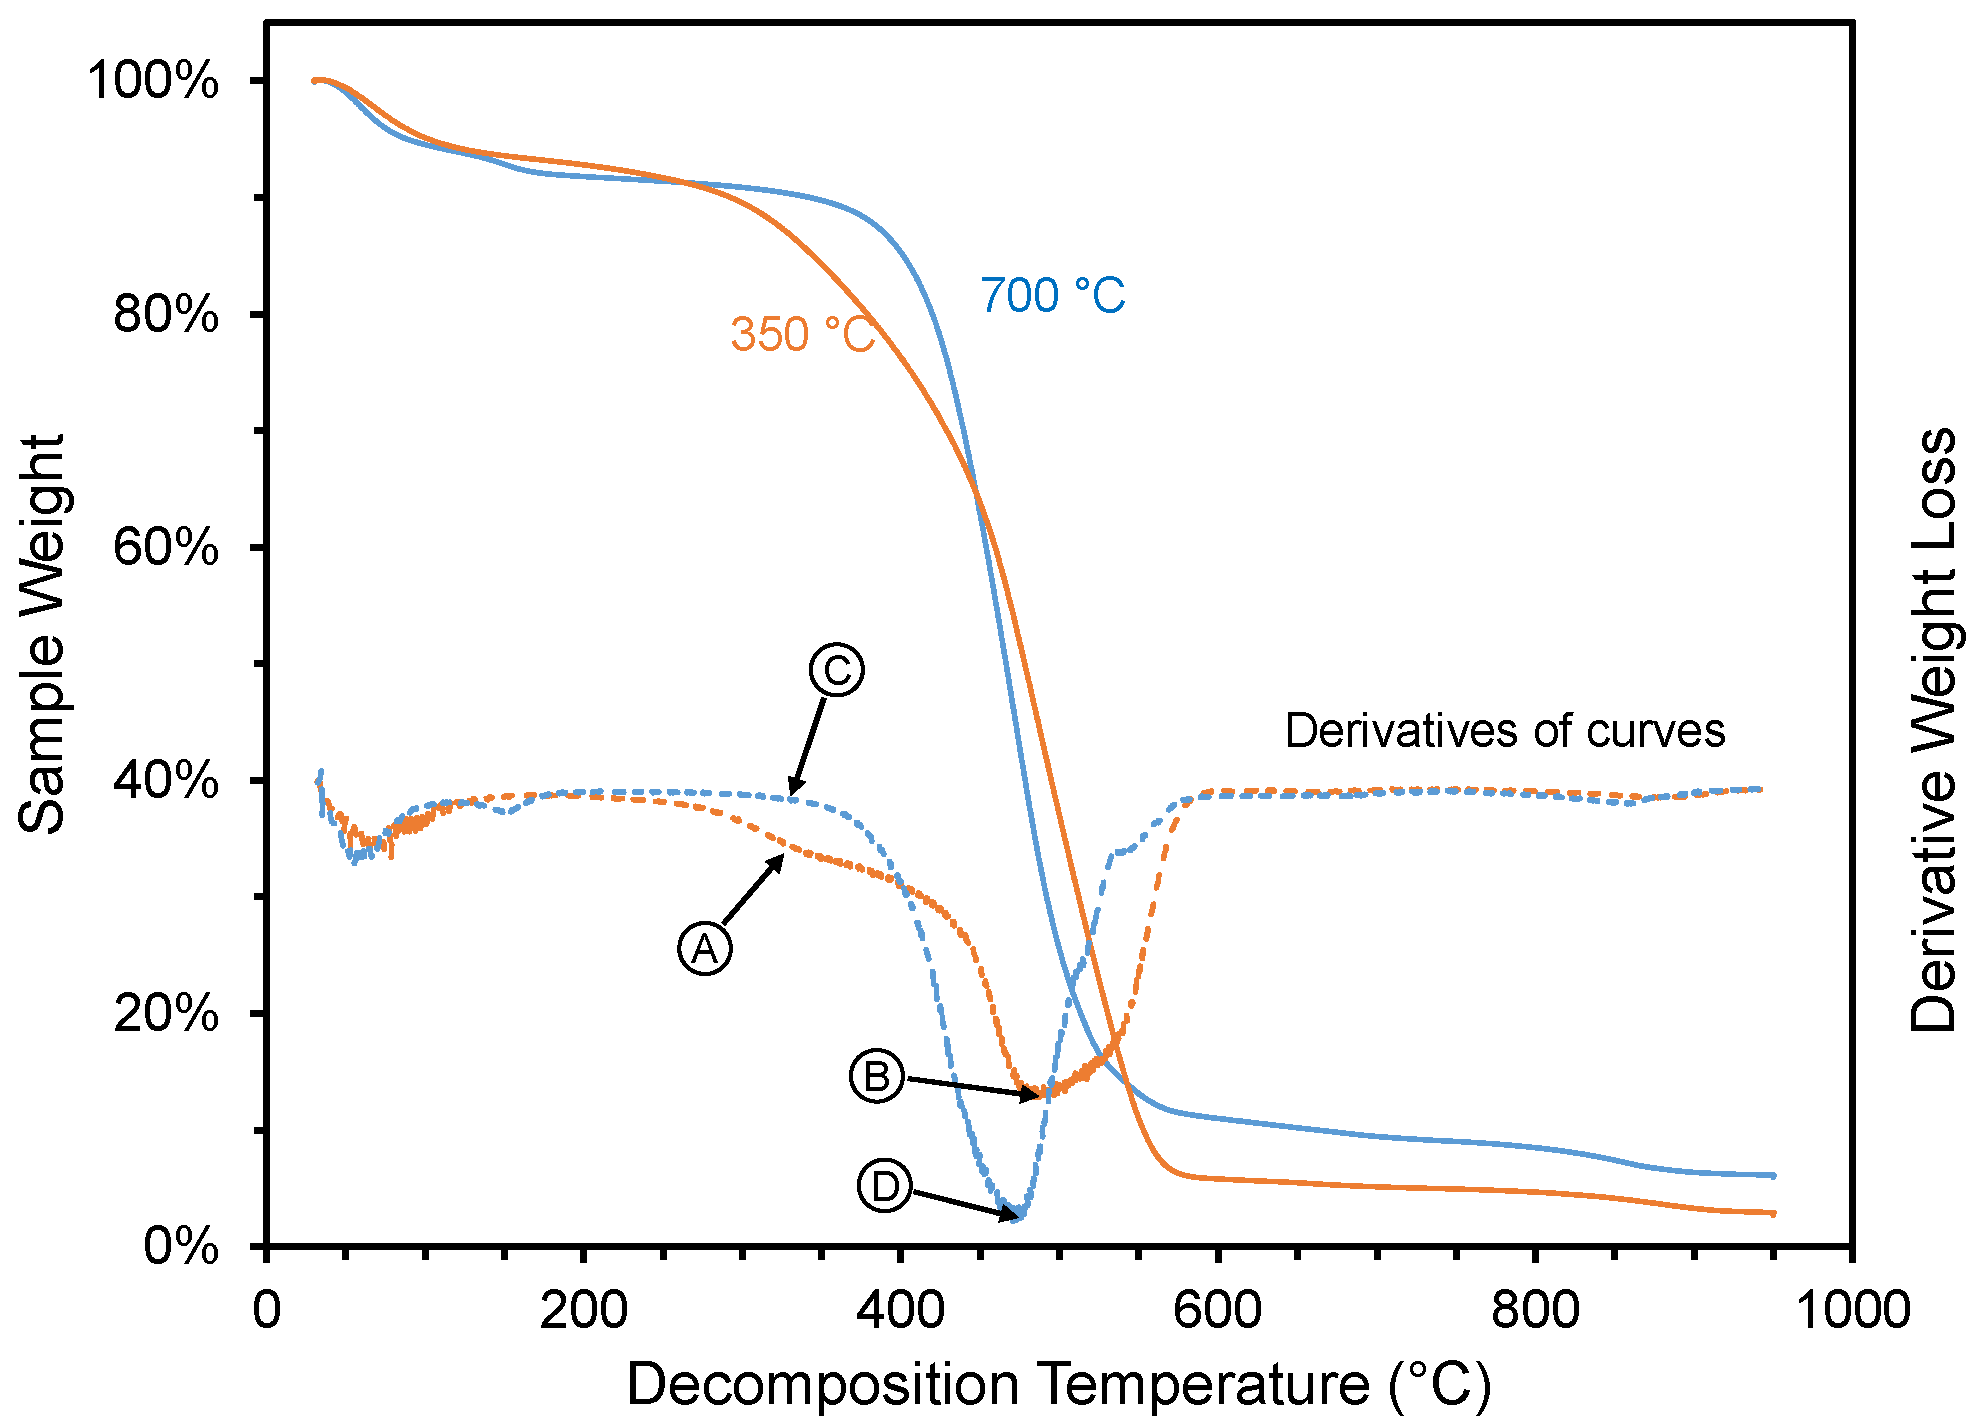
The thermal degradation analysis results are shown in Figure 6 and Figure 7. The weight loss of two pyrolyzed materials during thermal degradation studies are shown in Figure 6, one with high ammonia-adsorption capacity (350 °C pyrolysis temperature) and one with low ammonia-adsorption capacity (700 °C pyrolysis temperature). After the initial weight loss at <150 °C, the material made at 350 °C showed four distinctive weight loss steps (Figure 6): (1) a gradual weight loss between 300 to 450 °C, (2) followed by a sharper weight loss between 450 and 575 °C, (3) a slow weight loss between 575 and 850 °C, and (4) a small final weight loss between 850 and 950 °C. The shape of the weight loss curve (Figure 6) for the material created at 350 °C is very similar to the thermogravimetric analysis of pyrolyzed biomass at 200–400 °C [57] or un-pyrolyzed biomass [58], noted by others. They attributed the second step to the thermal degradation of hemicellulose, the third step for the degradation of cellulose and the fourth step for the degradation of lignin. In the case of the material created at a higher temperature (700 °C), which had a low ammonia-adsorption capacity, the second and third weight loss steps were not present but instead replaced with smooth continuous weight loss between 375 and 575 °C. Of the other materials analyzed via thermal decomposition analysis (i.e., materials created at 400, 500, and 600 °C), the curve for the material created at 400 °C looked very similar to the one created at 350 °C, and the curves for the materials created at 500 and 600 °C looked very similar to the one created at 700 °C (see Supplementary Materials).
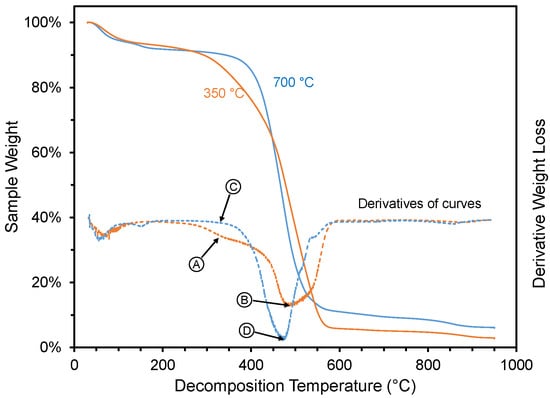
Figure 6.
Weight loss for selected materials created at two different pyrolysis temperatures (350 and 700 °C). Arrows and circles (with letters) represent decomposition conditions (330, 477, and 485 °C) where FTIR spectra were collected during TG-IR (Figure 7).
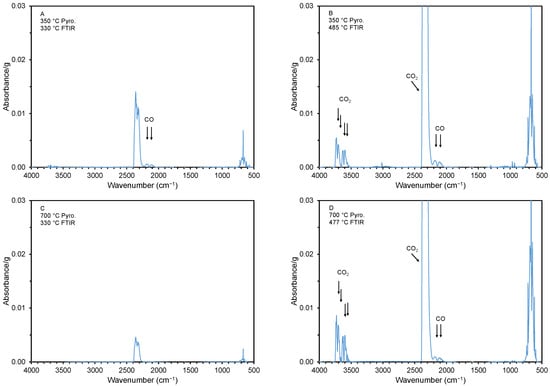
Figure 7.
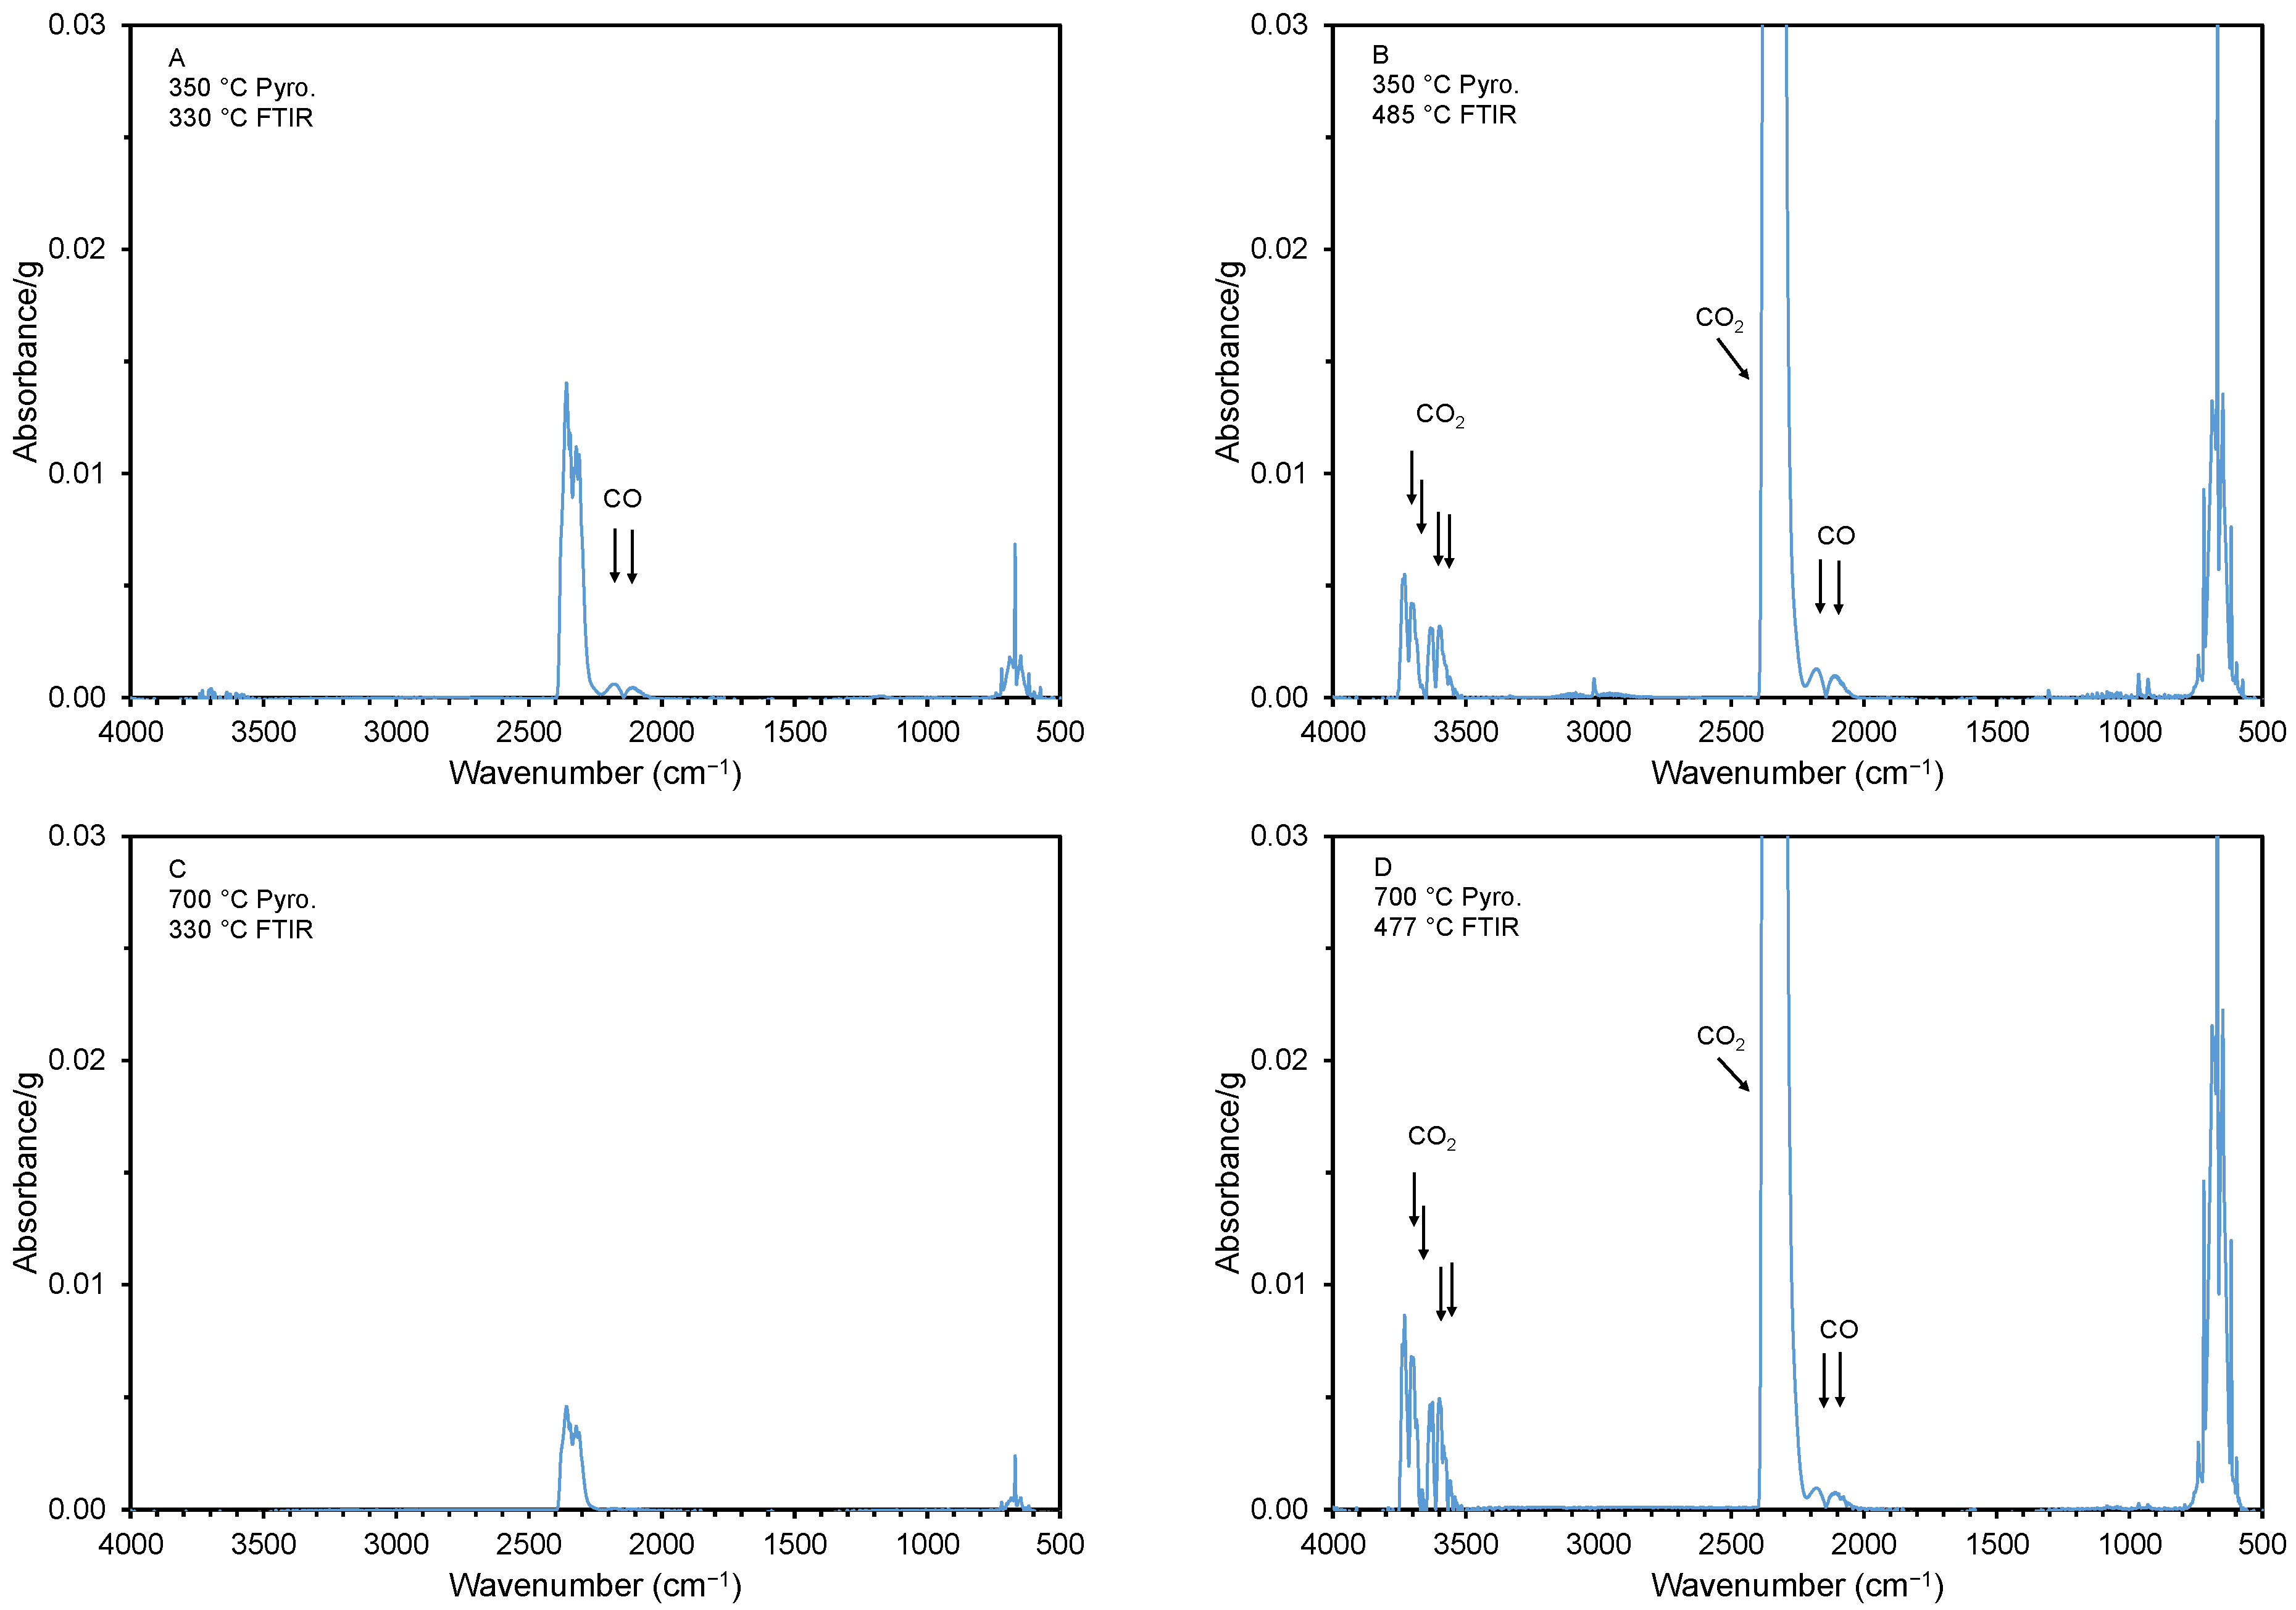
FTIR spectra at various thermal decomposition (i.e., desorption) temperatures. The spectra were collected at the desorption temperatures of 330 (A,C), 477 (D), and 485 °C (B) (see arrows and circles in Figure 6). The samples were cottonseed hulls pyrolyzed at 350 and 700 °C.
The FTIR spectra during the initial weight loss for the material with a high and low adsorption capacity are shown in Figure 7. Panels A and B show spectra for the material created at 350 °C at a TG desorption temperature of 330 and 485 °C. Note that carbon monoxide (CO), with a characteristic double peak around a wavenumber of 2145 cm−1 [59], is released at both desorption temperatures. On the other hand, CO2, which has two characteristic double peaks at around 3510 and 3710 cm−1 [60], is only released at the higher desorption temperature (485 °C). For the material created at the higher pyrolysis temperature of 700 °C, CO and CO2 are only released at the higher desorption temperature (477 °C). This is not unexpected, as a material created at a higher pyrolysis temperature would have released all or many of its gases during the pyrolysis.
While some previous reports have found a positive correlation between the release of CO2 during thermal-desorption-type analysis (TG-IR) and the ammonia-adsorption capacity [27,41], we were unable to duplicate these results. In a semiquantitative evaluation of the TG-IR results, we calculated the sum of the four CO2 peak heights for the FTIR spectra that were collected during desorption between 330 and 485 °C (which coincided with the CO2 peak presence). We were unable to correlate this value with the ammonia-adsorption capacity of the pyrolyzed materials (see Supplementary Materials). It is important to point out that the studies that found a correlation between the NH3(g)-adsorption capacity and surface pH or acidic surface group focused on materials with modified surfaces via acid activation or oxidation [27,41,47].
2.4. Potential Fate and Further Recycling of the Spent Pyrolyzed Materials
Even though not tested, the used ammonia adsorbent could most likely be regenerated with moderate heat, driving off gaseous ammonia. The regeneration stream would contain the desorbed ammonia but at significantly more elevated concentrations, easily recovered via low pH aqueous absorption [61]. A water wash has also been proposed for regeneration [27]. Alternatively, the used material could be used as soil amendments, providing nitrogen to the soil. The pyrolyzed material would make the carbon more stable than in the starting cottonseed hull material. For example, in the case of our material made at 400 °C, it is estimated that 91% of the carbon was aromatic based on the hydrogen/carbon (H/C) ratio [45]. It is also estimated that 72% of the carbon would be stable based on the oxygen/carbon (O/C) ratio [42]. Other stability calculations predicted that 78% of the carbon would be stable for >100 years using the H/C ratio [62]. The H/C and O/C ratios were estimated from the proximate analysis results [63].
3. Materials and Methods
3.1. Preparation of Pyrolyzed Materials
Three hundred grams of cottonseed hull obtained from Delta Oil Mill, Inc. (Jonestown, MS, USA) was placed in a porcelain evaporating dish (265 mm diameter, CoorsTek, Golden, CO, USA) and pyrolyzed in a high-temperature furnace with retort (Lindberg, Type 51662-HR, Watertown, WI, USA) for 240 min at 250, 300, 350, 400, 500, 600, and 700 °C with the continuous flow of nitrogen gas (1.6 L/min). The void volume of the furnace was approximately 22 L. After pyrolysis and cooling, the materials were stored in zip-lock bags until use.
3.2. pH Determination of Materials
The pH of the pyrolyzed materials was determined using the suspension method [64]. Flasks containing 2.0 g of material and 20 mL of water were kept at a boil for 15 min. After 15 min, boiling water was added to each flask until each matched their starting weight. The flasks were then placed in cool water and allowed to cool to room temperature. The pH was determined using a standard pH probe and meter.
3.3. Surface Area and Micropore Volume Determination
The specific surface area of the materials was measured with a Quantachrome NOVA 2200 e system (Quantachrome Instruments, Boynton Beach, FL, USA). Samples were dried and outgassed at 200 °C for 3 h under a vacuum followed by cooling, also under a vacuum. Adsorption and desorption data were collected as 25 points on the nitrogen isotherm between 0.002 and 0.99 relative pressures at −196 °C (liquid nitrogen). All isotherms were collected for duplicate samples. The instrument reported the Brunauer–Emmett–Teller (BET) surface area and micropore volumes.
3.4. Compositional Changes Due to Pyrolysis
Proximate analysis of the raw material (hulls) and the pyrolyzed materials for volatile matter, fixed carbon, and ash contents was performed using a thermogravimetric analyzer (TGA701, LECO Corporation, St. Joseph, MI, USA). The instrument-adopted method was based on ASTM D5142 [65]. The analysis was performed for duplicate samples.
Pyrolyzed materials were also analyzed on a Bruker Vertex 70 Fourier Transform Infrared (FTIR) spectrometer (Bruker Optics, Billerica, MA, USA) fitted with a Pike Technologies MIRacle attenuated total reflectance (ATR) accessory (Madison, WI, USA) with a diamond crystal plate. The spectra were obtained from 4500 to 650 cm−1 at a 8 cm−1 resolution, with 16 air background scans and 16 sample scans for each sample. Intimate contact of the samples with the ATR diamond crystal plate was achieved by using a high-pressure clamp with a flat pressure tip. Each analyzed sample was run five times, and the spectra were averaged.
3.5. Compositional Changes During Thermal Decomposition of Materials Using Infrared Specroscopy
The cottonseed hulls and the pyrolyzed materials were thermally decomposed, and the off-gases were analyzed using a hyphenated thermogravimetric analyzer with an infrared spectrophotometer (TG-IR) (PerkinElmer TGA 8000, Frontier FTIR, Waltham, MA, USA). In this method, the material is slowly heated while measuring the weight (TG) and analyzing the generated gases using FTIR. The decomposition temperature program held the temperature for 1 min at 30 °C, heated to 950 °C at 20 °C/min, and had a final hold of 5 min. The sample purge (30 mL/min) was nitrogen for the first two steps and air for the final step. The FTIR scanned (4 scans) the region of 4000–450 cm−1 with a 4 cm−1 resolution. The analysis was performed for duplicate samples.
3.6. Ammonia Adsorption Studies in Packed Columns
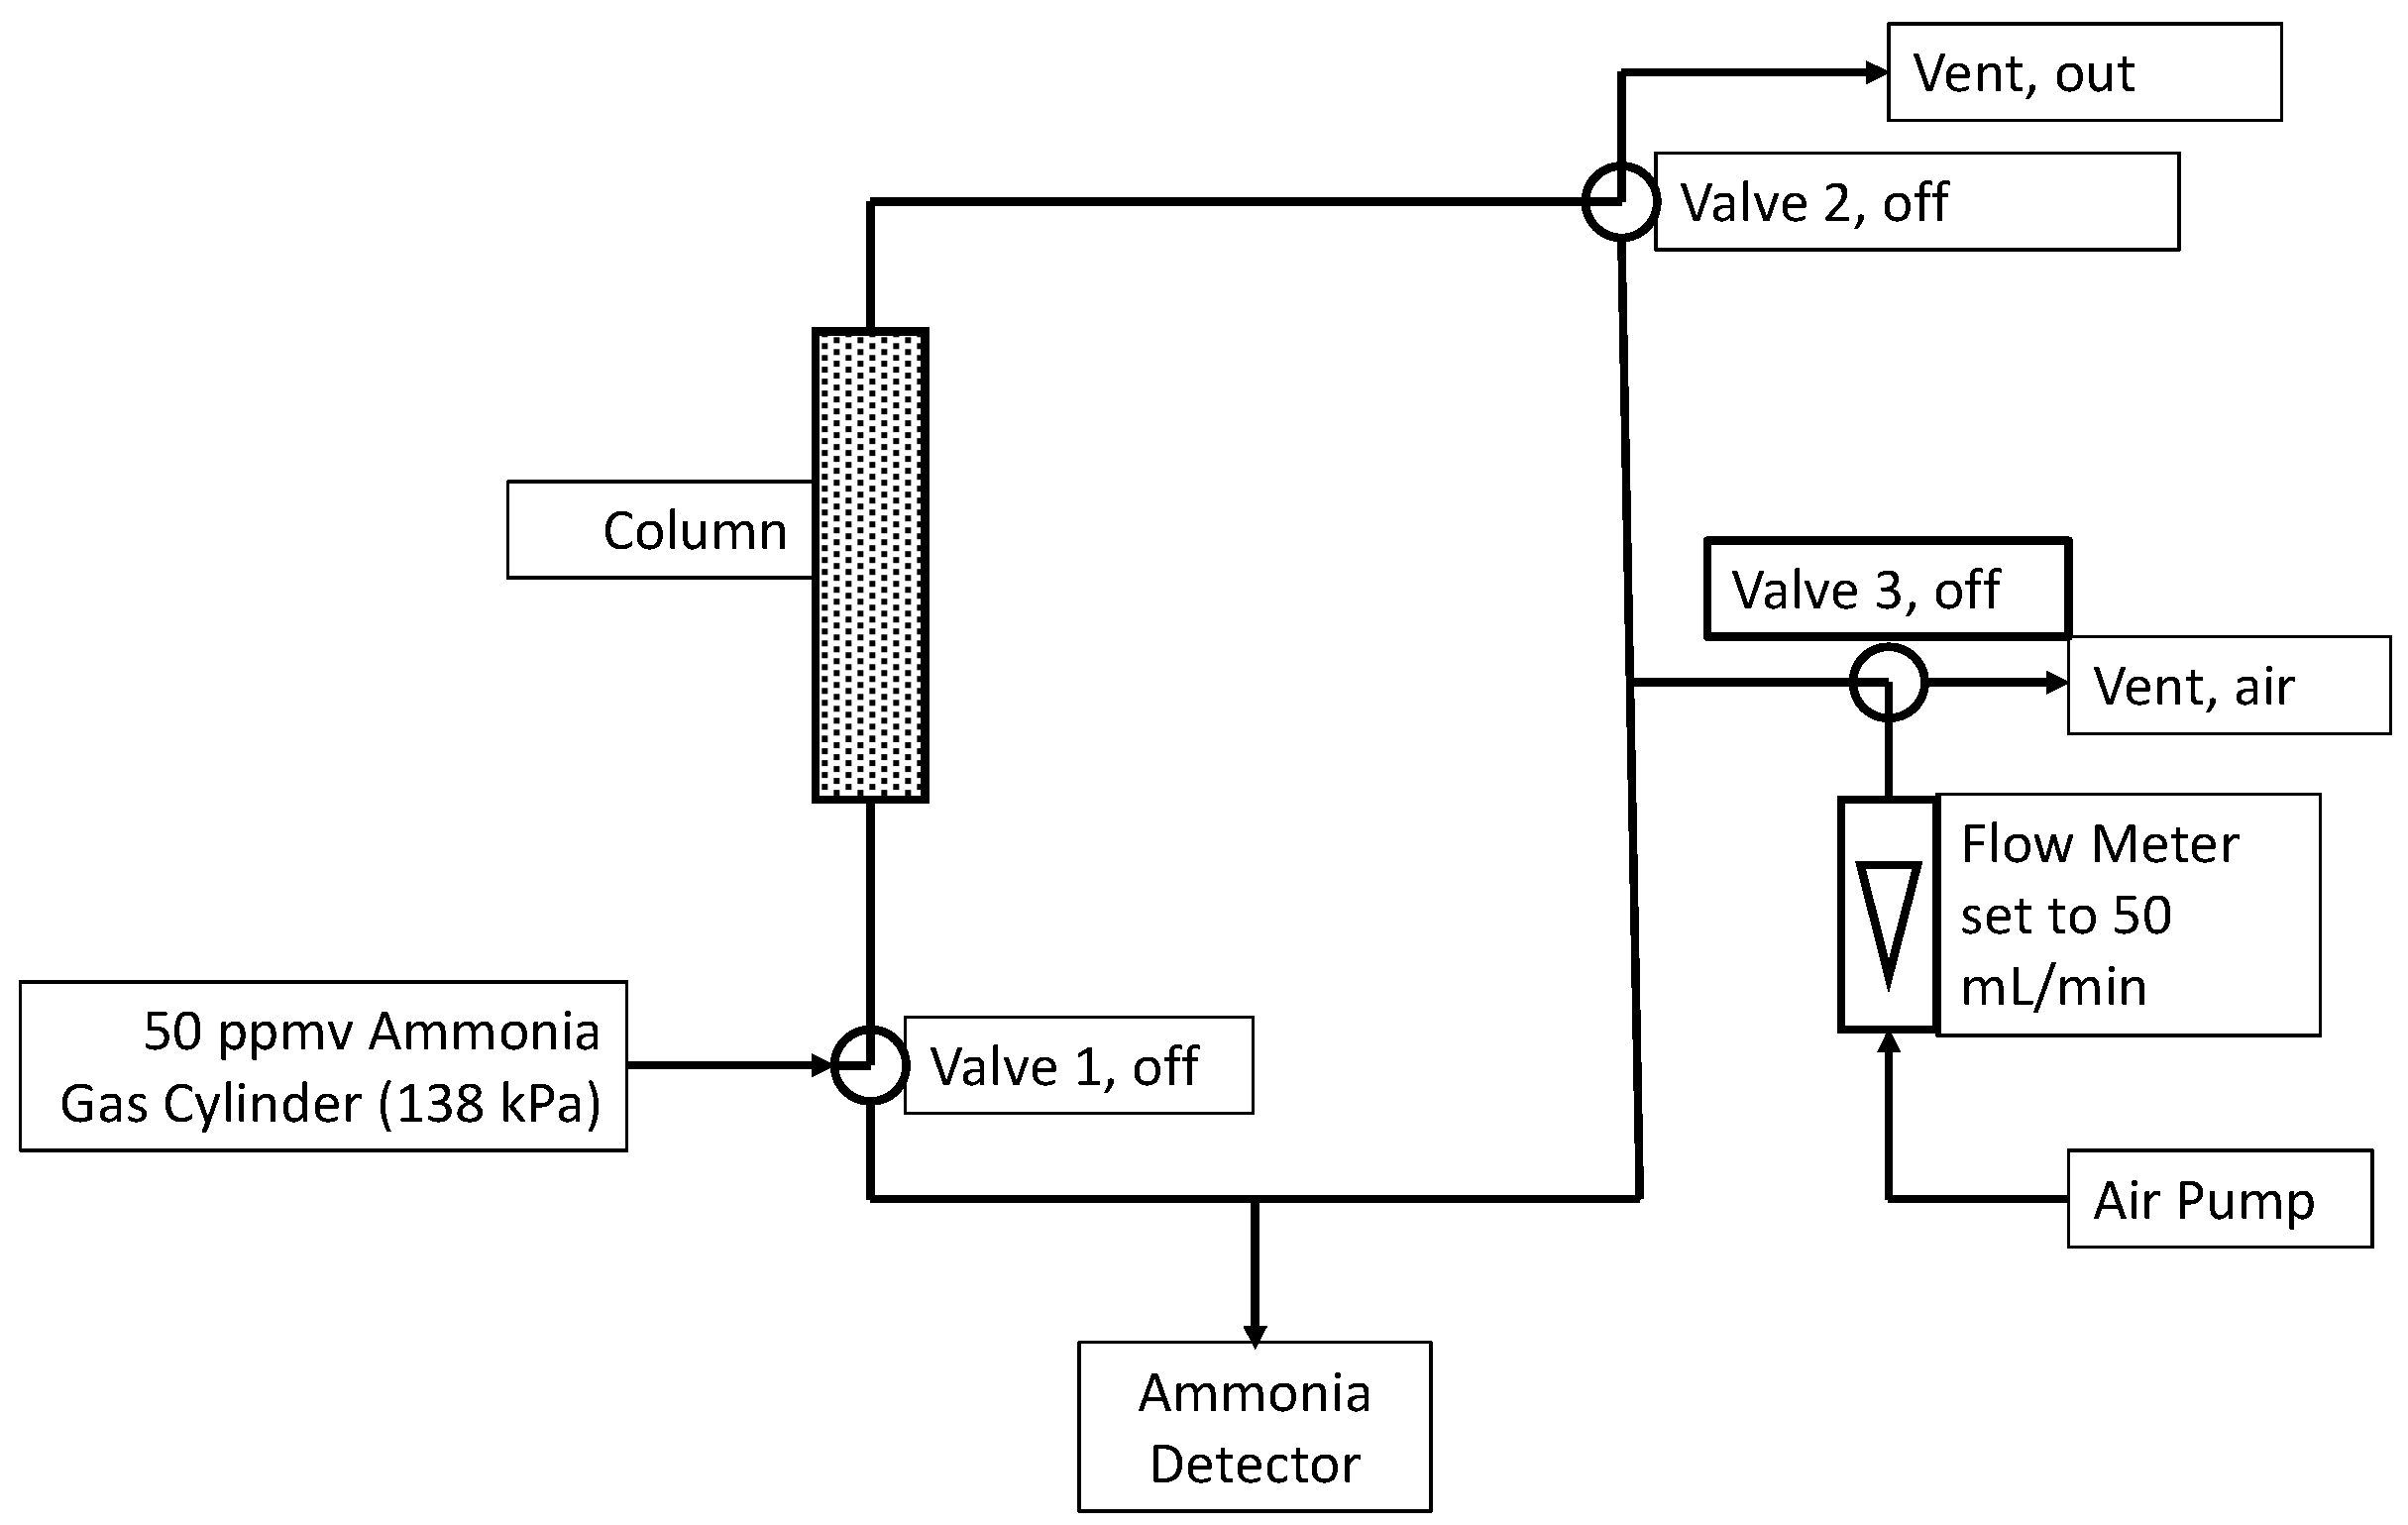
Columns were made from sections of 25 mL plastic pipettes with a diameter of 12.6 mm. The approximate height of the packed section was 80 mm, translating to 10 mL of active bed volume. Columns were filled with sample materials, and their weights were recorded. The flow of pre-mixed ammonia in air (50 ppmv, Linde, Danbury, CT, USA) was controlled (mass flow controller. Aalborg, Orangeburg, NY, USA) at a flow rate of 50 mL (STP)/min and fed to the column. This corresponds to a 12 s empty bed residence time. A controller system (Model U12, LabJack Corp, Lakewood, CO, USA) and three-way valves (Cole-Parmer, Vernon Hills, IL, USA) allowed ammonia measurements in the column inlet or column outlet. An ammonia detector (Forensics Detectors, Palos Verdes Peninsula, CA, USA) with a working range of 0–100 ppmv and <5% error was used for measurements. When not measuring, the ammonia detector was continuously purged using filtered air at approximately 50 mL/min. The experimental set-up can be seen in Figure 8. Each experiment was conducted in triplicate.
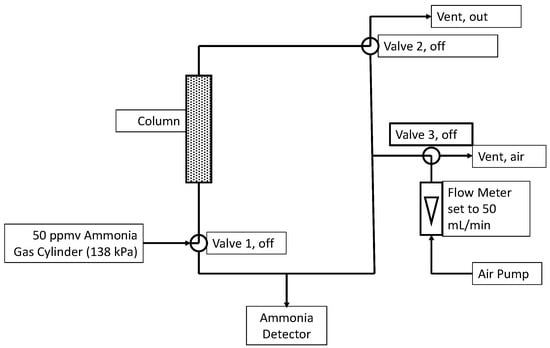
Figure 8.
Experiment setup with the valves configured for normal operation (i.e., not sampling). During sampling of the inlet, Valves 1 and 3 were turned on for 210 s before recording the ammonia level. During sampling of the outlet, Valves 2 and 3 were turned on.
Typically, experimentation continued until the ammonia concentration in the exit stream was greater than 25 ppmv. The cumulative amount of ammonia removed at time t was calculated from the following equation:
which can be integrated from time zero (t0) to time t to yield the following convenient formula that was used in our calculations:
amount removed (adsorbed) = gas flow × ∫(NH3,in − NH3,out)dt,
amount removed at ti = ARi = gas flow × [NH3,in − (NH3,out,i + NH3,out,i−1)/2] × (ti − ti−1) + ARi−1.
In adsorption column studies, it is often expressed as bed volumes through the relationship with time (t),
bed volumes = (t × gas flow)/(column volume).
To further normalize the performance between individual experiments, with different materials, the amount removed was expressed as mg NH3 per gram column material.
3.7. Estimated Stability of Used Pyrolyzed Material if Applied to Lands
Used ammonia-containing cottonseed hulls could potentially be applied to soil. To estimate the stability of the carbon, the stable aromatic carbon mass fraction in the pyrolyzed materials was estimated using the method of Wang et al. [45]. Using a different method, the fraction biochar carbon that would be classified as “stable” was estimated using the method of Lehmann et al. [62]. The fraction of biochar (BC) carbon that would remain in soil for over 100 years (BC+100) was estimated using the method of Crombie et al. [42]. All three methods rely on knowledge of H/C and O/C ratios, which were estimated using correlations between these ratios and proximate analysis results [63].
4. Conclusions
Ammonia was effectively removed from air containing 50 ppmv NH3 by pyrolyzed cottonseed hulls. In this research, we found that cottonseed hulls pyrolyzed at 350 to 400 °C could adsorb more ammonia than materials created at lower and higher pyrolysis temperatures. The capacity for ammonia adsorption was similar or better than most previous reported results with unactivated pyrolyzed biomass. It was lower than capacities reported for acid-activated or oxidized charred materials. While the pyrolysis temperature impacted the acidity of the material (measured as bulk pH), there was no evidence that the adsorption capacity could be correlated with the material’s bulk pH. Based on the characterization performed, CO2 release during thermal degradation could not be correlated with the materials’ ability to adsorb ammonia from the air. Thus, the performance of the materials could not be linked to the characteristics that others have proposed such as the surface pH and acidic oxygen surface groups. However, those studies were based on acid-activated or oxidized charred materials. Used pyrolyzed product should be suitable for soil application, providing nitrogen to the soil. The carbon in the pyrolyzed products is anticipated to be more stable than the carbon in un-pyrolyzed cottonseed hulls, thus maintaining and retaining carbon in the soil longer.
Supplementary Materials
The following supporting information can be downloaded at: https://www.mdpi.com/article/10.3390/recycling10040158/s1. Figure S1: Ammonia-adsorption capacity as a function of the material’s pH; Figure S2: Weight loss (during TG-IR analysis) for pyrolyzed cottonseed hulls created at 400 °C; Figure S3: Weight loss (during TG-IR analysis) for cottonseed hulls created at 500 °C; Figure S4: Weight loss (during TG-IR analysis) for cottonseed hulls created at 600 °C; Figure S5: Carbon monoxide and dioxide release during TG-IR analysis as a function of the performance of the pyrolyzed materials.
Author Contributions
Conceptualization, T.K. and A.T.; methodology, T.K.; software, T.K. and B.P.; validation, T.K.; formal analysis, T.K.; investigation, T.K. and B.P.; resources, T.K.; data curation, T.K. and B.P.; writing—original draft preparation, T.K. and B.P.; writing—review and editing, T.K., B.P. and A.T.; visualization, T.K. and B.P.; supervision, T.K.; project administration, T.K.; funding acquisition, A.T. All authors have read and agreed to the published version of the manuscript.
Funding
This research received no external funding.
Data Availability Statement
Data will be made available on request.
Acknowledgments
This work was supported by the U.S. Department of Agriculture, Agricultural Research Service. Mention of trade names or commercial products is solely for the purpose of providing specific information and does not imply recommendation or endorsement by the USDA. USDA is an equal opportunity provider and employer. The authors appreciate the assistance of Chanel Fortier, Jade Smith, and Jean Beacorn for their assistance with the characterization analysis.
Conflicts of Interest
The authors declare no conflicts of interest. The authors and their work are supported by internal USDA funding. However, the funders had no role in the design of the study; in the collection, analyses, or interpretation of data; and in the writing of the manuscript, but they approved the decision to publish the results.
Abbreviations
The following abbreviations are used in this manuscript:
| NIOSH | National Institute for Occupational Safety and Health |
| db | Dry Basis |
| BET | Brunauer, Emmett, and Teller (specific surface area) |
| NA | Not Analyzed |
| VM | Volatile Matter |
| FC | Fixed Carbon |
| FTIR | Fourier Transform Infrared (spectroscopy) |
| H/C | Hydrogen/Carbon (ratio) |
| VM/FC | Volatile Matter/Fixed Carbon (ratio) |
| TG-IR | Thermogravimetric Analysis and Infrared (spectroscopy) |
| HSD | Honest Significand Difference (i.e., Tukey test) |
| O/C | Oxygen/Carbon (ratio) |
| ASTM | American Society for Testing and Materials |
| ATR | Attenuated Total Reflectance |
| STP | Standard Temperature and Pressure (conditions, 25 °C, 1 atm) |
| AR | Amount Removed (NH3) |
| BC | Biochar |
References
- Bo, Y.K.; Yang, H.J.; Wang, W.X.; Liu, H.; Wang, G.Q.; Yu, X. Metabolisable energy, in situ rumen degradation and in vitro fermentation characteristics of linted cottonseed hulls, delinted cottonseed hulls and cottonseed linter residue. Asian-Austral. J. Anim. Sci. 2012, 25, 240–247. [Google Scholar] [CrossRef] [PubMed]
- Zhang, J.; Wedegaertner, T. Genetics and breeding for glandless Upland cotton with improved yield potential and disease resistance: A review. Front Plant Sci. 2021, 12, 753426. [Google Scholar] [CrossRef] [PubMed]
- USDA-NASS. Agricultural Statistics 2021; U.S. Department of Agriculture: Washington, DC, USA, 2021. [Google Scholar]
- Standifer, M.M. Cottonseed Industry; Texas State Historical Association: Austin, TX, USA, 2016. [Google Scholar]
- Bridges, C.; Hardin, R.; McClurkin-Moore, J. Changes in cottonseed meal quality during post-harvest processing of cottonseed. J. Stored Prod. Res. 2024, 108, 102371. [Google Scholar] [CrossRef]
- Desrochers, P.; Szurmak, J. Long distance trade, locational dynamics and by-product development: Insights from the history of the american cottonseed industry. Sustainability 2017, 9, 579. [Google Scholar] [CrossRef]
- Desisa, B.; Muleta, D.; Dejene, T.; Jida, M.; Goshu, A.; Negi, T.; Martin-Pinto, P. Utilization of local agro-industrial by-products based substrates to enhance production and dietary value of mushroom (P. ostreatus) in Ethiopia. World J. Microbiol. Biotechnol. 2024, 40, 277. [Google Scholar] [CrossRef]
- Xiao, X.; Wang, L.; Yan, F.; Zhang, J.; Lv, G.; Liu, M.; Xiong, K.; Zhang, M. Effectiveness of symbiotic fungus Coprinellus radians on seeds germination and seedlings development of Cremastra appendiculata (D.Don.) Makino (Orchidaceae). S. Afr. J. Bot. 2024, 174, 916–926. [Google Scholar] [CrossRef]
- Nanda, S.; Mohanty, P.; Pant, K.K.; Naik, S.; Kozinski, J.A.; Dalai, A.K. Characterization of North American lignocellulosic biomass and biochars in terms of their candidacy for alternate renewable fuels. Bioenergy Res. 2013, 6, 663–677. [Google Scholar] [CrossRef]
- Klasson, K.T.; Boihem, L.L., Jr.; Uchimiya, M.; Lima, I.M. Influence of biochar pyrolysis temperature and post-treatment on the uptake of mercury from flue gas. Fuel Process. Technol. 2014, 123, 27–33. [Google Scholar] [CrossRef]
- Uchimiya, M.; Bannon, D.I.; Wartelle, L.H. Retention of heavy metals by carboxyl functional groups of biochars in small arms range soil. J. Agric. Food Chem. 2012, 60, 1798–1809. [Google Scholar] [CrossRef]
- Uchimiya, M.; Wartelle, L.H.; Klasson, K.T.; Fortier, C.A.; Lima, I.M. Influence of pyrolysis temperature on biochar property and function as a heavy metal sorbent in soil. J. Agric. Food Chem. 2011, 59, 2501–2510. [Google Scholar] [CrossRef]
- EPA. National Emission Inventory—Ammonia Emissions from Animal Husbandry Operations, Draft Report; United States Environmental Protection Agency: Washington, DC, USA, 2004. [Google Scholar]
- Liu, Z.; Wang, L.; Beasley, D.B. A review of emission models of ammonia released from broiler houses. In Proceedings of the 2006 ASABE Annual International Meeting, Portland, OR, USA, 9–12 July 2006. [Google Scholar]
- Kristensen, H.H.; Burgess, L.R.; Demmers, T.G.H.; Wathes, C.M. The preferences of laying hens for different concentrations of atmospheric ammonia. Appl. Anim. Behav. Sci. 2000, 68, 307–318. [Google Scholar] [CrossRef]
- McLean, J.A.; Mathews, K.P.; Solomon, W.R.; Brayton, P.R.; Bayne, N.K. Effect of ammonia on nasal resistance in atopic and nonatopic subjects. Ann. Otol. Rhinol. Laryngol. 1979, 88, 228–234. [Google Scholar] [CrossRef]
- Roney, N.; Llados, F.; Little, S.S.; Knaebel, D.B. Toxicological Profile for Ammonia; Division of Toxicology/Toxicology Information Branch: Atlanta, GA, USA, 2004. [Google Scholar]
- Xin, H.; Gates, R.S.; Green, A.R.; Mitloehner, F.M.; Moore, P.A.; Wathes, C.M. Environmental impacts and sustainability of egg production systems. Poult. Sci. 2011, 90, 263–277. [Google Scholar] [CrossRef] [PubMed]
- Alloui, N.; Alloui, M.N.; Bennjoune, O.; Bouhentala, S. Effect of ventilation and atmospheric ammonia on the health and performance of broiler chickens in summer. J. World’s Poult. Res. 2013, 3, 54–56. [Google Scholar]
- Lott, B.; Donald, J. Ammonia: Can cause serious losses even when your can’t smell it. In The Poultry Engineering, Economics & Management Newsletter; Auburn University: Auburn, AL, USA, 2002; Issue No. 19. [Google Scholar]
- DOL-OSHA. Ammonia. Available online: https://www.osha.gov/chemicaldata/623 (accessed on 19 January 2024).
- Bist, R.B.; Subedi, S.; Chai, L.; Yang, X. Ammonia emissions, impacts, and mitigation strategies for poultry production: A critical review. J. Environ. Manag. 2023, 328, 116919. [Google Scholar] [CrossRef]
- David, B.; Mejdell, C.; Michel, V.; Lund, V.; Moe, R.O. Air quality in alternative housing systems may have an impact on laying hen welfare. Part II—Ammonia. Animals 2015, 5, 886–896. [Google Scholar] [CrossRef] [PubMed]
- Chen, B.; Shao, Y.; Shi, M.; Ji, L.; He, Q.; Yan, S. Anaerobic digestion of chicken manure coupled with ammonia recovery by vacuum-assisted gas-permeable membrane process. Biochem. Eng. J. 2021, 175, 108135. [Google Scholar] [CrossRef]
- Elliott, H.A.; Collins, N.E. Factors affecting ammonia release in broiler houses. Trans. ASAE 1982, 25, 413–418. [Google Scholar] [CrossRef]
- Fitzmorris, K.B.; Miles, D.M.; Lima, I.M. Efficacy of activated carbon from broiler litter in the removal of litter generated ammonia. In Proceedings of the International Symposium on Air Quality and Waste Management for Agriculture, Broomfield, CO, USA, 16 September 2007. [Google Scholar]
- Ro, K.S.; Lima, I.M.; Reddy, G.B.; Jackson, M.A.; Gao, B. Removing gaseous NH3 using biochar as an adsorbent. Agriculture 2015, 5, 991–1002. [Google Scholar] [CrossRef]
- Ramlogan, M.V.; Rabinovich, A.; Rouff, A.A. Thermochemical analysis of ammonia gas sorption by struvite from livestock wastes and comparison with biochar and metal–organic framework sorbents. Environ. Sci. Technol. 2020, 54, 13264–13273. [Google Scholar] [CrossRef]
- Chen, M.; Wang, F.; Zhang, D.L.; Yi, W.M.; Liu, Y. Effects of acid modification on the structure and adsorption NH4+-N properties of biochar. Renew. Energy 2021, 169, 1343–1350. [Google Scholar] [CrossRef]
- Bhandari, P.N.; Kumar, A.; Huhnke, R.L. Simultaneous removal of toluene (model tar), NH3, and H2S, from biomass-generated producer gas using biochar-based and mixed-metal oxide catalysts. Energy Fuels 2014, 28, 1918–1925. [Google Scholar] [CrossRef]
- Krounbi, L.; Enders, A.; Anderton, C.R.; Engelhard, M.H.; Hestrin, R.; Torres-Rojas, D.; Dynes, J.J.; Lehmann, J. Sequential ammonia and carbon dioxide adsorption on pyrolyzed biomass to recover waste stream nutrients. ACS Sustain. Chem. Eng. 2020, 8, 7121–7131. [Google Scholar] [CrossRef] [PubMed]
- Zhang, H.; Marchant-Forde, J.N.; Zhang, X.; Wang, Y. Effect of cornstalk biochar immobilized bacteria on ammonia reduction in laying hen manure composting. Molecules 2020, 25, 1560. [Google Scholar] [CrossRef] [PubMed]
- Wystalska, K.; Kwarciak-Kozłowska, A. The effects of using biochar to remove ammonium nitrogen generated during the processing of biodegradable waste. Desalination Water Treat. 2021, 225, 203–213. [Google Scholar] [CrossRef]
- Zhao, Z.; Wang, B.; Theng, B.K.G.; Lee, X.; Zhang, X.; Chen, M.; Xu, P. Removal performance, mechanisms, and influencing factors of biochar for air pollutants: A critical review. Biochar 2022, 4, 30. [Google Scholar] [CrossRef]
- Li, Y.; Ma, J.; Yong, X.; Luo, L.; Wong, J.W.C.; Zhang, Y.; Wu, H.; Zhou, J. Effect of biochar combined with a biotrickling filter on deodorization, nitrogen retention, and microbial community succession during chicken manure composting. Bioresour. Technol. 2022, 343, 126137. [Google Scholar] [CrossRef]
- Abd El-Rahim, M.G.M.; Dou, S.; Xin, L.; Xie, S.; Sharaf, A.; Alio Moussa, A.; Eissa, M.A.; Mustafa, A.R.A.; Ali, G.A.M.; Hamed, M.H. Effect of biochar addition method on ammonia volatilization and quality of chicken manure compost. Zemdirbyste 2021, 108, 331–338. [Google Scholar] [CrossRef]
- Ngo, T.; Khudur, L.S.; Hakeem, I.G.; Shah, K.; Surapaneni, A.; Ball, A.S. Wood biochar enhances the valorisation of the anaerobic digestion of chicken manure. Clean Technol. 2022, 4, 420–439. [Google Scholar] [CrossRef]
- Kalus, K.; Konkol, D.; Korczyński, M.; Koziel, J.A.; Opaliński, S. Effect of biochar diet supplementation on chicken broilers performance, NH3 and odor emissions and meat consumer acceptance. Animals 2020, 10, 1539. [Google Scholar] [CrossRef]
- Roshan, A.; Ghosh, D.; Maiti, S.K. How temperature affects biochar properties for application in coal mine spoils? A meta-analysis. Carbon Res. 2023, 2, 3. [Google Scholar] [CrossRef]
- Chaves Fernandes, B.C.; Ferreira Mendes, K.; Dias Júnior, A.F.; da Silva Caldeira, V.P.; da Silva Teófilo, T.M.; Severo Silva, T.; Mendonça, V.; de Freitas Souza, M.; Valadão Silva, D. Impact of pyrolysis temperature on the properties of Eucalyptus wood-derived biochar. Materials 2020, 13, 5841. [Google Scholar] [CrossRef] [PubMed]
- Goncalves, M.; Sanchez-Garcia, L.; Oliveira Jardim, E.D.; Silvestre-Albero, J.; Rodríguez-Reinoso, F. Ammonia removal using activated carbons: Effect of the surface chemistry in dry and moist conditions. Environ. Sci. Technol. 2011, 45, 10605–10610. [Google Scholar] [CrossRef] [PubMed]
- Crombie, K.; Mašek, O.; Sohi, S.P.; Brownsort, P.; Cross, A. The effect of pyrolysis conditions on biochar stability as determined by three methods. GCB Bioenergy 2013, 5, 122–131. [Google Scholar] [CrossRef]
- Hitomi, M.; Kera, Y.; Tatsumoto, H.; Abe, I.; Kawafune, I.; Ikuta, N. Evaluation of adsorption property of porous carbon materials (III): Preparation of charcoals from Cryptomeria and Chamaecyparis and their properties. TANSO 1993, 1993, 247–254. [Google Scholar] [CrossRef][Green Version]
- Keiluweit, M.; Nico, P.S.; Johnson, M.; Kleber, M. Dynamic molecular structure of plant biomass-derived black carbon (biochar). Environ. Sci. Technol. 2010, 44, 1247–1253. [Google Scholar] [CrossRef]
- Wang, T.; Camps-Arbestain, M.; Hedley, M. Predicting C aromaticity of biochars based on their elemental composition. Org. Geochem. 2013, 62, 1–6. [Google Scholar] [CrossRef]
- Liu, Y.; He, Z.; Uchimiya, M. Comparison of biochar formation from various agricultural by-products using FTIR spectroscopy. Mod. Appl. Sci. 2015, 9, 246–253. [Google Scholar] [CrossRef]
- Huang, C.-C.; Li, H.-S.; Chen, C.-H. Effect of surface acidic oxides of activated carbon on adsorption of ammonia. J. Hazard. Mater. 2008, 159, 523–527. [Google Scholar] [CrossRef]
- Knox, J.C.; Ebner, A.D.; LeVan, M.D.; Coker, R.F.; Ritter, J.A. Limitations of breakthrough curve analysis in fixed-bed adsorption. Ind. Eng. Chem. Res. 2016, 55, 4734–4748. [Google Scholar] [CrossRef]
- Bouma, J. Hydrology and soil genesis of soils with aquic moisture regimes. In Pedogenesis and Soil Taxonomy. I. Concepts and Interactions; Wilding, L.P., Smeck, N.E., Hall, G.F., Eds.; Elsevier Science Publishers: Amsterdam, The Netherlands, 1983; pp. 253–281. [Google Scholar]
- Sauder, D.C.; DeMars, C.E. An updated recommendation for multiple comparisons. Adv. Methods Pract. Psychol. Sci. 2019, 2, 26–44. [Google Scholar] [CrossRef]
- Crittenden, J.C.; Reddy, P.S.; Arora, H.; Trynoski, J.; Hand, D.W.; Perram, D.L.; Summers, R.S. Predicting GAC performance with rapid small-scale column tests. J. Am. Water Work. Assoc. 1991, 83, 77–87. [Google Scholar] [CrossRef]
- Yu, J.-J.; Chou, S.-Y. Contaminated site remedial investigation and feasibility removal of chlorinated volatile organic compounds from groundwater by activated carbon fiber adsorption. Chemosphere 2000, 41, 371–378. [Google Scholar] [CrossRef] [PubMed]
- Klasson, K.T.; Ledbetter, C.A.; Uchimiya, M.; Lima, I.M. Activated biochar removes 100% dibromochloropropane from field well water. Environ. Chem. Lett. 2013, 11, 271–275. [Google Scholar] [CrossRef]
- Tsutomu, I.; Takashi, A.; Kuniaki, K.; Kikuo, O. Comparison of removal efficiencies for ammonia and amine gases between woody charcoal and activated carbon. J. Health Sci. 2004, 50, 148–153. [Google Scholar] [CrossRef]
- Ramlogan, M.V.; Arrue, D.A.; Rouff, A.A. Evaluation of heat-treated struvite as a non-conventional sorbent for ammonia gas using STA-PTA-FTIR. J. Environ. Chem. Eng. 2018, 6, 2461–2469. [Google Scholar] [CrossRef]
- Britto, D.T.; Kronzucker, H.J. NH4+ toxicity in higher plants: A critical review. J. Plant Physiol. 2002, 159, 567–584. [Google Scholar] [CrossRef]
- Li, S.; Chen, G. Thermogravimetric, thermochemical, and infrared spectral characterization of feedstocks and biochar derived at different pyrolysis temperatures. Waste Manag. 2018, 78, 198–207. [Google Scholar] [CrossRef]
- Garcia-Perez, M.; Chaala, A.; Yang, J.; Roy, C. Co-pyrolysis of sugarcane bagasse with petroleum residue. Part I: Thermogravimetric analysis. Fuel 2001, 80, 1245–1258. [Google Scholar] [CrossRef]
- Dow Chemical Company. Carbon monoxide. In NIST Chemistry WebBook: NIST Standard Reference Database 69; Coblentz Society, U.S. Department of Commerce: Washington, DC, USA, 2023. [Google Scholar]
- Dow Chemical Company. Carbon dioxide. In NIST Chemistry WebBook: NIST Standard Reference Database 69; Coblentz Society, U.S. Department of Commerce: Washington, DC, USA, 2023. [Google Scholar]
- Khodadadi, M.; Masoumi, A.; Sadeghi, M.; Moheb, A. Modeling and experimental studies on chemical absorption of ammonia emitted from poultry manure during the drying process by a wet spray scrubber: Optimization by Box-Behnken design. Process Saf. Environ. Prot. 2023, 177, 187–201. [Google Scholar] [CrossRef]
- Lehmann, J.; Abiven, S.; Kleber, M.; Pan, G.; Singh, B.P.; Sohi, S.P.; Zimmerman, A.R. Persistence of biochar in soil. In Biochar for Environmental Management: Science, Technology, and Implementation, 2nd ed.; Lehmann, J., Joseph, S., Eds.; Routledge: New York, NY, USA, 2015; pp. 235–283. [Google Scholar]
- Klasson, K.T. Biochar characterization and a method for estimating biochar quality from proximate analysis results. Biomass Bioenergy 2017, 96, 50–58. [Google Scholar] [CrossRef]
- Singh, B.; Mei Dolk, M.; Shen, Q.; Camps-Arbestain, M. Biochar pH, electrical conductivity and liming potential. In Biochar: A Guide to Analytical Methods; Singh, B.C.-A., Marta Lehmann, J., Eds.; CSIRO Publishing: Clayton South, Australia, 2017; pp. 23–38. [Google Scholar]
- ASTM D5142-09; Standard Test Methods for Proximate Analysis of the Analysis Sample of Coal and Coke by Instrumental Procedures. ASTM International: West Conshohocken, PA, USA, 2009.
Disclaimer/Publisher’s Note: The statements, opinions and data contained in all publications are solely those of the individual author(s) and contributor(s) and not of MDPI and/or the editor(s). MDPI and/or the editor(s) disclaim responsibility for any injury to people or property resulting from any ideas, methods, instructions or products referred to in the content. |
© 2025 by the authors. Licensee MDPI, Basel, Switzerland. This article is an open access article distributed under the terms and conditions of the Creative Commons Attribution (CC BY) license (https://creativecommons.org/licenses/by/4.0/).

