Abstract
The health state estimation of lithium-ion batteries are the essential issues for the safety of energy storage stations. The important indicators often focus on the battery capacity and internal resistance. However, the measurement of capacity requires a complete charge/discharge cycle, and the measurement of internal resistance requires additional equipment. To solve the above problems, based on the voltage segment under the constant-current discharge condition of lithium-ion battery, this paper takes the sharp voltage drop of the initial discharge segment as a new healthy factor. Furthermore, facing the possibility that the new healthy factor data is polluted by noise, this factor data is reconstructed to reduce noise through multi-order Bezier curve. Subsequently, an empirical degradation hybrid model is constructed with the number of cycles. On this basis, the battery healthy state is defined by voltage segment and a new healthy state estimation model is proposed. The feasibility and effectiveness of the proposed degradation model and estimation model are verified by the aging data published by NASA and experimental platform.
1. Introduction
With the continuous advancement of the construction of the new power system, lithium-ion batteries (Lithium-ion Battery, LiB) play a core role in the storage of renewable energy and enhancing the overall safety of the power grid [1,2,3,4,5]. However, their abnormal aging can easily lead to safety accidents and cause severe economic losses. Therefore, as a research hotspot in the intersection of electrochemistry, materials science, and intelligent algorithms, the estimation of state of health (SOH) have already attracted significant attention from researchers in both academia and industry [6,7,8].
The key point of the state prediction of lithium-ion batteries in energy storage power stations lies in ensuring the accuracy and timeliness of maintenance and inspection within the station through the prediction of service life, and formulating battery retirement and replacement plans in advance based on the prediction results to avoid the problem of cell inconsistency caused by uneven aging and prevent the occurrence of the “shortest stick effect” in large-scale energy storage [9,10,11]. Lithium-ion batteries are nonlinear systems. Compared with establishing electrochemical models and equivalent circuit models, most scholars construct empirical degradation models based on a large amount of historical aging data of batteries to predict the state of batteries, including [12]: the power exponential empirical model P(x) = keαx [13], the double exponential empirical model P(x) = k1eαx + k2eβx [14], the polynomial empirical model P(x) = knxn + kn−1xn−1 +… + k1x + c [15], and the hybrid model [16], etc. Since the main feature of battery degradation is the capacity attenuation, Ref. [17] uses the capacity power exponential empirical degradation model to construct the capacity degradation rate model under different charging current rates. Ref. [18] also takes capacity as the object and uses the hybrid model to predict the state of lithium-ion batteries, with a prediction error of less than 4% and good prediction accuracy. Ref. [19] builds a polynomial model to predict the state of batteries through two new health factors that have an excellent correlation with capacity attenuation.
For the assessment of battery health status, most scholars take a data-driven approach and use capacity and internal resistance as health indicators. For example, Ref. [20] improved the ampere-hour integration method by gradually updating the rated capacity to effectively estimate the battery’s health status. Ref. [21] selected the increments of ohmic resistance and polarization resistance as health factors and uses a gray neural network to estimate the battery’s health status. Ref. [22] based on the adaptive unscented Kalman filter algorithm, and achieves effective assessment of the battery’s health status by online estimation of battery capacity and internal resistance and adding a model parameter correction link.
However, in the working state, the acquisition of the above parameters is somewhat difficult. Generally, the acquisition of available capacity requires a complete cycle, but in practical work, the capacity data is mostly fragmented and cannot be obtained by each charging and discharging process. At the same time, the measurement of internal resistance mostly adopts the EIS (Electrochemical Impedance Spectroscopy) method, and this method is mostly concentrated in laboratory environments. Therefore, many experts and scholars regard the external characteristic parameters of the battery as new parameter objects. For example, in Ref. [23], the starting voltage and voltage data length were taken as inputs, and the battery health state is estimated through kernel ridge regression; in Ref. [24], the measurement object was determined as the fragment charging time and charging voltage/current, and the full charging time of the battery is estimated through extended Kalman filtering and Gaussian process regression; in Ref. [25], it was pointed out that the battery state can be evaluated through the voltage difference of equal time intervals of charging and discharging. Based on the above research findings, this paper further reduces the sampling interval for external characteristic data under constant-current charge/discharge conditions. Specifically, at a given constant-current charge/discharge rate and with uniform sampling intervals, the instantaneous voltage drop amplitude observed during the initial discharge segment is adopted as the fitting target to construct a hybrid empirical degradation model. In this model, the instantaneous voltage drop is extracted as the health indicator (Health Index, HI), thereby enabling battery lifetime information to be reflected through voltage change magnitude. Furthermore, building upon the resistance-based state-of-health (SOH) estimation method [18], we optimize its underlying formulation and integrate it with the proposed degradation model, thereby developing a novel SOH estimation approach for lithium-ion batteries that leverages the instantaneous voltage drop during the initial discharge segment.
2. Analysis of Discharge Voltage Segments
Under constant-current charge–discharge operation, the terminal-voltage trajectories of a battery pack (cluster) and an individual cell exhibit the characteristic segments illustrated in Figure 1. The discharge process can be partitioned into four segments: (i) initial discharge segment, (ii) steady discharge segment, (iii) end-of-discharge segment, and (iv) discharge recovery segment.
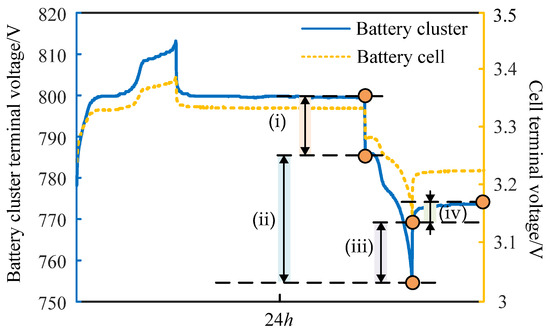
Figure 1.
Variation curve of battery cluster and cells voltage under constant-current charge and discharge.
At the onset of discharge, the cell terminal voltage exhibits an abrupt drop due to the voltage drop across the ohmic resistance, as described in Equation (1). When the discharge current i and the sampling interval are fixed, the voltage-drop magnitude in this segment, Δuohm, can be used as a proxy for the ohmic resistance:
where i is the discharge current and rohm denotes the ohmic resistance. During the quasi-steady discharge segment, the gradual voltage decrease is dominated by polarization effects. The corresponding relationship is given in Equation (2). Under fixed current and sampling conditions, the voltage change Δup in this segment reflects the polarization resistance:
where rp is the polarization resistance. In the recovery segment, the polarization capacitance discharges through rp, and the terminal voltage rebounds towards the plateau. This dynamic can be expressed by Equation (3). Under constant-current discharge, the voltage rebound magnitude Δuz can be used to characterize the polarization impedance:
where Δud is the difference between the initial voltage at discharge onset and the terminal voltage at the end of the recovery segment, Δt is the duration of the recovery segment, cp is the polarization capacitance, and rp is the polarization resistance.
Ref. [26] reported the variation in internal characteristic parameters under different states of charge, as shown in Figure 2.
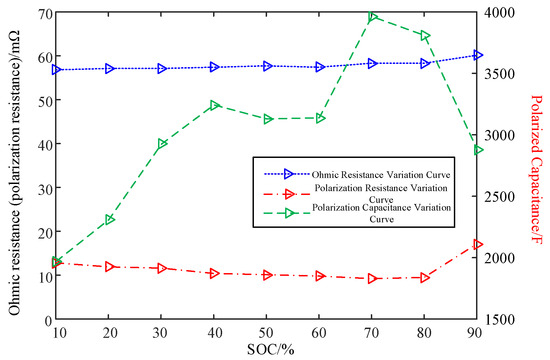
Figure 2.
Variation in internal characteristic parameters under different states of charge.
As shown in Figure 2, variations in state of charge (SOC) significantly affect the polarization resistance and capacitance, whereas the ohmic resistance is comparatively insensitive. According to Equation (1), the sharp voltage drop Δuohm in the initial discharge segment is strongly correlated with the ohmic resistance. Therefore, defining a health indicator based on Δuohm under constant-current discharge is feasible for empirical degradation modeling and SOH estimation of lithium-ion batteries.
3. Voltage-Segment-Based Health-Indicator Modeling and SOH Estimation
3.1. Noise Reduction of Health-Indicator Data
Due to the susceptibility of batteries to external temperatures and their inherent aging characteristics, battery characteristic data does not exhibit linear changes during the degradation process. This introduces a degree of uncertainty, such as sudden capacity spikes that do not align with actual operating conditions. Therefore, this paper employs multi-order Bezier curves to reconstruct and denoise specific data segments. This approach minimizes errors caused by data fluctuations while preserving the majority of the original characteristic values [27,28].
The Bezier curve is mainly used in two-dimensional graphic applications as a mathematical curve. The curved trajectory of the curve is drawn by connecting data points and control points. The starting point and ending point of the curve are data points; the rest are control points, which have overall control over the curve.
Given three points P0, P1 and P2, the data points on the line passing through points P0 and P1 are A1, called intermediate linear interpolation points; these points on the line passing through points P1 and P2 are A2; and the interpolation point on the line passing through points A1 and A2 is B, as shown in the Figure 3 below.
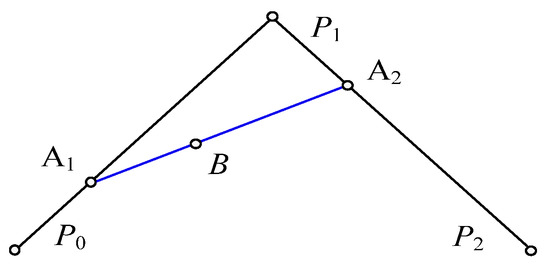
Figure 3.
Bezier curve of order 2.
To prove the effectiveness of the proposed method, the pressure drop data of the 70#C to 110#C cycle of B0006# in NASA aging data was reconstructed and denoised using Bezier curves. The method was compared and analyzed with the data fitting method for smoothing the data. The data fitting used a third-order fitting function, and the smoothing denoising effect is shown in Figure 4.
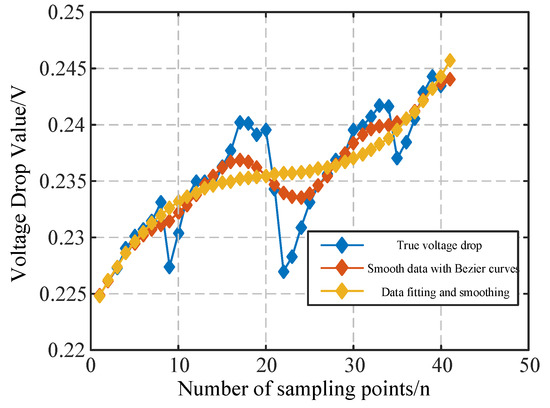
Figure 4.
Data smoothing and noise reduction results of different methods.
The deviation between the reconstructed HI and the measured HI is summarized using the mean absolute error (MAE) and root mean square error (RMSE) to quantify the distortion introduced by smoothing. Because the raw HI sequence itself may contain outliers, MAE/RMSE are not interpreted as an absolute measure of “closeness to ground truth”. Instead, denoising effectiveness is mainly assessed by suppressing non-monotonic fluctuations that are inconsistent with long-term degradation and improving downstream degradation model identification and SOH estimation performance.
As shown in Table 1, while smoothing the data, MAE and RMSE of the Bezier curve for smoothing the data are both smaller than those of the traditional data fitting method for smoothing the data. That is to say, the method described in this paper, while smoothing the data, retains the original values of most of the other feature data. This verifies the effectiveness of the method described in this paper.

Table 1.
Error analysis results.
3.2. Empirical Hybrid Degradation Model
Since lithium-ion batteries are typical dynamic nonlinear systems, in practical operation, battery degradation is influenced by factors such as external temperature, charge–discharge current, and charge–discharge cut-off voltage. The establishment of a physicochemical model is rather difficult; therefore, this section describes the dynamic variation process of battery life from the perspective of differential equations. The sharp voltage drop rate at the initial segment of battery discharge is a function of the cycle number and the voltage drop amplitude, so the degradation rate can be expressed as:
where C is the number of cycles, and Δuohm is the actual sharp voltage drop amplitude at the initial segment of battery discharge.
Since the nonlinear function f(Δuohm, C) contains two independent variables, by expanding each variable using a Taylor series and ignoring higher-order terms, after linearization approximation, we obtain:
where a and b are considered as degradation factors. As the number of cycles increases, the voltage drop amplitude shows an increasing trend, so let:
Differentiating both sides of Equation (6) yields:
Dividing both sides of Equation (7) by the differential of the cycle period gives:
When , the solution of the differential equation is:
When , the solution is:
Substituting Equation (9) into Equation (10) respectively gives:
Further simplifying Equation (11) yields:
Rewriting the above equation in the following form:
If the health factor data is contaminated with a certain degree of noise, and noise reduction is performed on the data through multiple curve fittings, the above equation can be written as:
Equation (14) is the expression of the degradation model for the actual sharp voltage drop amplitude Δuohm and the cycle number C. The unknown parameters in the equation are: α, β, γ, and k. This paper sets the battery operating condition to a constant-current charge–discharge process, and uses a nonlinear curve fitting method to determine the unknown model parameters. By setting a threshold for the sharp voltage drop amplitude, the prediction of battery SOH can be achieved.
3.3. SOH Estimation Model
As the battery is used for a long time, the SEI film keeps thickening. The battery’s health condition gradually deteriorates due to the significant decrease in actual capacity and the increase in ohmic internal resistance. The battery’s lifespan is strongly correlated with its actual capacity and ohmic internal resistance. Therefore, some scholars define the battery’s SOH based on capacity degradation and increased internal resistance, as shown below.
In the formula, Q0 is the initial rated capacity (A·h) of the lithium-ion battery, and Qt is the actual capacity (A·h) at time t; r0 is the initial ohmic resistance value; rt is the ohmic resistance value under the current operating conditions; reol is the ohmic resistance value of the battery at the end of its lifespan. In the actual operation of the energy storage station, it is mostly in the constant-current peak shaving and valley filling mode. Therefore, in the constant-current charging and discharging aging process of this paper, by multiplying both the numerator and denominator of Equation (15) by the current i, the following formula can be further obtained.
By substituting the actual instantaneous voltage drop value Δuohm mentioned in this article and the degradation model expression of the cycle period C into the above equation, the estimation model of the battery health status can be obtained:
In the formula, Δueol represents the voltage drop value when the battery’s available capacity drops to 80% or when the internal resistance increases to twice its original value [29]; Δu0 represents the voltage drop value at the initial discharge voltage. Different from the traditional methods that estimate the battery’s health status based on available capacity and internal resistance, this study constructs an SOH estimation model based on the instantaneous voltage drop value of the initial discharge segment. By using voltage segment data, an effective assessment of the battery’s health status can be achieved. As long as the discharge current remains constant, the amplitude of the instantaneous voltage drop can be accurately measured, and the feasibility of the proposed method can be guaranteed.
4. Validation of the Empirical Degradation Model
4.1. Validation on the NASA Aging Dataset
Based on the publicly available lithium battery aging dataset from NASA, the degradation model was verified. Two sets of aging data, namely B0006# and B0018# of 18650 lithium-ion batteries, were selected. The initial capacity of the batteries was 2 Ah. The aging process was carried out under a constant-current and constant voltage charging and discharging condition, that is, the battery was charged at a constant current of 1.5 A, and when the battery voltage reached 4.2 V, the condition changed to constant voltage charging. If the charging current was less than 20 mA, the charging was stopped. Then, the battery was discharged at a constant current of 2 A, and the discharge was stopped when the battery voltage dropped to 2.5 V. The threshold values for each stage are shown in the Table 2 below.
Table 2.
Threshold values of aging stages (NASA batteries).
Selecting the partial aging data of battery B0006#, starting from the 16#C cycle. Continuously sample the instantaneous voltage drop values Δuohm of the initial discharge segments for 117 cycles, as shown in Figure 5.
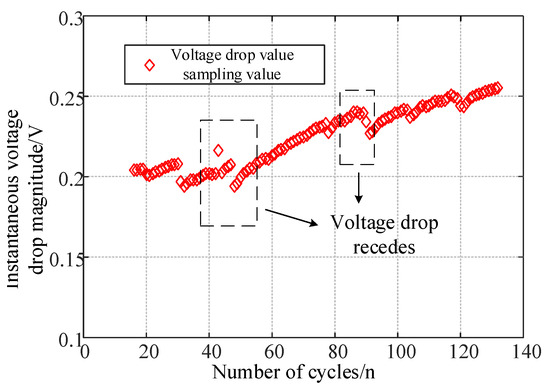
Figure 5.
The nonlinear fitting results of Δuohm.
Due to the occurrence of pressure drop reduction, in this paper, the pressure drop data of the 25#C to 55#C cycle, 70#C to 110#C cycle, and 115#C to 125#C cycle are reconstructed and denoised using Bezier curves. Based on the denoised results and the number of cycles, the four unknown parameters, α, β, γ, and k, are identified to obtain the empirical model for the degradation of lithium-ion batteries, as shown in Figure 6.
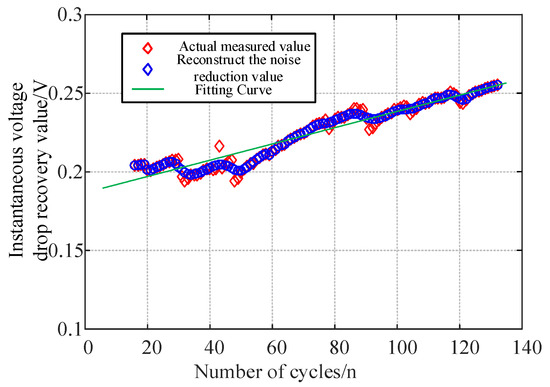
Figure 6.
The nonlinear fitting results of Δuohm.
The identified values of the parameters α, β, γ, and k are summarized in Table 3.
Table 3.
Parameter identification result.
The resulting model is expressed as:
By substituting the initial sharp voltage drop of cell B0018 into Equation (18), the corresponding degradation model for this cell is obtained as:
To further demonstrate the effectiveness of the proposed method, based on the empirical model presented in Ref. [12], the instantaneous pressure reduction values predicted by this model, as well as the second-order polynomial model and the exponential model, are presented, as shown in Figure 7.
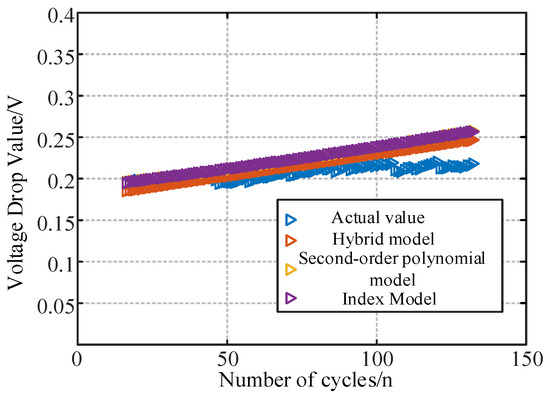
Figure 7.
The forecast result of models and B0016# actual value.
The average absolute error (MAE), maximum absolute error (MaxAE), and root mean square error (RMSE) between the predicted results of different models and the actual pressure reduction value of single battery B0018# are presented in the following table.
Table 4 summarizes the prediction errors for cell B0018. The proposed hybrid model achieves a maximum absolute error of 0.031846 V, an MAE of 0.01239 V, and an RMSE of 0.014898 V, all below 0.015 V. These errors are smaller than those of the polynomial and exponential baselines, indicating that the proposed model captures the nonlinear evolution of Δuohm more accurately. Moreover, once the initial voltage drop Δu0 is known for a given cell, the fitted relationship between Δuohm and cycle number C enables degradation-trajectory forecasting and SOH inference by specifying an end-of-life threshold Δueol (e.g., corresponding to 80% capacity retention or a twofold increase in internal resistance).
Table 4.
Error statistics of prediction of different models.
4.2. Experimental Verification
Experiments were further conducted on a Xinwei low-current cell test platform using lithium-ion coin cells. Cells were aged under constant-current cycling: charging at 0.4 mA to 4.3 V, followed by discharging at 0.4 mA to 2.7 V. After each discharge, the cell rested for 10 s. The sampling interval was 10 s (i.e., measurements were recorded every 10 s). The cycling thresholds are listed in Table 5, and the experimental setup is shown in Figure 8.
Table 5.
Threshold value of aging progress.
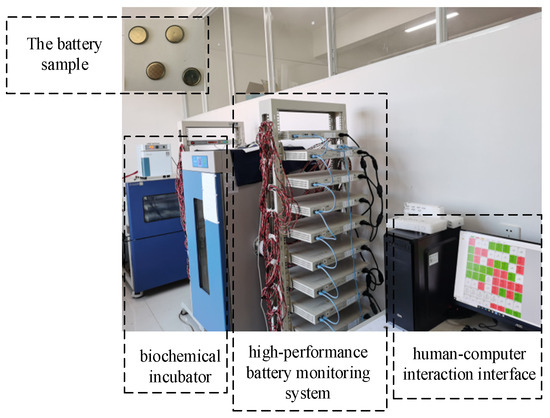
Figure 8.
The experiment platform and battery sample.
The collected data exhibited negligible measurement noise; therefore, the hybrid degradation model could be identified directly, as illustrated in Figure 9.
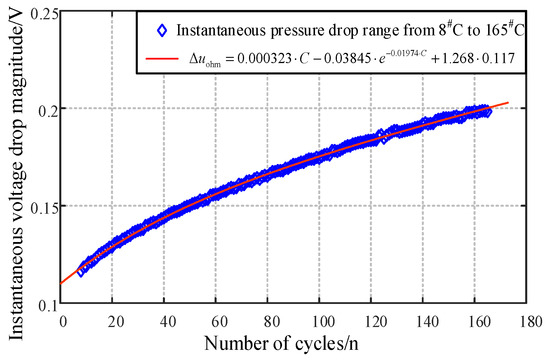
Figure 9.
The nonlinear fitting results of Δuohm.
The identified parameter values α, β, γ, and k are listed in Table 6.
Table 6.
Parameter identification result.
The resulting model is expressed as:
The cell B2 was then aged under the same constant-current cycling conditions for 165 cycles. The instantaneous voltage-drop HI Δuohm was extracted from cycles 8 to 165. With an initial voltage drop of 0.1181 V, the corresponding degradation model is:
Figure 10 shows the predicted Δuohm values from the above degradation model, together with the measured values for cell B2 and the absolute prediction errors.
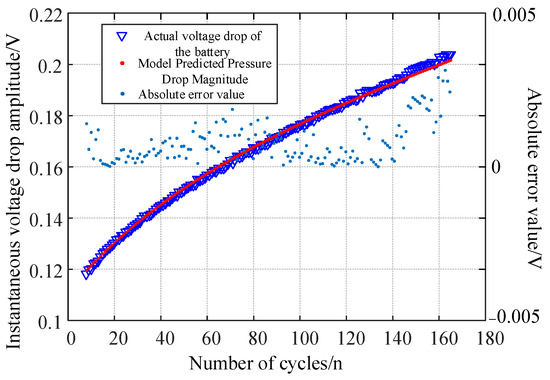
Figure 10.
Prediction results and absolute errors.
For comparison, the Δuohm trajectories predicted by different models are presented in Figure 11.
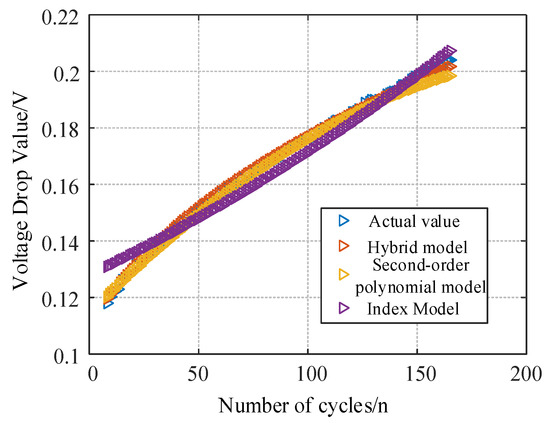
Figure 11.
The forecast result of models and B2# actual value.
Prediction errors (MAE, MaxAE, and RMSE) for each model are summarized in Table 7.
Table 7.
Prediction error statistics for different models.
As reported in Table 7, for cell B2 the proposed hybrid model yields an MAE of 0.000791 V, a maximum absolute error of 0.003143 V, and an RMSE of 0.001036 V, demonstrating close agreement between predictions and measurements. Both polynomial and exponential baselines exhibit larger errors, which further confirms the prediction accuracy and generality of the proposed hybrid degradation model. In addition, the model parameters are straightforward to identify, supporting the use of the sharp voltage drop as an HI for SOH estimation.
This subsection estimates battery SOH using the HI (Δuohm) predicted by the empirical degradation model in Section 3.2 together with the voltage-drop-based SOH estimator in Equation (7). Taking cell B1 as an example, cycle 8 is used as the beginning-of-life reference. Under constant-current cycling, the capacity-based SOH (SOHq) is computed via ampere-hour integration over the voltage window of 4.3–2.7 V. When the discharge capacity decreases to 80% of its initial value, the cell is considered to reach the retirement criterion. Accordingly, Δu0 is taken as the sharp voltage drop at cycle 8, and Δueol is taken as the sharp voltage drop at the cycle where SOHq reaches 80%. The voltage-drop-based SOH (SOHr) of cell B1 is then estimated using Equation (17), and the resulting model expression is shown below:
Figure 12 compares the SOH trajectories obtained by the proposed method and baseline estimators for cell B1.
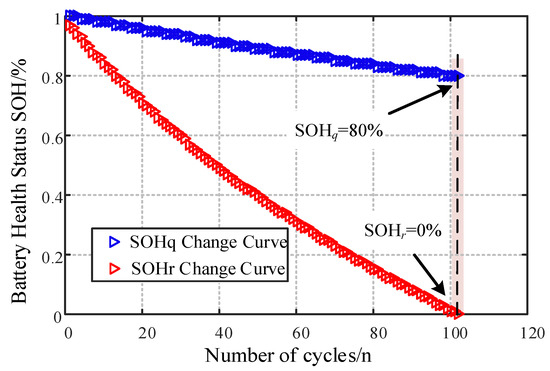
Figure 12.
State of health estimation results of B1# based on instantaneous voltage drop.
As shown in Figure 12, the voltage-drop-based SOH estimate is consistent with the capacity-based assessment. To further validate the proposed estimator, we apply the same procedure to cell B2 using the same empirical degradation model. Specifically, the sharp voltage drop at the cycle where SOHq reaches 80% is taken as Δueol, and the sharp voltage drop at cycle 8 is taken as Δu0. The resulting SOH estimation model for cell B2 is given below:
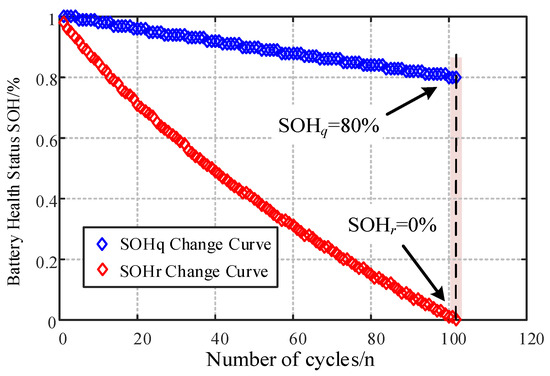
Figure 13.
State of health estimation results of B2# based on instantaneous voltage drop.
5. Comparative Analysis
Figure 12 and Figure 13 show that the voltage-drop-based SOHr estimated from the proposed empirical degradation model is consistent with the capacity-based SOHq assessment. Moreover, compared with SOHq derived from discharge capacity, SOHr exhibits a larger variation, indicating higher sensitivity to aging-induced resistance growth.
In practical applications, accurate capacity estimation typically requires full charge/discharge cycles, and the true internal resistance often needs laboratory electrochemical impedance measurements. In contrast, the proposed method requires only a short voltage segment at the beginning of constant-current discharge and does not rely on complete-cycle data, thereby reducing data requirements and shortening the measurement window.
Using the aging data of cell B1, we also constructed alternative SOH estimation models and evaluated their generalization performance using the aging data of cell B2. The comparative results are shown in Figure 14.
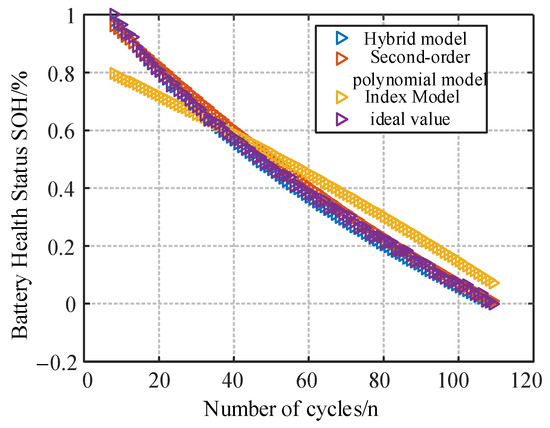
Figure 14.
The estimated results of different models.
Table 8 reports the mean absolute error (MAE), maximum absolute error (MaxAE), and root mean square error (RMSE) of the SOH estimates obtained by different models, using the capacity-based SOHq as the reference.
Table 8.
Error statistics of SOH estimation for different models.
As can be seen from Table 8, for the lithium-ion battery B2#, the average absolute error of the SOH estimation result based on the method described in this paper is 1.0245%, the maximum absolute error is 2.7556%, and the root mean square error is 1.2282%. The health status estimation results are all better than those of other estimation models.
6. Conclusions
This paper takes the instantaneous voltage drop value at the initial stage of discharge in the constant-current discharge condition of lithium-ion batteries as the health factor, and performs data noise reduction using multi-order Bessel curves. Based on this voltage drop value and the number of cycles, a battery empirical degradation model and a new health status estimation model are constructed. The feasibility and effectiveness of the degradation and health assessment models are verified through a series of aging data, and the following conclusions are drawn:
(1) Through correlation analysis, the instantaneous voltage drop value Δuohm at the initial stage of discharge shows a significant positive correlation with the ohmic internal resistance, and a significant negative correlation with the discharge capacity Q. The amplitude variation can indirectly reflect the change in the ohmic internal resistance of the battery, and can replace the capacity as a new health factor.
(2) The empirical degradation model based on the sharp voltage drop value has good prediction accuracy, and the unknown parameters in the model are easy to identify.
(3) The SOH estimation method for lithium-ion batteries described in this paper has the same results as the capacity assessment results, but the assessment changes are more significant and the sensitivity is higher. Secondly, this estimation method only needs to focus on the initial discharge fragment data during the discharge process, without recording the full charge and full discharge process, and the required sampling time is shorter, reducing invalid data.
However, it should be noted that the model parameters are identified based on the aging data of the same batch of batteries, and since the internal characteristic parameters of different types of batteries are not consistent, this method is only applicable to the same batch of batteries. Moreover, the working state needs to be fixed, and it is more suitable for the life assessment and health evaluation of lithium-ion energy storage batteries in the constant-current peak shaving and valley filling operation of energy storage stations. In response to the above deficiencies, future research will focus on more in-depth studies of information extraction under complex conditions, and better extract effective data fragments from the battery.
Author Contributions
Conceptualization, X.X. and Z.Z.; methodology, X.X. and C.Z. (Chaofeng Zhang); software, Z.Z. and J.Y.; validation, J.Y., B.X. and C.Z. (Caibo Zhou); formal analysis, C.Z. (Chaofeng Zhang) and C.Z. (Caibo Zhou); investigation, Z.Z. and B.X.; resources, B.X.; data curation, Z.Z. and J.Y.; writing—original draft, Z.Z.; writing—review and editing, X.X.; visualization, Z.Z.; supervision, X.X.; project administration, X.X.; funding acquisition, X.X. All authors have read and agreed to the published version of the manuscript.
Funding
This research received no external funding.
Data Availability Statement
The raw data can be obtained from the database at NASA’s Open Aging Dataset. The experimental data presented in this study are available on request from the corresponding author.
Conflicts of Interest
Zhenhan Zou, Xiangyang Xia, Jiahui Yue, Boyan Xia, Caibo Zhou have no conflicts of interest. Chaofeng Zhang works for State Grid Hunan Electric Power Co., Ltd. Ultra High Voltage Substation Company.
References
- Shen, Z.; Ye, Y.; Ahmed, K.F.; Ali, A.; Asim, M.; Wang, G. Cooperative Mechanisms for Shared Power Equipment Warehousing among New Energy Power Generation Enterprises in China’s New Power System: A Study Based on a Quantum Game Theory Approach. Transp. Res. E Logist. Transp. Rev. 2026, 206, 104514. [Google Scholar] [CrossRef]
- Hamza, M.F.; Modu, B. A Bibliometric Analysis on Renewable Energy Microgrids Integrating Hydrogen Storage: Strategies for Optimal Sizing and Energy Management. Sci. Afr. 2025, 27, e02609. [Google Scholar] [CrossRef]
- Hirsch, A.; Parag, Y.; Guerrero, J. Microgrids: A Review of Technologies, Key Drivers, and Outstanding Issues. Renew. Sustain. Energy Rev. 2018, 90, 402–411. [Google Scholar] [CrossRef]
- Song, Z.; Zhang, M.; Chi, Y.; Li, J.; Zheng, Y. Research on the Coordinated Optimization of Energy Storage and Renewable Energy in Off-Grid Microgrids under New Electric Power Systems. Glob. Energy Interconnect. 2025, 8, 213–224. [Google Scholar] [CrossRef]
- Yao, J.; Kowal, J. Towards a Smarter Battery Management System: A Critical Review on Deep Learning-Based State of Charge Estimation of Lithium-Ion Batteries. Energy AI 2025, 21, 100585. [Google Scholar] [CrossRef]
- Hossain, M.N.; Rahman, M.M.; Ramasamy, D. Advances in Intelligent Vehicular Health Monitoring and Fault Diagnosis: Techniques, Technologies, and Future Directions. Measurement 2025, 253, 117618. [Google Scholar] [CrossRef]
- Chen, J.; Li, P.; Wu, L. Joint Prediction of SOH and RUL of Lithium-Ion Batteries Using Single-Cycle Charging Data. Energy 2025, 336, 138351. [Google Scholar] [CrossRef]
- Guan, S.; Tong, H.; He, Z.; Dong, Z.; Gao, M. Status, Challenges, and Techniques of Echelon Utilization of Retired Lithium-Ion Batteries. J. Energy Storage 2025, 132, 117786. [Google Scholar] [CrossRef]
- Dang, Q.; Wang, S.; Shi, K.; Gao, Z.; Fernandez, C.; Yu, M. Critical Review on Adaptive Modeling and Parameter Identification for State of Power Estimation in Lithium-Ion Batteries. J. Power Sources 2026, 663, 238937. [Google Scholar] [CrossRef]
- Miyatake, S.; Susuki, Y.; Hikihara, T.; Itoh, S.; Tanaka, K. Discharge Characteristics of Multicell Lithium-Ion Battery with Nonuniform Cells. J. Power Sources 2013, 241, 736–743. [Google Scholar] [CrossRef]
- Sun, C.; Gao, M.; Cai, H.; Xu, F.; Zhu, C. Data-Driven State-of-Charge Estimation of a Lithium-Ion Battery Pack in Electric Vehicles Based on Real-World Driving Data. J. Energy Storage 2024, 101, 113986. [Google Scholar] [CrossRef]
- Li, Y.; Shi, H.; Wang, S.; Huang, Q.; Liu, C.; Nie, S.; Jia, X.; Luo, T. A Comprehensive Review of Remaining Useful Life Prediction Methods for Lithium-Ion Batteries: Models, Trends, and Engineering Applications. J. Energy Chem. 2026, 112, 384–414. [Google Scholar] [CrossRef]
- Wu, C.; Xu, C.; Wang, L.; Fu, J.; Meng, J. Lithium-Ion Battery Remaining Useful Life Prediction Based on Data-Driven and Particle Filter Fusion Model. Green Energy Intell. Transp. 2025, 4, 100267. [Google Scholar] [CrossRef]
- Zhang, H.; Miao, Q.; Zhang, X.; Liu, Z. An Improved Unscented Particle Filter Approach for Lithium-Ion Battery Remaining Useful Life Prediction. Microelectron. Reliab. 2018, 81, 288–298. [Google Scholar] [CrossRef]
- Sun, Y.; Hao, X.; Pecht, M.; Zhou, Y. Remaining Useful Life Prediction for Lithium-Ion Batteries Based on an Integrated Health Indicator. Microelectron. Reliab. 2018, 88–90, 1189–1194. [Google Scholar] [CrossRef]
- Xing, Y.; Ma, E.W.M.; Tsui, K.L.; Pecht, M. An Ensemble Model for Predicting the Remaining Useful Performance of Lithium-Ion Batteries. Microelectron. Reliab. 2013, 53, 811–820. [Google Scholar] [CrossRef]
- Gao, Y.; Jiang, J.; Zhang, C.; Zhang, W.; Ma, Z.; Jiang, Y. Lithium-Ion Battery Aging Mechanisms and Life Model under Different Charging Stresses. J. Power Sources 2017, 356, 103–114. [Google Scholar] [CrossRef]
- Chen, G.; Zhong, S.; Yang, Y.; Zhang, X.; Deng, W.; Liu, J. A Lithium-Ion Battery Health State Assessment and Remaining Useful Life Prediction Method Based on Multi Slope Features. J. Energy Storage 2025, 130, 117324. [Google Scholar] [CrossRef]
- Bu, W.; Liang, H.; Gu, W.; Zheng, M. Joint Estimation of Lithium Battery Health Status and Remaining Useful Life Based on Convolutional Neural Networks-Long Short-Term Memory Networks-Locally Weighted Scatterplot Smoothing. J. Power Sources 2026, 666, 239073. [Google Scholar] [CrossRef]
- Li, H.; Fu, L.; Long, X.; Liu, L.; Zeng, Z. A Hybrid Deep Learning Model for Lithium-Ion Batteries State of Charge Estimation Based on Quantile Regression and Attention. Energy 2024, 294, 130834. [Google Scholar] [CrossRef]
- He, L.; Tian, A.; Ding, T.; Dong, K.; Wang, Y.; Gao, Y.; Jiang, J. Lithium-Ion Battery State Estimation Based on Adaptive Physics-Informed Neural Network of Electrochemical Model. Measurement 2026, 257, 118985. [Google Scholar] [CrossRef]
- Chen, L.; Wu, X.; Lopes, A.M.; Yin, L.; Li, P. Adaptive State-of-Charge Estimation of Lithium-Ion Batteries Based on Square-Root Unscented Kalman Filter. Energy 2022, 252, 123972. [Google Scholar] [CrossRef]
- Li, H.; Wang, S.; Yang, L.; Zhou, Z.; Meng, Y.; Zhang, W.; Shuan, Z.; Li, Y.; Lv, F. SOH Estimation Method for Lithium-Ion Battery Packs under Real-World Operating Conditions Based on a New Attenuated Model without Additional Experiments. Energy 2025, 330, 136802. [Google Scholar] [CrossRef]
- Liu, X.; Yang, K.; Zou, B.; Zhang, X.; Bao, G.; Ma, B.; Zhang, L.; Tan, R. Accurate estimation of state of health for lithium-ion batteries based on Pyraformer and TimeGAN data augmentation. J. Power Sources 2025, 640, 236722. [Google Scholar] [CrossRef]
- Li, Q.; Song, R.; Wei, Y. A Review of State-of-Health Estimation for Lithium-Ion Battery Packs. J. Energy Storage 2025, 118, 116078. [Google Scholar] [CrossRef]
- Tian, A.; Liao, J.; Wang, Y.; Yu, H.; He, L.; Chang, C.; Liao, L.; Jiang, J. State of Health Estimation of Lithium-Ion Batteries Based on Inversion Feature Extraction and Initial Internal Resistance Deviation Correction. J. Energy Storage 2025, 139, 118806. [Google Scholar] [CrossRef]
- Zou, B.; Xiong, M.; Wang, H.; Ding, W.; Jiang, P.; Hua, W.; Zhang, Y.; Zhang, L.; Wang, W.; Tan, R. A Deep Learning Approach for State-of-Health Estimation of Lithium-Ion Batteries Based on a Multi-Feature and Attention Mechanism Collaboration. Batteries 2023, 9, 329. [Google Scholar] [CrossRef]
- Bao, G.; Liu, X.; Zou, B.; Yang, K.; Zhao, J.; Zhang, L.; Chen, M.; Qiao, Y.; Wang, W.; Tan, R.; et al. Collaborative framework of Transformer and LSTM for enhanced state-of-charge estimation in lithium-ion batteries. Energy 2025, 322, 135548. [Google Scholar] [CrossRef]
- Vanem, E.; Wang, S. Data-Driven State of Health and State of Safety Estimation for Alternative Battery Chemistries—A Comparative Review Focusing on Sodium-Ion and LFP Lithium-Ion Batteries. Future Batter. 2025, 5, 100033. [Google Scholar] [CrossRef]


Disclaimer/Publisher’s Note: The statements, opinions and data contained in all publications are solely those of the individual author(s) and contributor(s) and not of MDPI and/or the editor(s). MDPI and/or the editor(s) disclaim responsibility for any injury to people or property resulting from any ideas, methods, instructions or products referred to in the content. |
© 2026 by the authors. Licensee MDPI, Basel, Switzerland. This article is an open access article distributed under the terms and conditions of the Creative Commons Attribution (CC BY) license.