Abstract
Physics-based simulations of lithium-ion battery thermal runaway (TR) and thermal propagation (TP) enable the assessment of diverse temperature behaviors among individual cells. These behaviors are primarily driven by variations in thermal properties and the amount of heat released during thermal decomposition. However, given the inherent variability in thermal property measurements, the specific values adopted can lead to substantial differences in predicted temperature behavior. In this study, we developed a 1-dimensional TP model for an array of three prismatic lithium-ion battery cells, in consideration of the uncertainty of key thermal parameters including specific heat, thermal conductivity, activation energy, and the latent heat of the thermal decomposition reaction. The validity of the model and the identification of calibration parameters are ensured through comparison with experimentally measured temperatures. We evaluated the influence of these parameter variations on the temperature and thermal runaway behavior of each cell. Our findings indicate that the variation in thermal runaway timing increases with distance from the trigger cell, and the probability of thermal runaway in the end cell was significantly higher than in the center cell. A sensitivity analysis using a surrogate model revealed that cell temperature is more sensitive to variations in thermal conductivity and latent heat than to variations in specific heat and activation energy.
1. Introduction
In recent years, lithium-ion batteries (LIBs) have been increasing in capacity and size through modularization and packaging, leading to their application in a wide range of industries, including transportation equipment such as electric vehicles, passenger planes, and space exploration vehicles, as well as housing and plants [1,2]. Consequently, in addition to high energy density and durability at the single-cell level, high safety in module/pack configurations is required under various usage environments, including different temperatures, pressures, and humidity levels [3,4]. Safety tests for LIBs are governed by various related laws and standards [5,6,7], and the safety of cells and modules is confirmed under conditions such as drop tests, overcharging, and external heating. Particularly in battery modules, the ability to withstand fire spread from a trigger cell, which initiates thermal runaway, is an important evaluation item. Safety enhancements have been investigated through measures such as cooling mechanisms, protection circuits, and improved insulation between cells [8,9,10].
In addition to experimental evaluations, simulation-based safety studies have recently been proposed to accelerate LIB design using digital twin methodologies [11,12,13]. The history of safety (thermal runaway) simulations for LIB single cells spans several decades, with numerous reports published [11,12,13,14,15,16,17,18,19,20,21,22,23,24,25,26]. In many cases, the thermal decomposition reaction profile of LIB cells is measured using Differential Scanning Calorimetry (DSC) for each of the positive and negative electrodes, or Accelerating Rate Calorimetry (ARC) for cells, and temperature changes are predicted from energy equations that consider heat generation due to short circuits and heat dissipation to the environment [14,15,16,17,18,19,20,21,22,23,24,25,26]. Heat generation from short circuits varies depending on the short circuit mechanism. For external heating, heat input from an external source such as a heater is considered [14,15,16,17,18], while for overcharging, Joule heating and entropy heating are taken into account [19,20]. In nail penetration tests, Joule heating from the nail and resistance layer is considered [21,22,23]. Recently, models simulating gas ejection from LIB cells, such as electrolyte vaporization and oxygen generation from the positive electrode, have also been proposed [16,24,25,26]. However, it is important to note that some reports indicate uncertainty in the measurement of cell thermal properties (specific heat, density, thermal conductivity) and the latent heat of thermal decomposition reactions [27], and prediction results can vary depending on the values used.
Safety simulations of LIB modules [28,29,30,31,32,33] involve arranging multiple single-cell models within a domain and calculating the energy balance of the system. In these simulations, the initial cell undergoes thermal runaway, for example, due to external heating, and the subsequent fire spread (cell-to-cell) or cooling behavior to surrounding cells is reproduced. Fire spread simulations have been conducted for LIB modules composed of cylindrical cells [16,28,29], pouch cells [30], and prismatic cells [31,32,33], and the influence of insulation between cells on safety has been discussed. The geometry of the models is selected based on a balance between the purpose and computational load, ranging from the simplest 0-dimensional, 1-dimensional with simplified cell-to-cell heat transfer, to 3-dimensional with detailed structural considerations. Recently, we constructed a module fire spread model for cylindrical cells that considers gas release due to electrolyte vaporization and systematically investigated the effects of the thermal properties of the battery holder and housing on thermal runaway and fire spread behavior [16]. Furthermore, Li et al. [33] recently simulated the fire spread and gas flow in a battery module composed of four prismatic cells using the Finite Element Method (FEM) and surrogate models, and quantitatively discussed the heat transfer between cells. All of these reports indicate that thermal parameters, such as the thermal properties of the cells and the latent heat of thermal decomposition reactions, influence the presence or absence of fire spread. However, while there is variability in the measurement of these thermal parameters, many reports employ a deterministic approach using representative values. Therefore, the influence of the uncertainty of these parameters on cell-to-cell fire spread remains unclear. More recently, W. Zhang et al. [34] analyzed the uncertainty of thermal runaway propagation of a battery pack composed of 18,650 cells using thermal simulation and statistical model. The results indicate the battery SOC, the thermal conductivity between cells and cell spacing can significantly affect the thermal runaway propagation behavior. However, while they focused on the design parameters of the battery pack, the impact of the uncertainty of experimental measurements is still unclear.
In this study, we construct a 1-dimensional thermal runaway propagation simulation model for fire spread caused by heater heating and develop a probabilistic evaluation method for thermal runaway occurrence and temperature, considering the uncertainty of thermal parameters. We also evaluate the sensitivity of battery temperature to thermal parameters. Here, we select four parameters of electrode properties (specific heat, thermal conductivity, activation energy of electrode thermal decomposition reaction, and latent heat), perform heat transfer calculations assuming input distributions, and obtain a temperature profile database (DB). Furthermore, we evaluate the sensitivity of the thermal parameter values by constructing a prediction model using machine learning, utilizing the DB.
2. Method
The flow of this study is shown in Figure 1. First, we measure the thermal parameters of LIB cells (specific heat, intra-cell thermal conductivity, and activation energy and latent heat from DSC). Next, we construct a 1-dimensional LIB thermal runaway propagation model using the average values of these parameters and validate its plausibility by identifying unknown parameters against actual thermal runaway propagation tests. Subsequently, focusing on the specific heat of the cells, the activation energy and latent heat of the thermal decomposition reaction, and the intra-cell thermal conductivity as thermal parameters that may vary, we predict the temperature profile of each cell, assuming that these parameters follow a normal distribution. We also construct a surrogate model using machine learning based on these calculation results and analyze the sensitivity of the cell’s maximum temperature and thermal runaway timing to the thermal parameters.
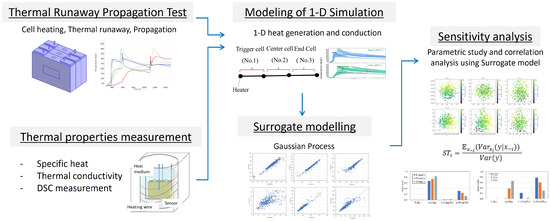
Figure 1.
Schematics of modeling and simulation flow in this study.
2.1. Measurement of Thermal Properties of Cell and Thermal Runaway Propagation Test
Commercially available prismatic cells (25Ah, positive electrode: Li(NixCoyMnz)O2, negative electrode: Graphite) were disassembled, and the positive and negative electrodes were sampled to create half-cells with a lithium counter electrode. After adjusting the State of Charge (SOC) to 100%, the cells were disassembled, electrolyte was injected, and the self-heating profiles of the positive and negative electrodes were measured by DSC (X-DSC7000, Hitachi High-Tech Corporation, Tokyo, Japan). The heating rates were 5, 10, and 15 °C/min. In DSC measurements of electrodes, variations in measured values can occur due to factors such as sampling location, environment, and electrolyte injection state. Here, measurements were performed three times for each heating rate, and the average and standard deviation were calculated. Additionally, the specific heat of the same type of cell was measured by an external heating method. Since the external heating method can also produce variations in measured values due to temperature non-uniformity within the adiabatic container, measurements were performed a total of three times, and the average and standard deviation were evaluated, similar to the DSC measurements. These measurement conditions are summarized in Table 1.

Table 1.
Conditions of DSC measurement.
The thermal runaway propagation test data were obtained from previous tests conducted separately on three cells by the co-authors [35]. The outline of the test is as follows: Three prismatic battery cells (147 mm × 91 mm × 27 mm) were arranged side by side, and a polyimide heater (50 mm × 25 mm) was attached to the side of the trigger cell and heated with a heat input of 400 W. The multi-cell assembly is fixed by bolted fastening using stainless-steel (SUS) restraint plates. No insulation was installed between the cells. K-type thermocouples were attached to the top of each cell to measure the temperature. Figure 2 shows a schematic diagram of the test. The thermal conductivity between cells includes uncertainty due to variations in the contact state between cells. These variations arise from non-uniform constraint pressure [34], which can result from factors such as differences in bolt tightening torque, slight misalignment of the cells, and mechanical tolerances in the assembly process.

Figure 2.
(a) Image of prismatic cell. (b) CAD geometry of the experimental setup.
2.2. Thermal Runaway Propagation Model for Multiple Cells
A 1-dimensional thermal propagation model simulating a heater heating test was constructed for three prismatic lithium-ion battery cells. The geometry is shown in Figure 3. As illustrated in Figure 3, it is a 3-interval-model representing three distinct cells, with 1-dimensional heat transfer along the stacking direction through the centers of three cells. A constant heat generation rate is applied to the trigger cell (#1), and heat generation due to thermal decomposition reaction, heat transfer to adjacent cells, and heat dissipation to the environment are calculated. If temperature is denoted as T, the energy equation of intra-cell and inter-cell is:
where ρ, C, kcell, and kcontact represent the cell density, specific heat, the intra-cell thermal conductivity, and the thermal conductivity between cells, respectively, and qi,in, qi,reac, qi,ht, and qi,rad represent the heat input from the heater, heat of thermal decomposition reaction, convective heat transfer, and radiative heat transfer, respectively. The subscript i represents the cell number. The heat of thermal decomposition reaction qi,reac is assumed to be proportional to the time change of the unreacted fraction. That is,
where Qtot is the latent heat of reaction, and ci,j is the unreacted fraction, and the subscript j corresponds to each reaction peak. The unreacted fraction ci,j is assumed to follow the modified Arrhenius equation.
where k0,j is the reaction rate constant, Ej is the activation energy, and C0, n, and m are constants. Each cell is cooled by convection and radiation. The heat transfer qi,ht due to convection is assumed to be proportional to the difference between the ambient temperature Tamb and the cell temperature. If the convective heat transfer coefficient is h and the specific surface area is a, then
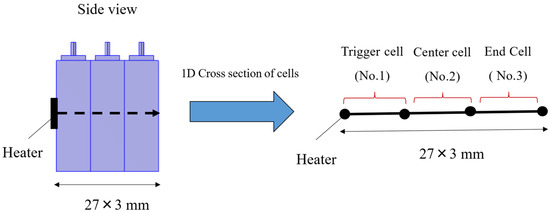
Figure 3.
Geometry of 1-dimensional thermal propagation model.
The heat transfer due to radiation is assumed to follow the Stefan–Boltzmann equation:
Table 2 shows a list of the parameters used in this model. Here, since the thermal conductivity between cells kcontact, the convective heat transfer coefficient h, and the emissivity ε are unknown, they are determined so as to reproduce the measured temperature profiles of each cell as closely as possible. Here, the error Err between the simulation temperature and the measured temperature is defined as follows, and the parameters that minimize this error are searched for:
where Ti,exp(t) is the measured temperature at time t, and tmax is the maximum time.
Table 2.
Parameters for 1D thermal runaway propagation model.
Next, assuming that the specific heat C of the cells, the intra-cell thermal conductivity kcell, and the activation energy E and latent heat Q of the thermal decomposition reaction follow a normal distribution, the thermal propagation simulation model is executed using the sampled values. The number of calculations is 400. The general-purpose FEM solver COMSOL Multphysics© ver.6.2 [36] is used for the calculations.
2.3. Surrogate Model of Thermal Runaway Propagation
Generally, a large amount of calculation result data is required for sensitivity analysis of input parameters. Therefore, a surrogate model using machine learning is constructed using the calculation result data of the 1-dimensional thermal propagation model described in Section 2.2. This makes it possible to significantly reduce the calculation time per run and generate a large amount of data.
The explanatory variables are (C, kcell, E, Q), and the objective variables are the maximum temperature and thermal runaway timing of each cell (Tmax, tTR). Since the correlation between these is expected to be complex and non-linear, Gaussian Process Regression (GPR), which enables non-parametric and non-linear regression, is employed in this study instead of linear-based algorithms such as Ridge and Lasso regression. The Matérn 5/2 kernel function, a typical kernel function, is used. The statistical analysis software SmartUQ 9.1.1 [37] is used here.
3. Results
3.1. Thermal Properties
Figure 4 shows the DSC charts of the positive electrode, negative electrode, and separator at heating rate 5 °C/min. Clear peaks due to the thermal decomposition reaction are observed near 300 °C (pos 1) and 320 °C (pos 2) in the positive electrode. On the other hand, sharp peaks are observed near 160 (neg 1) and 340 °C (neg 2) in the negative electrode, which are presumed to be SEI decomposition and negative electrode–electrolyte reaction from the low-temperature side. An endothermic peak is observed near 130 °C (sep 1) in the separator, indicating melting of the separator and electrolyte evaporation.
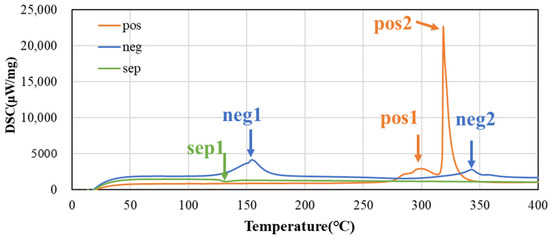
Figure 4.
DSC charts of both electrodes and separator at heating rate 5 °C/min.
Focusing on these five peaks, they were extracted by baseline correction with a linear function (see Figure 5). The heat generation profile at a constant heating rate was calculated using Equations (2) and (3), and the activation energy E, latent heat Q, reaction rate constant k0, and coefficients n and m were identified by fitting to minimize the difference from each measured value. The specific heat and density of the prismatic cells were determined by the external heating method [34]. Measurements were performed three times each (n = 3). Table 3, Table 4, Table 5 and Table 6 summarize the determined parameter values and the previously reported values [21,38,39,40]. The latent heat Q and activation energy E are generally within the reported range; however, direct comparison of the rate coefficient k0 is difficult, since it can vary over a wide range depending on the values of the constants n, m, and C0. It should be noted that the references correspond to studies employing electrode materials of the same type as those used in this study, although the material properties at the microscopic scale—including the composition and microstructural state of the active material particles—may not fully coincide. Variations of each determined value are observed in the three measurements. This variability is likely due to factors such as the non-uniformity of the sample, the injection and volatility of the electrolyte, and the temperature distribution within the measurement device or variations in the reaction progression inside the sample. Using the mean and standard deviation evaluated here, the simulations are carried out including uncertainty (see Section 3.3).
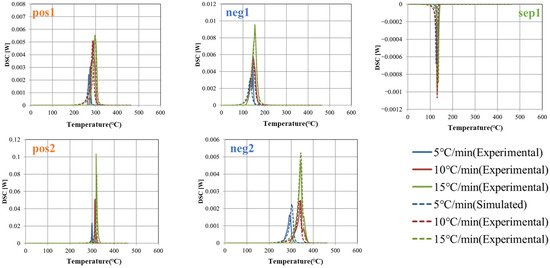
Figure 5.
Extracted thermal decomposition peaks at 5, 10 and 15 °C/min.
Table 3.
Determined parameter values for positive electrode.
Table 4.
Determined parameter values for separator.
Table 5.
Determined parameter values for negative electrode.
Table 6.
Evaluated thermal parameter values.
It should be noted that, in this study, the probability distribution of the explanatory variables was assumed to be normal. This assumption is not self-evident. With a sample size of n = 3, the data may not accurately reflect the actual variability. The assumed distribution and the accuracy of the standard deviation could potentially affect the frequency of the battery temperature and the thermal runaway timing. In the future, it would be necessary to evaluate the mean and standard deviation based on measurements with an increased number of samples.
3.2. Experimental Temperature Profiles and Model Calibration
The thermal conductivity between cells kcontact, the convective heat transfer coefficient h, and the emissivity ε, which are unknown parameters in the 1-dimensional thermal propagation model, were determined to reproduce the measured temperature profiles of each cell in the thermal runaway propagation test. The average values of the measured values were used for the cell thermal properties (kcell, C, ρ) and thermal decomposition reaction parameters (E, Q, k0, n, m, C0). Figure 6 shows the measured and simulated temperature profiles of the trigger cell (#1), center cell (#2), and end cell (#3). In all cells, the maximum temperature and the timing of the rapid temperature rise coincide, indicating that the simulated temperature reproduces the measured values well. Table 7 shows the determined values of each parameter and the reported values [41,42]. The convective heat transfer coefficient h and the emissivity ε are generally close to the reported values. On the other hand, since the thermal conductivity between cells kcontact varies greatly depending on the cell arrangement and insulation, simple comparison with reported values is difficult. Since the typical thermal conductivity of a single cell is approximately 1–10 W/m2∗K [43], the value of kcontact determined here is interpreted as representing enhanced heat transfer due to direct cell-to-cell contact.
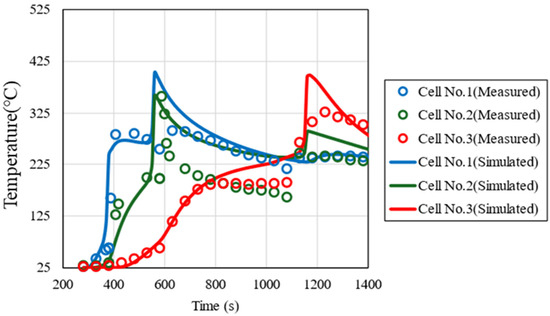
Figure 6.
Comparison of measured and simulated temperature profiles of the trigger cell (#1), center cell (#2), and end cell (#3).
Table 7.
Determined values of calibration parameter and the reported values.
3.3. Effect of Thermal Properties of LIB Cell on Thermal Runaway Propagation
Using the parameters determined in Section 3.1 and Section 3.2, a parametric study was conducted for various thermal parameters (specific heat C, intra-cell thermal conductivity kcell, activation energy E and latent heat Q of the thermal decomposition reaction), and the effect of variations in the measured values on the thermal runaway behaviour was evaluated. At that time, assuming that these thermal parameters follow a normal distribution, sampling was performed by the Monte Carlo method, and a total of 400 cases were calculated. Figure 7a shows the frequency distribution of the sampling of each parameter, and Table 8 summarizes the average and standard deviation of the parameters used. These values are estimated based on thermal properties obtained from n = 3 measurements. In considering the variability, the peak of the thermal decomposition reaction with the largest latent heat (pos 2) was selected to reduce the number of parameters and thereby enhance the interpretability of the results.
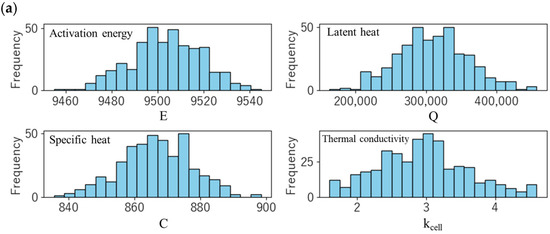
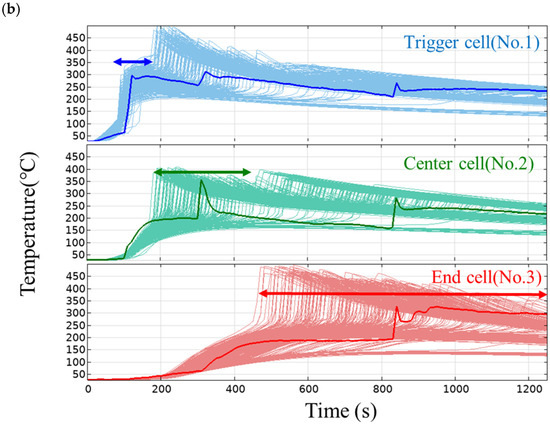
Figure 7.
(a) Distribution of the sampling of each parameter. (b) Temperature profiles of the trigger cell (#1), center cell (#2), and end cell (#3). Thick solid lines represent the measured temperature.
Table 8.
Parameters for probability distribution.
Figure 7b shows the temperature profiles of the trigger cell (#1), center cell (#2), and end cell (#3). In the trigger cell, the measured temperature (thick solid line in the figure) shows a rapid rise in temperature due to thermal runaway at around 100 s, and the simulation also shows a temperature rise at almost the same timing at all levels, that is, the variation is small. This is probably because the thermal runaway timing in the trigger cell is governed by the heat input from the heater and is not affected by variations in the parameters of the thermal decomposition reaction. On the other hand, in the center cell, the measured temperature rises rapidly at around 300 s, while the simulation shows large variations. The reason for this is thought to be that the thermal runaway timing of the center cell is affected not only by variations in the intra-cell thermal conductivity and specific heat but also by variations in the parameters of the thermal decomposition reaction. In the end cell, the thermal runaway timing in the simulation varies even more, which supports this hypothesis.
In this study, the thermal runaway propagation test used to validate the simulation was conducted only once [35]; however, it is expected that performing multiple tests under the same conditions would allow for validation of the output distribution. Furthermore, by conducting experiments to investigate reproducibility at the assembled-cell level, it would be possible to evaluate the effects of factors such as cell restraint methods and testing environment conditions.
Figure 8 shows the histograms of the thermal runaway timing (tTR) and maximum temperature (Tmax) of each cell in the simulation. The thermal runaway timing (Figure 8a) is delayed in the order of the trigger cell, center cell, and end cell, indicating that thermal runaway is propagating. As mentioned above, the trigger cell has a relatively small variation, but the variation increases as the distance from the trigger cell increases in the center cell and the end cell.
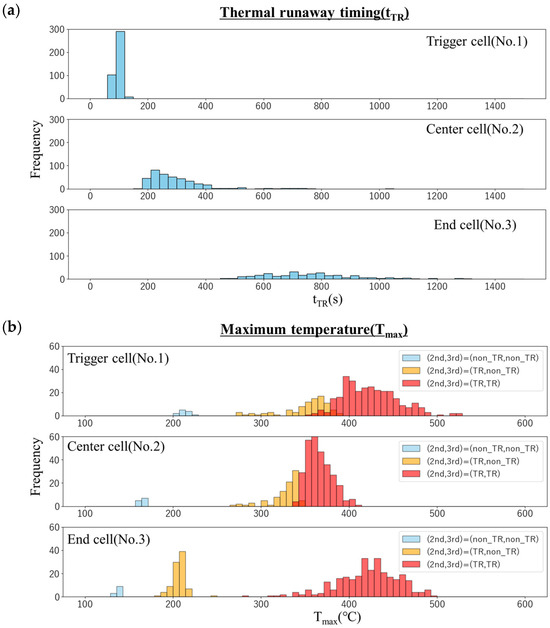
Figure 8.
Histograms of (a) thermal runaway timing (tTR) and (b) maximum temperature (Tmax) of each cell in the simulation.
In the histogram of the maximum temperature (Figure 8b), the light blue bars represent the frequency of cases where neither the center cell nor the end cell underwent thermal runaway (Case-1). The yellow bars show the frequency for cases where the center cell underwent thermal runaway, but the end cell did not (Case-2), and the red bars indicate cases where both cells experienced thermal runaway (Case-3). It should be noted that the trigger cell reached thermal runaway in all cases. In Case-1, the trigger cell reached approximately 200 °C, but the maximum temperature progressively decreased to about 160 °C in the center cell and 140 °C in the end cell. In contrast, for Case-2, both the trigger cell and the center cell reached maximum temperatures of 300–350 °C, while the end cell’s temperature dropped significantly to approximately 200 °C. On the other hand, in Case-3, the trigger cell and the end cell temperatures are high at about 450 °C, and the center cell temperature is relatively low at about 370 °C. Furthermore, in any cell, the variation in the maximum temperature is about 100 °C, and no clear difference was seen. This is interpreted as follows: Since the heater heating continues in the trigger cell, the temperature rises higher due to the temperature rise caused by the thermal decomposition reaction. In contrast, the temperature of the center cell rises due to heat transfer from the trigger cell, but since it is cooled by heat transfer to the end cell, the temperature does not rise so high. The temperature of the end cell rises due to heat transfer from the center cell, but since there is no heat removal to the cell, cooling does not proceed, and as a result, the temperature tends to be high. Also, these are less affected by variations in thermal runaway timing. It should be noted that the probability of “no thermal runaway” in the center cell is about 3% (the light blue bars in the center cell), whereas that in the end cell reaches 25% (the light blue and yellow bars in the end cell). This suggests that the uncertainty of each measured value propagates from cell to cell, and as a result, the presence or absence of thermal runaway is greatly affected.
3.4. Sensitivity Analysis Using Surrogate Model
Using GPR, a surrogate model with explanatory variables (C, kcell, E, Q) and objective variables (Tmax, tTR) was constructed. Figure 9 shows scatter plots of the calculated values by the 1-dimensional thermal runaway model and the predicted values by the surrogate model. Each plot is generally on the 45-degree line, and it can be seen that the surrogate model satisfactorily predicts both Tmax and tTR in each cell. The R2 value for the trigger cells tTR is somewhat low (R2 = 0.555), which is likely due to the small variability of tTR across the different conditions. In other words, since the thermal runaway timing for the trigger cells does not vary significantly, the proportion of variance that can be explained by the surrogate model is inherently limited, resulting in a relativity lower R2. Nevertheless, the absolute prediction error remains small, as indicated by the root mean square error (RMSE), which is comparable to that of the other cells. This suggests that, despite the modest R2, the surrogate model is still capable of accurately capturing the thermal runaway timing within the narrow range of observed variability. Therefore, we have adopted this model.
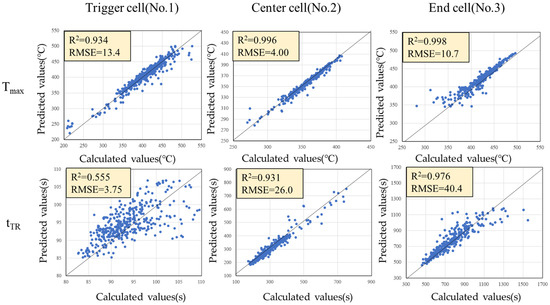
Figure 9.
Scatter plots of the calculated values by the 1-dimensional thermal runaway model and the predicted values by the surrogate model.
Next, using the constructed surrogate model, the maximum cell temperature Tmax and tTR were predicted for the explanatory variables (C, kcell, E, Q) under a total of 10,000 conditions. Table 9 shows the range of the explanatory variables, corresponding to the evaluated standard deviation described in Section 3.3. Figure 10 shows the Tmax for specific heat C and intra-cell thermal conductivity kcell, and the values for activation energy E and latent heat Q, respectively. In both the center cell and the end cell, the maximum temperature decreases as C increases and kcell decreases, but the effect of kcell is greater than that of C (Figure 10 upper). This is probably due to the relatively large variation in the measured value of kcell and the large uncertainty. On the other hand, in any cell, it can be seen that the maximum temperature changes more significantly depending on the value of Q than the value of E (Figure 10 lower). This is presumably because the uncertainty in the peak position in DSC measurement is relatively smaller than that in latent heat, and as a result, the effect on the maximum temperature is greater.
Table 9.
Range of descriptors for surrogate model.
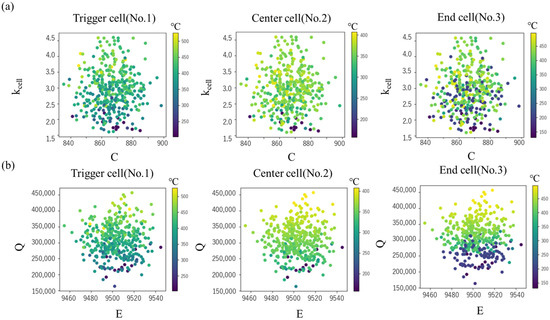
Figure 10.
Maximum cell temperatures in various values of (a) specific heat C and intra-cell thermal conductivity kcell (b) activation energy E and latent heat Q.
The scatter plots of tTR for C and kcell, and the values for E and Q are shown in Figure 11. In the end cell, there is a tendency for tTR to decrease as kcell becomes smaller, while the effect of C is minimal (Figure 11 upper). However, this trend is prominent in the end cell but not clear in the center and trigger cells. On the other hand, in the trigger cell, a larger kcell leads to a smaller tTR, whereas in the center and end cells, tTR tends to increase. This is interpreted as a larger thermal conductivity, kcell, enhancing the heat removal effect in the trigger cell, but promoting temperature rise in the center and end cells. The sensitivity to Q is prominent in the end cell, where a larger Q leads to a clear decrease in tTR.
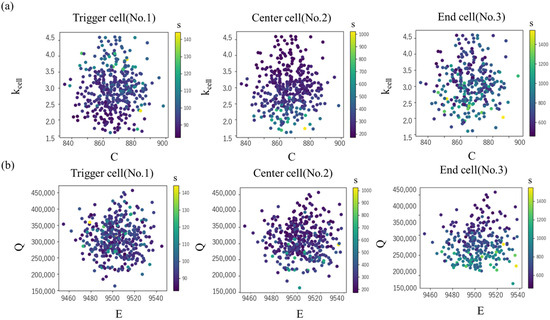
Figure 11.
Thermal runaway timing tTR in each cell in various values of (a) specific heat C and intra-cell thermal conductivity kcell (b) activation energy E and latent heat Q.
The Multiview feature is shown in Figure 12. In this plot, the horizontal axis represents the difference from the mean of the explanatory variable (ΔE, ΔQ, ΔC, Δkcell), while the vertical axis represents output variable (Tmax and tTR). The gray area in the plot indicates the 95% confidence interval. The cross-sections show how an output variable (Tmax and tTR) responds to changes in explanatory variable (ΔE, ΔQ, ΔC, Δkcell) when all other input variables are held constant. Thus, it can be seen how these different parameters are influential for the respective Tmax and tTR. In the trigger cell, the variation in the thermal runaway timing, tTR, is very small; therefore, it exhibits only slight sensitivity to Δkcell and ΔC, which remains within the 95% confidence interval (the gray shaded area in Figure 12). For Δkcell, a slight tendency for earlier thermal runaway timing is observed in the range of higher intra-cell thermal conductivity. In contrast, the center and end cells exhibit the opposite trend with respect to Δkcell, indicating a stronger influence of ΔQ. The cell-to-cell differences in sensitivity to Δkcell suggest that the balance between the promotion of thermal runaway due to increased thermal conductivity within the cell and heat dissipation to adjacent cells governs the response. Furthermore, for Tmax, it is confirmed that all cells exhibit high sensitivity to ΔQ and Δkcell, showing a similar dependency.
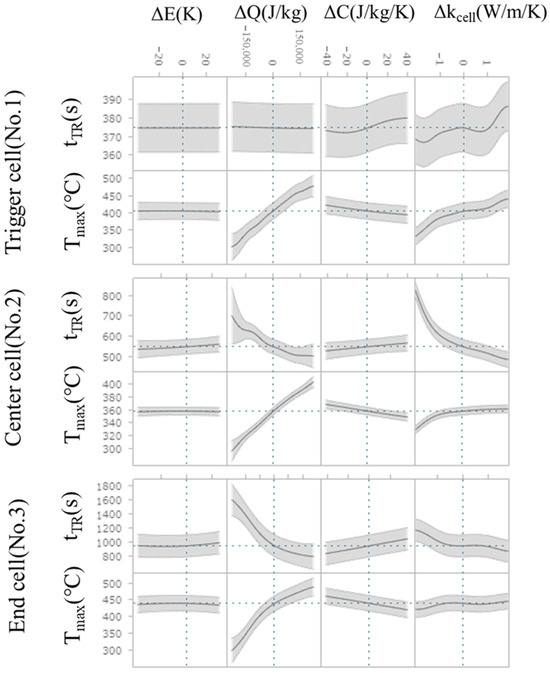
Figure 12.
The cross-sections of Tmax and tTR respond to change in explanatory variables (difference from the averaged value). The gray shaded area represents the 95% confidence interval.
In order to quantify the influence of the explanatory variables (C, kcell, E, Q) on the maximum temperature Tmax and the timing of thermal runaway tTR, sensitivity analysis was performed using the Sobol index [44]. The Sobol index is one of the variance-based global sensitivity analysis methods, and the degree of influence of the variance of the input on the variance of the output can be evaluated.
Here, xi represents the input (here, C, kcell, E, Q), and y represents the output (here, Tmax, tTR). Figure 13a,b show the Sobol index of each input at Tmax and tTR, respectively. For both the maximum temperature Tmax and the thermal runaway timing tTR, the influence of the intra-cell thermal conductivity kcell and the latent heat Q is large, and it can be seen that it changes continuously depending on the distance from the trigger cell. This indicates that the heat propagation and the amount of heat generation of the cell affect the temperature-time (position) profile. On the other hand, the Sobol indices (ST values) for the specific heat C and activation energy E are low, indicating that the variability of these measured values has a relatively minor effect on the variability of Tmax and tTR. This is likely because the assumed ranges of measurement variability in this study were small: 1.2% for C and 0.16% for E (both expressed as the standard deviation relative to the mean value), which consequently resulted in a small impact on Tmax and tTR within these ranges.
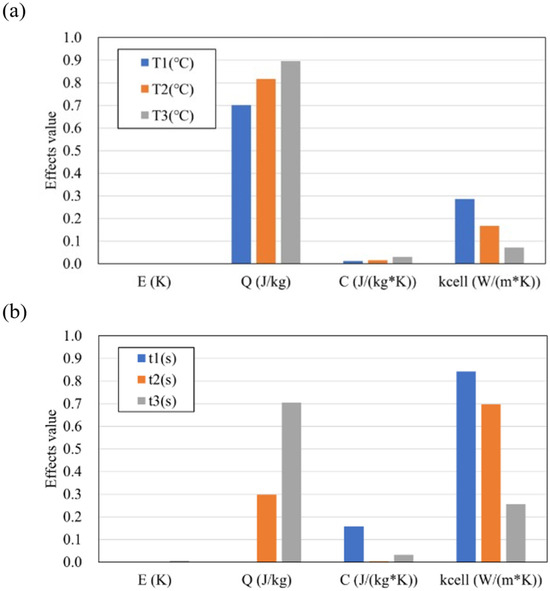
Figure 13.
Sobol index of each descriptor values at (a) Tmax and (b) tTR.
4. Discussion
Thermal runaway propagation was evaluated using a 1D solid heat transfer model with a representative temperature for each cell to reduce computational costs. Consequently, effects such as anisotropic heat conduction and heterogeneous reactions were not considered. However, in modules or pack systems with more complex cell arrangements, such as those used in actual electric vehicles and other transportation applications, three-dimensional heat conduction, reactions, and non-uniform heat generation become important [27,30,38,39,40,41,42,43,44]. These variations tend to be larger, particularly in larger or degraded cells [45]. Therefore, the validity of the approximations in this model must be verified based on the battery cell and module materials and configurations. Furthermore, in confined spaces like battery packs, heat propagation from high-temperature gas ejection and flames is known to have a significant impact [41,42,43,44]. The application of a more detailed model that considers these factors would likely enable the evaluation of uncertainty across a wider range of parameters, such as cell size, number of cells, capacity, and materials.
From a practical standpoint, the results of this study provide important guidance for battery pack designers. The high sensitivity of thermal runaway timing and maximum cell temperature to intra-cell thermal conductivity (kcell) and latent heat of thermal decomposition (Q) underscores the critical importance of carefully controlling these parameters during cell manufacturing and quality assurance. Moreover, the fact that variations in these parameters significantly affect the occurrence of thermal runaway and the maximum temperature highlights the necessity of ensuring accurate baseline data for cell thermal properties and heat generation characteristics. These findings emphasize the practical significance of incorporating thermal property evaluation and control in both cell production and battery pack design, as such measures can directly influence thermal safety and overall reliability. In addition, it should be noted that the peak neg1 extracted in Figure 5, which is associated with SEI decomposition, may vary depending on the degradation state of the battery. This suggests that battery degradation significantly influences not only thermal runaway but also thermal propagation behavior.
W. Zhang et al. [34] simulated and analyzed the thermal runaway propagation uncertainty for a battery pack of 18,650 cells. It was shown that battery state of charge (SOC), the thermal conductivity between cells, and cell spacing can be significant factors. As described in the previous section, it was demonstrated that variations in the latent heat of thermal decomposition (Q) and the intra-cell thermal conductivity (kcell) have a major impact on the maximum cell temperature and the timing of thermal runaway. Since Q generally depends on the SOC [46], this result is qualitatively consistent with that of W. Zhang et al. However, while a high sensitivity to Q and kcell was found in this study, this is not necessarily a universal finding and could vary significantly depending on the measurement method and the assumed range of variability.
In addition, in this work, three measurements each were conducted for DSC, specific heat, and thermal conductivity. For a more precise evaluation, a greater number of measurements would be necessary.
5. Conclusions
In this study, we constructed a 1-dimensional thermal runaway simulation model for fire spread in three cells caused by heater heating and developed a probabilistic evaluation method for thermal runaway occurrence and temperature, considering the uncertainty of thermal parameters. After confirming the validation of the model, we focused on four thermal parameters (specific heat, intra-cell thermal conductivity, activation energy of electrode thermal decomposition reaction, and latent heat) and evaluated the effects of their variations on the maximum temperature, thermal runaway timing, etc., of each cell.
In the trigger cell, thermal runaway consistently occurred, and the variation in thermal runaway timing was small, indicating that it is primarily governed by the heat input from the heater. In the center cell, larger variability was observed in both the thermal runaway timing and maximum temperature, with maximum temperatures ranging from 160 °C to 350 °C; this is attributed to the combined effects of variations in thermal conductivity, specific heat, and thermal decomposition reaction parameters. The end cell exhibited even greater variability, with maximum temperatures ranging from 140 °C to 450 °C. This behavior reflects sequential heat transfer between cells: the center cell is partially cooled by the end cell, limiting its peak temperature, while the end cell tends to reach higher temperatures due to limited heat dissipation. Overall, these quantitative results demonstrate that thermal runaway propagation is strongly dependent on inter-cell thermal properties and decomposition parameters, with variations increasing from the trigger cell to the end cell.
As a result of evaluating the maximum temperature distribution of each cell, the probability of “no thermal runaway” in the center cell was about 3%, whereas that in the end cell reached 25%. This suggests that the uncertainty of each measured value propagates from cell to cell, and as a result, the presence or absence of thermal runaway is greatly affected. Using the constructed surrogate model, we conducted a parametric study with a total of 10,000 conditions. As a result, the sensitivity of the thermal conductivity k was higher than that of the specific heat C in both the center cell and the end cell. In addition, in any cell, it was found that the value of latent heat Q has a higher sensitivity to the maximum temperature.
These results highlight the importance of considering parameter uncertainty in thermal safety assessments and provide quantitative guidance for battery pack design, experimental planning, and safety management. In the future, repeating thermal runaway propagation tests under the same conditions and investigating reproducibility at the assembled-cell level are expected to further enhance the reliability of the model predictions.
Author Contributions
Conceptualization, H.K. and Y.T.; methodology, H.K. and Y.T.; software, H.K. and Y.T.; validation, Y.T., R.B. and T.Y.; formal analysis, H.K.; investigation, H.K. and Y.T.; resources, M.N. and K.S.; data curation, Y.T.; writing—original draft preparation, H.K.; writing—review and editing, Y.T. and T.Y.; visualization, H.K.; supervision, Y.T.; project administration, Y.T.; All authors have read and agreed to the published version of the manuscript.
Funding
This research received no external funding.
Institutional Review Board Statement
Not applicable.
Informed Consent Statement
Not applicable.
Data Availability Statement
The original contributions presented in this study are included in the article. Further inquiries can be directed to the corresponding author.
Conflicts of Interest
Authors Hayato Kitagawa, Masato Nishiuchi, Koichi Saeki, Ryohei Baba and Tatsuya Yamaue were employed by the company Kobelco Research Institute, Inc. The remaining author declares that the research was conducted in the absence of any commercial or financial relationships that could be construed as a potential conflict of interest.
Abbreviations
The following abbreviations are used in this manuscript:
| TR | Thermal runaway |
| TP | Thermal propagation |
| LIB | lithium-ion batteries |
| DSC | Differential Scanning Calorimetry |
| ARC | Accelerating Rate Calorimetry |
| FEM | Finite Element Method |
| DB | Database |
| SOC | State of Charge |
| CAD | Computer-Aided Design |
| GPR | Gaussian Process Regression |
| SEI | Solid Electrolyte Interphase |
| T | Temperature |
| ρ | Density |
| C | Specific heat |
| kcell | Intra-cell thermal conductivity |
| qin | Heat input from the heater |
| qreac | Heat of thermal decomposition reaction |
| qht | Convective heat transfer |
| qrad | Radiative heat transfer |
| c | Unreacted fraction |
| k0 | Rate coefficient (Thermal decomposition reactions parameter) |
| Q | Latent heat of reaction (Thermal decomposition reactions parameter) |
| E | Activation energy (Thermal decomposition reactions parameter) |
| n | Constant (Thermal decomposition reactions parameter) |
| m | Constant (Thermal decomposition reactions parameter) |
| C0 | Constant (Thermal decomposition reactions parameter) |
| h | Heat transfer coefficient |
| kcontact | Thermal conductivity between cells |
| a | Specific surface area |
| Stefan–Boltzmann constant | |
| Ambient temperature | |
| Err | Error between the simulation temperature and the measured temperature |
| Tmax | Maximum temperature (objective variable) |
| tTR | Thermal runaway timing (objective variable) |
References
- Usai, L.; Lamb, J.J.; Hertwich, E.; Burheim, O.S.; Strømman, A.H. Analysis of the Li-Ion Battery Industry in Light of the Global Transition to Electric Passenger Light Duty Vehicles until 2050. Environ. Res. Infrastruct. Sustain. 2022, 2, 011002. [Google Scholar] [CrossRef]
- Tiede, B.; O’Meara, C.; Jansen, R. Battery Key Performance Projections Based on Historical Trends and Chemistries. In Proceedings of the 2022 IEEE Transportation Electrification Conference & Expo (ITEC), Anaheim, CA, USA, 15 June 2022; pp. 754–759. [Google Scholar]
- Rao, Z.; Lyu, P.; Du, P.; He, D.; Huo, Y.; Liu, C. Thermal Safety and Thermal Management of Batteries. Battery Energy 2022, 1, 20210019. [Google Scholar] [CrossRef]
- Klink, J.; Hebenbrock, A.; Grabow, J.; Orazov, N.; Nylén, U.; Benger, R.; Beck, H.-P. Comparison of Model-Based and Sensor-Based Detection of Thermal Runaway in Li-Ion Battery Modules for Automotive Application. Batteries 2022, 8, 34. [Google Scholar] [CrossRef]
- IEC 62133-2:2017. Available online: https://webstore.iec.ch/en/publication/32662 (accessed on 7 May 2025).
- Aalund, R.; Pecht, M. The Use of UL 1642 Impact Testing for Li-Ion Pouch Cells. IEEE Access 2019, 7, 176706–176711. [Google Scholar] [CrossRef]
- UN Manual of Tests and Criteria, Section 38.3. Available online: https://unece.org/transport/dangerous-goods/rev8-files (accessed on 1 May 2025).
- Wiriyasart, S.; Hommalee, C.; Sirikasemsuk, S.; Prurapark, R.; Naphon, P. Thermal Management System with Nanofluids for Electric Vehicle Battery Cooling Modules. Case Stud. Therm. Eng. 2020, 18, 100583. [Google Scholar] [CrossRef]
- Takagishi, Y.; Kitagawa, H.; Yamaue, T. Analytical Solution for Thermal Runaway of Li-Ion Battery with Simplified Thermal Decomposition Equation. Appl. Sci. 2025, 15, 6574. [Google Scholar] [CrossRef]
- Quan, T.; Xia, Q.; Wei, X.; Zhu, Y. Recent Development of Thermal Insulating Materials for Li-Ion Batteries. Energies 2024, 17, 4412. [Google Scholar] [CrossRef]
- Wang, G.; Ping, P.; Kong, D.; Peng, R.; He, X.; Zhang, Y.; Dai, X.; Wen, J. Advances and Challenges in Thermal Runaway Modeling of Lithium-Ion Batteries. Innovation 2024, 5, 100624. [Google Scholar] [CrossRef]
- Tran, M.-K.; Mevawalla, A.; Aziz, A.; Panchal, S.; Xie, Y.; Fowler, M. A Review of Lithium-Ion Battery Thermal Runaway Modeling and Diagnosis Approaches. Processes 2022, 10, 1192. [Google Scholar] [CrossRef]
- Melcher, A.; Ziebert, C.; Rohde, M.; Seifert, H. Modeling and Simulation of the Thermal Runaway Behavior of Cylindrical Li-Ion Cells—Computing of Critical Parameters. Energies 2016, 9, 292. [Google Scholar] [CrossRef]
- Hatchard, T.D.; MacNeil, D.D.; Basu, A.; Dahn, J.R. Thermal Model of Cylindrical and Prismatic Lithium-Ion Cells. J. Electrochem. Soc. 2001, 148, A755. [Google Scholar] [CrossRef]
- Takagishi, Y.; Tozuka, Y.; Yamanaka, T.; Yamaue, T. Heating Simulation of a Li-Ion Battery Cylindrical Cell and Module with Consideration of Gas Ejection. Energy Rep. 2022, 8, 3176–3188. [Google Scholar] [CrossRef]
- Kim, G.-H.; Pesaran, A.; Spotnitz, R. A Three-Dimensional Thermal Abuse Model for Lithium-Ion Cells. J. Power Sources 2007, 170, 476–489. [Google Scholar] [CrossRef]
- He, X.; Zhao, C.; Hu, Z.; Restuccia, F.; Richter, F.; Wang, Q.; Rein, G. Heat Transfer Effects on Accelerating Rate Calorimetry of the Thermal Runaway of Lithium-Ion Batteries. Process Saf. Environ. Prot. 2022, 162, 684–693. [Google Scholar] [CrossRef]
- Kong, D.; Wang, G.; Wen, J.X. Propensity of 21700 Cylindrical Cells to Thermal Runaway under Slight Overcharging Cycling—A Numerical Study. Process Saf. Environ. Prot. 2024, 190, 635–645. [Google Scholar] [CrossRef]
- Hamisi, C.M.; Chombo, P.V.; Laoonual, Y.; Wongwises, S. An Electrothermal Model to Predict Thermal Characteristics of Lithium-Ion Battery under Overcharge Condition. Energies 2022, 15, 2284. [Google Scholar] [CrossRef]
- Shelke, A.V.; Buston, J.E.H.; Gill, J.; Howard, D.; Abbott, K.C.; Goddard, S.L.; Read, E.; Howard, G.E.; Abaza, A.; Cooper, B.; et al. Characterizing and Predicting 21700 NMC Lithium-Ion Battery Thermal Runaway Induced by Nail Penetration. Appl. Therm. Eng. 2022, 209, 118278. [Google Scholar] [CrossRef]
- Yamanaka, T.; Takagishi, Y.; Tozuka, Y.; Yamaue, T. Modeling Lithium Ion Battery Nail Penetration Tests and Quantitative Evaluation of the Degree of Combustion Risk. J. Power Sources 2019, 416, 132–140. [Google Scholar] [CrossRef]
- Liu, B.; Yin, S.; Xu, J. Integrated Computation Model of Lithium-Ion Battery Subject to Nail Penetration. Appl. Energy 2016, 183, 278–289. [Google Scholar] [CrossRef]
- Wang, G.; Kong, D.; Ping, P.; Wen, J.; He, X.; Zhao, H.; He, X.; Peng, R.; Zhang, Y.; Dai, X. Revealing Particle Venting of Lithium-Ion Batteries during Thermal Runaway: A Multi-Scale Model toward Multiphase Process. eTransportation 2023, 16, 100237. [Google Scholar] [CrossRef]
- Kim, J.; Mallarapu, A.; Finegan, D.P.; Santhanagopalan, S. Modeling Cell Venting and Gas-Phase Reactions in 18650 Lithium Ion Batteries during Thermal Runaway. J. Power Sources 2021, 489, 229496. [Google Scholar] [CrossRef]
- Li, W.; León Quiroga, V.; Crompton, K.R.; Ostanek, J.K. High Resolution 3-D Simulations of Venting in 18650 Lithium-Ion Cells. Front. Energy Res. 2021, 9. [Google Scholar] [CrossRef]
- Rudtsch, S. Uncertainty of Heat Capacity Measurements with Differential Scanning Calorimeters. Thermochim. Acta 2002, 382, 17–25. [Google Scholar] [CrossRef]
- Wu, X.; Hu, Y.; Wu, T.; Zhuo, Z.; Qiu, H.; Zhu, Y.; Li, X.; Tang, R. Numerical Simulation Study of Thermal Runaway Jet Fire Characteristics of Forced Air-Cooled Cylindrical Battery Module. Case Stud. Therm. Eng. 2025, 66, 105750. [Google Scholar] [CrossRef]
- Tang, Z.; Song, A.; Wang, S.; Cheng, J.; Tao, C. Numerical Analysis of Heat Transfer Mechanism of Thermal Runaway Propagation for Cylindrical Lithium-Ion Cells in Battery Module. Energies 2020, 13, 1010. [Google Scholar] [CrossRef]
- Bilyaz, S.; Marr, K.C.; Ezekoye, O.A. Modeling of Thermal Runaway Propagation in a Pouch Cell Stack. Fire Technol. 2020, 56, 2441–2466. [Google Scholar] [CrossRef]
- Ye, Z.; Fu, X. Experimental and Simulation Investigation on Suppressing Thermal Runaway in Battery Pack. Sci. Rep. 2024, 14, 12723. [Google Scholar] [CrossRef]
- Hoelle, S.; Zimmermann, S.; Hinrichsen, O. 3D Thermal Simulation of Thermal Runaway Propagation in Lithium-Ion Battery Cell Stack: Review and Comparison of Modeling Approaches. J. Electrochem. Soc. 2023, 170, 060516. [Google Scholar] [CrossRef]
- Zhang, S.; Zhu, X.; Qiu, J.; Xu, C.; Wang, Y.; Feng, X. Modeling and Simulation of a Gas-Exhaust Design for Battery Thermal Runaway Propagation in a LiFePO4 Module. Batteries 2024, 10, 176. [Google Scholar] [CrossRef]
- Feng, X.; Zhang, F.; Feng, J.; Jin, C.; Wang, H.; Xu, C.; Ouyang, M. Propagation Dynamics of the Thermal Runaway Front in Large-Scale Lithium-Ion Batteries: Theoretical and Experiment Validation. Int. J. Heat Mass Transf. 2024, 225, 125393. [Google Scholar] [CrossRef]
- Zhang, W.; Yuan, J.; Huan, J.; Xie, Y. Uncertainty assessment method for thermal runaway propagation of ithium-ion battery pack. Appl. Therm. Eng. 2024, 238, 121946. [Google Scholar] [CrossRef]
- Saeki, K.; Nishiuchi, M.; Yamanaka, T.; Kitagawa, H.; Hori, Y. Development of a prediction technique for thermal propagation of Li-ion battery modules(2C04). In Proceedings of the 64th Battery Symposium, Osaka, Japan, 29 November 2023. [Google Scholar]
- Available online: https://www.comsol.com/ (accessed on 1 April 2025).
- Available online: https://www.smartuq.com/ (accessed on 1 April 2025).
- Koenig, B.C.; Zhao, P.; Deng, S. Accommodating physical reaction schemes in DSC cathode thermal stability analysis using chemical reaction neural networks. J. Power Sources 2023, 581, 233443. [Google Scholar] [CrossRef]
- Kondo, H.; Baba, N.; Makimura, Y.; Itou, Y.; Kobayashi, T. Model validation and simulation study on the thermal abuse behavior of LiNi0.8Co0.15Al0.05O2-based batteries. J. Power Sources 2020, 448, 227464. [Google Scholar] [CrossRef]
- Shurtz, R.C.; Engerer, J.D.; Hewson, J.C. Predicting high-temperature decomposition of lithiated graphite: Part I. Review of phenomena and a comprehensive model. J. Electrochem. Soc. 2018, 165, A3878. [Google Scholar] [CrossRef]
- Zhang, P.; Chen, H.; Yang, K.; Lu, Y.; Huang, Y. Accelerated Computational Strategies for Multi-Scale Thermal Runaway Prediction Models in Li-Ion Battery. Energy 2024, 305, 132371. [Google Scholar] [CrossRef]
- Peng, R.; Kong, D.; Ping, P.; Wang, G.; Gao, X.; Lv, H.; Zhao, H.; He, X.; Zhang, Y.; Dai, X. Thermal Runaway Modeling of Lithium-Ion Batteries at Different Scales: Recent Advances and Perspectives. Energy Storage Mater. 2024, 69, 103417. [Google Scholar] [CrossRef]
- Zhang, P.; Lu, J.; Yang, K.; Chen, H.; Huang, Y. A 3D Simulation Model of Thermal Runaway in Li-Ion Batteries Coupled Particles Ejection and Jet Flow. J. Power Sources 2023, 580, 233357. [Google Scholar] [CrossRef]
- Liu, Y.; He, C.; Offer, G.; Wang, H.; Huang, X.; Zhao, T. Modelling Thermal Runaway of Cylindrical Battery under Sub-Atmospheric Pressure. J. Power Sources 2025, 633, 236363. [Google Scholar] [CrossRef]
- Takagishi, Y.; Yamaue, T. Mathematical Modeling of Multiple-Li-Dendrite Growth in Li-ion Battery Electrodes. J. Electrochem. Soc. 2023, 170, 030528. [Google Scholar] [CrossRef]
- Karmakar, A.; Zhou, H.; Vishnugopi, B.S.; Jeevarajan, J.A.; Mukherjee, P.P. State-of-Charge Implications of Thermal Runaway in Li-ion Cells and Modules. J. Electrochem. Soc. 2024, 171, 010529. [Google Scholar] [CrossRef]


Disclaimer/Publisher’s Note: The statements, opinions and data contained in all publications are solely those of the individual author(s) and contributor(s) and not of MDPI and/or the editor(s). MDPI and/or the editor(s) disclaim responsibility for any injury to people or property resulting from any ideas, methods, instructions or products referred to in the content. |
© 2025 by the authors. Licensee MDPI, Basel, Switzerland. This article is an open access article distributed under the terms and conditions of the Creative Commons Attribution (CC BY) license (https://creativecommons.org/licenses/by/4.0/).