Article

Implementation of the Circular Economy Concept in Greenhouse Hydroponics for Ultimate Use of Water and Nutrients

1
Department of Agriculture Crop Production and Rural Environment, University of Thessaly, Fytokou Str., 38446 Volos, Greece
2
Hochschule Weihenstephan-Triesdorf, University of Applied Sciences, Faculty of Horticulture and Food Technology, Am Staudengarten 14, 85354 Freising, Germany
*
Author to whom correspondence should be addressed.
Horticulturae 2020, 6(4), 83; https://doi.org/10.3390/horticulturae6040083
Submission received: 7 October 2020 / Revised: 8 November 2020 / Accepted: 11 November 2020 / Published: 13 November 2020

Abstract

:
The circular economy in agriculture aims to reduce waste while also making best use of residues by using economically viable processes and procedures to increase their value. In this study a two-level cascade cultivation system was set up under greenhouse conditions. The research was focused on the identification of crop species as secondary crops and the development/iterative optimization of cultivation practices. For this purpose, different crop-combinations with a primary and different secondary crops were investigated using different system-layouts. Measurements were carried out during two cultivation periods. During the 1st Period a combination of cucumber (Cucumis sativus) as primary crop, with rosemary (Rosmarinus officinalis), basil (Ocimum basilicum), and peppermint (Mentha piperita) as secondary crops, was evaluated. In the 2nd Period the drainage of tomato (Solanum lycopersicum) plants was re-used to irrigate spearmint (Mentha spicata), dill (Anethum graveolens), celery (Apium graveolens) and parsley (Petroselinum crispum) plants. In both periods, different fertigation management strategies based on the drainage solution of the primary crop were employed. The use of the cascade hydroponic system improved both crop water and nutrient use efficiency. Notably, the NO3 disposal was about 40% less as compared to a monoculture. Average fresh water consumption of secondary crop plants irrigated with diluted drainage solution was reduced by 30% in comparison to plants irrigated with fresh water.

1. Introduction

The challenges to feeding the world in 2050 are becoming greater and more clear. This entails the need to produce more with less resource inputs (most of them under scarcity), higher resource efficiency, minimum effects on the environment and with higher sustainability. Therefore, the need to increase the circularity of production systems is highly significant for their sustainability [1].
Within the agricultural realm, the circular economy approach suggests that the crop production industry can achieve greater sustainability simply by keeping more resources and materials in use for as long as possible [2,3]. A circular economy system is comprised of 4R components; that is, reducing, alternatively reusing, recycling, and recovering materials in production/distribution and consumption processes. The idea of a circular economy is a response to the foreseen depletion of raw materials and the increase in CO2 emissions, which will eventually lead to global shortages and irreversible tipping points in natural ecosystems [4]. Such a radical system entails a major transformation of current production and consumption patterns in agriculture, which in turn will have a significant impact on the economy, the environment and society.
Protected cultivation (the process of growing crops in a controlled environment), especially soilless (growing a crop without soil) crops, are very resource-intensive [5] and may be considered circular since plants can grow in closed systems where water and nutrients are recirculated. High-tech and sophisticated greenhouse systems (mainly in Central and Northern Europe) can obtain a relatively high degree of circularity for inputs such as water and nutrients. In these greenhouses, the crop is usually grown soilless and the drainage solution is recycled [6]. Reuse of this drainage solution is associated with the risk of pathogen propagation throughout the fertigation-system and increased salt accumulation in the root zone. To overcome these problems, producers may periodically permit salty leaching by discharging the used nutrient solution [7]. It is necessary, nevertheless, to point out a more sustainable solution from an environmental point of view, since discharging used nutrient solution pollutes the environment and sometimes even results in lower soil and underground water quality. Another strategy to address this problem with a circular economy approach is to re-use drainages for cultivating secondary and more economically valuable crops, which can have a high salt tolerance and the ability to accumulate sodium [8,9,10]. This sequential reuse or the blending of the drainage could be a useful tool to reuse the water in crop production, especially in dry areas.
Reusing drainages for cultivating secondary and salt-tolerant crops could be a useful tool in low-tech greenhouses as well. The pollution risk in those systems seems quite essential (mainly in the Southern Europe and the Mediterranean region) where soilless growing systems are usually open [5]. The practice of discharging used nutrient solutions as waste water entails severe environmental problems and is a waste of water and fertilizers [11]. However, in such systems, a multi-culture cultivation approach may be applied in which the fertigation solution drained from a “primary” crop—which would be single crop in a traditional monoculture system—is directly used for the fertigation of a secondary and a tertiary crop. Thus, the quantities of waste water and fertilizers would be considerably reduced. Additionally, compared to monoculture, protected cultivations in cascade systems are associated with higher yields per unit area, with similar product qualities, reducing the risk of production losses to a minimum at the same time. A cascade hydroponic (a soilless growing system in a substrate or in nutrient solution) system uses a demanding crop (a crop that needs accurate concentrations of nutrients such as tomato or cucumber) as the main (or primary) crop and a less demanding secondary crop (a short cycle crop that can efficiently grow at a wider range of concentrations of nutrients such as peppermint and basil). Finally, salt-tolerant vegetables such as glasswort (Salicornia L.) or sea aster (Tripolium pannonicum), which are high-value crops with a growing market share, can conclude this serial production system at the “downstream-end” as tertiary crops. In a cascade cropping system, salt-tolerant species would be cultivated with salt-enriched nutrient solutions flushed out from growing systems with less tolerant species [11].
Up to now, some interesting systems have been developed, mostly for open-field crops, such as the system developed in the San Joaquin Valley of California [12]. However, it is not so easy to manage the drainage solution in these systems since the solution drains directly into the underlying soil. García-Caparrós [9] studied a pilot cascade system in the facilities of the University of Almeria in Spain, in which the drainage solution of a melon cultivation was used to cover the needs of rosemary, with encouraging results.
The objective of this work was to study different management strategies of drainage reuse in different combinations of primary and secondary crops. The study aims to evaluate the water/nutrient use efficiency and water/nutrient consumption achieved in each of the systems in order to evaluate the impact on the environment and to optimize the fertilization strategy for cascade systems under greenhouse conditions.

2. Materials and Methods

2.1. Experimental Set Up

Α preliminary cascade cultivation system was built in an experimental polyethylene covered greenhouse (ground area of 160 m2), located at the University of Thessaly near Volos (latitude 39°44′, longitude 22°79′, altitude 85 m) on the coastal area of eastern Greece. The greenhouse was equipped with a single continuous roof vent and a fan heater. Air temperature and relative humidity were automatically controlled using a climate control computer (Argos Electronics, Athens, Greece). To test the cascade system and the effect of the efficiency of reusing the drainage solution (DS) for a secondary cultivation, a series of different crop-combinations and system-layouts were carried out from September to December (1st Period) and from March to April (2nd Period). In both periods, the primary crops were commercial and high-value vegetables such as tomato and cucumber while the secondary crops plants had shorter production cycles and a broader concentration range of nutrient demands were applied.
During the 1st Period, cucumber (Cucumis sativus cv. Long Krateros) was chosen as a primary crop and rosemary (Rosmarinus officinalis), basil (Ocimum basilicum) and peppermint (Mentha x piperita) were chosen as secondary crops. Two crop rows comprised of 13 containers (plastic bags with dimensions of 1 m in length and a volume of about 40 L, called herein slabs) filled with perlite, were used to cultivate the primary crop with 2 plants per slab. The primary crop was fertigated with fresh nutrient solution with set-points for electrical conductivity (EC) at 2.1 dS m−1 and pH 5.7. The nutrient solution was supplied via a drip irrigation system. The irrigation dose for each treatment was set to cover the 30% of leaching fraction. The nutrient solution supplied to the primary crop was a standard nutrient solution for cucumber grown in open hydroponic systems adapted to Mediterranean climatic conditions, with the following composition: 3.0 mM K+, 6.0 mM Ca2+, 2.0 mM Mg2+, 1.0 mM NH4+, 11.5 mM NO3, 1.5 mM H2PO4, 3.5 mM SO42−.
For the secondary crop cultivation, 6 rows with 9 substrate slabs each were used. To achieve a randomized block design in the secondary cultivation, in each of the 6 lines, 9 plants of each species were cultivated (3 plants per slab; 27 plants per line). In total, three fertigation treatments were applied in two replications, in which the secondary crop plants where supplied with: (i) standard fresh nutrient solution (FS, the same one applied to the primary crop), comprising the control treatment (0%D+FS), (ii) nutrient solution obtained by mixing the drainage solution of the primary crop and FS at a ratio of 25/75 (25%D+FS) and (iii) nutrient solution obtained by diluting the drainage solution of the primary crop with water (W) at a ratio of 40/60 (40%D+W). The pH of the nutrient solution was adjusted using nitric acid. The fertigation treatments were applied one day after transplanting (DAT) of the secondary crops and the experimental period lasted 81 days.
During the 2nd Period, tomato plants (Solanum lycopersicum cv. Elpida) were chosen as the primary crop and spearmint (Mentha spicata), celery (Apium graveolens), dill (Anethum graveolens) and parsley (Petroselinum crispum) as secondary crops. The set-points for EC and pH were 2.0 dS m−1 and 5.7, respectively, while the leaching fraction for the irrigation dose was setting up in 30% as well.
The layout used during the 2nd Period for the secondary crops was the same as for the 1st Period. Three fertigation treatments were applied: (i) fresh nutrient solution (FS) comprising the control treatment (0%D+FS), (ii) nutrient solution obtained by mixing the drainage solution of the primary crop and FS at a ratio of 10/90 (10%D+FS) and (iii) nutrient solution obtained by diluting the drainage solution of the primary crop with water at a ratio of 15/85 (15%D+W). The fertigation treatments were applied 1 day after transplanting of the secondary crops and the experimental period lasted 57 days.
Both primary and secondary crops were grown under natural light conditions. The treatments started when the primary crop plants had about 10 leaves each, were about 1 m in height and had a leaf area index of about 0.8, in both periods.

2.2. Measurements

Air temperature (T, in °C) and relative humidity (RH, in %) were measured using a temperature-humidity sensor (model HD9008TR, Delta Ohm, Italy) calibrated before the experimental period, placed 1.8 m above ground level. Irradiance (Rg, i, in W m−2) inside the greenhouse was recorded using a solar pyranometer (model SKS 1110, Skye instruments, Powys, UK) located 1.8 m above ground.
The electrical conductivity (dS m−1) and pH of the irrigation solution (IS) of both primary and secondary crops was measured automatically using EC (DK 5689, Greisinger, Regenstauf, Germany) and pH (GHM-Greisinger, Regenstauf, Germany) sensors. The EC and pH values of the DS were recorded manually twice a week using a portable sensor (Combo, Hanna Instruments, Woonsocket, RI, USA). The volume of the DS drained from the primary and secondary crops was also measured. Samples of the IS and DS were collected and nitrate, K, Ca, Na, Mg and Mn contents were measured. Extraction was performed using the Kjeldahl Nitrogen method (TKN) based on Kjeldahl (1883) protocol [13]. Nutrient elements were determined by ICP (ICP-OES, SPECTRO Analytical Instruments GmbH, Kleve, Germany).
Plant height and the number of stems of the secondary crops were recorded from 18 plants per crop and treatment. The plant leaf chlorophyll content was measured twice during the growing season of the 2nd Period, using non-destructive sensing by means of an Opti-Science sensor performing measurements in contact with the leaf (CCM 200, Opti-Science, Hudson, NH, USA). In total, 20 measurements were taken at young and fully developed leaves per plant of secondary crop and treatment at DAT 28 and 56. The CCM 200 m records relative measurements of chlorophyll content index (CCI).
Additionally, in order to estimate the fresh (FM) and dry matter (DM) of the crops, two destructive-samplings were performed in the middle and at the end of each cultivation period (i.e., during the 1st Period, the destructive-sampling was performed at DAT 43 and 80, while during the 2nd Period, the destructive-sampling was performed at DAT 28 and 56). On each sampling date, three plants per secondary crop, replicate and treatment [number of samples (n) = 6 per treatment] were dried in a forced-air oven for 72 h at 70 °C.

2.3. Calculations

The total amount of nutrient solution irrigated to and drained from the crops during the entire cultivation period was estimated for each crop and treatment studied. In addition, the needs for additional (not drained) water of each secondary crop were also estimated.
The absorption concentration of several elements was calculated based on the model described in Katsoulas et al. (2015) [14].
The water use efficiency (WUE) was estimated by dividing the biomass produced by the volume of the water applied. If we consider the cascade cropping system (primary and secondary crop) as one system and that the drainage solution collected from the primary crop is not a new resource input in the secondary crop, then, in order to estimate the WUE of the secondary crops, only the fresh water needs could be considered. Thus, the WUE of the secondary crops was calculated taking into account the FM or DM produced and the additional (fresh) water needs for each species.

2.4. Statistical Analysis

Comparison of means was performed by applying one-way ANOVA at a confidence level of 95% (p ≤ 0.05) using SPSS (Statistical Package for the Social Sciences, IBM, Armonk, NY, USA) [15]. The mean values along with the standard deviation (±SD) of the parameters measured are reported.

3. Results

The mean values of air temperature inside the experimental greenhouse during the 1st Period of measurements were 15 ± 0.9 °C and 11 ± 2.1 °C, for day and night-time periods, respectively, with small variations around these values. In 2nd Period, the mean value of air temperature for day was 17 ± 1.1 °C and for night-time was 11 ± 1.9 °C. In addition, the mean values of air relative humidity were 59 ± 6.5% and 48 ± 5.9% during the day, and 68 ± 4.5% and 56 ± 4.8% during the night, for 1st and 2nd Periods respectively.

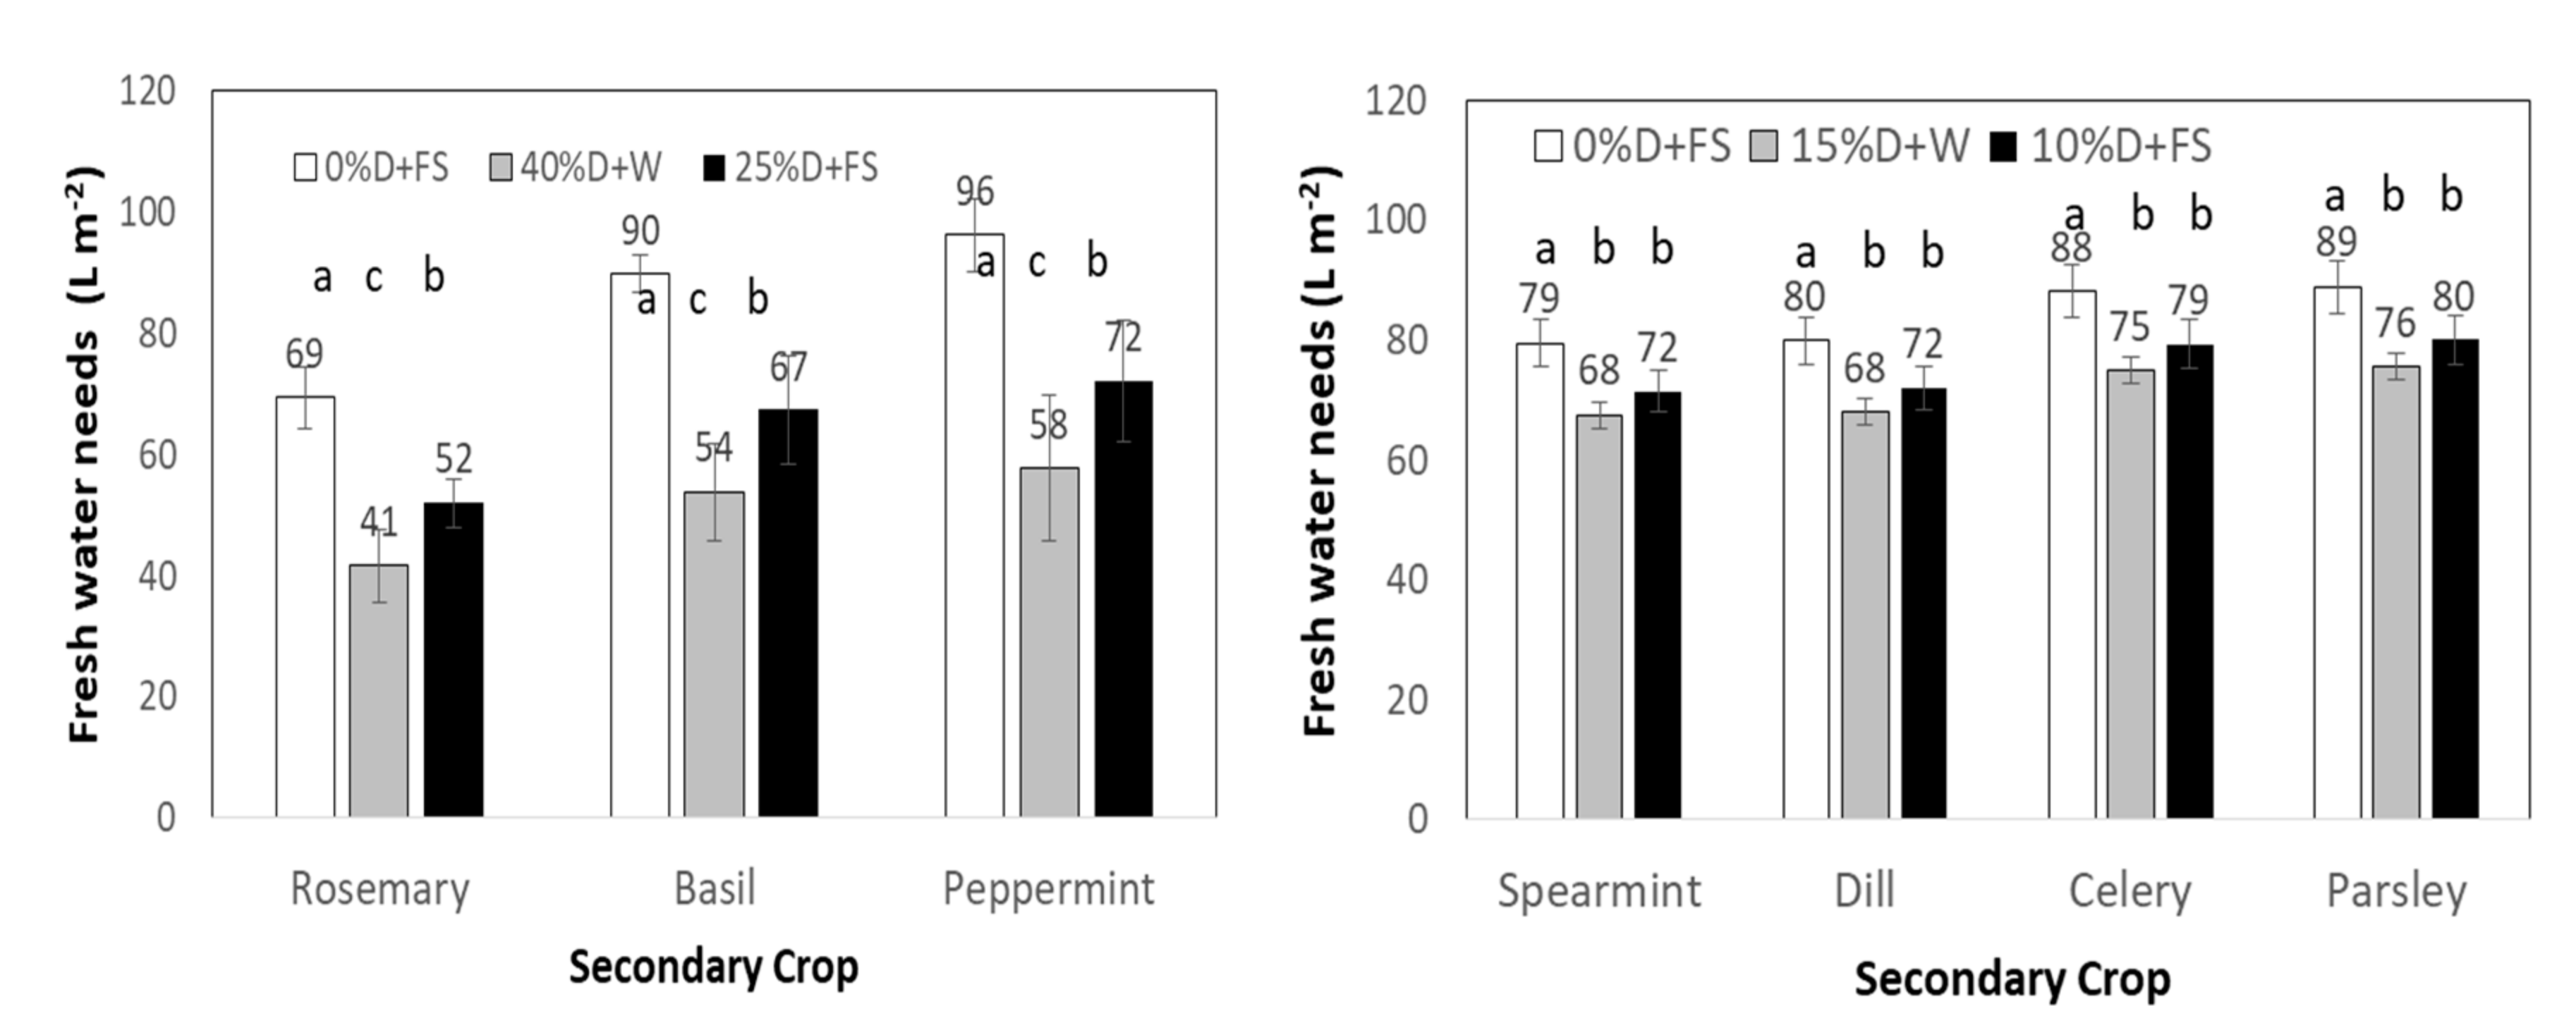
3.1. Water Consumption

Table 1 presents the total volume of the nutrient solution (NS) irrigated to the primary and secondary crops and of the NS absorbed by the plants according to the fertigation treatment. The table presents the volumes measured up to DAT 56 for both periods and up to DAT 80 for the 1st Period (the measurements of the 2nd Period ended at DAT 56). The total amount of NS applied to the primary crop during the 1st and 2nd Period was 83 L p−1 (cucumber) and 49 L p−1 (tomato), respectively. The drainage rate obtained in the above periods was 43% and 27%, respectively.
The needs for fresh water in the control and the different treatments are presented in Figure 1.

3.2. Nutrient Solution Analysis

The target EC value of the IS applied to the primary crops was about 2.1 dS m−1, and the EC values observed at the drainage solution were on average about 25% higher than that value. The pH values observed in the drainage solution in both primary cultivations were on average 6.5 ± 0.3.
The concentrations of the main macronutrients of the irrigation and drainage solutions of the primary and secondary crops during the 1st Period are presented in Table 2. No data for the nutrient solution contents are available for the 2nd Period.
It can be seen that the drainage solution of the primary crop could potentially cover the nutrient needs of the secondary crop, without dilution. From the treatments applied, it seems that the 25%D+FS treatment had nutrient concentrations close to that of the target solution while the 40%D+W treatment appeared to be extremely diluted (Table 2). The average EC values observed in IS of the secondary crops were 2.1 ± 0.6 dS m−1, 2.2 ± 0.4 dS m−1 and 1.7 ± 0.5 dS m−1, for the control, the 25%D+FS and the 40%D+W treatments, respectively. The average EC values observed in drainage solution of the secondary crops were about 2.8 ± 0.3 dS m−1, 2.5 ± 0.2 dS m−1 and 1.8 ± 0.4 dS m−1, for the control, the 25%D+FS and the 40%D+W treatments, respectively. A higher nutrient absorption rate was observed under the 25%D+FS treatment in all the secondary crops studied.

3.3. Yield

3.3.1. Secondary Crop Yield: 1st Period

The evolution of the secondary crop plant height during the 1st Period is presented in Figure 2. The final plant height was slightly higher than 20 cm for rosemary and peppermint plants and higher than 50 cm for basil plants. It was observed that the peppermint plants in the control treatment were 15 cm taller than the plants in 40%D+W and 25%D+FS treatment. No significant differences (p > 0.05) were observed between the plant height values observed in the basil plants under the different treatments. In rosemary, lower height values were observed in both the 40%D+W and 25%D+FS treatments. The plant height measurements in peppermint were stopped after DAT 29 since the plant height was stabilized although stem elongation continued but the stems developed horizontally.
Figure 3 presents the mean fresh (FM) and dry (DM) matter values of the biomass of the secondary crops observed at DAT 43 and 80 during the 1st Period. It can be seen that rosemary produced the highest FM under the 0%D+FS treatment (68 g m−2) while the FM in 25%D+FS and 40%D+W treatments was 36% and 60% lower than the control treatment, respectively. Similar reductions in the FM were also observed in the peppermint plants cultivated under the same treatments. In the case of basil plants, the FM values observed were similar under the 0%D+FS and 25%D+FS treatments while the values observed under the 40%D+W treatment were about 35% lower than the control ones.
No significant differences were observed between the basil crop DM values performed under the different treatments. Rosemary plants produced the highest DM under the control treatment while significantly lower values were observed under the 40%D+W and 25%D+FS. The DM values observed in the peppermint plants were similar under the control and 25%D+FS treatments, while the DM produced under the 40%D+W was about 35% lower than the control one.
The FM per DM ratio was 4.67, 3.51 and 4.79 in rosemary, 7.89, 5.89 and 5.66 in basil, and 8.95, 6.15 and 10.90 in peppermint crops for the 0%D+FS, 40%D+W and 25%D+FS treatments, respectively.

3.3.2. Secondary Crops Yield: 2nd Period

Table 3 presents the number of stems produced under the different treatments in the secondary crops during the 2nd Period. Concerning the spearmint crop, no significant differences were observed in the number of stems among the treatments (p > 0.05). On the other hand, the maximum number of stems for the dill crop was achieved with 0%D+FS and 10%D+FS treatments. The celery plants presented the highest number of stems in the 0%D+FS treatment and the lowest number in the 10%D+FS treatment (p < 0.05). The highest number of stems in parsley was produced under the 15%D+W treatment.
Table 4 presents the chlorophyll content expressed in CCI values at DAT 28 and at the end of the cultivation period. In the middle of the growing period, the chlorophyll content of all four species was higher, most pronounced in the control treatment. At the end of the growing season, however, the chlorophyll content in spearmint plants of 15%D+W increased significantly and their values were 15% and 11% higher than the content in the control and 10% D+FS treatment (p < 0.05). In addition, dill plants grown with drainage mixed with fresh solution (10%D+FS) gave high CCI values equal to the control treatment (p < 0.05). The other species, celery and parsley, kept higher CCI values in the control treatment. However, the 15%D+W treatment obtained plants with quite high values of chlorophyll content.
Table 5 presents the fresh and dry matter expressed in g m−2 of the secondary crops during the 2nd Period. At the middle of the growing season, spearmint produced the highest fresh and dry mass under the 0%D+FS and 10%D+FS treatments. However, at DAT 56 spearmint plants presented the highest FM and DM production under the 15%D+W treatment. Actually, the values increased from 159 g m−2 FM and 70 g m−2 DM to 550 g m−2 FM and 184 g m−2 DM, respectively. Similar progress was noted for dill plants. Celery and parsley on the other hand presented a different response. Celery had the highest FM and DM under the 15%D+W treatment at DAT 28 while at DAT 56 the highest FM was observed under the 15%D+W treatment and the highest DM under the 0%D+FS (control) treatment. Similar results were observed for parsley. The FM per DM ratio was 2.52, 3.00 and 3.24 in spearmint, 3.49, 3.85 and 2.45 in celery crop, 4.99, 5.79 and 5.07 in dill crop, and 5.47, 4.56 and 5.27 in parsley for the 0%D+FS, 40%D+W and 25%D+FS treatments, respectively.

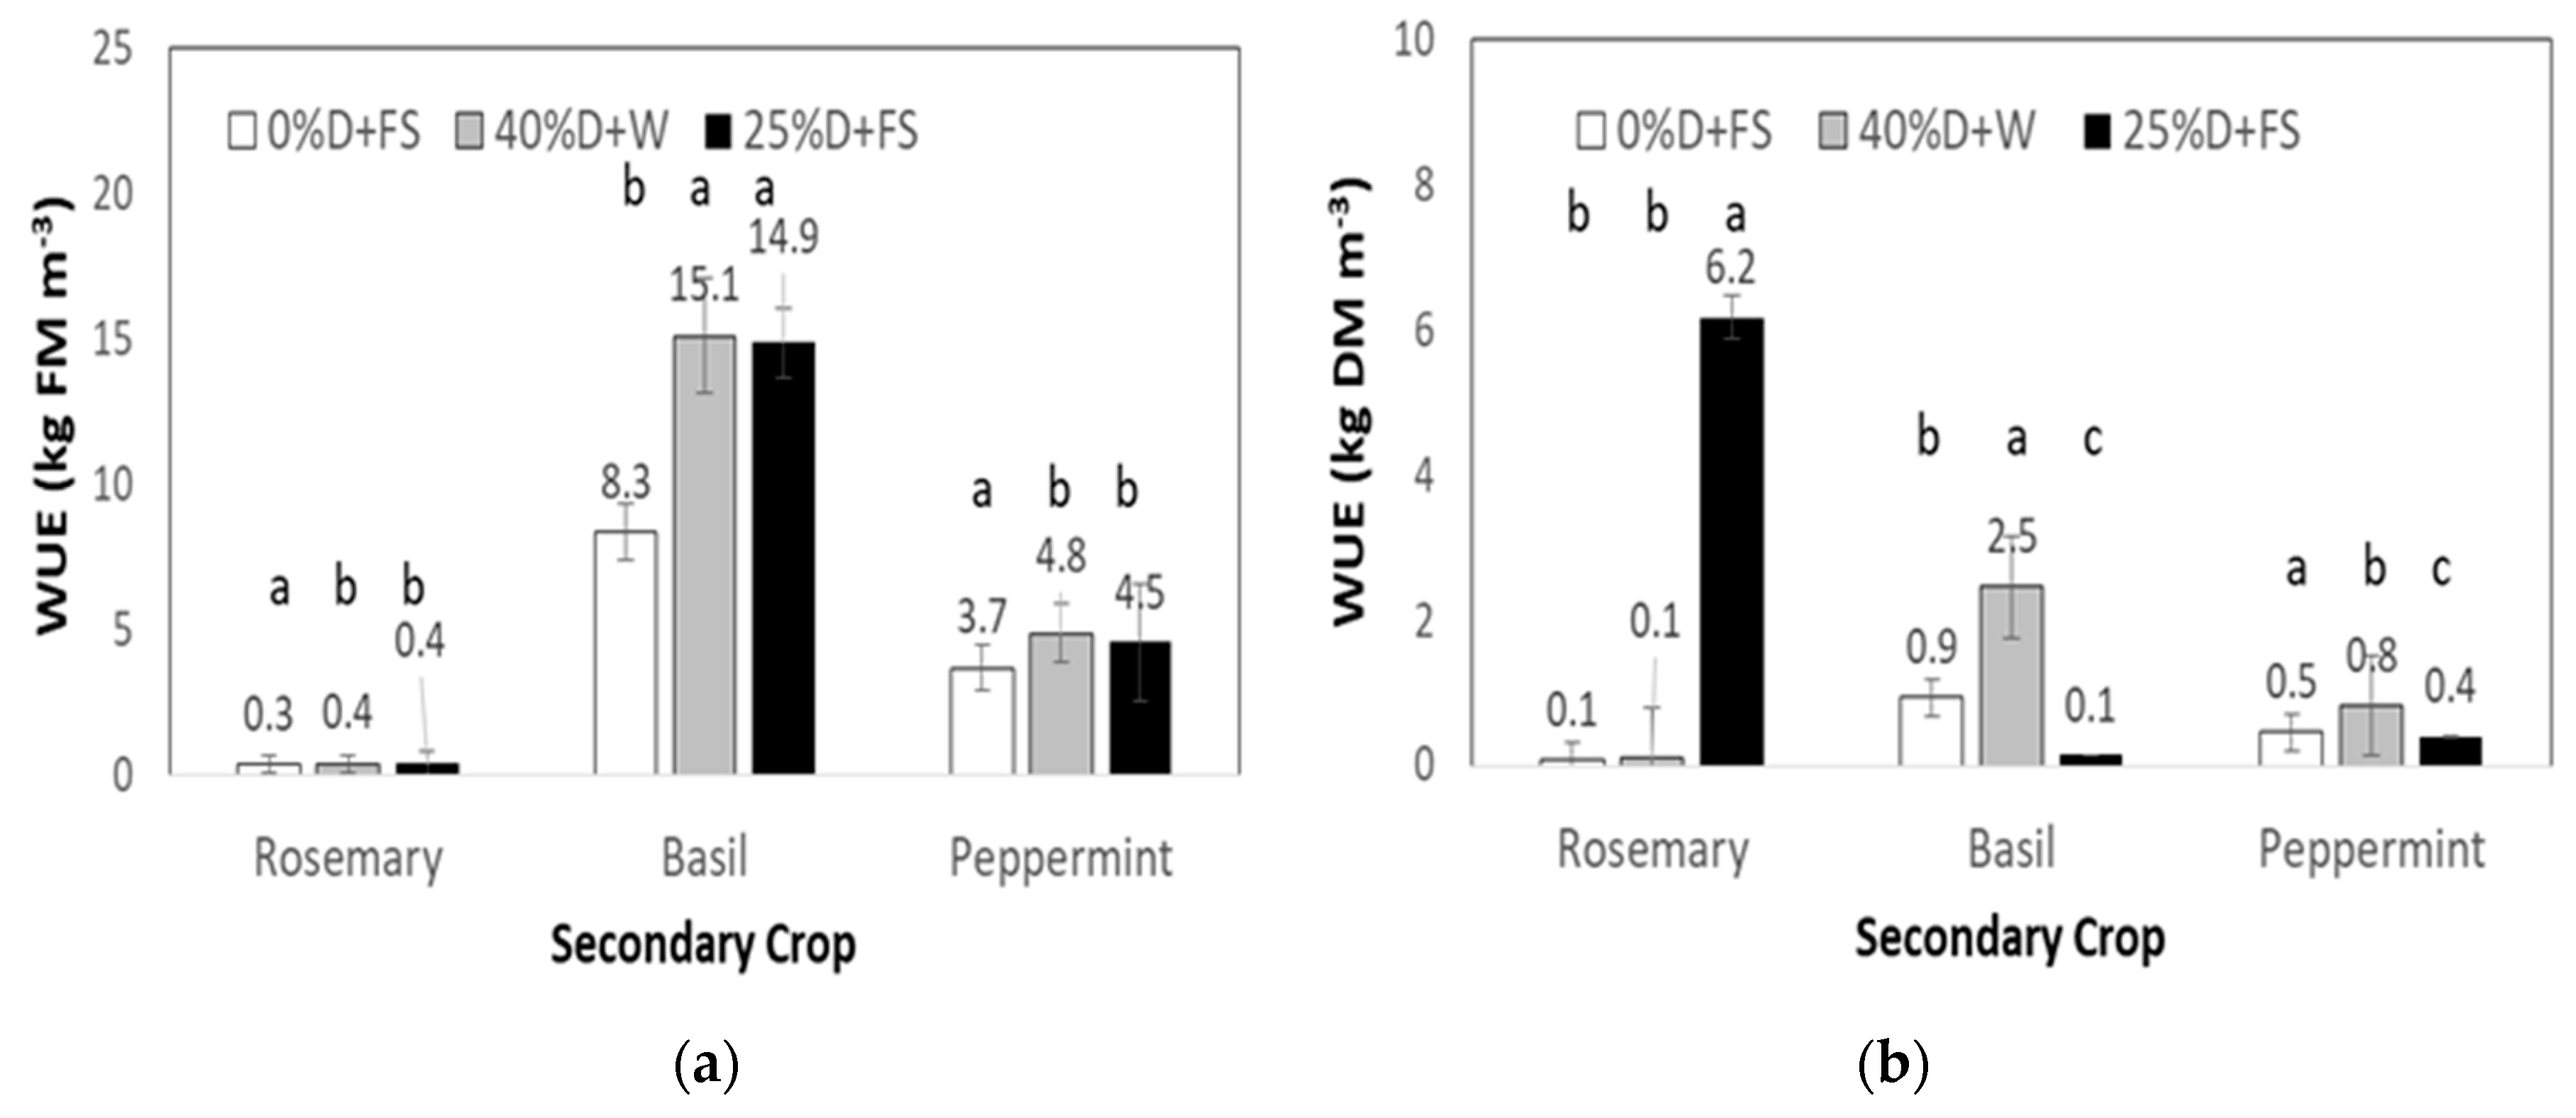
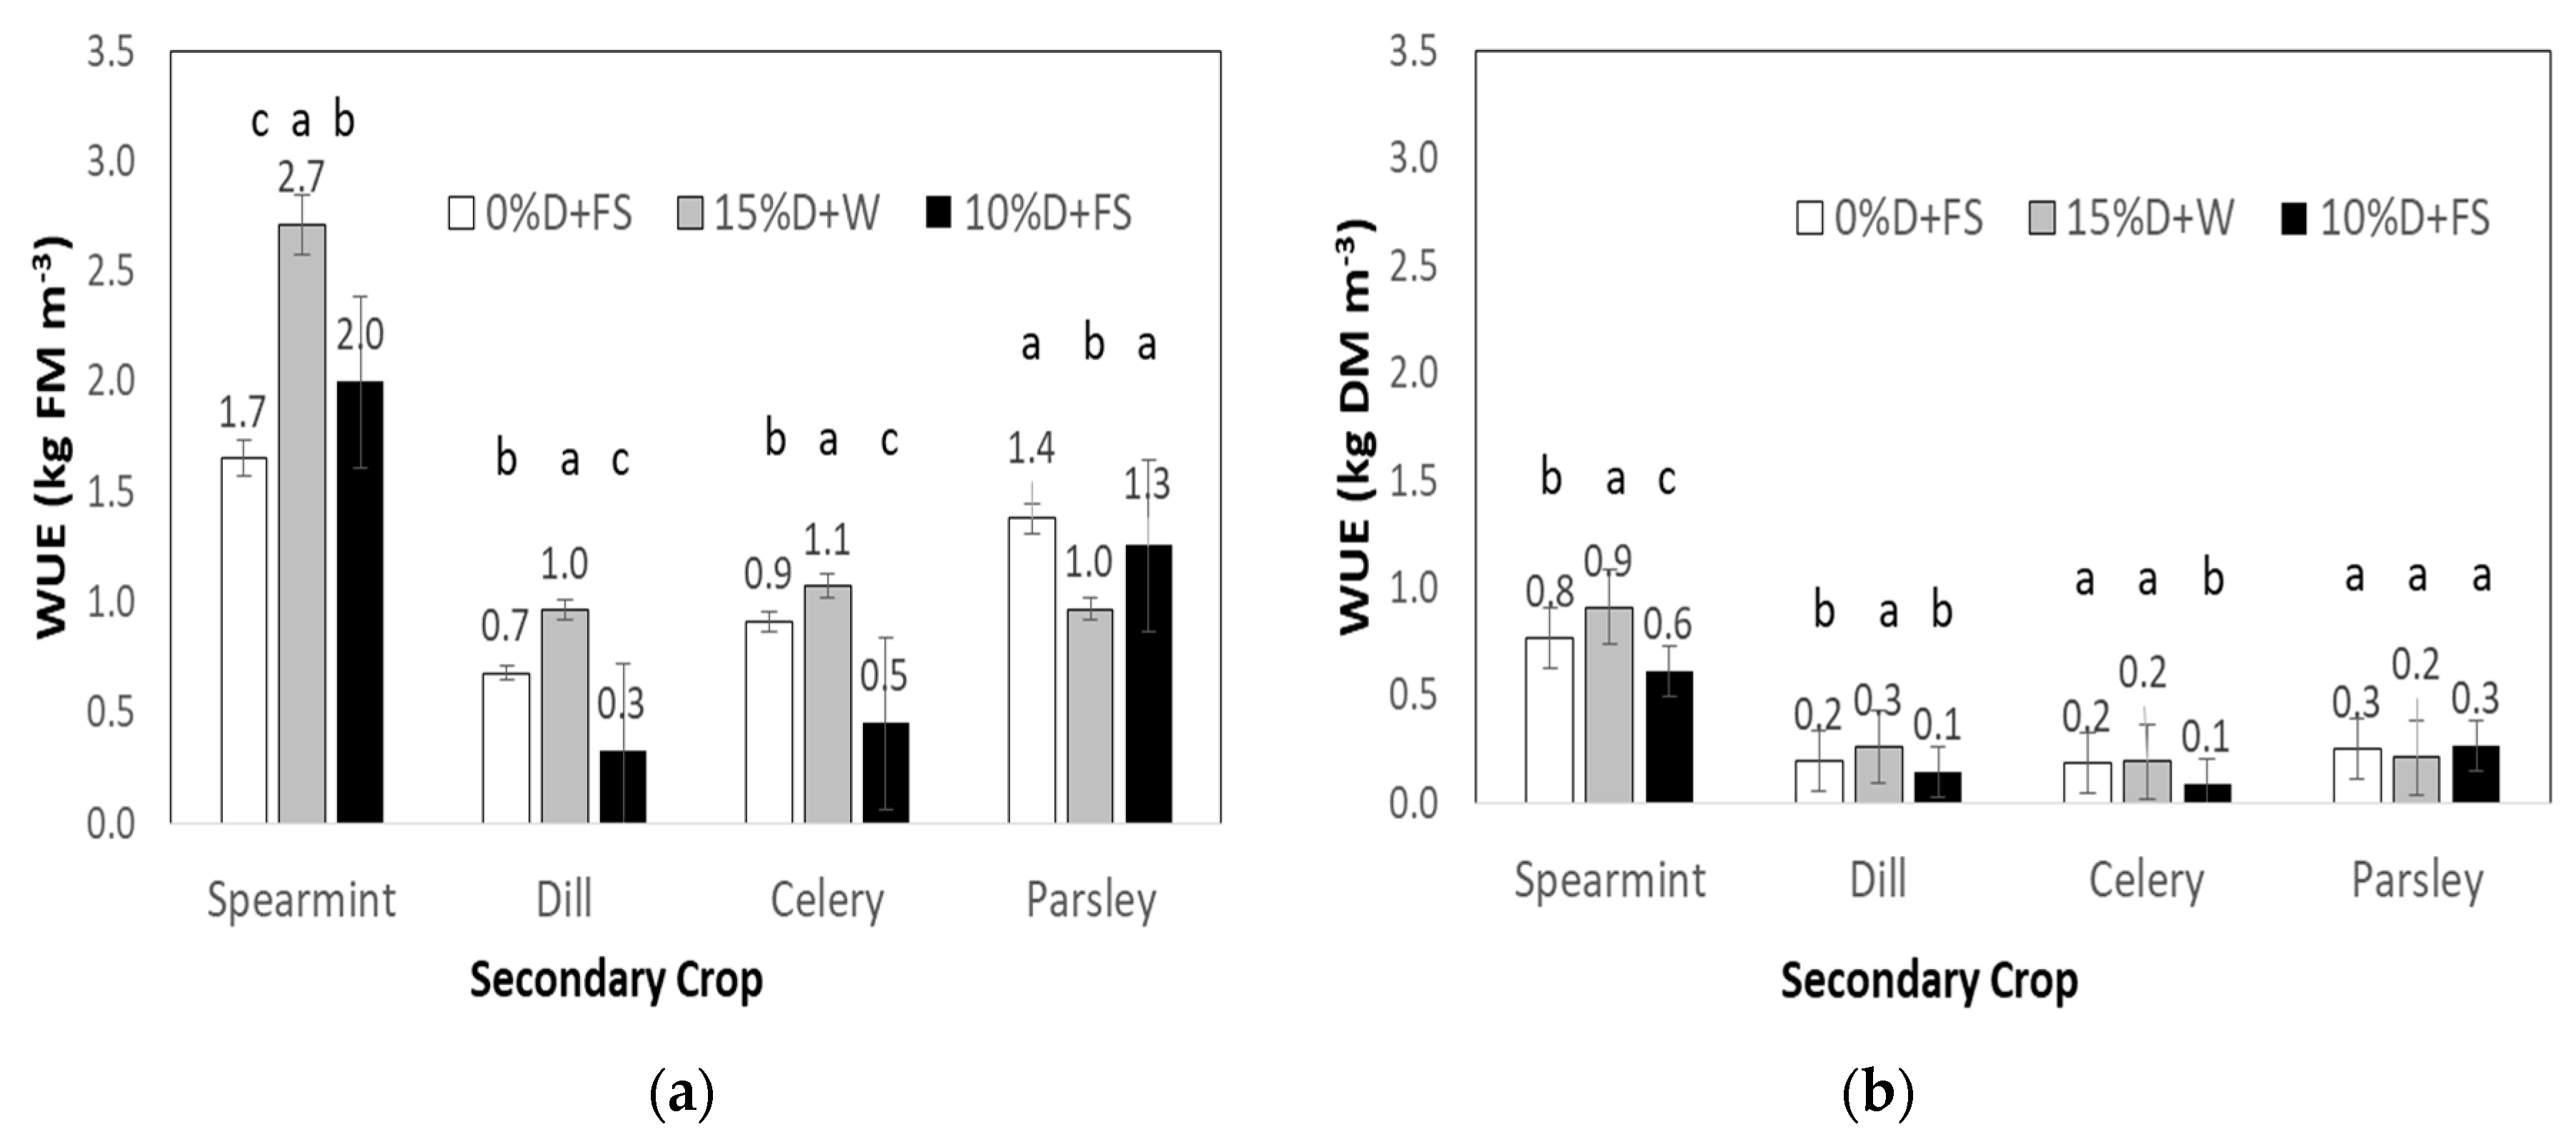
3.4. Water Use Efficiency

The WUE values estimated for the secondary crops of the 1st and 2nd Period are presented in Figure 4 and Figure 5, respectively. In the 1st Period, it was concluded that the maximum WUE based on FM production was achieved under the 0%D+FS treatment for rosemary and peppermint. The maximum WUE of basil, on the other hand, was achieved in 25%D+FS and 40%D+W treatment. A different trend was observed for the WUE values calculated based on DM. It was concluded that the maximum WUE values were with 0%D+FS for rosemary and basil and 40%D+W for peppermint.
During the 2nd Period, the higher WUE based on FM production was achieved with 15%D+W for spearmint, dill and celery, while in parsley it was achieved under the 0%D+FS treatment. A similar trend was observed in WUE values calculated based on DM of each secondary crop.

4. Discussion

4.1. Effect of Drainage Management on Secondary Crops Yield

The proper selection of crop-combinations and system-layouts is the key for the effective functioning of the cascade system. Considering the accumulation of salts in drained nutrient solutions, it is anticipated that secondary crops in such a system might need to be salt tolerant to a certain degree. However, the salt tolerance of each crop is quite different due to the complex interaction between the climatic and genetic factors [16]. Although rosemary is considered tolerant to low nutrient concentrations [15], there is little information about its physiological response to different EC levels. Moreover, according to [17], increasing the salinity level to 50 mM had no inhibitory effect on shoot and root fresh weight (FW) of rosemary but significant reduction in the shoot and root FM was found at a higher salinity level (100 mM NaCl). In the current study, relatively low levels of EC were applied in all the fertigation treatments. However, although the lower EC values may lead to lower FM and DM production, the resulting low FM/DM ratio of about 3.5 indicates that less water was stored in the biomass. It is therefore surprising that even in case of the rosemary plants irrigated with low nutrient concentration as it is noticed in the 40%D+W treatment, the final FM values (DAT 80) were higher than in cultivated in soil. Gharib et al. (2016) [18] found in soil cultivation, FM values equal to 25 g m−2, 90 days after transplanting.
Basil and peppermint plants are very promising candidates to be included in the cascade system, since they can accumulate up to 50% NaCl (DM basis) [19]. The composition and quantity of essential oil produced from those species, however, could be markedly affected by nutrient supply [20,21] and to a lesser extent also by salinity level. In fact, the Mn concentration controls various processes like enzymatic and non-enzymatic antioxidant activity, monoterpene biosynthesis and utilization of other mineral elements (Ca, Mg, Fe and P) in order to avoid oxidative stress [22].
The highest absorption rate of Mn was achieved under 25%D+FS treatments. According to the results, the peppermint plants supplied with high Mn concentrations presented lower FM/DM (5.6) ratios compared to the other treatments. However, peppermint plants in the current study presented similar FM values compared to field cultivation. Mahmoodabad et al. [23] reported a 941 g m−2 maximum and a minimum 570 g m−2 FM values under soil conditions. Celery and dill plants followed similar trends, although there is no significant reference noting the effect of Mn concentration in the root zone on DM production or FM/DM level. The high Mn concentration in the IS, on the other hand, did not affect DM production and their FM/DM ratio in the basil plants. In contrast, the lower FM/DM ratio (6.15) occurred in the treatment with lower Mn concentration in the IS (40%D+W treatment). According to [21], only Mn concentrations higher than 1 mg L−1 could influence the resulting FM/DM ratio and consequently the antioxidant and monoterpenes capacity in basil plants. The final FM (at DAT 80) values of basil plants in all three treatments were higher than those observed in an open field cultivation [24]. Saha et al. [24] reported a production of 600 g m−2 of a basil crop cultivated in soil under open field conditions, which is lower than the production observed in the case of the current study for the 40%D+W treatment. Similar observations were made for the parsley plants, in which the FM/DM in 40%D+W treatment was lower than in the other two treatments.

4.2. Water Use Efficiency

The two-level cascade cultivation system proved to be most efficient from an agronomic point of view, since the net water input was restricted and the WUE was significantly higher in some of the secondary crops studied, in comparison with the monoculture system. Particularly during the 1st Period, basil crop in the multi-culture system with the 25%D+FS treatment had a higher WUE in comparison with the monoculture system, while the FM yield was similar in both treatments. Concerning the DM yield production on the other hand, the basil plants showed an advantage with high WUE achieved in the 40%D+W treatment. In rosemary, no remarkable variation occurred in WUE of the multi-culture system based on the 25%D+FS treatment in comparison with the monoculture system, for half of the growing season, by producing the same amount of FM. A similar trend was also observed in comparing the multi-culture system of the same treatment and the monoculture system for DM production. There, although the WUE level was high, the amount and the synthesis of NS supplied to the plants was not enough to maximize FM or DM yield. Concerning the peppermint crop, in contrast to the multi-culture system at the 40%D+W treatment in which the drainage was diluted with water, the plants did not indicate any advantage over the 25%D+FS treatment in terms of WUE; however, the plants in the latter treatment provided higher production of both FM and DM.
Therefore, according to [19], the synthesis of the DS in the irrigation water used to prepare NS was crucial for yield in a closed hydroponic system, since it determines the rate and level of salinity build-up in the recycled NS and concomitantly in the root zone of the plants.
In the 2nd Period of the current study, the FM and DM yields were significantly lower for most of the crop species in the 10%D+FS treatment of the cascade system than in the monoculture system, although a high level of WUE was achieved. This result indicated that the current cascade system proved to be appreciably more efficient in terms of water and nutrient input utilization.

4.3. Nutrient Use Efficiency

According to the common terminology used in hydroponic systems, an open system is a system where the drainage is not reused, while a closed system is a system where the drainage is reused in the same crop. In relation to the drainage management method in the cascade system, if someone sees the primary or secondary cascade crops alone, it could consider that the hydroponic system is open and that the drainage is not reused. However, if we consider that the two crops are connected, and that potentially a tertiary crop could also fit at the end, then the system is considered as completely closed. Thus, a cascade, as a complete system, can be considered that has higher fertiliser use efficiency since it makes complete use of the drainage produced from the primary (and potentially the secondary) crop.
In the current study, the increased macronutrient level in the discharged DS of the tomato crop and the secondary crop of 0%D+FS treatment entailed higher nutrient concentrations than the corresponding inputs. It was found that N disposal was about 40% less than in monoculture system. The results are in agreement with a previous report [25] that mentioned that the nitrogen balance in a cascade system showed an important decrease in nutrient leachate. According to [25], the adoption of the cascade crop system reduced the environmental impact by 21%. Additionally, García-Caparrós et al. [9] concluded that the establishment of sequential irrigation systems resulted in saving of water and removal of nitrates, which is a great advantage in arid and semi-arid regions.

4.4. Implications to Circular Economy

The last research question formulated for the current study was how 4R circularity could be implemented in hydroponic farm production. As [26] stated, in order to move towards the circular economy concept, fundamental changes that run through the whole production process have to be carried out. Due to the complexity of the changes, the possible circular flow of resources should be examined/corrected into 5 phases—material supply, germination, propagation, maturation, harvest and distribution.
In terms of sourcing materials and maturation, the long-term aim of the proposed cascade system was to recirculate as much water and nutrient materials as possible. According to the results of the present study, it was concluded that the raw sources were minimized in the current system, by reusing the water and nutrients from the primary crop to the less demanding secondary crops.
Briefly, the proposed cultivation technique brings several benefits to the circular economy processes especially in terms of water consumption. Actually, compared to the monoculture system, the water savings achieved in the management strategies in which the drainage solution was diluted with water was between 11% and 30%. A crucial water saving was also achieved (between 7% and 15%) in the management strategy in which the drainage was mixed with fresh solution.
Considering the recycling of nutrients, the proposed cascade system fulfilled the criteria of a cascade reuse of system waste. Specifically, for the strategy of reusing drainage diluted with water, nutrient consumption decreased between 60% and 75%, while for the strategy of reusing drainage mixed with fresh solution the nutrient consumption decreased between 4% and 15%.

5. Conclusions

Implementation of the circular economy concept in greenhouse hydroponics for ultimate use of water and nutrients is crucial. The development of cascade hydroponic systems is the basis for redesigning cultivation strategies and converting greenhouse compartments to fully circular systems. The current study showed that the crop combinations studied proved to be effective in reducing the water and nutrient inputs. Additionally, the nutrient flow analysis performed in the current study has shown that cultivation strategies that enabled secondary crops, irrigated with drainage diluted with water or mixed with fresh solution, were able to decrease N disposal up to 40% compared to the monoculture system. Thus, the cascade system design offers several advantages both for the growers and the environment.

Author Contributions

Conceptualization, N.K. and J.F.J.M.; methodology, N.K. and A.E.; formal analysis, A.E. and E.G.; investigation, A.K., E.G. and C.M.B.R.; resources, N.K. and J.F.J.M.; data curation, A.E., A.K., E.G. and C.M.B.R.; writing—original draft preparation, A.E.; writing—review and editing, N.K. and J.F.J.M.; supervision, N.K.; project administration, N.K.; funding acquisition, N.K. and J.F.J.M. All authors have read and agreed to the published version of the manuscript.

Funding

This research has been co-financed by the European Union and Greek national funds through the National Action “Bilateral and Multilateral E&T Cooperation Greece-Germany” (project code: T2DGE-0893) and for the German action by the German Federal Ministry of Education and Research.

Conflicts of Interest

The authors declare no conflict of interest.

References

  1. Food and Agriculture Organization of the United Nations (FAO). The Future of Food and Agriculture-Alternative Pathways to 2050; FAOP: Rome, Italy, 2018; p. 224. [Google Scholar]
  2. Toop, T.A.; Ward, S.; Oldfield, T.; Hull, M.; Kirby, M.E.; Theodorou, M.K. AgroCycle-Developing a circular economy in agriculture. Energy Proc. 2017, 123, 76–80. [Google Scholar] [CrossRef]
  3. Duque-Acevedo, M.; Belmonte-Ureña, L.J.; Cortés-García, F.J.; Camacho-Ferre, F. Agricultural waste: Review of the evolution, approaches and perspectives on alternative uses. Glob. Ecol. Conserv. 2020, 22, e00902. [Google Scholar] [CrossRef]
  4. Verkerke, W. Circular Economy and Greenhouse Horticulture; Wageningen University & Research: Wageningen, The Netherlands, 2020. [Google Scholar]
  5. Katsoulas, N. EIP-AGRI Focus Group Circular Horticulture: Starting Paper. EIP-AGRI, 2017; p. 18. Available online: https://ec.europa.eu/eip/agriculture/en/publications/eip-agri-focus-group-circular-horticulture (accessed on 5 October 2020).
  6. Schulker, B.A.; Jackson, B.E.; Fonteno, W.C.; Heitman, J.L.; Albano, J.P. Comparison of water capture efficiency through two irrigation techniques of three common greenhouse soilless substrate components. Agronomy 2020, 10, 1389. [Google Scholar] [CrossRef]
  7. Varlagas, H.; Savvas, D.; Mouzakis, G.; Liotsos, C.; Karapanos, I.; Sigrimis, N. Modelling uptake of Na + and Cl-by tomato in closed-cycle cultivation systems as influenced by irrigation water salinity. Agric. Water Manag. 2010, 97, 1242–1250. [Google Scholar] [CrossRef]
  8. Kumar, R.R.; Cho, J.Y. Reuse of hydroponic waste solution. Environ. Sci. Pollut. Res. 2014, 21, 9569–9577. [Google Scholar] [CrossRef]
  9. García-Caparrós, P.; Chica, R.M.; Almansa, E.M.; Rull, A.; Rivas, L.A.; García-Buendía, A.; Barbero, F.J.; Lao, M.T. Comparisons of different lighting systems for horticultural seedling production aimed at energy saving. Sustainability 2018, 10, 3351. [Google Scholar] [CrossRef] [Green Version]
  10. Katsoulas, N.; Demmelbauer-Benitez, C.M.; Elvanidi, A.; Gourzoulidou, E.; Max, J.F.J. Reuse of cucumber drainage nutrient solution in secondary crops in greenhouses: Initial results. Acta Hortic. 2020. [Google Scholar]
  11. Salas, M.D.C.; Montero, J.L.; Diaz, J.G.; Berti, F.; Quintero, M.F.; Guzmán, M.; Orsini, F. Defining optimal strength of the nutrient solution for soilless cultivation of saffron in the Mediterranean. Agronomy 2020, 10, 1311. [Google Scholar] [CrossRef]
  12. Shannon, M.; Grieve, C. Tolerance of vegetable crops to salinity. Sci. Hortic. 1998, 78, 5–38. [Google Scholar] [CrossRef]
  13. Kjeldahl, J. A new method for the determination of nitrogen in organic matter. Z. Anal. Chem. 1883, 22, 366. [Google Scholar] [CrossRef] [Green Version]
  14. Katsoulas, N.; Savvas, D.; Kitta, E.; Bartzanas, T.; Kittas, C. Extension and evaluation of a model for automatic drainage solution management in tomato crops grown in semi-closed hydroponic systems. Comput. Electron. Agric. 2015, 113, 61–71. [Google Scholar] [CrossRef]
  15. IBM SPSS Statistics 21 Guide; IBM Corporation: Armonk, NY, USA, 2012.
  16. Trejo-Téllez, L.I.; Gómez-Merino, F.C. Nutrient solutions for hydroponic systems. In Hydroponics-A Standard Methodology for Plant Biological Researches; Asao, T., Ed.; InTech: Rijeka, Croatia, 2012; p. 12. [Google Scholar]
  17. Hejazi Mehrizi, M.; Shariatmadari, H.; Khoshgoftarmanesh, A.H.; Dehghani, F. Copper effects on growth, lipid peroxidation, and total phenolic content of rosemary leaves under salinity stress. J. Agric. Sci. Technol. 2012, 14, 205–212. [Google Scholar]
  18. Gharib, F.; Ghazi, S.; Aly, H.; El-Araby, M.; Moustafa, S. Effect of soil type and water content on rosemary growth and essential oil yield. Int. J. Sci. Eng. Res. 2016, 7, 183–189. [Google Scholar]
  19. Ushakova, S.; Kovaleva, N.; Gribovskaya, I.; Dolgushev, V.; Tikhomirova, N. Effect of NaCl concentration on productivity and mineral composition of Salicornia europaea as a potential crop for utilization NaCl in LSS. Adv. Space Res. 2005, 36, 1349–1353. [Google Scholar] [CrossRef]
  20. Flanigan, P.M.; Niemeyer, E.D. Effect of cultivar on phenolic levels, anthocyanin composition, and antioxidant properties in purple basil (Ocimum basilicum L.). Food Chem. 2014, 164, 518–526. [Google Scholar] [CrossRef]
  21. Faliagka, S.; Schmidt, L.; Lagner, F.; Elvanidi, A.; Papadopoulou, A.; Katsoulas, N.; Max, F.J. Effects of different glass covering materials on basil and mint quality. DGG-Proc. 2018, 8, 1–5. [Google Scholar] [CrossRef]
  22. Lei, Y.; Korpelainen, H.; Li, C. Physiological and biochemical responses to high Mn concentrations in two contrasting Populus cathayana populations. Chemosphere 2007, 68, 686–694. [Google Scholar] [CrossRef]
  23. Mahmoodabad, H.A.; Parchin, R.A.; Hokmalipoor, S.; Shaban, M. Changes in yield and growth of green Mint (Mentha spicata L.) Under foliar application of urea and soil application of vermicompost. Int. J. Adv. Biol. Biomed. Res. 2014, 2, 2072–2076. [Google Scholar]
  24. Saha, S.; Monroe, A.; Day, M.R. Growth, yield, plant quality and nutrition of basil (Ocimum basilicum L.) under soilless agricultural systems. Ann. Agric. Sci. 2016, 61, 181–186. [Google Scholar] [CrossRef]
  25. Muñoz, P.; Flores, J.; Antón, A.; Montero, J. Combination of greenhouse and open-field crop fertigation can increase sustainability of horticultural crops in the Mediterranean region. Acta Hortic. 2017, 627–634. [Google Scholar] [CrossRef]
  26. Ritzén, S.; Sandström, G.Ö. Barriers to the circular economy-Integration of perspectives and domains. Proc. CIRP 2017, 64, 7–12. [Google Scholar] [CrossRef]
Figure 1. Total needs of fresh water (L m−2) of the secondary crops during the (a) 1st and (b) 2nd Periods, respectively. The mean value is above each bar. Different letters within crops indicate statistically significant differences (p < 0.05).
Horticulturae 06 00083 g001
Figure 2. The mean height (cm) of the (a) rosemary, (b) basil and (c) peppermint during the 1st Period. The error bars represent the standard deviation of the means. Different letters within DAT indicate statistically significant differences (p < 0.05).
Horticulturae 06 00083 g002
Figure 3. Mean fresh and dry weight in g m−2 of secondary crops (a) rosemary, (b) basil and (c) peppermint 43 and 80 days after transplanting (DAT) during the 1st Period. The error bars represent the standard deviation of the means. Different letters within DAT indicate statistically significant differences (p < 0.05).
Horticulturae 06 00083 g003
Figure 4. Water use efficiency (WUE, kg m−3) based on (a) Fresh matter (FM) and (b) Dry matter (DM) of the secondary crops (Rosemary, Basil, Peppermint) studied during the 1st experimental period. Different letters above bars within a crop indicate statistically significant differences (p < 0.05).
Horticulturae 06 00083 g004
Figure 5. Water use efficiency (WUE, kg m−3) based on (a) Fresh matter (FM) and (b) Dry matter (DM) of the secondary crops (Spearmint, Dill, Celery, Parsley) studied during the 2nd experimental period. Different letters above bars within crops indicate statistically significant differences (p < 0.05).
Horticulturae 06 00083 g005
Table 1. Mean values (and standard deviation) of the total amount of NS supplied to the primary and secondary crops (IS) and of NS absorbed by the plants according to the substrate and the fertigation treatment in the 1st and 2nd Periods, respectively.
Sum L p−1
PeriodSolutionLevelCrop DAT56 DAT80
1st Period 0%D+FS40%D+W25%D+FS0%D+FS40%D+W25%D+FS
IrrigationPr.Cucumber55.58 ± 3.09 82.38 ± 4.07
AbsorptionPr.Cucumber31.29 ± 1.84 51.23 ± 2.02
IrrigationSec.Herbs43.01 ± 1.2132.04 ± 1.2546.95 ± 0.7859.79 ± 1.1249.47 ± 1.2261.64 ± 0.80
AbsorptionSec.Rosemary23.47 ± 0.7214.13 ± 0.4524.18 ± 0.7932.27 ± 0.6824.81 ± 0.4334.76 ± 0.78
AbsorptionSec.Basil19.69 ± 0.8518.66 ± 0.5030.14 ± 0.7929.93 ± 0.7428.49 ± 0.3241.02 ± 0.76
AbsorptionSec.Peppermint20.21 ± 0.9915.63 ± 0.4125.23 ± 0.9232.06 ± 0.8427.32 ± 0.4336.79 ± 0.88
2nd Period 0%D+FS15%D+W10%D+FS0%D+FS15%D+W10%D+FS
IrrigationPr.Tomato48.95 ± 0.12
AbsorptionPr.Tomato35.57 ± 0.63
IrrigationSec.Herbs45.76 ± 1.0538.21 ± 1.1245.53 ± 1.07
AbsorptionSec.Spearmint82.33 ± 0.9479.23 ± 0.9686.60 ± 0.93
AbsorptionSec.Dill72.31 ± 1.0578.82 ± 1.0680.13 ± 1.03
AbsorptionSec.Celery79.08 ± 0.2288.32 ± 0.2890.38 ± 0.26
AbsorptionSec.Parsley82.15 ± 0.4887.92 ± 0.7278.95 ± 1.21
Table 2. Mean values (and standard deviation) of elemental concentrations expressed in mmol L−1 in irrigation and drainage solutions for primary and secondary crops according to the fertigation treatment during the 1st Period.
IrrigationAbsorption Drainage
Primary cropCucumber Cucumber
Primary cropNO3 (mmol L−1)9.85 ± 2.918.24 ± 2.29 12.50 ± 2.25
K (mmol L−1)3.10 ± 2.092.67 ± 0.46 3.83 ± 1.88
Ca (mmol L−1)6.08 ± 0.905.52 ± 0.75 6.98 ± 1.36
Na (mmol L−1)1.79 ± 0.131.77 ± 0.13 1.83 ± 0.43
Mg (mmol L−1)2.14 ± 0.332.01 ± 0.27 2.34 ± 0.85
Mn (μmol L−1)0.36 ± 0.0010.36 ± 0.001 0.36 ± 0.001
IrrigationAbsorption Drainage
Secondary cropRosemaryBasilPeppermintRosemaryBasilPeppermint
0%D+FSNO3 (mmol L−1)9.85 ± 2.919.14 ± 1.986.88 ± 2.255.80 ± 1.8010.68 ± 2.8112.82 ± 2.2014.53 ± 2.54
K (mmol L−1)3.10 ± 2.093.03 ± 0.743.02 ± 0.822.57 ± 0.463.20 ± 0.633.18 ± 0.363.72 ± 0.88
Ca (mmol L−1)6.08 ± 0.903.43 ± 0.624.66 ± 0.654.27 ± 0.779.18 ± 0.547.49 ± 0.968.16 ± 1.13
Na (mmol L−1)1.81 ± 0.221.66 ± 0.361.48 ± 0.571.44 ± 0.841.98 ± 0.902.13 ± 0.542.23 ± 0.42
Mg (mmol L−1)2.40 ± 0.421.82 ± 0.292.29 ± 0.472.01 ± 0.653.07 ± 0.302.50 ± 0.242.85 ± 0.76
Mn (μmol L−1)0.36 ± 0.0010.36 ± 0.0010.36 ± 0.0010.34 ± 0.0010.37 ± 0.0010.36 ± 0.0010.40 ± 0.001
40%D+WNO3 (mmol L−1)5.06 ± 2.292.82 ± 2.013.33 ± 2.753.47 ± 2.336.46 ± 2.767.18 ± 2.916.27 ± 2.53
K (mmol L−1)1.53 ± 0.560.99 ± 0.811.32 ± 0.691.20 ± 0.711.77 ± 0.401.72 ± 0.771.69 ± 0.58
Ca (mmol L−1)4.32 ± 0.853.07 ± 0.953.67 ± 1.163.66 ± 1.434.66 ± 1.214.95 ± 1.814.35 ± 1.25
Na (mmol L−1)2.05 ± 0.282.01 ± 0.191.59 ± 0.471.72 ± 0.271.52 ± 0.022.58 ± 0.572.09 ± 0.26
Mg (mmol L−1)1.89 ± 0.531.87 ± 0.481.47 ± 0.311.36 ± 0.601.82 ± 0.132.37 ± 0.602.26 ± 0.25
Mn (μmol L−1)0.0093 ± 0.0010.0010 ± 0.0010.0012 ± 0.0010.0011 ± 0.0010.0364 ± 0.0010.0415 ± 0.0010.0478 ± 0.001
25%D+FSNO3 (mmol L−1)10.16 ± 2.1910.05 ± 2.1610.08 ± 2.0610.16 ± 2.1911.24 ± 1.6113.59 ± 2.7612.06 ± 2.71
K (mmol L−1)3.18 ± 1.573.16 ± 0.953.11 ± 0.552.94 ± 0.613.14 ± 0.533.10 ± 0.462.80 ± 0.81
Ca (mmol L−1)6.11 ± 0.876.10 ± 1.066.10 ± 1.326.06 ± 1.466.64 ± 0.968.25 ± 1.156.81 ± 1.84
Na (mmol L−1)1.43 ± 0.361.20 ± 0.081.42 ± 0.271.20 ± 0.151.84 ± 0.422.13 ± 0.122.00 ± 0.67
Mg (mmol L−1)2.32 ± 0.682.31 ± 0.732.26 ± 0.912.30 ± 0.852.18 ± 0.292.92 ± 0.802.26 ± 0.93
Mn (μmol L−1)0.35 ± 0.0010.35 ± 0.0010.35 ± 0.0010.35 ± 0.0010.47 ± 0.0010.38 ± 0.0010.42 ± 0.001
Table 3. Mean (and standard deviation) values of the number of stems of the secondary crops.
CropNumber of Stems-DAT 54
0%D+FS5%D+W10%D+FS
Spearmint34 ± 1.83 a z32 ± 2.55 a35 ± 2.25 a
Dill56 ± 9.58 a50 ± 8.48 b55 ± 6.41 a
Celery205 ± 36.18 a180 ± 28.79 b166 ± 42.93 c
Parsley29 ± 13.33 b34 ± 13.48 a30 ± 13.18 ab
z Different letters in a row indicate statistically significant differences (p < 0.05) between the treatments.
Table 4. Mean (and standard deviation) chlorophyll content values (CCI) measured in the secondary crops.
Crop0% D+FS15%D+W10%D+FS
DAT28
Spearmint45.41 ± 6.02 a z43.86 ± 5.83 a43.82 ± 7.56 a
Dill12.28 ± 9.15 a10.07 ± 7.33 b9.99 ± 6.83 b
Celery34.73 ± 10.08 c43.34 ± 9.47 a38.9 ± 9.96 b
Parsley49.96 ± 16.23 a34.73 ± 15.13 b33.92 ± 12.76 b
DAT56
Spearmint45.93 ± 3.21 b53.02 ± 7.50 a47.50 ± 7.38 b
Dill9.82 ± 4.46 a7.43 ± 3.93 b9.57 ± 6.94 a
Celery50.50 ± 2.49 a33.80 ± 9.52 b31.59 ± 10.74 b
Parsley48.52 ± 5.68 a41.84 ± 17.46 b35.77 ± 14.59 c
z Different letters within a row indicate statistically significant differences (p < 0.05).
Table 5. Mean (and standard deviation) fresh and dry matter in g m−2 of secondary crops 28 and 56 days after transplanting (DAT) during the 2nd Period.
CropFM (g m−2)DM (g m−2)
DAT28
0% D+FS15%D+W10%D+FS0%D+FS15%D+W10%D+FS
Spearmint172.33 ± 4.91 a z159.00 ± 5.52 b175.83 ± 5.55 a64.00 ± 0.09 a69.83 ± 0.12 a70.67 ± 0.16 a
Dill63.04 ± 7.42 a55.36 ± 5.38 c59.99 ± 3.7 b5.85 ± 0.09 a3.76 ± 0.20 a4.40 ± 0.09 a
Celery42.83 ± 6.76 b50.50 ± 4.28 a40.10 ± 4.59 b5.73 ± 0.07 b7.71 ± 0.14 a5.53 ± 0.06 b
Parsley17.15 ± 2.33 b27.78 ± 2.83 a18.57 ± 2.53 b2.82 ± 0.33 b3.30 ± 0.40 a2.90 ± 0.48 b
DAT56
0% D+FS15%D+W10%D+FS0%D+FS15%D+W10%D+FS
Spearmint463.17 ± 10.25 b549.83 ± 3.97 a428.38 ± 8.11 c182.67 ± 0.61 a184.00 ± 0.11 a131.67 ± 0.17 b
Dill162.65 ± 3.81 b196.58 ± 4.74 a70.98 ± 2.81 c46.67 ± 0.16 b53.32 ± 0.21 a30.62 ± 0.33 c
Celery230.00 ± 0.88 a239.29 ± 4.54 a106.95 ± 2.36 b48.26 ± 0.03 a42.97 ± 0.19 a21.47 ± 0.26 b
Parsley123.03 ± 3.00 a73.50 ± 2.16 c113.58 ± 2.95 b22.47 ± 0.32 a16.11 ± 0.22 b21.44 ± 0.19 a
z Different letters within a row for FM or for DM indicate statistically significant differences (p < 0.05).
Publisher’s Note: MDPI stays neutral with regard to jurisdictional claims in published maps and institutional affiliations.

