Abstract
Kiwifruit (Actinidia deliciosa) contributes >4 million tons to global fruit production annually and ranks among the highest dietary sources of vitamin C and bioactive polyphenols. Its quality is mainly influenced by the coordinated regulation of essential metabolites during fruit ripening. Although several important metabolites associated with fruit color, flavor, and nutrition have been elucidated, the dynamic changes and regulatory networks of ripening-associated metabolites remain largely unexplored. In this study, comprehensive metabolic dynamics of developing fruit of Actinidia deliciosa cv. Xuxiang (‘XX’) were investigated through a widely targeted metabolomic analysis. Three metabolites associated with hormone metabolism showed that differentially accumulated 12-oxo-phytodienoic acid (12-OPDA) and jasmonic acid (JA) were downregulated, while abscisic acid (ABA) was upregulated in XX9 vs. XX21, with a Log2|fold change| of −1.96, −3.09, and 1.76, respectively. Two hub genes (AdOPR3 and AdCYP707A4) were then screened based on integrative analyses of metabolome and transcriptome data, and showed significantly decreased expression during ‘XX’ fruit ripening, which might be responsible for the reduced content of JA and enhanced level of ABA, respectively. Furthermore, co-expression networks of AdOPR3 and AdCYP707A4 were constructed by WGCNA and the potential transcriptional regulators of these two hub genes were predicted based on a correlation threshold over 0.9. Taken together, these results revealed the opposing accumulation patterns of JA and ABA might contribute to physiological ripening in kiwifruit, via the TF-mediated transcriptional regulation of AdOPR3 and AdCYP707A4. These findings provide insights for hormonal control of fruit ripening.
1. Introduction
Fruits, as edible plant organs, are rich in diverse health-beneficial metabolites, such as vitamins, flavonoids, and carotenoids, playing vital roles in human dietary life. During fruit development and ripening, the accumulation and transformation of these quality-related metabolites are finely modulated by hormonal signals [1,2]. Concurrently, the abundance of these metabolites and key hormone metabolites undergoes dynamic changes and fluxes, collectively shaping fruit quality traits (including color, flavor, nutrition, and texture) and facilitating the adaptation to changing environments [3,4,5]. Therefore, comprehensive elucidation of metabolite regulation during fruit ripening is essential for targeted improvement of fruit quality traits and development of breeding strategies. Recently, multi-omics approaches—particularly the integration of metabolomic with transcriptomic, proteomic, or genomic—have been widely applied in fruit research (including tomato, mango, kiwifruit, citrus) to elucidate global metabolic regulatory network under specific physiological or environmental conditions [3,6].
Plant hormones are a series of small signaling molecules that serve as central regulators, integrating intrinsic developmental processes and adaptive responses to environmental cues [7]. In plants, multiple hormones (such as auxin, gibberellins, cytokinins, jasmonates (JAs), abscisic acid (ABA), ethylene, brassinosteroids, strigolactones, salicylic acid, karrikins, and peptide hormones) have been identified and characterized to function either individually or synergistically to regulate diverse physiological processes, each also exhibiting distinct regulatory preferences [8,9,10,11]. For instance, jasmonates are considered to be major defense hormones in plants that modulate plant resistance against insects, pathogens, mechanical wounding, and abiotic stress [12], but they also play vital roles in other developmental processes, such as fruit coloration [13] and fruit ripening [14]. Abscisic acid is widely involved in the stress response and ripening processes, such as the regulation of carotenoid biosynthesis [15] and sugar accumulation [16].
Jasmonates in higher plants are mainly derived from α-linolenic acid and jasmonic acid (JA) is the prototypical member [17]. The jasmonic acid biosynthetic pathway contains two key phases: α-linolenic acid is first converted into 13-hydroperoxy-linolenic acid (13-HPOT) in the chloroplast via the action of lipoxygenase (13-LOX); subsequently, allene oxide synthase (AOS) catalyzes the transformation of 13-HPOT into the unstable epoxide 12,13(S)-Epoxyoctadecatrienoic acid (12,13-EOT); this intermediate is then cyclized by allene oxide cyclase (AOC) to yield 12-oxophytodienoic acid (12-OPDA); then the conversion of OPDA to JA is achieved in the peroxisome or cytosol through 12-oxophytodienoate reductase (OPR) and three times β oxidation [18]. The roles of these JA biosynthetic related genes have been characterized in higher plants such as AOS/CYP74A and AOC isoforms (AOC1, AOC2, AOC3, and AOC4) in Arabidopsis [19], ShAOS1 and ScOPR2 in sugarcane [20,21], and MfAOC2 in alfalfa [22]. Moreover, numerous studies have verified that modulation of these genes in transcription and translation levels is also essential for JA production. For instance, tomato SlWRKY50 directly binds to the W-box presented in the SlAOS promoter and activates its expression to enhance JAs biosynthesis and cold tolerance [23]. The ERF transcription factors SlERF15/16 activates the expressions of key genes (LOXD, AOC, and OPR3) in JA biosynthesis to trigger the JA burst in response to wounding and herbivory [24].
Abscisic acid metabolism pathway has also been well elucidated in plants [25,26,27]. The biosynthesis of ABA is derived from the production of a carotenoid precursor in plastids. In an ABA-specific synthetic pathway, zeaxanthin is firstly converted into violaxanthin catalyzed by zeaxanthin epoxidase (ZEP), while violaxanthin also can be reversibly converted into zeaxanthin by violaxanthin de-epoxidase (VDE); violaxanthin is subsequently modified into xanthoxin via the catalysis of 9-cis-epoxycarotenoid dioxygenase (NCED), which is the rate-limiting step in ABA biosynthesis; xanthoxin is transferred to the cytoplasm and transformed into ABA-aldehyde by xanthoxin dehydrogenase (ABA2); finally, abscisic-aldehyde oxidase (AAO) catalyzes the conversion of ABA-aldehyde into ABA. Several ABA-deficient mutants that were impaired in these key biosynthetic genes were identified, such as Arabidopsis aba1, aba2 and aba3 [28], maize vp14 [29], and tomato hp3 [30]. The catabolism of ABA is mainly controlled by conjugation and catalytic hydroxylation, the hydroxylation of which is initiated from the conversion into 8’-hydroxyabscisate catalyzed by abscisic acid 8′-hydroxylase (ABAH/CYP707A) [31]. Transcriptional regulators of ABA metabolism have been widely reported in fruit, such as citrus CsERF110 and CsERF53 [15], apple MdABI5 and MdMYBS1 [32] and strawberry FaCMB1 [33]. In strawberry, MADS-box SEPALLATA 4 (SEP4) subfamily transcription factor FaCMB1 directly binds to the FaASR promoter and represses its expression, thus alleviating the inhibition of FaASR on transcriptional activity of FaCYP707A4 and promoting the production of endogenous ABA content [33].
Kiwifruit (Actinidia spp.) is a climacteric fruit with significant economic importance, and is known for its high nutritional valuable, containing abundant vitamins, essential minerals, and health-beneficial bioactive compounds [34,35,36]. During development and ripening, kiwifruit undergo metabolic adjustments that modulate the abundance of diverse carbohydrates, amino acids, and secondary metabolites, specifically driving the metabolism of ascorbate and synthesis of unique volatile compounds [37,38,39] Collectively, these changes directly or indirectly contribute to the fruit key quality characteristics. To date, complex metabolite dynamics have been widely studied during kiwifruit development, ripening, and post-harvest storage based on multi-omics strategies [6,38,39]. For instance, the specific activation–repression systems responsible for distinct anthocyanin accumulation in kiwifruit were identified through transcriptome and small RNA high-throughput sequencing [38]. An integrated metabolomic and transcriptomic approach was employed to construct a global metabolic network, elucidating the regulatory mechanisms underlying key quality traits (including ester metabolism, sugar accumulation, anthocyanidin biosynthesis, L-ascorbate metabolism) during kiwifruit development and ripening [6,40]. Zeng et al. [39] conducted a similar strategy to generate spatiotemporal regulatory networks across different tissues and different development stages and identified key contributors for flesh ripening and terpene production in fruit skin. However, previous studies mainly focused on flavor, nutrition, and color traits, while the regulation of hormone metabolism during fruit development remains less understood.
In this study, the dynamic changes in metabolites and underlying regulatory mechanisms were investigated during A. deliciosa cv. Xuxiang (‘XX’) development through integrative analyses of metabolome and transcriptome data. Two hormones—jasmonic acid (JA) and abscisic acid (ABA)—were screened from metabolomic profiling, which showed contrasting accumulation patterns during ‘XX’ development. Combining metabolite dynamics with gene expression analysis, two hub genes AdOPR3 and AdCYP707A4 were further identified that contribute to the decreased JA content and enhanced ABA level, respectively. Furthermore, weighted gene co-expression network analysis (WGCNA) was applied, which predicted 27 and 8 differentially expressed transcription factors to be potential regulators of AdOPR3 and AdCYP707A4, respectively. Collectively, these findings advance the understanding of the differential metabolism of JA and ABA and their underlying regulatory mechanisms during kiwifruit development. This understanding provides potential strategies to regulate fruit ripening by manipulating targeted hormonal regulation.
2. Materials and Methods
2.1. Plant Material
Kiwifruit (Actinidia deliciosa cv. Xuxiang, ‘XX’) at 9, 13, and 21 weeks after pollination (WAP) were collected from a commercial orchard in 2019 in Zhejiang Province, China [41]. Twelve fruits of uniform size and without physical wounding or disease were collected and divided into three replicates (with four fruit in each replicate). After removing the skin, outer pericarp (without core and seeds) were sampled, cut into small pieces, frozen in liquid nitrogen and stored at −80 °C.
2.2. Metabolome Profiling
A widely targeted metabolomics analysis was performed on nine ‘XX’ samples at three development stages (with three replicates) by Metware Biotechnology Co., Ltd. (Wuhan, China). Briefly, the pericarp tissues were placed in the freeze-dryer (Scientz-100F; Scientz, Ningbo, China) for vacuum freeze-drying and then ground into homogeneous powder using the grinding mill (MM 400; Retsch, Haan, Germany). For extraction, 100 mg powder was mixed into 1.2 mL 70% aqueous methanol, vortexed at 30 min intervals for a total of six cycles, and extracted at 4 °C overnight. The next day, the suspension was centrifuged at 12,000 rpm for 10 min at 4 °C and the supernatant was filtered using a microporous membrane (0.22 μm pore size) and collected into an injection bottle for further UPLC-MS/MS analysis.
For the liquid phase, a 4 μL sample was injected into Agilent SB-C18 column (1.8 µm, 2.1 mm × 100 mm; Agilent Technologies Inc., Santa Clara, CA, USA). The mobile phase A was set as ultrapure water containing 0.1% formic acid, and the mobile phase B was set as acetonitrile containing 0.1% formic acid. The elution gradient was programmed as follows: initial conditions of 5% B phase (95% A phase) for 0 min, followed by a linear increase in proportion of B phase to 95% over 9.00 min; the composition was maintained at 95% B phase and 5% A phase for 1 min (9–10 min); and then returned to 5% B phase over 1 min (10–11 min) and held at 5% B phase for re-equilibration until 14 min. The flow rate was set as 0.35 mL/min and the column temperature was set as 40 °C. For mass spectrometry, the linear ion trap (LIT) and triple quadrupole (QQQ) scans were conducted using triple quadrupole-linear ion trap mass spectrometer (Q TRAP) and AB4500 QTRAP UPLC/MS/MS system (Sciex, Framingham, MA, USA). The data collection adopts the Information Related Acquisition (IDA) mode. The source parameter settings are as follows: GAS1, 50 psi; GAS2, 50 psi; air curtain pressure of 25 psi; temperature (TEM), 500 °C; de clustering voltage (DP), 60 V or −60 V (positive or negative mode); and ISFF (ion spray voltage), 5500 or −4500 V (positive or negative mode). Based on the self-built Metware database (MWDB) [3,42], substance qualitative analysis was conducted through secondary spectral information. The metabolites quantification was carried out using multiple reaction monitoring (MRM) mode of triple quadrupole mass spectrometry. After obtaining metabolite mass spectrometry data from different samples, peak area integration was performed on substance mass spectrometry peaks, and integration correction was performed on the mass spectrometry peaks of the same metabolite in different samples [43]. Principal component analysis (PCA) and partial least squares–discriminant analysis (OPLS-DA) were conducted for multivariate statistical analysis. Based on OPLS-DA results, the variable importance in projection (VIP) of the OPLS-DA model was obtained for preliminarily screening metabolites with differences between different stages. In this study, metabolites with variable importance of the projection (VIP) ≥ 1, false discovery rate (FDR) < 0.05, and |Log2 Fold Change| ≥ 1 were assigned as differentially accumulated metabolites (DAMs).
2.3. RNA Extraction and cDNA Synthesis
Nine RNA samples from three development stages (each with three biological replicates) were extracted using cetyltrimethylammonium bromide (CTAB) method. For each sample, about 0.5 g fruit powder was added into 4 mL CTAB extraction buffer (2% CTAB, 2% PVP-K30, 0.1 M Tris–HCl (pH 8.0), 25 mM EDTA (pH 8.0), 2 M NaCl, 0.5 g L−1 spermidine, and 5% β-mercaptoethanol) at 65 °C for 15min. After that 4 mL chloroform-isoamyl alcohol (24:1, v/v) was added and vortexed, then centrifuged at 10,000 g for 10 min at 4 °C. The supernatant was collected into a new tube, 4 mL 24:1 was added, vortexed, and centrifuged again. Then 3 mL supernatant was moved into a new tube, adding 750 μL 10 M LiCl. Then, the mixture was put steadily overnight in a refrigerator at 4 °C. The next day the mixture was centrifuged at 10,000 g for 30 min at 4 °C and the supernatant was removed gently. The RNA pellet was washed two times with 1 mL 75% ethanol and centrifuged at 12,000 g for 5 min at 4 °C, and then ethanol was removed. After drying for 10 min on the ice, the RNA pellet was dissolved in 30 μL DEPC-treated water and stored at −80 °C for further use.
PrimeScript RT reagent Kit with gDNA Eraser (Takara, Beijing, China) was used to synthesize the first-strand cDNA. For each sample, 0.5 μg RNA was mixed with 1 μL 5× gDNA Eraser Buffer, 0.5 μL gDNA Eraser, and RNase free H2O (up to 5 μL). Then, the mixture was reacted at 42 °C for 2 min. Further, the mixture was added into the first-strand cDNA synthesis reaction solution compounded with 0.5 μL Primer Script-RT Enzyme Mix, 0.5 μL RT Primer Mix, 2 μL 5× Primer Script Buffer, and 2 μL RNase free H2O, vortexed and reacted at 37 °C for 15 min at 85 °C for 5 s. The product was diluted 10 times by DEPC-treated water and stored at −20 °C for further use.
2.4. Transcriptome Sequencing
Nine RNA samples extracted from three development stages of ‘XX’ fruit with three replicates were used for transcriptome sequencing and analysis. All libraries were constructed using the NEBNext UltraTM RNA Library Prep Kit for Illumina (NEB, Ipswich, MA, USA) and sequenced on the Illumina sequencing platform with 150 bp paired-end (PE) reads by Metware Biotechnology Co., Ltd. (Wuhan, China). The average insert size was 200 bp, and the sequencing depth per sample was at least 44 million raw reads. Quality control was performed with Fastp (v0.19.3); over 93% of bases had a Q-score ≥ 30. After removing unqualified reads (adapters, poly-N, and low-quality), clean reads were obtained and mapped to the Actinidia chinensis cv. Red5 genome database through HISATv2.1.0 [44]. Fragments per kilobase of transcript per million fragments mapped (FPKM) were used to estimate gene expression levels via featureCounts v1.6.2. Differential expression analysis was conducted with DESeq2 (v1.22.1) and the Benjamini–Hochberg method was performed for multiple testing correction. Differentially expressed genes (DEGs) were identified under the criteria of FDR < 0.05 and |Log2 Fold Change| ≥ 1.
2.5. RT-Quantitative Real-Time PCR Analysis
The specific primers for candidate genes were designed using Primer3Plus (https://www.primer3plus.com) and checked through melting curves and product sequencing. RT-qPCR was operated on CFX Opus 96 Real-time PCR System (Bio-Rad Laboratories, Hercules, CA, USA) with PerfectStart® Green qPCR SuperMix (TransGen Biotech, Beijing, China) following the reaction system and protocol. The reaction system consisted of 20 μL, including 10 μL of 2× PerfectStart® Green qPCR SuperMix (Transgen, Beijing), 1 μL (10 μM) of upstream and downstream primers, 2 μL of cDNA, and 6 μL of DEPC-H2O, and the PCR reaction procedure is as follows: 95 °C for 30 s, 95 °C for 5 s, 60 °C for 15 s, 72 °C for 10 s over 40 cycles with 4 °C insulation. The relative gene expression levels were normalized using two internal reference genes: Kiwifruit UBC9 and PP2A, and 2−ΔCt method was employed for the relative expression level calculating. The sequences of primers used for RT-qPCR are provided in Table S1.
2.6. Weighted Gene Co-Expression Network Analysis
The weighted gene co-expression network analysis (WGCNA) was conducted with the genes (max FPKM among 9 samples > 1) identified from transcriptome data following the methods described in previous studies [41]. Co-expression network modules were constructed with the following parameters: unsigned TOM type, Pearson correlation, a soft-thresholding power of 9 to ensure scale-free topology, a minimum module size of 100 genes, and a merge cut height of 0.25 to combine similar modules, while other parameters were kept at their default settings. Hub modules (‘turquoise’ and ‘brown’ module) that showed high correlation with traits (expression of target genes AdOPR3 and AdCYP707A4) were screened based on module–trait relationships. And candidate genes in hub modules were identified through gene significance (GS)–module membership (MM) analysis at the thresholds of ‘|MM in turquoise/brown module| > 0.9’ and ‘|GS for AdOPR3/AdCYP707A4| > 0.9’.
2.7. Statistical Analysis
Statistical significance of data was analyzed based on one-way analysis of variance (ANOVA) testing by IBM SPSS Statistics 27. Figures were drawn with the relevant software Adobe Photoshop 2023, Graphpad Prism 10.1.2, and online websites Metware Cloud (https://cloud.metware.cn/#/tools/tool-list).
3. Results
3.1. Identification of Metabolites Across ‘Xuxiang’ Kiwifruit Development
To elucidate the metabolic dynamics and associated regulatory networks during kiwifruit (A. deliciosa cv Xuxiang) development, a widely targeted metabolomic analysis was performed on the outer pericarp tissues at three development stages—9, 13, and 21 WAP (each with three biological replicates). Replicate correlation analysis revealed strong intra-group consistency (r > 0.95), indicating the reliability of the metabolic profiling data (Figure 1A). Principal component analysis showed that PC1 and PC2 accounted for 39.69% and 17.68% of the variation in metabolites of all samples, respectively, which could be distinguished between different developmental stages (Figure 1B). In total, 1015 metabolites were identified in ‘Xuxiang’ kiwifruit at least in one stage. These metabolites were classified into 12 major categories, including 176 phenolic acids, 166 lipids, 153 flavonoids, 117 amino acids and derivatives, 84 organic acids, 69 alkaloids, 49 nucleotides and derivatives, 39 lignans and coumarins, 27 terpenoids, 15 tannins, 2 quinons, and 118 others (Figure 1C). Based on hierarchical cluster analysis using the ComplexHeatmap package (v2.12.0) with default parameters in Metware Cloud, the 1015 metabolites were classified into three distinct accumulation patterns corresponding to their predominant abundance in early, middle, or late developmental stages.
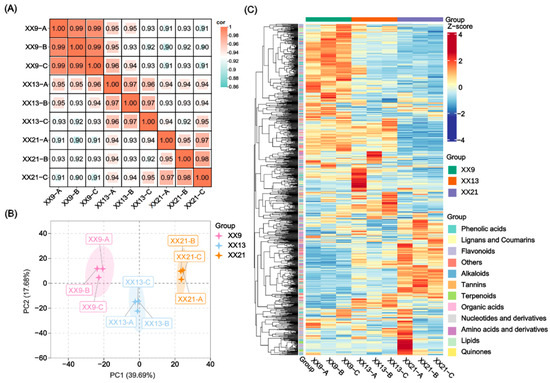
Figure 1.
Overview of metabolome data analysis during A. deliciosa cv Xuxiang (XX) development. (A) Correlation analysis among nine samples sent for metabolome at 9, 13, and 21 weeks after pollination (WAP). The color gradient indicates the magnitude of correlation coefficients. (B) Principal component analysis (PCA) of these nine samples. PC1 and PC2 represent the first and second principal components, respectively. (C) Cluster heatmap of the 1015 identified metabolites during ‘XX’ development. The metabolite abundances were Z-score normalized (row-wise) and visualized using a color gradient from blue (−4, low abundance) to red (+4, high abundance).
3.2. Screening and Characterization of Differentially Accumulated Metabolites
To gain further insights into the metabolic dynamics during ‘XX’ development, 126 differentially accumulated metabolites (DAMs) were screened based on the threshold of |Log2FC| ≥ 1, FDR < 0.05, and VIP ≥ 1 (Figure 2A; Table S2). Among these DAMs, lipids, others, phenolic acids, and organic acids were the four major classes, which accounted for 20.6% (26/126), 17.5% (22/126), 15.9% (20/126), and 12.7% (16/126) respectively (Figure 2B). Moreover, pairwise comparison analysis showed that 10 (7.9%) and 121 (96.0%) DAMs were identified in the XX13 vs. XX21 and XX9 vs. XX21, respectively (Figure 2C). In the XX9 vs. XX21 comparison, most DAMs showed a downregulated pattern, such as phenolic acids, lipids, others, and organic acids (Figure 2D). In addition, a subset of metabolites exhibited pronounced changes in abundance (|Log2FC| ≥ 10) between early (9 WAP) and late (21 WAP) stages of ‘XX’ development (Figure 2D). For example, one flavonoid (Lmqp006281/Kaempferol-3-O-(4″-O-acetyl)rhamnoside) was markedly decreased in abundance in XX9 vs. XX21. In the organic acids class, Lmgn000160 (3-Ureidopropionic Acid) exhibited the most pronounced decline in abundance, whereas Hmhn002738/3-Furoic acid showed the most significant accumulation. Among the others class, the metabolites with the most substantial decrease in abundance were ML10171848 (D-Arabinono-1,4-lactone).
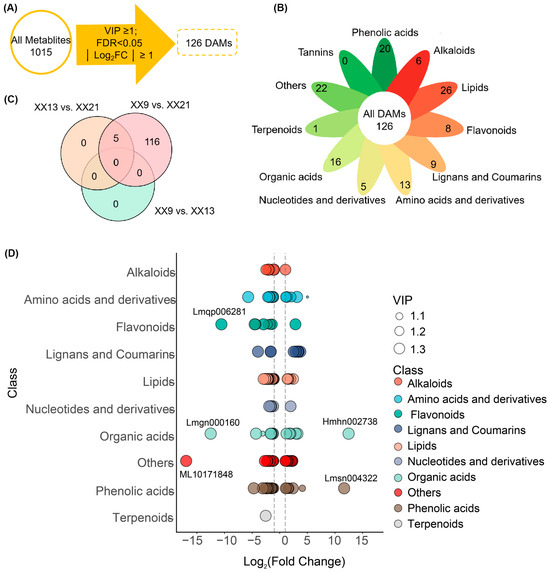
Figure 2.
Analysis of differentially accumulated metabolites (DAMs). (A) Screening of DAMs based on the conditions of |Log2FC| ≥ 1, FDR < 0.05, and VIP ≥ 1. A total of 126 DAMs were screened from 1015 metabolites. (B) Overview of 126 DAMs. (C) Veen Plot of DAMs numbers identified in three pairwise comparisons (XX9 vs. XX13, XX13 vs. XX21, and XX9 vs. XX21). (D) Classification and regulation of DAMs in XX9 vs. XX21. The bubble size represents the VIP value of each substance. The top regulated DAMs (|Log2FC| ≥ 10) were marked.
3.3. KEGG Analysis Reveals Hub DAMs Involved in Hormone Metabolism
KEGG enrichment analysis was conducted to further elucidate the involvement of these DAMs in key metabolic pathways. The results showed that DAMs in XX9 vs. XX21 were significantly enriched in propanoate metabolism (ko00640; 3 DAMs out of 4 identified metabolites), alpha-linolenic acid metabolism (ko00592; 6 DAMs out of 11 identified metabolites), plant hormone signal transduction (ko04075; 2 DAMs out of 4 identified metabolites), glycosylphosphatidylinositol (GPI)-anchor biosynthesis (ko00563; 1 DAMs out of 1 identified metabolites), and carotenoid biosynthesis (ko00906; 1 DAMs out of 16 identified metabolites) (Figure 3A; Table S3). Plant hormones, including jasmonic acid (JA) and abscisic acid (ABA), play pivotal roles in regulating various physiological processes during fruit development. Notably, jasmonic acid biosynthesis originates from α-linolenic acid (18:3) through the α-linolenic acid metabolism pathway. Thus, the two pathways—plant hormone signal transduction (ko04075) and alpha-linolenic acid metabolism (ko00592)—were preferentially selected for further analysis. A total of seven DAMs were identified from these two pathways, comprising two organic acids (Lmtn004049/abscisic acid; pme1654/jasmonic acid) and five lipids (Zmpn003368/13S-Hydroxy-9Z,11E,15Z-octadecatrienoic acid; Zmyn004548/12-Oxo-phytodienoic acid; Zmyn004676/17-Hydroxylinolenic acid; pmb2791/9-Hydroperoxy-10E,12,15Z-octadecatrienoic acid; pmn001689/9-Hydroxy-12-oxo-15(Z)-octadecenoic acid) (Figure 3B). Of these, the abundance of Lmtn004049 showed obvious increases in XX9 vs. XX13 and XX9 vs. XX21, while pme1654 and Zmyn004548 exhibited significant decreases in abundance in XX13 vs. XX21 and XX9 vs. XX21 (Figure 3C).
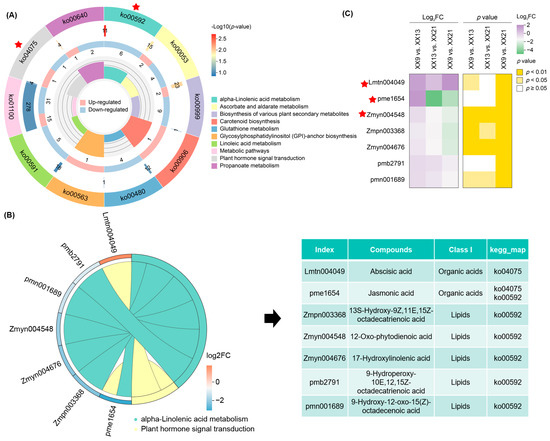
Figure 3.
Identification of hub DMAs involved in plant hormone metabolism. (A) KEGG enrichment analysis of DAMs in XX9_vs XX21. The four circles, from innermost to outmost, indicate rich factor, numbers of DAMs, numbers of background metabolites, and KEGG pathway ID, respectively. The red star represents two hub pathways (ko04075 and ko00592) that were selected for further analysis. (B) Overview of 7 DAMs belonging to these two hub pathways. (C) Heatmap of Log2FC and p-value of 7 DAMs in three comparisons (XX9 vs. XX13, XX13 vs. XX21, and XX9 vs. XX21). The red star indicates three hub DAMs (Lmtn004049, pme1654, and Zmyn004548) that were selected for further analysis.
3.4. Integrated Transcriptomic and Metabolomic Analysis Identifies Key Differentially Expressed Genes Driving Dynamic Changes in Hub DAMs
To investigate the regulatory mechanisms underlying dynamic changes in hub DAMs (Lmtn004049, pme1654, and Zmyn004548) during ‘XX’ development, transcriptome sequencing was also conducted on these nine samples of ‘XX’ (three development stages with three biological replicates). Differentially expressed genes (DEGs) were further identified in three pairwise comparisons based on the thresholds of |Log2FC| ≥ 1 and FDR < 0.05 (Figure 4; Table S4). In total, 1483 DEGs (685 upregulated and 798 downregulated) were identified in XX9 vs. XX13, 2380 (698 upregulated and 1682 downregulated) in XX13 vs. XX21, and 3539 (1136 upregulated and 2403 downregulated) in XX9 vs. XX21 (Figure 4A–C). KEGG enrichment analysis identified the top 20 pathways in three pairwise comparisons and the results showed that ‘plant hormone signal transduction’ (ko04075) was significantly enriched in all three comparisons, while ‘alpha-Linolenic acid metabolism’ (ko00592) was significantly enriched in both XX9 vs. XX21 and XX13 vs. XX21 (Figure 4D–F).
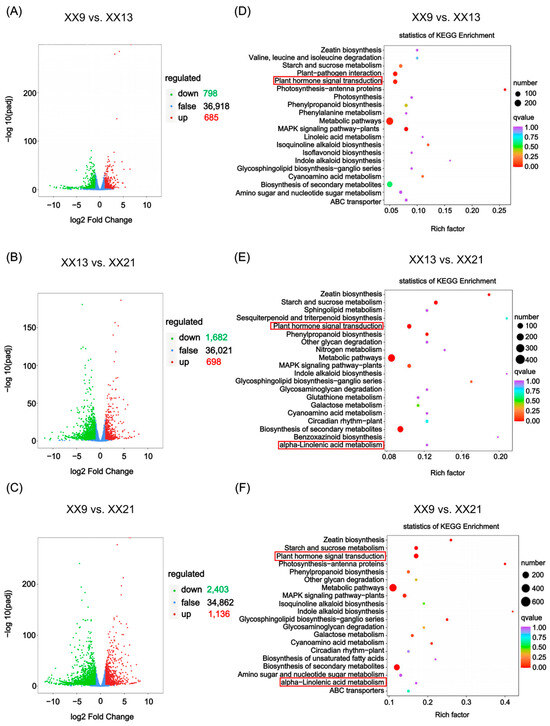
Figure 4.
Analysis of deferentially expressed genes during ‘XX’ development. (A–C) Volcano plots for DEGs in XX9 vs. XX13, XX9 vs. XX21, and XX13 vs. XX21, respectively. Upregulated and downregulated genes are shown as red dots and green dots, respectively, while no deferentially expressed genes are shown as blue dots. (D–F) KEGG enrichment analysis reveals top 20 enriched pathways in XX9 vs. XX13, XX13 vs. XX21, and XX9 vs. XX21. Dot size indicates the gene number and dot color represents the q-value. The red box shows key pathways (plant hormone signal transduction and alpha-linolenic acid metabolism) selected for further analysis.
Due to the decreased abundance of 12-Oxophytodienoic acid (Zmyn004548) and jasmonic acid (pme1654) during ‘XX’ development, the 27 candidate genes involved in alpha-linolenic acid metabolism pathway that were responsible for the biosynthesis of jasmonic acid were identified (Figure 5A; Table S5). Among of them, most candidates are non-significant, while only two allene oxide synthase genes (Acc12015 and Acc23693) and three genes (Acc00918, Acc09814 and Acc21292) encoding 12-oxophytodienoate reductase showed differential expression based on transcriptome data. Then, the expressions of these five DEGs were verified through RT-qPCR (Figure 5B,C). The results showed that the relative expression abundance of Acc12015/AdAOS1 was significantly upregulated during ‘XX’ development, whereas another AOS gene, Acc23693, exhibited a downregulated expression pattern without reaching statistical significance (Figure 5B). Interestingly, while AdAOS1 expression was upregulated, the abundance of downstream product OPDA and JA were both declined (Figure 5A), suggesting that JA accumulation is not solely determined by AdAOS1 transcript levels. Moreover, all three OPR genes exhibited decreased expression patterns during ‘XX’ development, but with only Acc00918/AdOPR3 showing a statistically significant reduction (Figure 5C). The increased abundance of abscisate (Lmtn004049) suggested differential regulation underlying the abscisate metabolism. Thus, 12 abscisate biosynthetic genes and 10 abscisate catabolic genes were screened as candidate genes for analysis (Figure 5D; Table S5). Among these 22 genes, the majority did not show statistically significant differential expression. Two catabolic genes Acc23740 and Acc28692, which both encode abscisic acid 8′-hydroxylase, showed a contrast expression pattern. RT-qPCR analysis further verified that the relative expression of Acc23740/AdCYP707A4 significantly decreased during ‘XX’ development, while Acc28692 displayed an upward but statistically insignificant trend (Figure 5E).
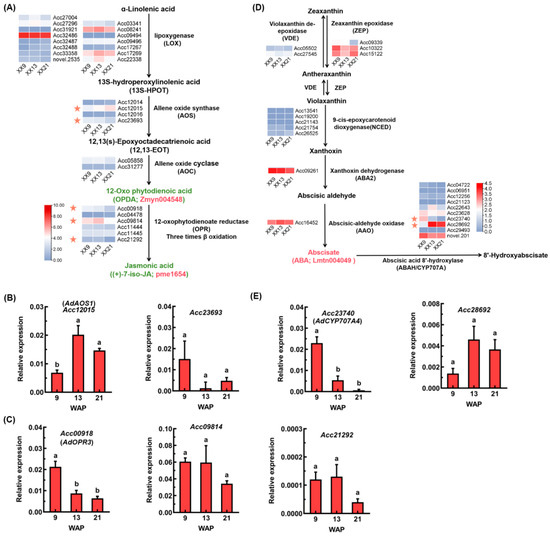
Figure 5.
Expression analysis of DEGs involved in jasmonic acid and abscisate metabolism. (A) Expression of JA biosynthetic genes based on RNA-seq data. Two key downregulated metabolites (12-Oxophytodienoic acid/Zmyn004548 and jasmonic acid/pme1654) are indicated in green color. Five candidate DEGs are highlighted by pink stars. (B,C) Expression verification of two AOS genes (B) and three OPR genes (C) through RT-qPCR. (D) Expression of ABA biosynthetic and catabolic genes based on RAN-seq data. One key upregulated metabolite (abscisate/Lmtn004049) is indicated in pink color. Two candidate CYP707A genes are highlighted by pink stars. (E) Expression verification of two CYP707A genes by RT-qPCR. Kiwifruit UBC9 was used as an internal control. Error bars indicate SEs from three biological replicates. Different letters indicate significant differences at p < 0.05 based on one-way ANOVA.
3.5. Co-Expression Network Analysis of AdOPR3 and AdCYP707A4
To further explore the potential regulators of AdOPR3 and AdCYP707A4, WGCNA was conducted with the genes (max FPKM ≥ 1 among 9 samples) identified from RNA-seq. Among the 29 co-expression modules clustered, the ‘turquoise’ module showed the strongest negative correlation with AdOPR3 expression (r = −0.97, p = 2 × 10⁻⁵), while the ‘brown’ module exhibited the highest positive correlation with AdCYP707A4 expression (r = 0.96, p = 6 × 10⁻⁵) (Figure 6A). Moreover, co-expressed candidate genes with ‘|MM in the turquoise/brown module| > 0.9’ and ‘|GS for AdOPR3/AdCYP707A4| > 0.9’ were screened based on the GS-MM analysis, which contained 197 and 104 DEGs meeting the thresholds of max FPKM ≥ 5 and |Log2FC in XX9 vs. XX21| > 2, respectively (Figure 6B,C). The co-expression network analysis revealed that 27 DETFs belonging to NAC, ERF, B3, bHLH, C2C2, CH2, C3H, HB, LOB, WRKY, MYB, SBP, E2F, and TIFY transcription factor families were strongly correlated with AdOPR3, including 11 with positive correlations and 16 with negative correlations (Figure 6D; Table S6). And 8 DETFs were identified as potential positive-regulators for AdCYP707A4, which belonged to HB, bHLH, C2C2, TCP, bZIP, and C2H2 transcription factor families, respectively (Figure 6E; Table S6). These findings provide candidate transcriptional regulators that may contribute to the differential expression patterns of AdOPR3 and AdCYP707A4, thus modulating the dynamic of JA biosynthesis and ABA catabolism during kiwifruit development.
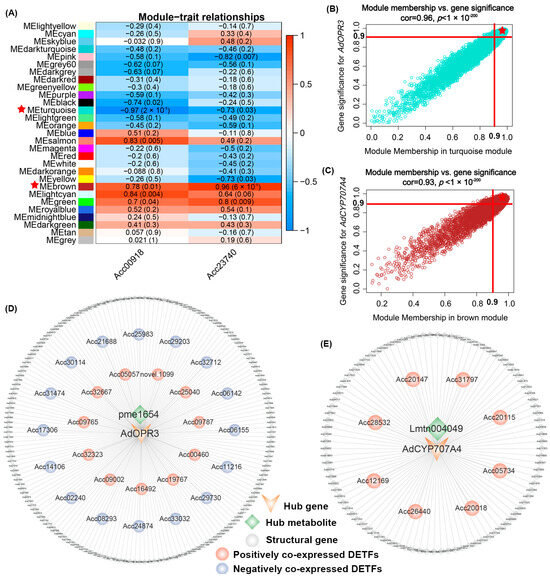
Figure 6.
Co-expression network of AdOPR3 and AdCYP707A4. (A) Heatmap of module–trait relationships. The red star highlights the ‘turquoise’ and ‘brown’ module, which showed the highest correlation with AdOPR3 and AdCYP707A4 expression, respectively, and were selected for further analysis. (B,C) Gene significance (GS)-Module membership (MM) analysis for AdOPR3 (B) and AdCYP707A4 (C). The red star highlights candidate genes screened based on the conditions of |MM in turquoise/brown module| > 0.9’ and ‘|GS for AdOPR3/AdCYP707A4| > 0.9’. (D) Co-expression network of AdOPR3 with hub metabolite (pme1654) and DEGs from ‘turquoie’ module. (E) Co-expression network of AdCYP707A4 with hub metabolite (Lmtn004049) and DEGs from ‘brown’ module. Green diamonds represent hub metabolites, while circles with pink and blue colors indicate positively and negatively co-expressed DETFs, respectively. Gray circles represent structural genes.
4. Discussion
Metabolites function as fundamental biochemical currency, reflecting the integrated output of biological processes and environmental interactions. Recent advances in integrative profiling of multi-omics technologies (such as metabolomic, transcriptomic, proteomic) have enabled comprehensive characterization of metabolic dynamics and underlying regulatory networks across different biological processes [6,39]. Kiwifruit, as an economically important crop in the world, is very popular with consumers for its good taste and high nutrition. In this study, a widely targeted metabolomic analysis across ‘XX’ kiwifruit development identified 1015 metabolites, 126 of which (such as flavonoids, phenolic acids, organic acids, lipids, and alkaloids) exhibited a differential accumulation pattern (Figure 1 and Figure 2). For instance, flavonoids are a group of bioactive compounds with antioxidant activities and are associated with health benefits [45]. Here, 87.5% of flavonoid DAMs showed decreased abundance during kiwifruit development, including Lmqp006281 (Kaempferol-3-O-(4″-O-acetyl)rhamnoside) (Figure 2D). Organic acids play crucial roles in modulating fruit taste, energy metabolism, and secondary metabolic pathways [46]. Some organic acids (such as 3-furoic acid and abscisic acid) showed significant increase in abundance, while others (such as 3-ureidopropionic acid, succinic acid, and jasmonic acid) were markedly decreased during ‘XX’ development (Figure 2D; Table S2). The dynamic changes in primary and secondary metabolites directly contribute to ripening traits (e.g., taste, color, flavor) and are likely orchestrated by multi-layered regulators, such as the environmental signals and hormonal network.
In the previous studies, the dynamic changes in key metabolites, including soluble sugars, organic acids, volatiles, vitamin C, and terpenes have been characterized throughout kiwifruit growth cycle and across different tissues [6,38,39]. These studies have focused largely on the metabolism of fruit flavor and nutrition traits, but the metabolic basis of other quality characteristics remains largely unexplored. In present study, the DAMs identified from ‘XX’ development were functionally enriched in several metabolic pathways, including alpha-linolenic acid metabolism and plant hormone signal transduction (Figure 3A,B), suggesting the potential involvement of specific hormones in the regulation of kiwifruit ripening. For instance, increased abundance of cytokinins in developing kiwifruit might be involved in the regulation of flesh chlorophyll levels [47]. The high level of indole-3-acetic acid was observed in inner fruit tissues of young kiwifruit, possibly promoting the growth of kiwifruit [48]. Here, three hormone-related metabolites were further identified and exhibited significant changes, with decreased abundance of jasmonic acid and 12-oxo-phytodienoic acid (the direct precursor for jasmonic acid biosynthesis) and pronounced accumulation of abscisic acid (Figure 3C). Similar results were also observed during the tomato ripening process where the level of JA-Ile (the most bioactive form of JA) was markedly decreased since ripening initiation, accompanied by the reduction in JA-mediated defense responses [49]. JA, as a major defense hormone, plays crucial roles in balancing fruit ripening and resistance. High levels of JA are maintained at the early development stage to safeguard the normal growth of fruit, while this defensive mechanism will gradually decline as the fruit ripens, facilitating the development of nutritional and sensory qualities as well as seed dispersal [49].
Moreover, the involvement of ABA in bud/seed dormancy and fruit ripening has also been widely investigated in non-climacteric and climacteric fruits [50,51,52]. For instance, the high level of endogenous ABA in the endocarp of red bayberry maintains seed dormancy [53]. In tomato, the reduced ABA content in SlPti4-RNAi seeds was associated with lower dormancy degree and higher germination rate [54]. The enhanced accumulation of endogenous ABA was strongly associated with mango ripening, and exogenous ABA treatment could accelerate the ripening process of mango during the post-harvest stage [52]. Similarly, the elevated ABA content during late development might promote kiwifruit ripening and other coordinated physiological programs, including seed dormancy. Taken together, the concomitant decline in JA and rise in ABA might suggest a possible hormonal shift that redirects metabolism from defense toward ripening processes.
In parallel with metabolomic profiling, transcriptomic investigation also found that DEGs were prominently enriched in alpha-linolenic acid metabolism and plant hormone signal transduction across developmental stages (Figure 4). Furthermore, parallel analysis of metabolomic and transcriptomic data identified two key DEGs (AdOPR3 and AdCYP707A4) involved in JA biosynthesis and ABA catabolism, respectively (Figure 5). AdOPR3 encodes a 12-oxophytodienoate reductase, which acts in the transformation of OPDA to JA, a critical step in JA biosynthesis process [18]. In Arabidopsis, the synthesize of JA was obviously blocked in the opr3 mutant [55]. In tomato, silence of SlOPR3 led to significant reduction in OPDA levels and JA-Ile production [56]. In sugarcane, stable overexpression of ScOPR1 enhanced the accumulation of JA, SA, and GST contents, thus promoting the pathogen resistance of transgenic plants [57]. AdCYP707A4 encodes a cytochrome P450 monooxygenase/abscisic acid 8′-hydroxylase, functioning in initiation of ABA catabolism [25]. In strawberry, transient silencing of FveCYP707A4a inhibited the hydroxylation of ABA, leading to the higher level of ABA [58]. Here, concurrent reduction in AdOPR3 and AdCYP707A4 expression might be an important factor influencing the decline in JA content and accumulation in ABA level during ‘XX’ development, respectively (Figure 5C,E).
To date, the transcriptional regulation of JA and ABA metabolism has been extensively characterized in various fruit species [59]. Here, the co-expression network with AdOPR3 and AdCYP707A4 was also constructed through WGCNA to identify the potential regulators of these two hub genes (Figure 6A). Several DETFs belonging to diverse TF families (such as NAC, ERF, WRKY, HB, bHLH, and different types of Zinc finger) were screened, which showed positively or negatively high correlation with AdOPR3 and AdCYP707A4 (Figure 6C,D; Table S6). The regulatory effects of these TF members in modulating JA and ABA levels have already been verified. For instance, SlERF15/16 in tomato [24] and CpWRKY50 in papaya [60] have been reported to promote JA biosynthesis, while tomato ERF.D2 [61] could repress the expression of JA biosynthetic genes. MdMYBS1 can activate the MdNCED1 expression to enhance the accumulation of ABA in apple [32]. Strawberry FaASR functions as transcriptional repressors of ABA catabolism by directly binding to the FaCYP707A4 promoter and inhibiting its expression [33]. In tomato, overexpression of SlERF.D3 reduced ABA levels by activating the expression of ABA-catabolism gene CYP707A2, thus delaying fruit ripening [62]. Cucumber CsEIN3 could directly bind to the promoter of CsCYP707A4 and activate its expression, thus promoting branch development [63]. Collectively, the observed differential expression of AdOPR3 and AdCYP707A4, along with the strong co-expression patterns of candidate DETFs, provides a correlative framework and suggests the presence of specific transcriptional regulators governing their expression. Thus, further concrete validation, such as promoter analysis, a regulatory effects assay, and functional characterization are required to elucidate the regulatory roles of these candidate DETFs in JA or ABA metabolism.
Supplementary Materials
The following supporting information can be downloaded at: https://www.mdpi.com/article/10.3390/horticulturae12010066/s1, Table S1: Primers used for RT-qPCR. Table S2: All 126 differentially accumulated metabolites (DAMs) with |Log2FC| ≥ 1, FDR < 0.05, and VIP ≥ 1. Table S3: KEGG enrichment analysis of DAMs. Table S4: All differentially expressed genes identified through RNA-seq. Table S5: Expression of 27 JA biosynthetic genes and 22 ABA metabolic genes based on RNA-seq data. Table S6: Candidate DETFs that showed high correlation with AdOPR3 or AdCYP707A4 (correlation > 0.9).
Author Contributions
Conceptualization, X.-Y.S. and Y.-Y.W.; methodology, X.-Y.L.; validation, X.-Y.S., X.-Y.L.; formal analysis, X.-Y.L.; investigation, X.-Y.S.; data curation, X.-Y.S., X.-Y.L.; writing—original draft preparation, X.-Y.S.; writing—review and editing, Y.-Y.W., C.-J.W. and X.-R.Y.; visualization, X.-Y.S. and X.-Y.L.; supervision, Y.-Y.W.; project administration, X.-R.Y.; funding acquisition, Y.-Y.W., C.-J.W. and X.-R.Y. All authors have read and agreed to the published version of the manuscript.
Funding
This research was funded by the Postdoctoral Research Foundation of Anhui Agricultural University (03087003), High-level Talent Funds of Anhui Agricultural University (rc322302; rc322405) and Anhui Provincial Project for the Commercialization of Agricultural Scientific and Technological Achievements (2025AHSZH30).
Data Availability Statement
The data supporting the findings of this study are included in the article and supplementary materials. Further inquiries can be directed to the corresponding author(s).
Acknowledgments
This research was supported by the Postdoctoral Research Foundation of Anhui Agricultural University (03087003), High-level Talent Funds of Anhui Agricultural University (rc322302; rc322405) and Anhui Provincial Project for the Commercialization of Agricultural Scientific and Technological Achievements (2025AHSZH30).
Conflicts of Interest
The authors declare no conflicts of interest.
References
- Kou, X.; Feng, Y.; Yuan, S.; Zhao, X.; Wu, C.; Wang, C.; Xue, Z. Different regulatory mechanisms of plant hormones in the ripening of climacteric and non-climacteric fruits: A review. Plant Mol. Biol. 2021, 107, 477–497. [Google Scholar] [CrossRef] [PubMed]
- Zheng, X.; Gong, M.; Zhang, Q.; Tan, H.; Li, L.; Tang, Y.; Li, Z.; Peng, M.; Deng, W. Metabolism and regulation of ascorbic acid in fruits. Plants 2022, 11, 1602. [Google Scholar] [CrossRef]
- Zhu, G.; Wang, S.; Huang, Z.; Zhang, S.; Liao, Q.; Zhang, C.; Lin, T.; Qin, M.; Peng, M.; Yang, C.; et al. Rewiring of the fruit metabolome in tomato breeding. Cell 2018, 172, 249–261. [Google Scholar] [CrossRef]
- Wang, S.; Alseekh, S.; Fernie, A.R.; Luo, J. The structure and function of major plant metabolite modifications. Mol. Plant 2019, 12, 899–919. [Google Scholar] [CrossRef]
- Xiao, P.; Qu, J.; Wang, Y.; Fang, T.; Xiao, W.; Wang, Y.; Zhang, Y.; Khan, M.; Chen, Q.; Xu, X.; et al. Transcriptome and metabolome atlas reveals contributions of sphingosine and chlorogenic acid to cold tolerance in Citrus. Plant Physiol. 2024, 196, 634–650. [Google Scholar] [CrossRef]
- Shu, P.; Zhang, Z.; Wu, Y.; Chen, Y.; Li, K.; Deng, H.; Zhang, J.; Zhang, X.; Wang, J.; Liu, Z.; et al. A comprehensive metabolic map reveals major quality regulations in red-flesh kiwifruit (Actinidia chinensis). New Phytol. 2023, 238, 2064–2079. [Google Scholar] [CrossRef]
- Fàbregas, N.; Fernie, A.R. The interface of central metabolism with hormone signaling in plants. Curr. Biol. 2021, 31, R1535–R1548. [Google Scholar] [CrossRef]
- Depuydt, S.; Hardtke, C.S. Hormone signalling crosstalk in plant growth regulation. Curr. Biol. 2011, 21, R365–R373. [Google Scholar] [CrossRef] [PubMed]
- Antala, M.; Sytar, O.; Rastogi, A.; Brestic, M. Potential of karrikins as novel plant growth regulators in agriculture. Plants 2019, 9, 43. [Google Scholar] [CrossRef] [PubMed]
- Thilakarathne, A.S.; Liu, F.; Zou, Z. Plant signaling hormones and transcription factors: Key regulators of plant responses to growth, development, and stress. Plants 2025, 14, 1070. [Google Scholar] [CrossRef]
- Zhang, X.; Zhu, T.; Zhang, W.; Zhang, Y.; Zhang, J.; Yang, J.; Xia, C.; Zhao, H.; Yu, Y.; Wen, C. Ethylene promotes branch formation but inhibits tendril development in cucumber. Nat. Commun. 2025. [Google Scholar] [CrossRef]
- Liu, Y.; Du, M.; Deng, L.; Shen, J.; Fang, M.; Chen, Q.; Lu, Y.; Wang, Q.; Li, C.; Zhai, Q. MYC2 regulates the termination of jasmonate signaling via an autoregulatory negative feedback loop. Plant Cell 2019, 31, 106–127. [Google Scholar] [CrossRef]
- Yue, P.; Jiang, Z.; Sun, Q.; Wei, R.; Yin, Y.; Xie, Z.; Larkin, R.M.; Ye, J.; Chai, L.; Deng, X. Jasmonate activates a CsMPK6-CsMYC2 module that regulates the expression of β-citraurin biosynthetic genes and fruit coloration in orange (Citrus sinensis). Plant Cell 2022, 35, 1167–1185. [Google Scholar] [CrossRef]
- Li, T.; Xu, Y.; Zhang, L.; Ji, Y.; Tan, D.; Yuan, H.; Wang, A. The jasmonate-activated transcription factor MdMYC2 regulates ETHYLENE RESPONSE FACTOR and ethylene biosynthetic genes to promote ethylene biosynthesis during apple fruit ripening. Plant Cell 2017, 29, 1316–1334. [Google Scholar] [CrossRef]
- Sun, Q.; He, Z.; Feng, D.; Wei, R.; Zhang, Y.; Ye, J.; Chai, L.; Xu, J.; Cheng, Y.; Xu, Q.; et al. The abscisic acid-responsive transcriptional regulatory module CsERF110–CsERF53 orchestrates citrus fruit coloration. Plant Commun. 2024, 5, 101065. [Google Scholar] [CrossRef] [PubMed]
- Chen, X.; Gao, J.; Shen, Y. Abscisic acid controls sugar accumulation essential to strawberry fruit ripening via the FaRIPK1-FaTCP7-FaSTP13/FaSPT module. Plant J. 2024, 119, 1400–1417. [Google Scholar] [CrossRef] [PubMed]
- Wasternack, C.; Hause, B. Jasmonates: Biosynthesis, perception, signal transduction and action in plant stress response, growth and development. An update to the 2007 review in Annals of Botany. Ann. Bot. 2013, 111, 1021–1058. [Google Scholar] [CrossRef] [PubMed]
- Li, M.; Yu, G.; Cao, C.; Liu, P. Metabolism, signaling, and transport of jasmonates. Plant Commun. 2021, 2, 100231. [Google Scholar] [CrossRef]
- Park, J.-H.; Halitschke, R.; Kim, H.B.; Baldwin, I.T.; Feldmann, K.A.; Feyereisen, R. A knock-out mutation in allene oxide synthase results in male sterility and defective wound signal transduction in Arabidopsis due to a block in jasmonic acid biosynthesis. Plant J. 2002, 31, 1–12. [Google Scholar] [CrossRef]
- Sun, T.; Chen, Y.; Feng, A.; Zou, W.; Wang, D.; Lin, P.; Chen, Y.; You, C.; Que, Y.; Su, Y. The allene oxide synthase gene family in sugarcane and its involvement in disease resistance. Ind. Crops Prod. 2023, 192, 116136. [Google Scholar] [CrossRef]
- Sun, T.; Wu, Q.; Zang, S.; Zou, W.; Wang, D.; Wang, W.; Shen, L.; Zhang, S.; Su, Y.; Que, Y. Molecular insights into OPR gene family in Saccharum identified a ScOPR2 gene could enhance plant disease resistance. Plant J. 2024, 120, 335–353. [Google Scholar] [CrossRef] [PubMed]
- Yang, L.; Sun, Q.; Geng, B.; Shi, J.; Zhu, H.; Sun, Y.; Yang, Q.; Yang, B.; Guo, Z. Jasmonate biosynthesis enzyme allene oxide cyclase 2 mediates cold tolerance and pathogen resistance. Plant Physiol. 2023, 193, 1621–1634. [Google Scholar] [CrossRef] [PubMed]
- Wang, L.; Chen, H.; Chen, G.; Luo, G.; Shen, X.; Ouyang, B.; Bie, Z. Transcription factor SlWRKY50 enhances cold tolerance in tomato by activating the jasmonic acid signaling. Plant Physiol. 2024, 194, 1075–1090. [Google Scholar] [CrossRef]
- Hu, C.; Wei, C.; Ma, Q.; Dong, H.; Shi, K.; Zhou, Y.; Foyer, C.H.; Yu, J. Ethylene response factors 15 and 16 trigger jasmonate biosynthesis in tomato during herbivore resistance. Plant Physiol. 2021, 185, 1182–1197. [Google Scholar] [CrossRef]
- Seo, M.; Koshiba, T. Complex regulation of ABA biosynthesis in plants. Trends Plant Sci. 2002, 7, 41–48. [Google Scholar] [CrossRef]
- Kumar, S.; Shah, S.H.; Vimala, Y.; Jatav, H.S.; Ahmad, P.; Chen, Y.; Siddique, K.H.M. Abscisic acid: Metabolism, transport, crosstalk with other plant growth regulators, and its role in heavy metal stress mitigation. Front. Plant Sci. 2022, 13, 972856. [Google Scholar] [CrossRef]
- Singh, A.; Roychoudhury, A. Abscisic acid in plants under abiotic stress: Crosstalk with major phytohormones. Plant Cell Rep. 2023, 42, 961–974. [Google Scholar] [CrossRef]
- Rock, C.D.; Zeevaart, J.A. The aba mutant of Arabidopsis thaliana is impaired in epoxy-carotenoid biosynthesis. Proc. Natl. Acad. Sci. USA 1991, 88, 7496–7499. [Google Scholar] [CrossRef]
- Tan, B.C.; Schwartz, S.H.; Zeevaart, J.A.D.; McCarty, D.R. Genetic control of abscisic acid biosynthesis in maize. Proc. Natl. Acad. Sci. USA 1997, 94, 12235–12240. [Google Scholar] [CrossRef]
- Galpaz, N.; Wang, Q.; Menda, N.; Zamir, D.; Hirschberg, J. Abscisic acid deficiency in the tomato mutant high-pigment 3 leading to increased plastid number and higher fruit lycopene content. Plant J. 2008, 53, 717–730. [Google Scholar] [CrossRef]
- Chen, K.; Li, G.J.; Bressan, R.A.; Song, C.P.; Zhu, J.K.; Zhao, Y. Abscisic acid dynamics, signaling, and functions in plants. J. Integr. Plant Biol. 2020, 62, 25–54. [Google Scholar] [CrossRef]
- Jia, D.; Li, Y.; Jia, K.; Huang, B.; Dang, Q.; Wang, H.; Wang, X.; Li, C.; Zhang, Y.; Nie, J.; et al. Abscisic acid activates transcription factor module MdABI5–MdMYBS1 during carotenoid-derived apple fruit coloration. Plant Physiol. 2024, 195, 2053–2072. [Google Scholar] [CrossRef]
- Jia, H.; Shi, Y.; Dai, Z.; Sun, Y.; Shu, X.; Li, B.; Wu, R.; Lv, S.; Shou, J.; Yang, X.; et al. Phosphorylation of the strawberry MADS-box CMB1 regulates ripening via the catabolism of abscisic acid. New Phytol. 2025, 246, 1627–1646. [Google Scholar] [CrossRef] [PubMed]
- Huang, H.; Ferguson, A.R. Review: Kiwifruit in China. N. Z. J. Crop Hortic. Sci. 2001, 29, 1–14. [Google Scholar] [CrossRef]
- Richardson, D.P.; Ansell, J.; Drummond, L.N. The nutritional and health attributes of kiwifruit: A review. Eur. J. Nutr. 2018, 57, 2659–2676. [Google Scholar] [CrossRef] [PubMed]
- James, C.A.; Welham, S.; Rose, P. Update on the global prevalence and severity of kiwifruit allergy: A scoping review. Int. J. Food Sci. Technol. 2023, 58, 6158–6181. [Google Scholar] [CrossRef]
- Nieuwenhuizen, N.J.; Chen, X.; Wang, M.Y.; Matich, A.J.; Perez, R.L.; Allan, A.C.; Green, S.A.; Atkinson, R.G. Natural variation in monoterpene synthesis in kiwifruit: Transcriptional regulation of terpene synthases by NAC and ETHYLENE-INSENSITIVE3-like transcription factors. Plant Physiol. 2015, 167, 1243–1258. [Google Scholar] [CrossRef]
- Wang, W.Q.; Moss, S.M.A.; Zeng, L.; Espley, R.V.; Wang, T.; Lin-Wang, K.; Fu, B.L.; Schwinn, K.E.; Allan, A.C.; Yin, X.R. The red flesh of kiwifruit is differentially controlled by specific activation-repression systems. New Phytol. 2022, 235, 630–645. [Google Scholar] [CrossRef]
- Zeng, Z.; Li, Y.; Zhu, M.; Wang, X.; Wang, Y.; Li, A.; Chen, X.; Han, Q.; Nieuwenhuizen, N.J.; Ampomah-Dwamena, C.; et al. Kiwifruit spatiotemporal multiomics networks uncover key tissue-specific regulatory processes throughout the life cycle. Plant Physiol. 2024, 197, kiae567. [Google Scholar] [CrossRef]
- Wang, R.; Shu, P.; Zhang, C.; Zhang, J.; Chen, Y.; Zhang, Y.; Du, K.; Xie, Y.; Li, M.; Ma, T.; et al. Integrative analyses of metabolome and genome-wide transcriptome reveal the regulatory network governing flavor formation in kiwifruit (Actinidia chinensis). New Phytol. 2022, 233, 373–389. [Google Scholar] [CrossRef]
- Wu, Y.Y.; Wang, L.L.; Lin, Y.L.; Li, X.; Liu, X.F.; Xu, Z.H.; Fu, B.L.; Wang, W.Q.; Allan, A.C.; Tu, M.Y.; et al. AcHZP45 is a repressor of chlorophyll biosynthesis and activator of chlorophyll degradation in kiwifruit. J. Exp. Bot. 2024, 75, 204–218. [Google Scholar] [CrossRef]
- Chen, W.; Gong, L.; Guo, Z.; Wang, W.; Zhang, H.; Liu, X.; Yu, S.; Xiong, L.; Luo, J. A novel integrated method for large-scale detection, identification, and quantification of widely targeted metabolites: Application in the study of rice metabolomics. Mol. Plant 2013, 6, 1769–1780. [Google Scholar] [CrossRef] [PubMed]
- Fraga, C.G.; Clowers, B.H.; Moore, R.J.; Zink, E.M. Signature-discovery approach for sample matching of a nerve-agent precursor using liquid chromatography−mass spectrometry, XCMS, and chemometrics. Anal. Chem. 2010, 82, 4165–4173. [Google Scholar] [CrossRef] [PubMed]
- Pilkington, S.M.; Crowhurst, R.; Hilario, E.; Nardozza, S.; Fraser, L.; Peng, Y.; Gunaseelan, K.; Simpson, R.; Tahir, J.; Deroles, S.C.; et al. A manually annotated Actinidia chinensis var. chinensis (kiwifruit) genome highlights the challenges associated with draft genomes and gene prediction in plants. BMC Genom. 2018, 19, 257. [Google Scholar] [CrossRef]
- Kumar, S.; Pandey, A.K. Chemistry and biological activities of flavonoids: An overview. Sci. World J. 2013, 2013, 162750. [Google Scholar] [CrossRef]
- Huang, X.Y.; Wang, C.K.; Zhao, Y.W.; Sun, C.H.; Hu, D.G. Mechanisms and regulation of organic acid accumulation in plant vacuoles. Hortic. Res. 2021, 8, 227. [Google Scholar] [CrossRef]
- Pilkington, S.M.; Montefiori, M.; Galer, A.L.; Neil Emery, R.J.; Allan, A.C.; Jameson, P.E. Endogenous cytokinin in developing kiwifruit is implicated in maintaining fruit flesh chlorophyll levels. Ann. Bot. 2013, 112, 57–68. [Google Scholar] [CrossRef]
- Sorce, C.; Montanaro, G.; Bottega, S.; Spanò, C. Indole-3-acetic acid metabolism and growth in young kiwifruit berry. Plant Growth Regul. 2017, 82, 505–515. [Google Scholar] [CrossRef]
- Yang, T.; Deng, L.; Wang, Q.; Sun, C.; Ali, M.; Wu, F.; Zhai, H.; Xu, Q.; Xin, P.; Cheng, S.; et al. Tomato CYP94C1 inactivates bioactive JA-Ile to attenuate jasmonate-mediated defense during fruit ripening. Mol. Plant 2024, 17, 509–512. [Google Scholar] [CrossRef]
- Zheng, X.; Mo, W.; Zuo, Z.; Shi, Q.; Chen, X.; Zhao, X.; Han, J. From regulation to application: The role of abscisic acid in seed and fruit development and agronomic production strategies. Int. J. Mol. Sci. 2024, 25, 12024. [Google Scholar] [CrossRef] [PubMed]
- Jia, H.F.; Chai, Y.M.; Li, C.L.; Lu, D.; Luo, J.J.; Qin, L.; Shen, Y.Y. Abscisic acid plays an important role in the regulation of strawberry fruit ripening. Plant Physiol. 2011, 157, 188–199. [Google Scholar] [CrossRef] [PubMed]
- Wu, S.; Wu, D.; Song, J.; Zhang, Y.; Tan, Q.; Yang, T.; Yang, J.; Wang, S.; Xu, J.; Xu, W.; et al. Metabolomic and transcriptomic analyses reveal new insights into the role of abscisic acid in modulating mango fruit ripening. Hortic. Res. 2022, 9, uhac102. [Google Scholar] [CrossRef]
- Chen, S.Y.; Kuo, S.R.; Chien, C.T. Roles of gibberellins and abscisic acid in dormancy and germination of red bayberry (Myrica rubra) seeds. Tree Physiol. 2008, 28, 1431–1439. [Google Scholar] [CrossRef]
- Sun, Y.; Liang, B.; Wang, J.; Kai, W.; Chen, P.; Jiang, L.; Du, Y.; Leng, P. SlPti4 affects regulation of fruit ripening, seed germination and stress responses by modulating aba signaling in tomato. Plant Cell Physiol. 2018, 59, 1956–1965. [Google Scholar] [CrossRef]
- Chehab, E.W.; Kim, S.; Savchenko, T.; Kliebenstein, D.; Dehesh, K.; Braam, J. Intronic T-DNA insertion renders Arabidopsis opr3 a conditional jasmonic acid-producing mutant. Plant Physiol. 2011, 156, 770–778. [Google Scholar] [CrossRef]
- Scalschi, L.; Sanmartín, M.; Camañes, G.; Troncho, P.; Sánchez-Serrano, J.J.; García-Agustín, P.; Vicedo, B. Silencing of OPR3 in tomato reveals the role of OPDA in callose deposition during the activation of defense responses against Botrytis cinerea. Plant J. 2015, 81, 304–315. [Google Scholar] [CrossRef] [PubMed]
- Zou, W.; Sun, T.; Chen, Y.; Wang, D.; You, C.; Zang, S.; Lin, P.; Wu, Q.; Su, Y.; Que, Y. Sugarcane ScOPR1 gene enhances plant disease resistance through the modulation of hormonal signaling pathways. Plant Cell Rep. 2024, 43, 158. [Google Scholar] [CrossRef]
- Liao, X.; Li, M.; Liu, B.; Yan, M.; Yu, X.; Zi, H.; Liu, R.; Yamamuro, C. Interlinked regulatory loops of ABA catabolism and biosynthesis coordinate fruit growth and ripening in woodland strawberry. Proc. Natl. Acad. Sci. USA 2018, 115, E11542–E11550. [Google Scholar] [CrossRef]
- Kumar, R.; Khurana, A.; Sharma, A.K. Role of plant hormones and their interplay in development and ripening of fleshy fruits. J. Exp. Bot. 2014, 65, 4561–4575. [Google Scholar] [CrossRef]
- Yang, M.; Zhou, C.; Kuang, R.; Wu, X.; Liu, C.; He, H.; Wei, Y. Transcription factor CpWRKY50 enhances anthracnose resistance by promoting jasmonic acid signaling in papaya. Plant Physiol. 2024, 196, 2856–2870. [Google Scholar] [CrossRef] [PubMed]
- Zhu, C.; Li, X.; Zhang, M.; Wang, S.; Jing, B.; Hu, C.; Thomas, H.R.; Zhou, Y.; Yu, J.; Hu, Z. ERF.D2 negatively controls drought tolerance through synergistic regulation of abscisic acid and jasmonic acid in tomato. Plant Biotechnol. J. 2025, 23, 3363–3381. [Google Scholar] [CrossRef] [PubMed]
- Hu, K.; Geng, M.; Ma, L.; Yao, G.; Zhang, M.; Zhang, H. The H2S-responsive transcription factor ERF.D3 regulates tomato abscisic acid metabolism, leaf senescence, and fruit ripening. Plant Physiol. 2025, 197, kiae560. [Google Scholar] [CrossRef] [PubMed]
- Zhang, Z.; Han, H.; Zhao, J.; Liu, Z.; Deng, L.; Wu, L.; Niu, J.; Guo, Y.; Wang, G.; Gou, X.; et al. Peptide hormones in plants. Mol. Hortic. 2025, 5, 7. [Google Scholar] [CrossRef] [PubMed]
Disclaimer/Publisher’s Note: The statements, opinions and data contained in all publications are solely those of the individual author(s) and contributor(s) and not of MDPI and/or the editor(s). MDPI and/or the editor(s) disclaim responsibility for any injury to people or property resulting from any ideas, methods, instructions or products referred to in the content. |
© 2026 by the authors. Licensee MDPI, Basel, Switzerland. This article is an open access article distributed under the terms and conditions of the Creative Commons Attribution (CC BY) license.