Article

Semantic Alignment and Knowledge Injection for Cross-Modal Reasoning in Intelligent Horticultural Decision Support Systems

1
China Agricultural University, Beijing 100083, China
2
National School of Development, Peking University, Beijing 100871, China
*
Author to whom correspondence should be addressed.
These authors contributed equally to this work.
Horticulturae 2026, 12(1), 23; https://doi.org/10.3390/horticulturae12010023
Submission received: 21 November 2025 / Revised: 18 December 2025 / Accepted: 23 December 2025 / Published: 25 December 2025
(This article belongs to the Special Issue Artificial Intelligence in Horticulture Production)

Abstract

This study was conducted to address the demand for interpretable intelligent recognition of fruit tree diseases in smart horticultural environments. A KAD-Former framework integrating an agricultural knowledge graph with a visual Transformer was proposed and systematically validated through extensive cross-regional, multi-variety, and multi-disease experiments. The primary objective of this work was to overcome the limitations of conventional deep models, including insufficient interpretability, unstable recognition of weak disease features, and poor cross-regional generalization. In the experimental evaluation, the model achieved significant advantages across multiple representative tasks: in the overall performance comparison, KAD-Former reached an accuracy of 0.946 , an F1-score of 0.933 , and a mAP of 0.938 , outperforming classical models such as ResNet50, EfficientNet, and Swin-T. In the cross-regional generalization assessment, a DGS of 0.933 was obtained, notably surpassing competing models. In terms of explainability consistency, a Consistency@5 score of 0.826 indicated strong alignment between the model’s attention regions and expert annotations. The ablation experiments further demonstrated that the three core modules—AKG (agricultural knowledge graph), SAM (semantic alignment module), and KGA (knowledge-guided attention)—each contributed substantially to final performance, with the complete model exhibiting the best results. These findings collectively demonstrate the comprehensive advantages of KAD-Former in disease classification, symptom localization, model interpretability, and cross-domain transfer. The proposed method not only achieved state-of-the-art performance in pure visual tasks but also advanced knowledge-enhanced and interpretable reasoning by emulating the diagnostic logic employed by agricultural experts in real orchard scenarios. Through the integration of the agricultural knowledge graph, semantic alignment, and knowledge-guided attention, the model maintained stable performance under challenging conditions such as complex illumination, background noise, and weak lesion features, while exhibiting strong robustness in cross-region and cross-variety transfer tests. Furthermore, the experimental results indicated that the approach enhanced fine-grained recognition capabilities for various fruit tree diseases, including apple ring rot, brown spot, powdery mildew, and downy mildew.

1. Introduction

Fruit diseases represent one of the major limiting factors affecting yield stability, high productivity, and quality assurance in horticultural production [1]. In practical production, diseases reduce leaf photosynthetic capacity, degrade fruit quality, and cause substantial economic losses [2]. With the rapid expansion of orchard scale and the increasing adoption of intelligent management technologies, traditional manual scouting and experience-based diagnosis have become insufficient to meet the demands for efficiency, accuracy, and real-time disease warning in modern agriculture [3]. Historically, fruit disease diagnosis has relied heavily on human expertise, where farmers and agricultural specialists infer disease categories based on species, environmental conditions, and symptomatic patterns [4]. Although such manual approaches offer flexibility, they are limited by low efficiency, strong subjectivity, and an inability to support large-scale continuous monitoring [5]. Early-stage symptoms, such as subtle discoloration or fine speckles, are particularly difficult to detect, leading to misdiagnosis and intensifying the risk of disease spread [6].
To improve diagnostic efficiency, various traditional image-processing and machine-learning-based methods were introduced [7,8]. Early work utilized SVM or Random Forest models based on low-level visual cues like color and texture [9]. However, these methods rely heavily on handcrafted features and lack the robustness required to address complex lesion structures or natural illumination variation [10]. Recent deep learning advances, particularly convolutional neural networks (CNNs), have markedly improved identification by learning hierarchical features [11,12]. Despite capturing texture and color cues effectively [13], CNN-based architectures struggle with long-range dependencies essential for spatially dispersed lesions or large-scale background interference [14,15]. Vision Transformers (ViT) and self-attention-based variants like Swin Transformer have addressed these global modeling needs [16,17,18]. However, a persistent challenge is that these models remain black-box decision processes that obscure symptom-related attention mechanisms [19,20].
To mitigate the opacity of deep models, recent research has begun integrating structured agricultural knowledge graphs (KGs) to represent crop–disease relationships, phenological stages, and environmental factors [21,22,23]. For example, studies have combined EfficientNet with KGs to boost accuracy [24], or used large language models for disease detection reasoning [25]. Other works have fused Transformers with pest-disease KGs for real-time edge diagnosis [26,27,28]. Despite these advancements, a critical gap remains: most existing approaches are restricted to rule-based retrieval or shallow knowledge querying without deeply integrating visual and knowledge modalities [29,30]. Models solely relying on visual cues cannot emulate expert-level diagnostic logic, whereas current knowledge-fusion techniques lack tight coupling with visual features, failing to provide knowledge-level constraints during the feature extraction process.
Furthermore, explainability remains a bottleneck for deployment [31,32]. Standard interpretability tools like Grad-CAM are fundamentally posterior visual-gradient-based methods that often fail to align with agricultural domain knowledge [33,34]. For instance, such methods may highlight background textures without considering whether lesion boundaries exhibit specific ring-like structures or discoloration signatures defined by agronomists [35,36]. Counterfactual or visualization methods still operate solely within the visual modality and remain disconnected from agricultural semantics, causing their explanations to diverge from expert reasoning [37,38].
This study introduces the Knowledge-Augmented Disease Transformer (KAD-Former) to overcome these constraints. Unlike previous vision-only or shallow-fusion models, KAD-Former deeply integrates an Agricultural Knowledge Graph (AKG) into a visual transformer through a unified reasoning framework. This study provides the following innovative contributions:
1.
A fruit-disease-oriented AKG is constructed to structurally represent symptom–disease–stage semantic relationships, providing a foundation for explainability rather than simple classification.
2.
A Semantic Alignment Module (SAM) is proposed to bridge the gap between low-level visual tokens and high-level symptom nodes, ensuring that visual features are grounded in structured agricultural semantics.
3.
A Knowledge-Guided Attention (KGA) module is designed to replace data-driven attention with knowledge-anchored weights, directly addressing the black-box nature of standard Transformers by forcing the model to attend to regions consistent with expert diagnostic logic.
4.
Through the multi-source, multi-region dataset constructed here, we demonstrate that KAD-Former outperforms conventional deep models in accuracy and cross-regional generalization, providing a transparent and trustworthy solution for real-world horticultural environments.

2. Materials and Method

2.1. Data Collection

The dataset utilized in this study was constructed using multi-source heterogeneous data, encompassing real orchard images, agricultural diagnostic platform data, publicly available online datasets, and symptom-disease records provided by agricultural experts. It covers four major fruit tree species—apple, pear, grape, and peach—and their representative diseases, as shown in Table 1 and Figure 1. Real orchard data collection was conducted from March 2023 to October 2024 across four regions: Bayan Nur (Inner Mongolia), Tangshan (Hebei), Mengzi (Yunnan), and Qixia (Shandong). High-resolution RGB cameras (Sony a7R IV, resolution 9504 × 6336 ) were used under natural lighting conditions to capture images of fruit tree leaves and fruits. Various shooting angles, including top view, side view, and backlit positions, were employed to ensure sufficient diversity in illumination, perspective, and background complexity. During data acquisition, different disease categories, such as ring rot, brown spot, black spot, and powdery mildew, were annotated on-site by agricultural technicians, recording lesion regions, affected organs, and disease stages (early/mid/late), resulting in structured symptom descriptions. To ensure the availability of weakly-expressed samples, additional images were captured at multiple positions for symptoms with early discoloration, small punctate lesions, or blurry lesion boundaries, thereby enhancing the model’s ability to learn subtle visual patterns. Data from agricultural disease and pest diagnostic platforms were primarily obtained from provincial agricultural extension stations, with image resolutions ranging from 1024 × 768 to 3000 × 2000 . These images include detailed symptom descriptions, representative case samples, and disease progression information, which supplement mid-to-late stage disease features that are difficult to capture frequently in real orchard settings. Publicly available images were sourced from PlantVillage, Kaggle, and other open research datasets, rigorously filtered to ensure consistency between disease types and annotations, while removing duplicates, low-quality samples, and any content with potential copyright issues. Expert knowledge in text form was compiled by multiple agricultural pathologists between 2023 and 2024, covering pathogen classification, symptom characteristics, disease occurrence patterns, susceptible parts, and semantic associations among different diseases. This expert-curated textual knowledge was used to construct the entity nodes and relational structures of the agricultural knowledge graph (AKG) prior to model training. The AKG was built exclusively from expert texts and agronomic references and remained fixed during the train/validation/test split as well as during model training and inference, without incorporating information derived from the image data or evaluation sets. The final dataset therefore exhibits high diversity in terms of geography, growth stages, image acquisition conditions, and disease types, while maintaining strict annotation consistency. This design ensures that the AKG provides stable and unbiased semantic priors for knowledge-enhanced reasoning and cross-regional generalization evaluation.

2.2. Dataset Enhancement

In fruit disease identification tasks, data preprocessing and augmentation serve not only as conventional means for improving model generalization but also as essential steps for adapting to real-world orchard environments characterized by diverse illumination conditions, heterogeneous backgrounds, and multiple cultivars. Because lesions frequently exhibit weak visual cues, high intra-class variation, and strong dependence on imaging conditions, appropriate augmentation strategies enable the simulation of realistic orchard visual distributions during training, thereby reducing overfitting to specific acquisition conditions. This section details the principles and mathematical formulations of enhancement techniques including color and brightness processing, lesion-region–aware structural enhancement, cross-domain randomization, multi-scale transformations, and pseudo-lesion simulation, demonstrating how these strategies provide a robust data foundation for knowledge-driven fruit disease identification.

2.2.1. Basic Image Enhancement

Color augmentation and brightness normalization first operate on the global visual distribution of an image by adjusting color-space statistics, enabling the model to experience a wide range of perturbations during training and thus reducing overfitting to specific lighting or imaging scenarios. Let the original image be denoted as I, with its color components represented as I c for c { R , G , B } . Color augmentation can be modeled as a channel-wise perturbation transformation T color , expressed as
I c = α c I c + β c ,
where α c controls color scaling and β c controls color shift. Brightness normalization aims to reduce intensity variations induced by illumination differences through the transformation
I = I μ σ ,
where μ and σ denote the brightness mean and standard deviation of I, respectively. This normalization encourages the model to focus on texture, spot morphology, and boundary variations rather than illumination artifacts, thereby enhancing lesion discriminability.
In real orchard images, lesions typically occupy only small local regions of leaves or fruits, making region-structured augmentations—such as lesion-aware CutMix and weakly supervised lesion enhancement—highly effective for improving robustness under occlusion, noise interference, and underexposure. The core idea of CutMix is to generate mixed samples through region replacement. Let two images be I A and I B with corresponding labels y A and y B . The augmented sample is defined as
I = M I A + ( 1 M ) I B ,
where M is a randomly generated binary mask and ⊙ denotes element-wise multiplication. In fruit disease settings, designing M as a soft mask targeting lesion regions enables structured lesion information transfer. Weakly supervised cues such as lesion points or coarse boundary annotations can be used to generate the soft mask M:
M = G ( S ) ,
where S denotes weak supervision signals and G represents operators such as Gaussian smoothing or morphological dilation. This approach exposes the model to a wide spectrum of “lesion visibility variations,” better aligning training distributions with real orchard monitoring conditions.

2.2.2. Cross-Domain Simulation Enhancement

Cross-region domain randomization aims to simulate variations caused by different geographical locations, acquisition devices, and seasonal conditions so that the model can learn lesion structural features that are invariant to domain-specific styles. Let the source domain be D s and the target domain be D t . Domain randomization seeks a transformation T dr that minimizes the distance between the transformed source domain D s and D t :
D s = T dr ( D s ) s . t . d ( D s , D t ) 0 ,
where d ( · ) may be computed using distribution metrics such as MMD or FID. Typical transformations include background texture replacement, color-style randomization, noise injection, and illumination simulations reflecting different regional environments. By amplifying intra-domain variation, the model learns robustness against non-structural factors, preventing domain discrepancy from becoming a major performance bottleneck.
Multi-scale cropping and pseudo-lesion simulation further strengthen model adaptability to lesion size variation, positional differences, and morphological diversity. Because fruit lesions range from small brown spots to large decayed regions, multi-scale characteristics must be modeled explicitly. Multi-scale cropping can be viewed as a scale transformation T scale applied to image I, defined as
I = T scale ( I , s ) , s [ s min , s max ] ,
where the scale factor s is sampled randomly. By controlling the cropping area and scaling ratio, the model learns both local fine-grained textures and global lesion distribution patterns. This strategy is particularly effective for early-stage weak lesions such as faint mildew or small scab spots.

2.2.3. Pseudo-Lesion Simulation Enhancement

Pseudo-lesion simulation is designed to address sample scarcity in mild, moderate, or specific morphological lesion categories by synthesizing lesion-like regions that approximate real disease patterns through color perturbation, texture noise, and boundary diffusion. Let the pseudo-lesion generator be F pseudo , defined as
S ˜ = F pseudo ( R , θ ) ,
where R is the geometric region of the synthetic lesion and θ controls attributes such as texture, color, and edge diffusion. The final augmented image is expressed as
I = I ( 1 S ˜ ) + C S ˜ ,
where C represents a texture–color simulation pattern fitted from real lesions. This augmentation enables the model to learn diverse lesion patterns and significantly enhances early-symptom recognition.
Overall, the dataset enhancement strategies described in this section—from global illumination normalization to structured lesion manipulation, domain randomization, and multi-scale or synthetic lesion generation—form a multidimensional augmentation framework that strengthens model generalization and robustness under complex field conditions. Within the proposed knowledge-augmented disease identification architecture, these enhancements further ensure diverse and realistic visual inputs, enabling stable knowledge-driven reasoning and interpretable analysis. As a result, the overall diagnostic performance and reliability of the system are substantially improved.

2.3. Proposed Method

2.3.1. Overall

In the proposed method, the preprocessed and annotated data are initially fed into the visual backbone network in the form of disease images. The backbone employs a Transformer-based encoder that divides the input image into multiple visual tokens and progressively extracts multi-scale representations from local textures to global lesion distributions through iterative layers of self-attention and feed-forward networks. This process yields a high-dimensional visual feature sequence containing information on lesion color variations, spot morphology, edge structures, and spatial layouts. Parallel to the visual branch, an agricultural knowledge graph construction module encodes the tri-level entities of “fruit tree–disease–symptom” and the semantic relations among them (e.g., disease–symptom, symptom–stage, and symptom–location) into a graph-structured representation. This graph is subsequently processed through a graph encoder and embedding network, transforming nodes and relational edges into low-dimensional semantic vectors suitable for downstream reasoning, resulting in a set of knowledge embeddings with explicit agricultural semantics.
The semantic alignment and knowledge injection module then receives both the visual feature sequence from the visual backbone and the symptom or disease semantic vectors generated from the knowledge graph. These two modalities are first projected and normalized into a unified semantic feature space. Within this space, similarity metrics are applied to quantify the association strength between each visual token and various symptom nodes, thereby enabling soft alignment from “image region” to “symptom concept.” Based on this alignment, the module reweights and reconstructs the visual tokens that are highly correlated with specific symptoms, allowing subsequent attention computations to focus more precisely on potential lesion regions and key symptom structures. Following semantic alignment, the reconstructed visual features and the knowledge embeddings are jointly passed into the knowledge-enhanced attention module. In this module, the visual features serve as the query, while the symptom or disease knowledge vectors act as the keys and values. A multi-head attention mechanism is employed to explicitly model the correspondence between image regions and relevant symptom knowledge, and to determine which symptoms best explain the current prediction. This attention-guided interaction enables knowledge-aware feature selection and aggregation at the attention weight level. After several layers of knowledge-enhanced attention, the model maintains its original visual discrimination capability while aligning its feature representation semantically with agricultural knowledge. The final disease class is predicted through a classification head, and attention distributions corresponding to knowledge nodes, along with symptom response maps, are exported via a visualization interface. This results in a joint output of disease classification and symptom-level interpretability, thereby completing an end-to-end closed loop from visual perception to knowledge reasoning to interpretable decision-making.

2.3.2. Agricultural Knowledge Graph (AKG)

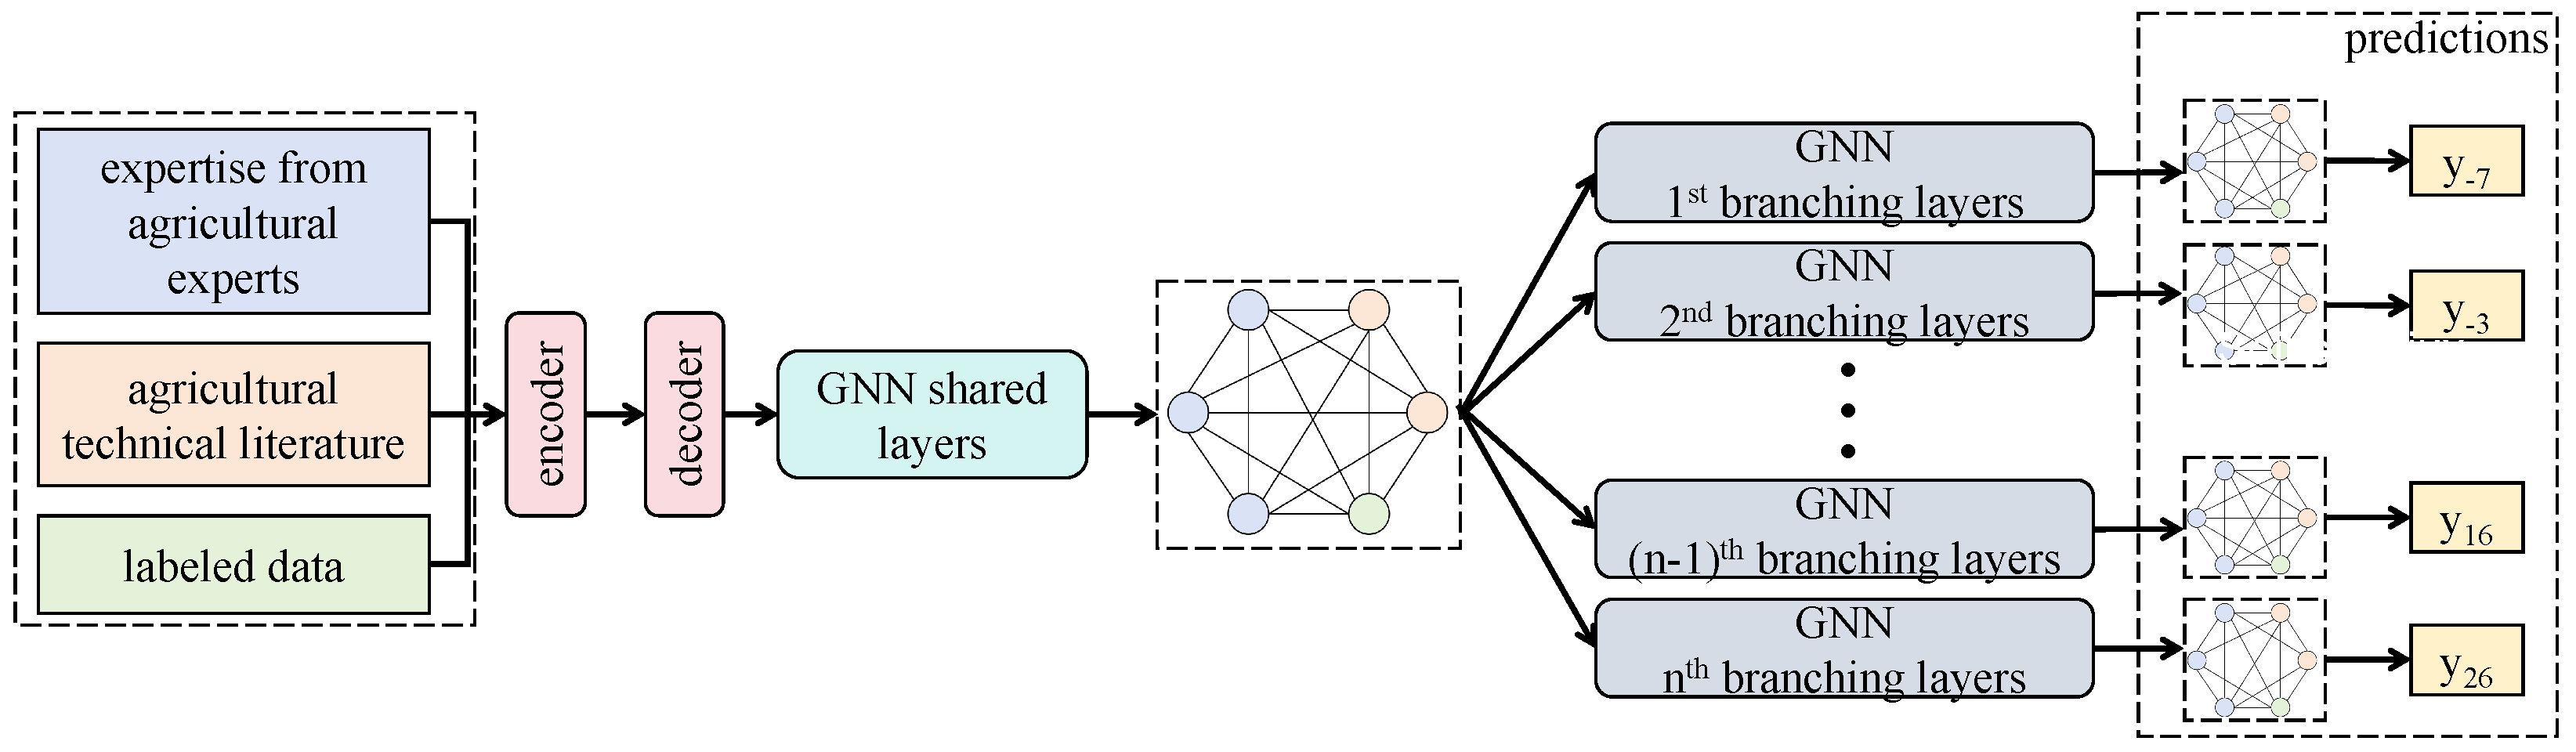
The agricultural knowledge graph (AKG) construction and enhancement module is designed to explicitly inject structured horticultural knowledge into the deep inference pipeline, so that disease recognition is guided by expert semantics rather than relying purely on visual correlations. As illustrated in Figure 2, the AKG framework comprises (i) a graph construction layer, (ii) a graph encoding layer, and (iii) an edge-aware knowledge distillation (EAKD) module. These components are coupled with graph neural network (GNN) propagation to yield semantically enriched knowledge embeddings that can be directly consumed by subsequent alignment and knowledge-guided attention modules.
The AKG contains heterogeneous entities, including fruit tree species, disease categories, symptom concepts, disease stages, and affected locations. Based on agronomic literature, expert diagnostic records, and manual annotations, we construct a multi-relational graph with relation types such as species–disease, disease–symptom, symptom–stage, and symptom–location. To assign meaningful priors to nodes, each node v i is associated with a short expert-defined textual description T i , rather than using randomly initialized embeddings. Concretely, T i is formed by concatenating the node name with curated attribute phrases extracted from expert notes and reference materials (e.g., typical lesion color/shape, boundary characteristics, affected organ, and progression cues). This design ensures that semantically similar nodes (e.g., symptoms describing “powdery layer” or “concentric rings”) start with nearby representations even before graph propagation.
A Transformer-based text encoder is employed to convert T i into a dense semantic vector. Given the tokenized sequence T i = { w 1 , , w n i } , the encoder outputs contextual token embeddings
H i = Enc text ( T i ) R n i × d t ,
where d t denotes the hidden size. We then apply a pooling operation to obtain a fixed-length node representation, using either the [CLS] token embedding or mean pooling:
e i = Pool ( H i ) R d t .
To ensure dimensional compatibility with the graph encoder and the knowledge-guided attention module, e i is projected into the AKG embedding space:
x i ( 0 ) = W 0 e i + b 0 R d k ,
where d k is the knowledge embedding dimension used throughout the AKG–SAM–KGA pipeline. In practice, the text encoder can be initialized from a pretrained language model and optionally domain-adapted via masked language modeling on collected agricultural texts (expert reports and platform descriptions), improving its representation of domain-specific terminology. During end-to-end training, the text encoder can be frozen for stability in early epochs and lightly fine-tuned later with a smaller learning rate, so that node semantics better align with visual evidence without overfitting.
To model hierarchical and heterogeneous knowledge structures, we adopt a multi-layer GNN with shared and type-specific branching layers. Shared layers aggregate global context across all entities, while branching layers perform relation-aware propagation for different semantic categories (species, diseases, and symptoms), enabling both holistic integration and fine-grained differentiation. Through iterative message passing and fusion, the AKG produces globally consistent yet category-sensitive knowledge embeddings, which subsequently serve as semantic anchors for cross-modal alignment and knowledge-guided attention, thereby supporting robust and interpretable disease reasoning.
Formally, the update of node representations can be expressed as:
h i ( l + 1 ) = σ j N ( i ) W r ( l ) h j ( l ) ,
where r denotes the relation type and W r ( l ) is the relation-specific propagation matrix. This relation-aware propagation allows the structural differences between various symptoms and diseases to be explicitly modeled. For instance, the “light halo–dark center” pattern in marssonina blotch and the “concentric ring structure” in ring rot result in distinct adjacency patterns, yielding discriminative vector representations through the graph encoder.
To further enhance the model’s sensitivity to marginal symptom features, the edge-aware knowledge distillation module (EAKD) is introduced. This module enforces alignment between visual edge features and symptom descriptions from the knowledge graph, thereby encouraging the knowledge embedding to focus on high-frequency attributes such as lesion boundaries and texture transitions. Specifically, a lightweight edge detection network is employed to extract visual edge features E ( I ) , while symptom descriptions associated with edge variations are used to generate knowledge edge vectors E ( K ) . A distillation loss is then defined as:
L EAKD = E ( I ) E ( K ) 2 2 ,
to constrain semantic consistency between the two. This design imparts prior awareness of lesion boundary structures during the graph encoding stage.
Furthermore, to ensure numerical and semantic compatibility between the knowledge graph embeddings and the output of the visual backbone, a projection layer with parameters W p R d k × d v is appended to the tail of the graph encoder, where d k and d v denote the dimensions of the knowledge and visual tokens, respectively. This projection maps knowledge representations into the visual space, providing unified vector formats for subsequent semantic alignment. Through structured representation and edge-level distillation constraints, the output knowledge embeddings from AKG go beyond compressed textual semantics to encode graph topology, hierarchical semantics, and edge-related patterns. These enriched embeddings effectively guide the model in recognizing subtle spots, early-stage discoloration, and complex textures that are difficult to distinguish. In the fruit tree disease recognition task, this knowledge-driven enhancement significantly improves the model’s sensitivity to fine-grained symptom structures and aligns the reasoning process more closely with the diagnostic logic of agricultural experts, thereby enhancing both robustness and interpretability in cross-regional and cross-varietal transfer scenarios.

2.3.3. Semantic Alignment Module (SAM)

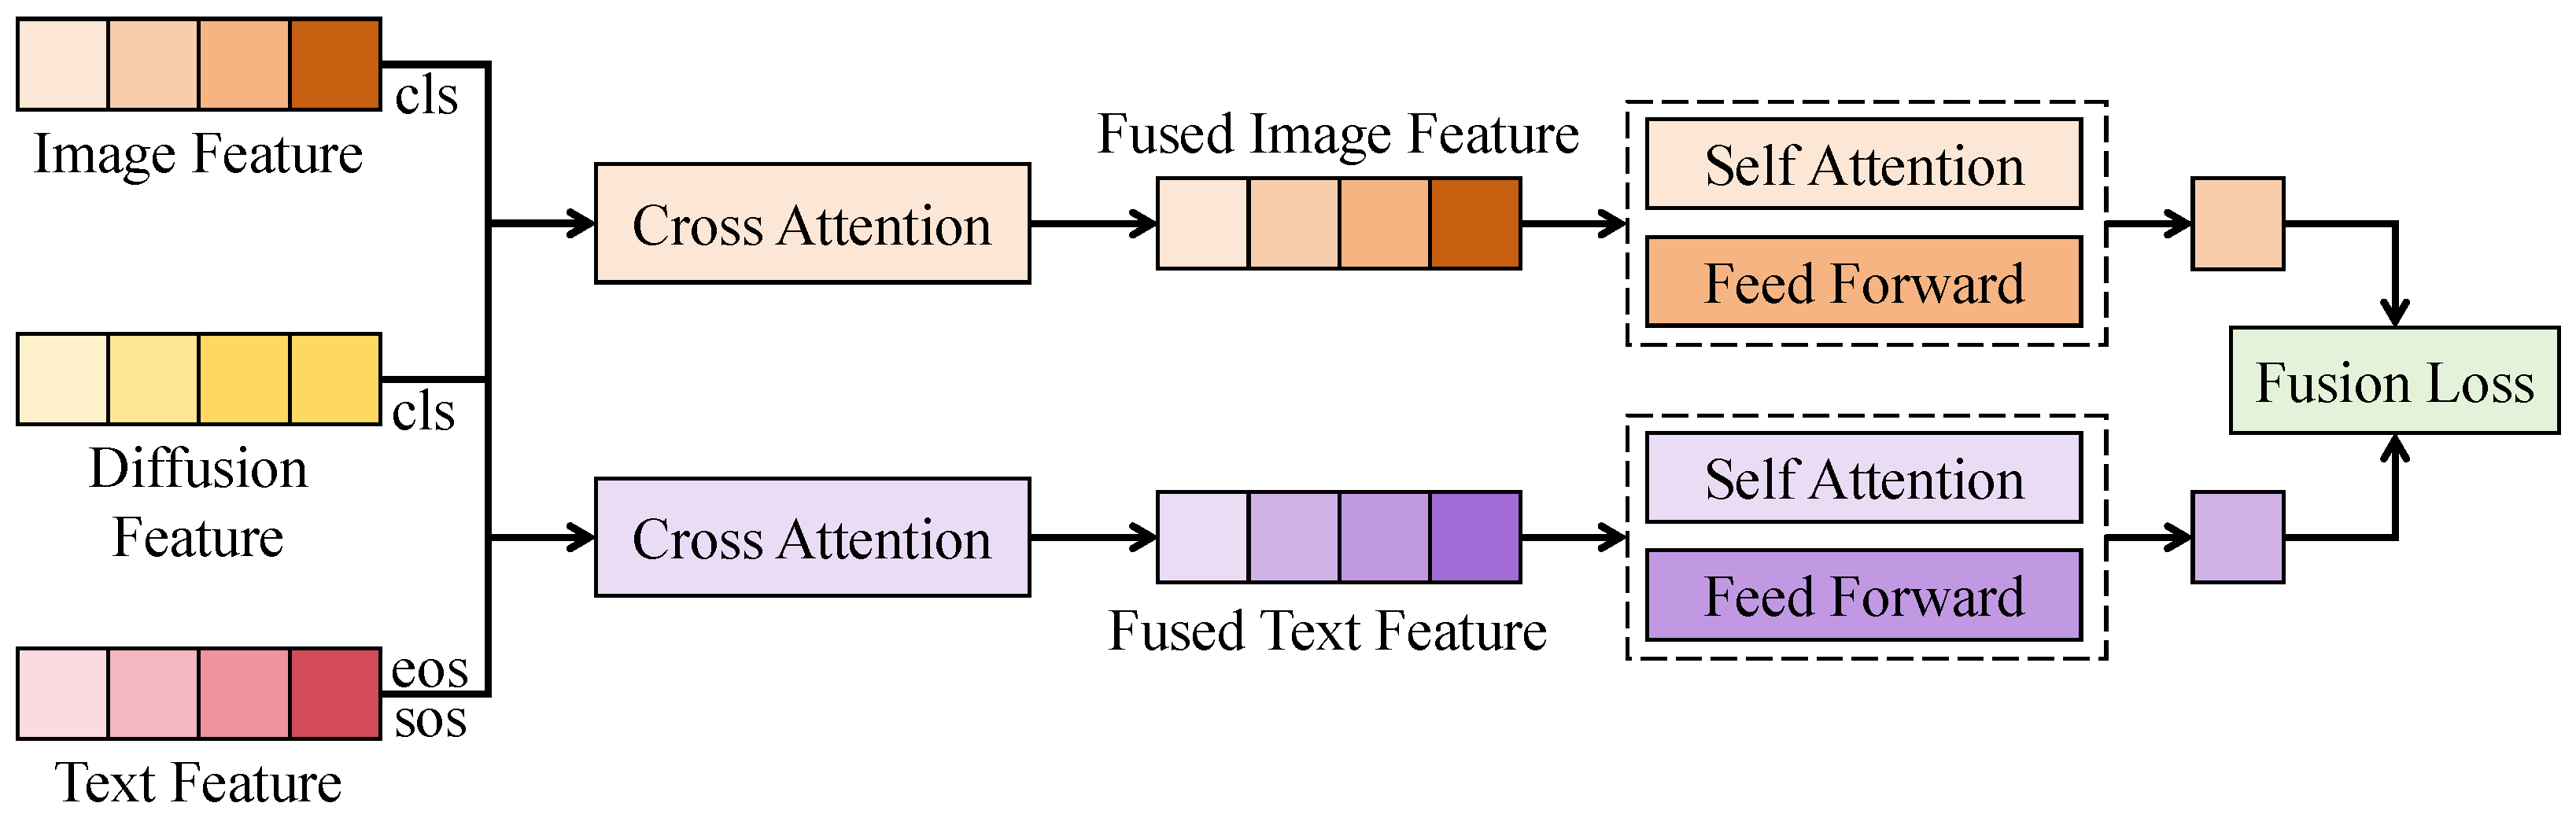
The primary objective of the semantic alignment module (SAM) is to project the disease-related visual features extracted by the visual backbone and the semantic representations of symptom and disease nodes derived from the agricultural knowledge graph into a unified embedding space, such that subsequent knowledge-enhanced attention can perform cross-modal association on a common representation basis. As shown in Figure 3, the image features encoded by the visual backbone (e.g., a ViT encoder) are organized into a spatial grid of size H × W = 14 × 14 and flattened along the channel dimension to form a matrix X v R N v × C v , where N v = 196 visual tokens and C v = 768 channels. Meanwhile, the agricultural knowledge graph, after GNN propagation and encoding, produces symptom and disease semantic representations X k R N k × C k , where N k denotes the number of knowledge nodes (approximately N k 200 across different fruits and diseases) and C k = 256 denotes the embedding dimension.
To enable comparability between modalities, SAM first linearly projects both representations into a shared semantic space of dimension d s = 512 via
Z v = X v W v + 1 b v , Z k = X k W k + 1 b k ,
where W v R C v × d s and W k R C k × d s are trainable weights, b v , b k R d s are bias vectors, and 1 is an all-ones vector of size N v or N k . The resulting Z v R N v × d s and Z k R N k × d s serve as the pre-alignment visual and knowledge token embeddings, which are then processed by a dual-stream Transformer for deeper semantic alignment. Following the architecture illustrated in the module diagram, SAM consists of two stacked alignment blocks, each containing both self-attention and cross-attention stages. The channel width is maintained at d s = 512 , with h = 8 attention heads, each of dimension d h = d s / h = 64 .
In the first stage, self-attention is independently applied to Z v and Z k to enhance internal structural consistency. For the visual modality, self-attention is computed as
SelfAttn v ( Z v ) = softmax Q v K v d h V v ,
where Q v = Z v W v Q , K v = Z v W v K , and V v = Z v W v V , with W v Q , W v K , W v V R d s × d s . Knowledge self-attention SelfAttn k ( Z k ) is defined analogously. This step aggregates long-range dependencies across visual regions and strengthens topological symptom–disease associations in the knowledge branch, providing structured priors for cross-modal alignment.
In the second stage, SAM introduces a bidirectional cross-attention mechanism to couple visual and knowledge tokens. The alignment of visual tokens guided by knowledge semantics is defined as
Z ^ v = CrossAttn v k ( Z v , Z k ) = softmax Q v K k d h V k ,
with Q v = Z v W v k Q , K k = Z k W v k K , and V k = Z k W v k V . Conversely, the alignment of knowledge tokens conditioned on visual context is
Z ^ k = CrossAttn k v ( Z k , Z v ) = softmax Q k K v d h V v ,
with Q k = Z k W k v Q , K v = Z v W k v K , and V v = Z v W k v V . Through this bidirectional attention, visual tokens redistribute their attention guided by symptom semantics, while knowledge tokens update their contextual meaning based on real image textures and lesion morphology, forming a closed-loop “knowledge-guides-vision, vision-corrects-knowledge” alignment process.
To explicitly constrain alignment quality, SAM introduces a semantic alignment loss that projects the aligned representations ( Z ^ v , Z ^ k ) to disease class semantic centers and minimizes intra-class distance while maximizing inter-class separation. Let c i v and c i k denote the visual and knowledge centers of the i-th disease class. The alignment loss is:
L align = i c i v c i k 2 2 + λ i j max 0 , m c i v c j k 2 ,
where m is a margin and λ a weighting factor. The first term encourages semantic consistency between modalities for the same disease class, while the second maintains sufficient class separation, preventing excessive overlap. Geometrically, minimizing L align constructs a set of multimodal clusters with reduced intra-class variance and enlarged inter-class margins, benefiting subsequent classification and attention reasoning.
The aligned outputs ( Z ^ v , Z ^ k ) are then fed into the knowledge-enhanced attention module (KGA), where
Q kga = Z ^ v , K kga = Z ^ k , V kga = Z ^ k .
Because SAM has already imposed geometric constraints in the shared semantic space, the attention weights computed in KGA reflect the selection of visual tokens relative to specific symptom nodes. Explainability is achieved in this framework by anchoring these weights to the structured semantic entities within the AKG. Compared with attention computed in the original feature space, this knowledge-anchored approach yields two advantages: (1) the visual-knowledge relevance scores possess explicit diagnostic meaning, providing a basis for semantic-level Explainability; (2) the class-wise geometric constraints impart robustness under cross-variety and cross-region distribution shifts by focusing on invariant symptom concepts. Overall, SAM establishes an end-to-end mechanism that maps visual lesion features into a semantically grounded space, ensuring that the model’s diagnostic outputs are not merely results of statistical correlation but are tied to expert-defined symptom descriptions.

2.3.4. Knowledge-Enhanced Attention Module (KGA)

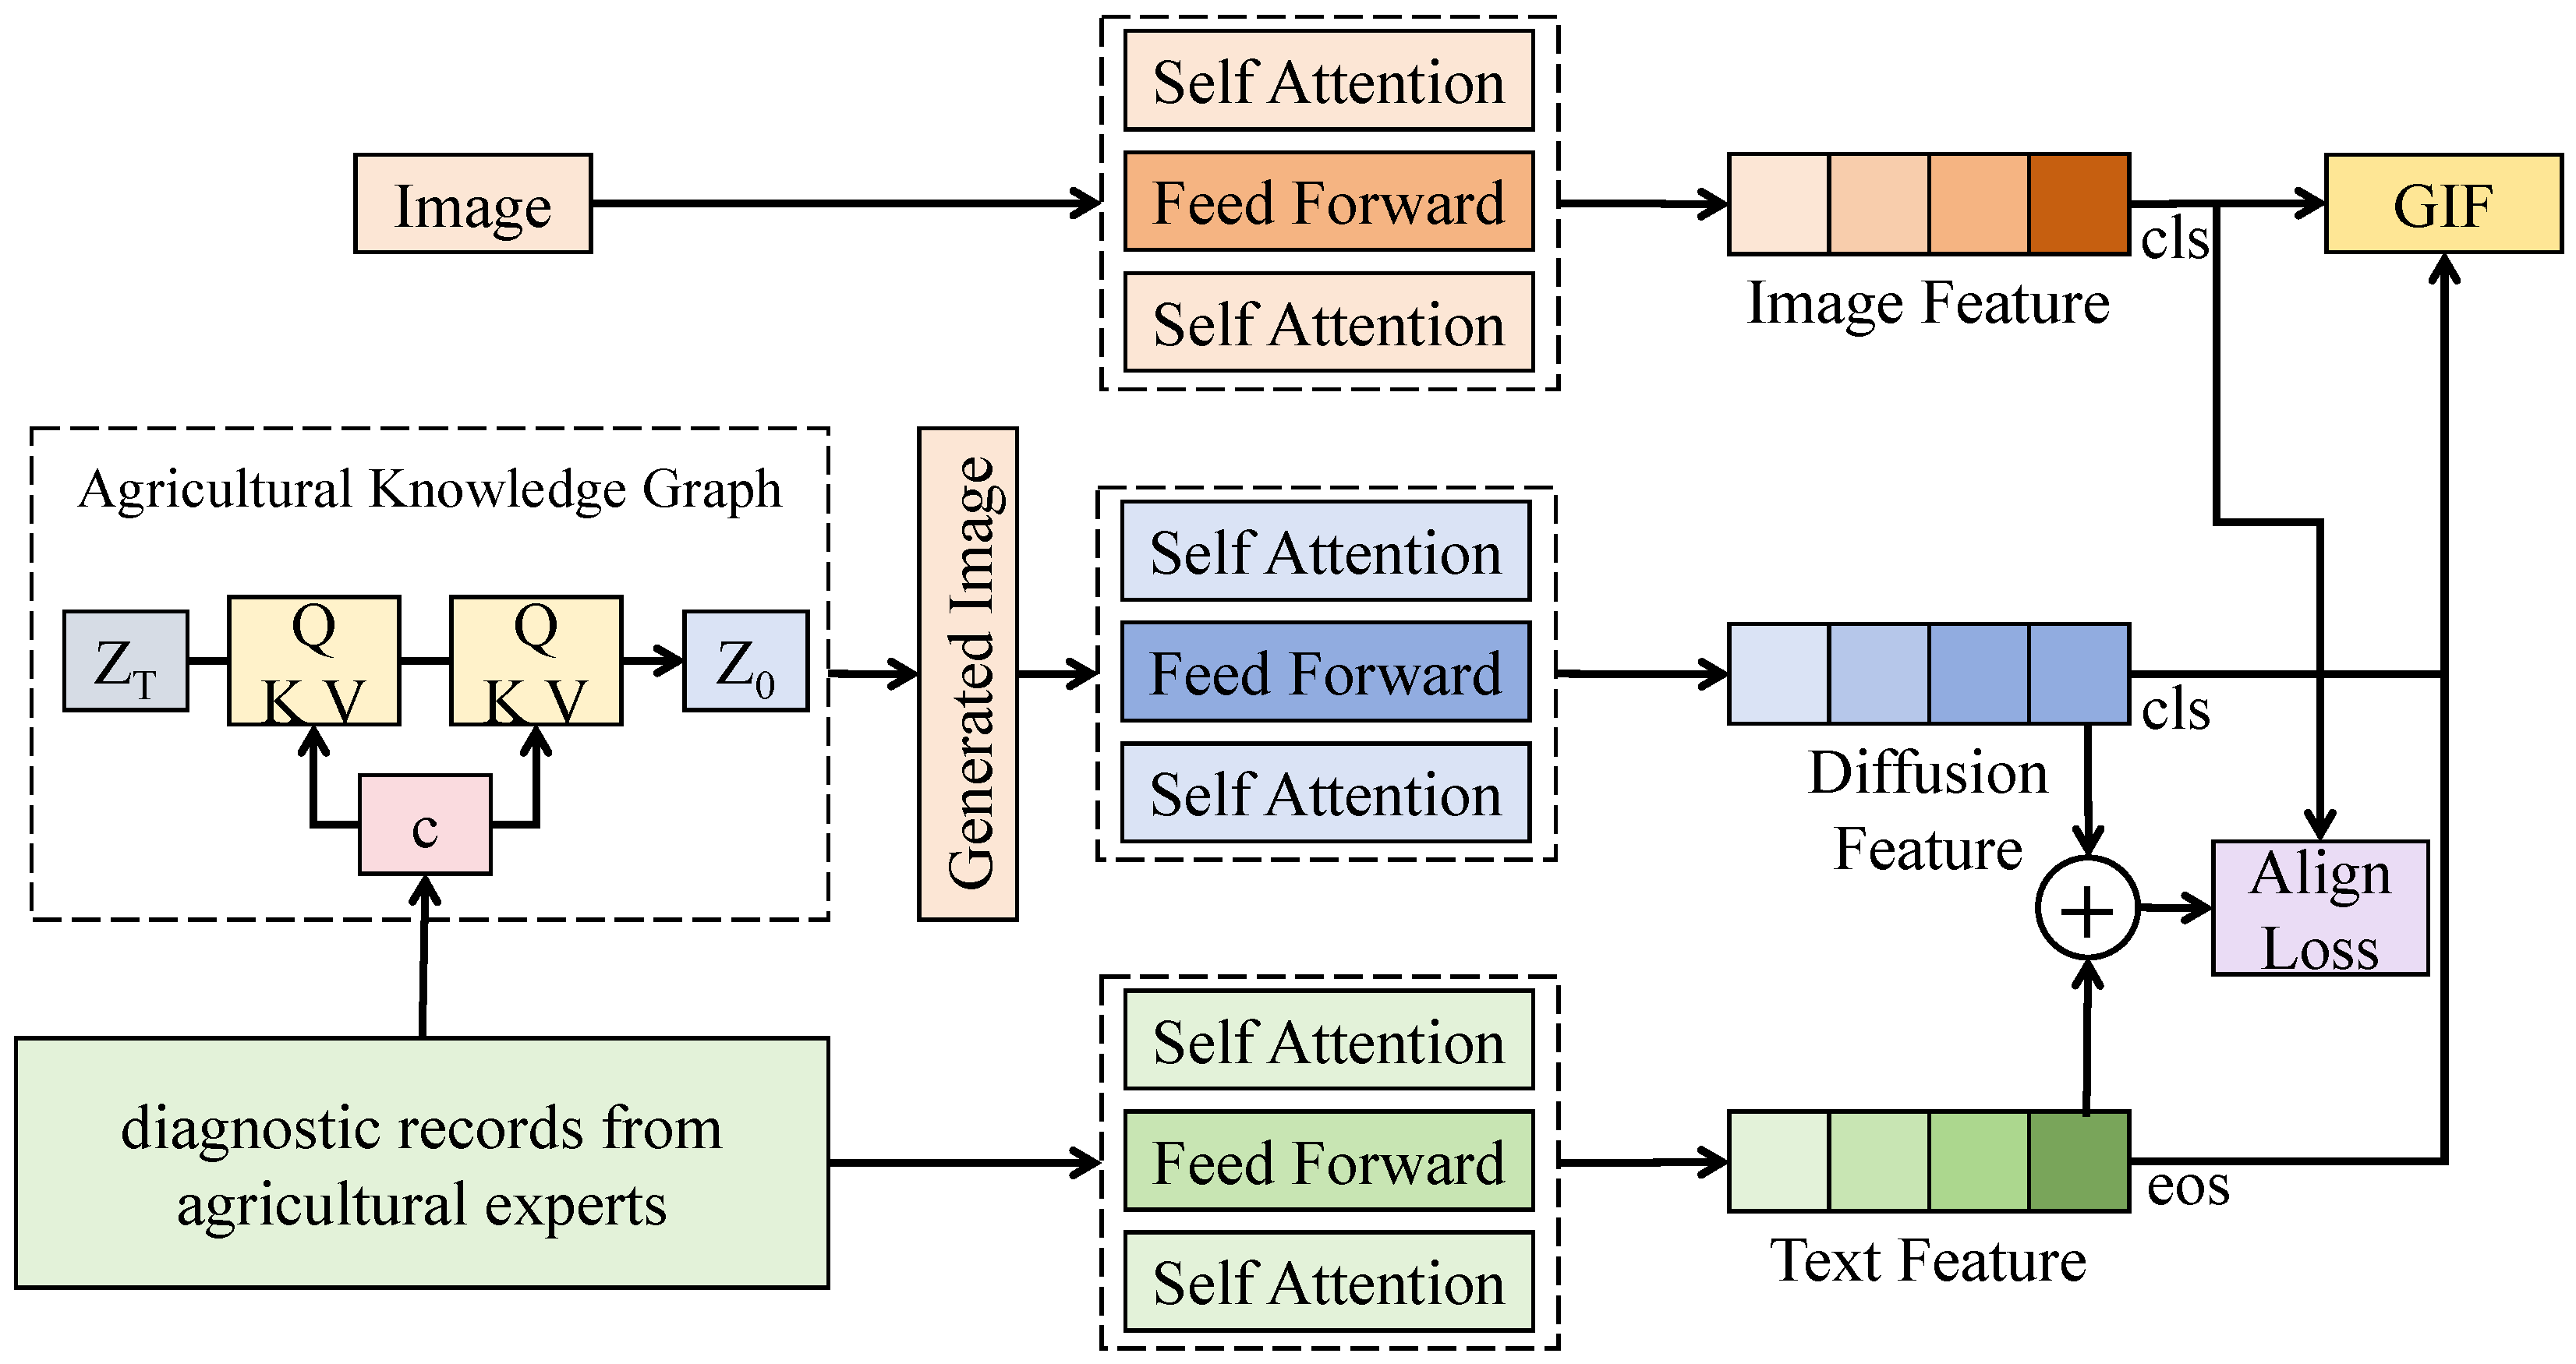
The central principle of the KGA module is to incorporate the embedding of the agricultural knowledge graph directly into the attention computation, ensuring that attention weights are determined not by interactions among visual features alone but by the semantic correspondence between visual features and knowledge vectors. In standard self-attention, Q, K, and V are all projected from visual features X R H × W × C , yielding an internally organized attention structure. In contrast, KGA retains visual features as the query Q, while knowledge embeddings Z R L × d k serve as the keys and values. For instance, given visual patch tokens of dimension C = 768 and spatial size H = W = 14 (196 tokens total), and a knowledge graph producing L = 64 symptom semantic nodes of dimension d k = 256 , KGA first projects visual tokens into the knowledge space so that Q R 196 × d k , while K , V R 64 × d k . Attention is computed as
A = softmax Q K T d k ,
which differs fundamentally from Q X T in self-attention: the weights reflect visual–knowledge relevance rather than visual–visual similarity. Consequently, KGA guides attention toward regions most consistent with disease semantics.
As shown in Figure 4, KGA consists of three parallel knowledge-attention blocks, each comprising a linear mapping layer, a cross-modal attention layer, and a residual fusion layer. The linear mapping reduces visual token dimensionality from 768 to 256 to match knowledge embeddings. A convolutional reconstruction layer reshapes the visual tokens to ( 14 , 14 , 256 ) and applies a 3 × 3 convolution for local spatial smoothing, improving the stability of Q. The cross-modal attention output is
X = A V ,
where V encodes symptom and disease semantics condensed into 64 knowledge nodes. Formally, for visual token x i and knowledge node z j ,
A i j = exp ( f ( x i ) , g ( z j ) ) k exp ( f ( x i ) , g ( z k ) ) ,
where · , · denotes inner product and f , g are linear projections. Thus A i j forms a probability distribution over knowledge nodes, ensuring that symptom-relevant nodes receive higher attention weights and enforcing selective focus on disease-consistent regions.
KGA operates on the semantically aligned visual features produced by SAM, such that Q already resides in a shared semantic coordinate system. Meanwhile, K and V originate from AKG-encoded knowledge vectors, making the computed attention an explicit reflection of expert diagnostic logic. The final output is computed via residual fusion:
Y = X + X ,
yielding a joint representation that integrates both visual patterns and knowledge reasoning. This mechanism substantially improves weak-symptom recognition and cross-regional generalization, because the attention weights are determined by symptom semantics rather than local image textures. As a result, KGA maintains stable behavior under varying illumination, background interference, and cultivar differences. Collectively, KGA provides the theoretical and practical foundations for disease recognition systems in smart horticulture that simultaneously achieve interpretability and robustness.

3. Results and Discussion

3.1. Experimental Configuration

3.1.1. Hardware and Software Platform

For the hardware platform, model training and evaluation were conducted in a high-performance computing environment equipped with multiple NVIDIA A100 GPUs, each providing 80GB of high-bandwidth memory to support the efficient training of large-scale transformer architectures. The server was additionally configured with AMD EPYC 7742-class multi-core processors and 512GB system memory to ensure stable execution of large-scale image loading, knowledge graph construction, and multi-process training workflows. High-performance NVMe solid-state drives were employed to accelerate data input–output operations, thereby preventing I/O latency from becoming a computational bottleneck.
The experimental framework was implemented on an Ubuntu 20.04 LTS operating system. To ensure high-performance computation and modularity, the PyTorch (v2.0.1) deep learning framework was adopted as the primary training interface, integrated with CUDA 11.8 and cuDNN 8.7.0 for hardware acceleration. For the construction and propagation of the agricultural knowledge graph, we utilized DGL (v1.1.2) and PyTorch-Geometric (v2.3.1), which provided the necessary primitives for relation-aware message passing. Image augmentation and preprocessing workflows were managed using OpenCV (v4.8.0) and Albumentations (v1.3.1). Experiment tracking and hyperparameter logging were conducted via Weights & Biases, ensuring the reproducibility of the training trajectories.
Regarding the cross-modal integration, a linear projection layer with parameters W p R d k × d v was implemented at the output of the graph encoder to bridge the dimensionality gap between the knowledge and visual domains. Here, the knowledge embedding dimension was set to d k = 256 , while the visual token dimension from the transformer backbone was d v = 768 . This projection maps the structured semantic vectors into the same 768-dimensional latent space as the visual features, facilitating subsequent semantic alignment. The weights of W p were initialized using Xavier initialization to maintain stable gradient flow during the initial phases of knowledge injection. The dataset was partitioned into training, validation, and test sets using a 70 % , 15 % , and 15 % ratio. We employed the AdamW optimizer with a base learning rate of 1 × 10 4 , a weight decay of 0.05 , and a batch size of 32. To ensure statistical reliability, a 5-fold cross-validation strategy was implemented, yielding a robust performance estimation by mitigating potential distributional bias across different regional data subsets.

3.1.2. Baseline Models and Evaluation Metrics

For model comparison, the following architectures were employed as visual baselines: ResNet50 [39], EfficientNet [40], ViT [41], Swin Transformer [42], DeiT [43], ConvNeXt [44], a pure knowledge-reasoning model (Pure KG) [45], K-ViT [46] and a knowledge-free ViT variant [41]. Model performance was comprehensively evaluated using accuracy, F1-score, mAP, Top-K interpretability consistency, and a cross-regional generalization metric. These indicators quantify classification correctness, the balance between precision and recall, lesion localization quality, alignment between model attention and expert-annotated symptom regions, and the model’s capability to transfer across heterogeneous environments. Mathematically, accuracy is defined as
Accuracy = T P + T N T P + T N + F P + F N ,
where F1-score is governed by precision P and recall R, expressed as
F 1 = 2 P R P + R , P = T P T P + F P , R = T P T P + F N ,
and the mean Average Precision (mAP) is computed over all classes:
mAP = 1 C i = 1 C A P i ,
where C denotes the number of disease categories and A P i is the average precision of the i-th class. The Top-K interpretability consistency metric evaluates the overlap between the model’s attention regions and expert-labeled symptom areas:
Consistency @ K = 1 N j = 1 N I ( Top - K ( A j ) S j ) ,
where A j represents the attention map of the j-th image, S j denotes its expert-annotated symptom region, and I ( · ) is an indicator function. The cross-regional generalization score (DGS) is designed to quantify the relative performance retention of a model when transferred from a source domain to multiple target domains, and is defined as
D G S = 1 M m = 1 M Acc target , m Acc source ,
where M denotes the number of target domains, Acc target , m is the classification accuracy on the m-th target domain, and Acc source represents the accuracy achieved on the source-domain test set. By normalizing target-domain performance with respect to source-domain accuracy, DGS measures the degree to which predictive capability is preserved under domain shift, rather than relying on absolute accuracy alone. From an interpretative perspective, a DGS value close to 1.0 indicates strong cross-domain robustness, meaning that the model maintains comparable performance after transfer. For example, a case where Acc target = 0.5 and Acc source = 0.5 yields D G S 1.0 , reflecting neutral but stable generalization rather than high absolute accuracy. Conversely, DGS values substantially below 1.0 indicate significant performance degradation due to domain discrepancy. In some cases, Acc target may exceed Acc source , resulting in D G S > 1.0 ; this scenario suggests that the target domain is intrinsically easier or better aligned with the learned representation, and should be interpreted as favorable transfer rather than overfitting or metric failure. Conceptually, DGS is related to commonly used performance retention ratios in domain generalization and robustness evaluation, where relative degradation or preservation is emphasized over raw accuracy differences. Compared with absolute target-domain accuracy, DGS provides a normalized and scale-invariant indicator that facilitates fair comparison across models with different source-domain baselines. When reported alongside standard accuracy and F1-score metrics, DGS offers complementary insight into the stability and transferability of disease recognition models across heterogeneous orchard environments. In the above formulations, T P , F P , T N , and F N denote true positives, false positives, true negatives, and false negatives in binary classification settings, while Top - K ( A j ) corresponds to the top-K attention regions used for interpretability evaluation. Together, these metrics enable a comprehensive quantitative assessment of classification performance, lesion localization, interpretability consistency, and cross-regional generalization.

3.2. Comparison of KAD-Former with Baseline Models

The primary objective of this experiment was to compare the overall performance of different deep learning architectures on fruit disease recognition tasks under a unified dataset and evaluation framework. The evaluation focused on five key indicators reflecting overall classification ability, the balance between precision and recall, lesion localization and weak-feature perception, consistency between model attention and expert knowledge, and adaptability to variations in regional data distributions.
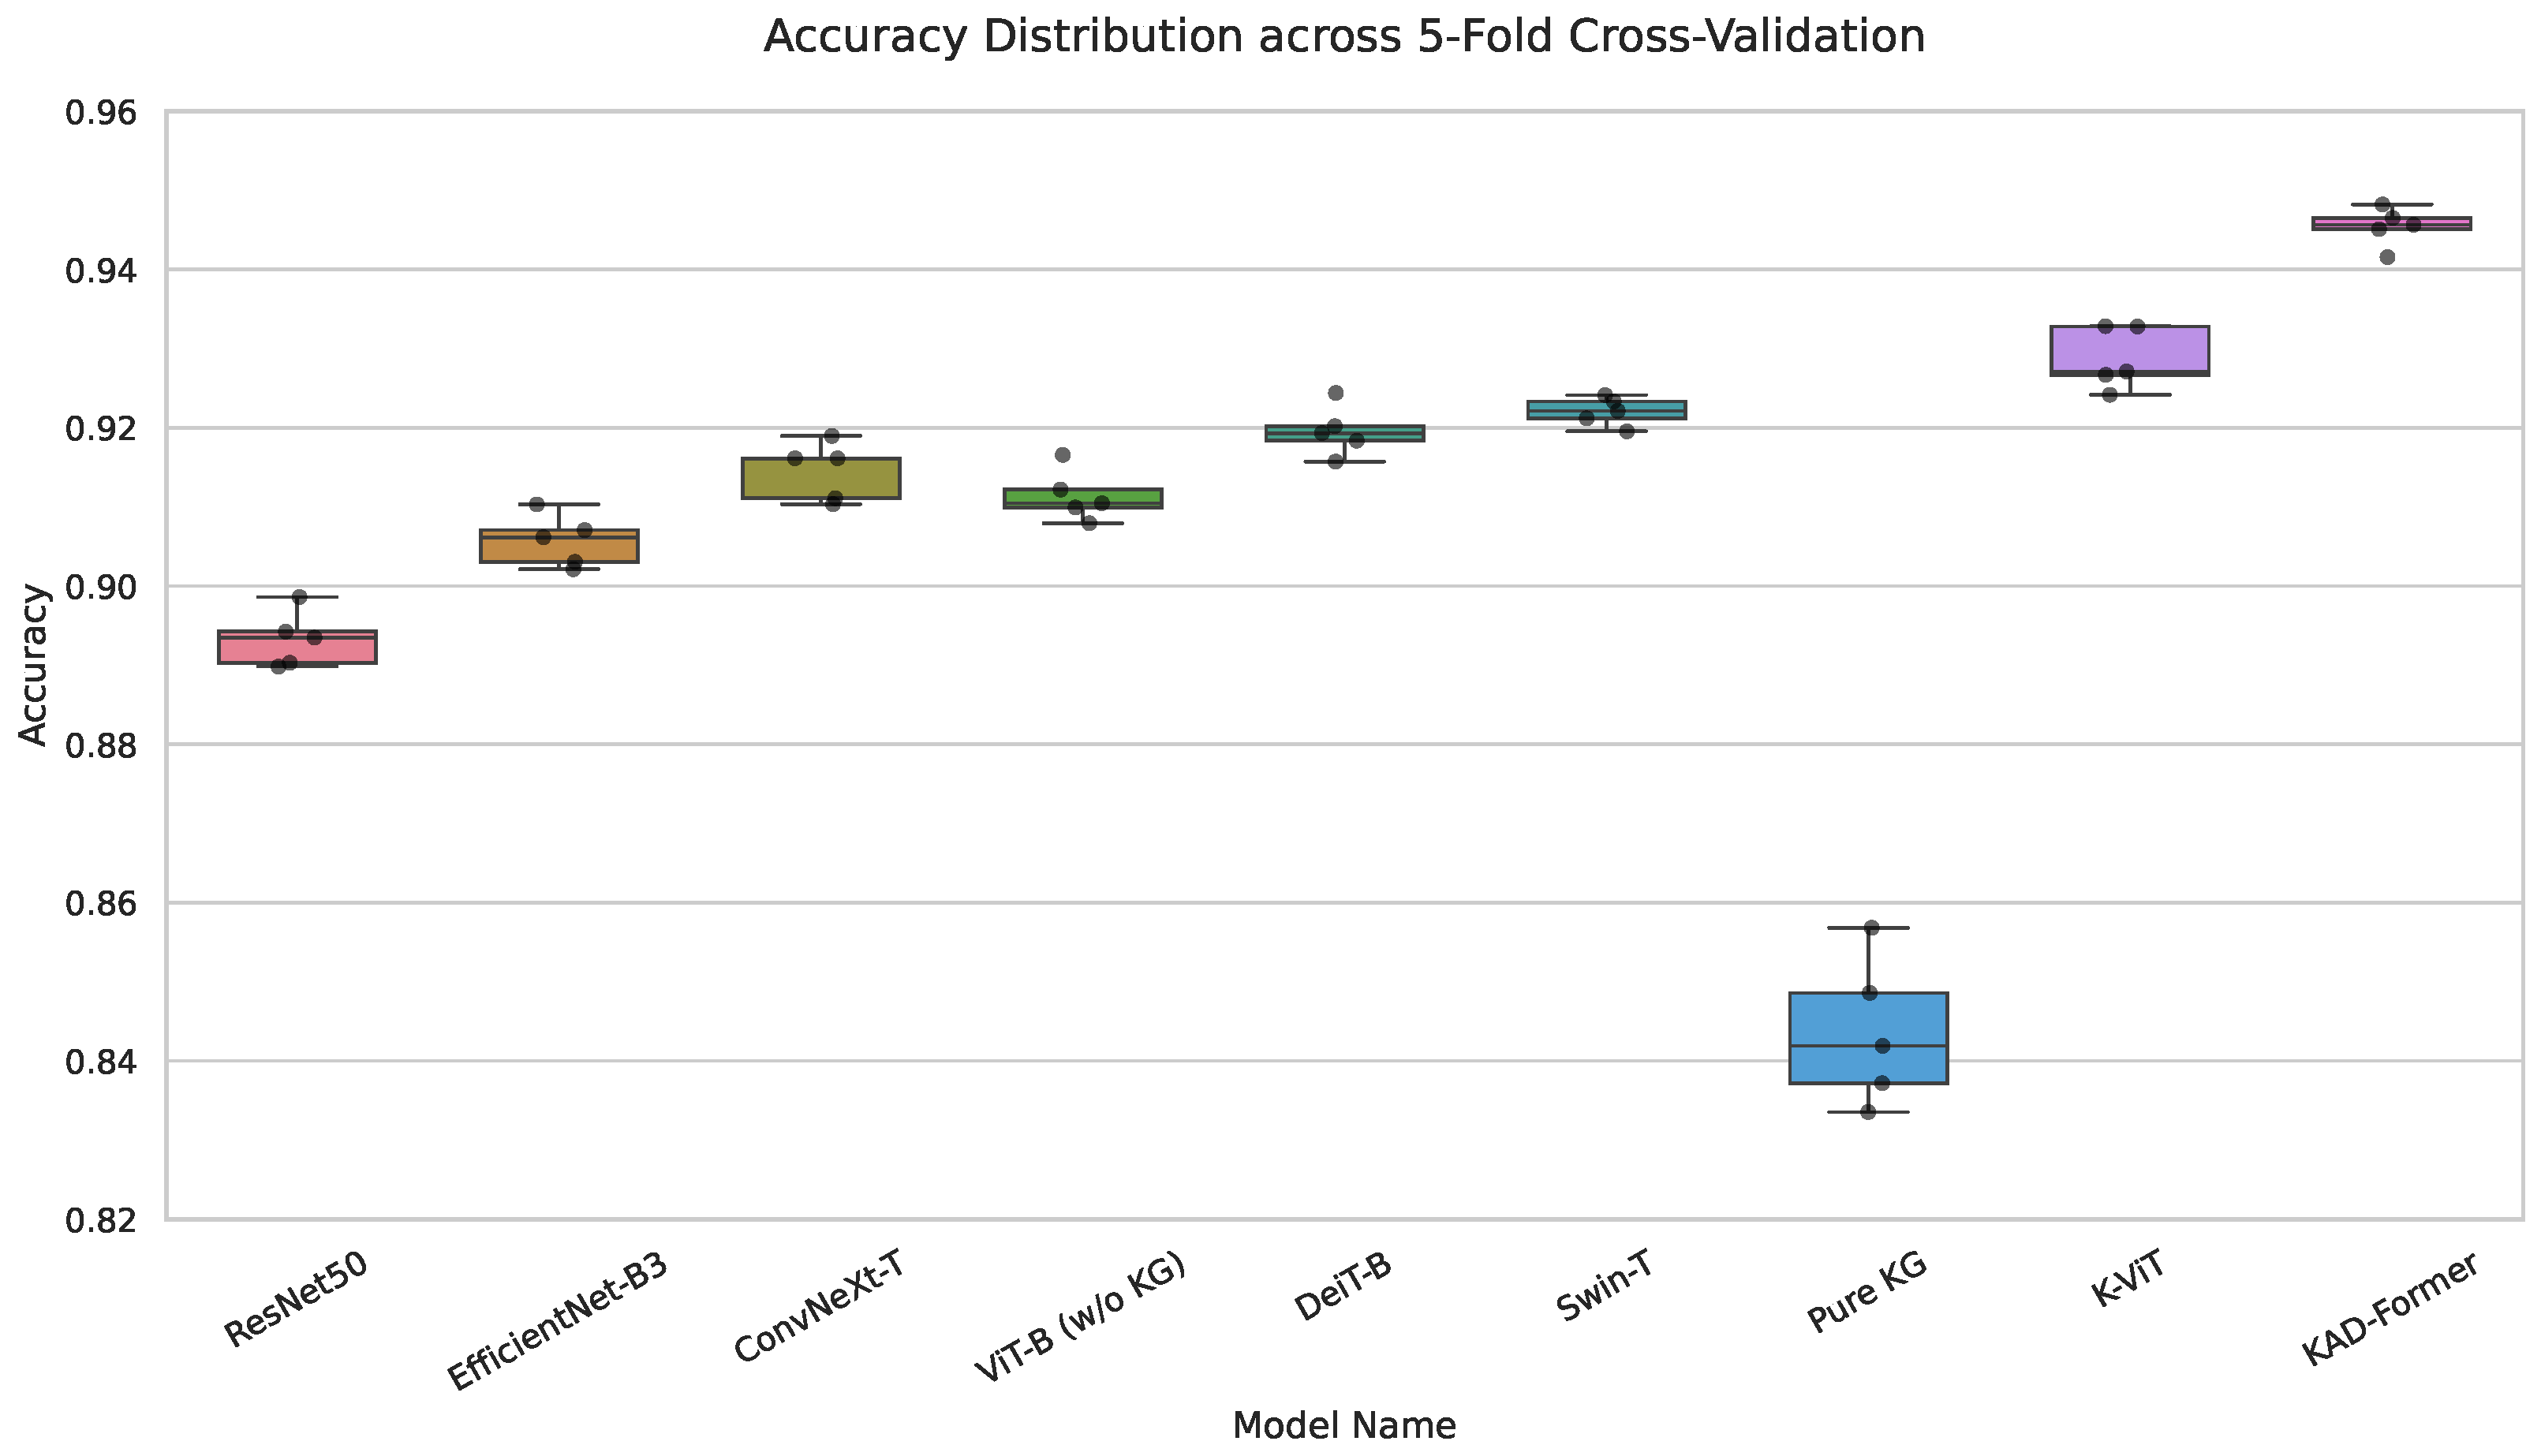
As shown in Table 2 and Figure 5, KAD-Former consistently achieves the best performance across all evaluation metrics, demonstrating both high accuracy and strong stability under 5-fold cross-validation. The low standard deviation observed for Accuracy, F1-score, and mAP indicates that the integration of the Agricultural Knowledge Graph (AKG) provides stable semantic constraints that reduce sensitivity to random data partitioning. In contrast, baseline models—particularly CNN-based architectures—exhibit larger variance in DGS and Consistency@5, suggesting a stronger dependence on domain-specific visual patterns. Notably, the purely knowledge-based model (Pure KG) achieves a relatively high classification accuracy despite the absence of visual input. This result can be attributed to the fact that the knowledge graph encodes strong and stable associations among fruit species, diseases, and symptoms, enabling high-level semantic inference analogous to expert rule-based diagnosis. By operating in an abstract semantic space, Pure KG can correctly infer disease categories when symptom co-occurrence patterns are highly distinctive, even without direct perception of lesion appearance. However, the lack of visual information fundamentally limits its ability to distinguish fine-grained lesion morphology, early-stage or weak symptoms, and visually ambiguous disease cases, which explains its inferior performance compared to vision-based and hybrid models. These observations indicate that Pure KG primarily serves as a high-level reasoning component, while the superior performance of KAD-Former arises from the deep integration of structured knowledge with visual evidence, enabling both semantic reasoning and fine-grained visual discrimination. The Knowledge-augmented ViT (K-ViT) shows noticeable improvements over the standard ViT-B, indicating that even basic knowledge integration can enhance performance. However, K-ViT still falls short of KAD-Former, particularly in explainability and cross-domain robustness, as it lacks the deep semantic alignment and knowledge-guided attention mechanisms required to fully exploit the AKG structure.
From the perspective of model architecture and mathematical mechanisms, CNNs rely on local convolution kernels for feature extraction within restricted regions, resulting in insensitivity to large-scale lesion structures, long-range dependencies, and background variation, thereby explaining their suboptimal performance in interpretability and generalization. Transformer-based models leverage global token interactions to capture long-distance dependencies, which accounts for the improved performance in mAP, Consistency@5, and DGS. However, these models are entirely data-driven and lack semantic guidance, often misallocating attention to irrelevant or noisy regions in complex orchard environments. The pure KG model performs vector-based reasoning over entity-relation embeddings, akin to geometric operations in graph space, but without visual input, it fails to capture lesion shape, color, and texture. KAD-Former introduces knowledge-guided attention within the transformer framework, where visual tokens are modulated by symptom semantic embeddings during attention score computation, yielding a constrained and semantically-aligned attention map. This knowledge-guided feature interaction mechanism suppresses noise tokens and enhances both classification and localization, ultimately resulting in superior overall performance. While K-ViT incorporates knowledge as auxiliary input, it often fails to achieve deep fusion at the attention weight level, leading to suboptimal alignment between visual tokens and semantic concepts. In contrast, KAD-Former addresses this limitation by using SAM and KGA to enforce strict semantic-visual coherence, thereby maximizing the synergy between the two modalities.

3.3. Cross-Regional Generalization Performance

This experiment aimed to evaluate the cross-regional generalization capabilities of different models in orchard environments. The performance differences across training domains and multiple external target domains (Hebei, Yunnan, and Internet-sourced data) were assessed, focusing on cross-domain accuracy and final generalization score (DGS), which reflect model robustness under environmental shifts, cultivar variations, and diverse acquisition devices common in real-world deployment.
As illustrated in Table 3, conventional convolutional models such as ResNet50 showed high performance on the source domain but suffered significant accuracy degradation on target domains, particularly Target-2 and Target-3. This suggests a strong reliance on local texture and background-specific features, making these models vulnerable to domain shifts. EfficientNet-B3 exhibited slight improvements but remained limited by its local feature constraints. Basic transformers like ViT-B and Swin-T demonstrated superior cross-domain performance, confirming that global attention mechanisms mitigate feature degradation caused by environmental shifts. KAD-Former achieved the highest accuracy across the evaluated target domains, with scores of 0.910 , 0.897 , and 0.889 on Hebei, Yunnan, and Internet datasets, respectively, resulting in a DGS of 0.933 . This relative robustness is attributed to knowledge augmentation, which provides stable symptom semantics within the scope of our agricultural knowledge graph. In the evaluated scenarios, the learned representations prioritize abstract symptom concepts over region-specific textures. Furthermore, the SAM module aligns visual and knowledge embeddings in a shared space, facilitating transferable semantic subspaces across the tested regions. By reinforcing attention toward key symptom regions, the KGA module reduces the impact of regional discrepancies in the current dataset. Compared to vision-only transformers, KAD-Former establishes more consistent decision boundaries across these specific domains, underscoring the value of integrating structured knowledge into agricultural visual systems for cross-regional applications.

3.4. Ablation Study

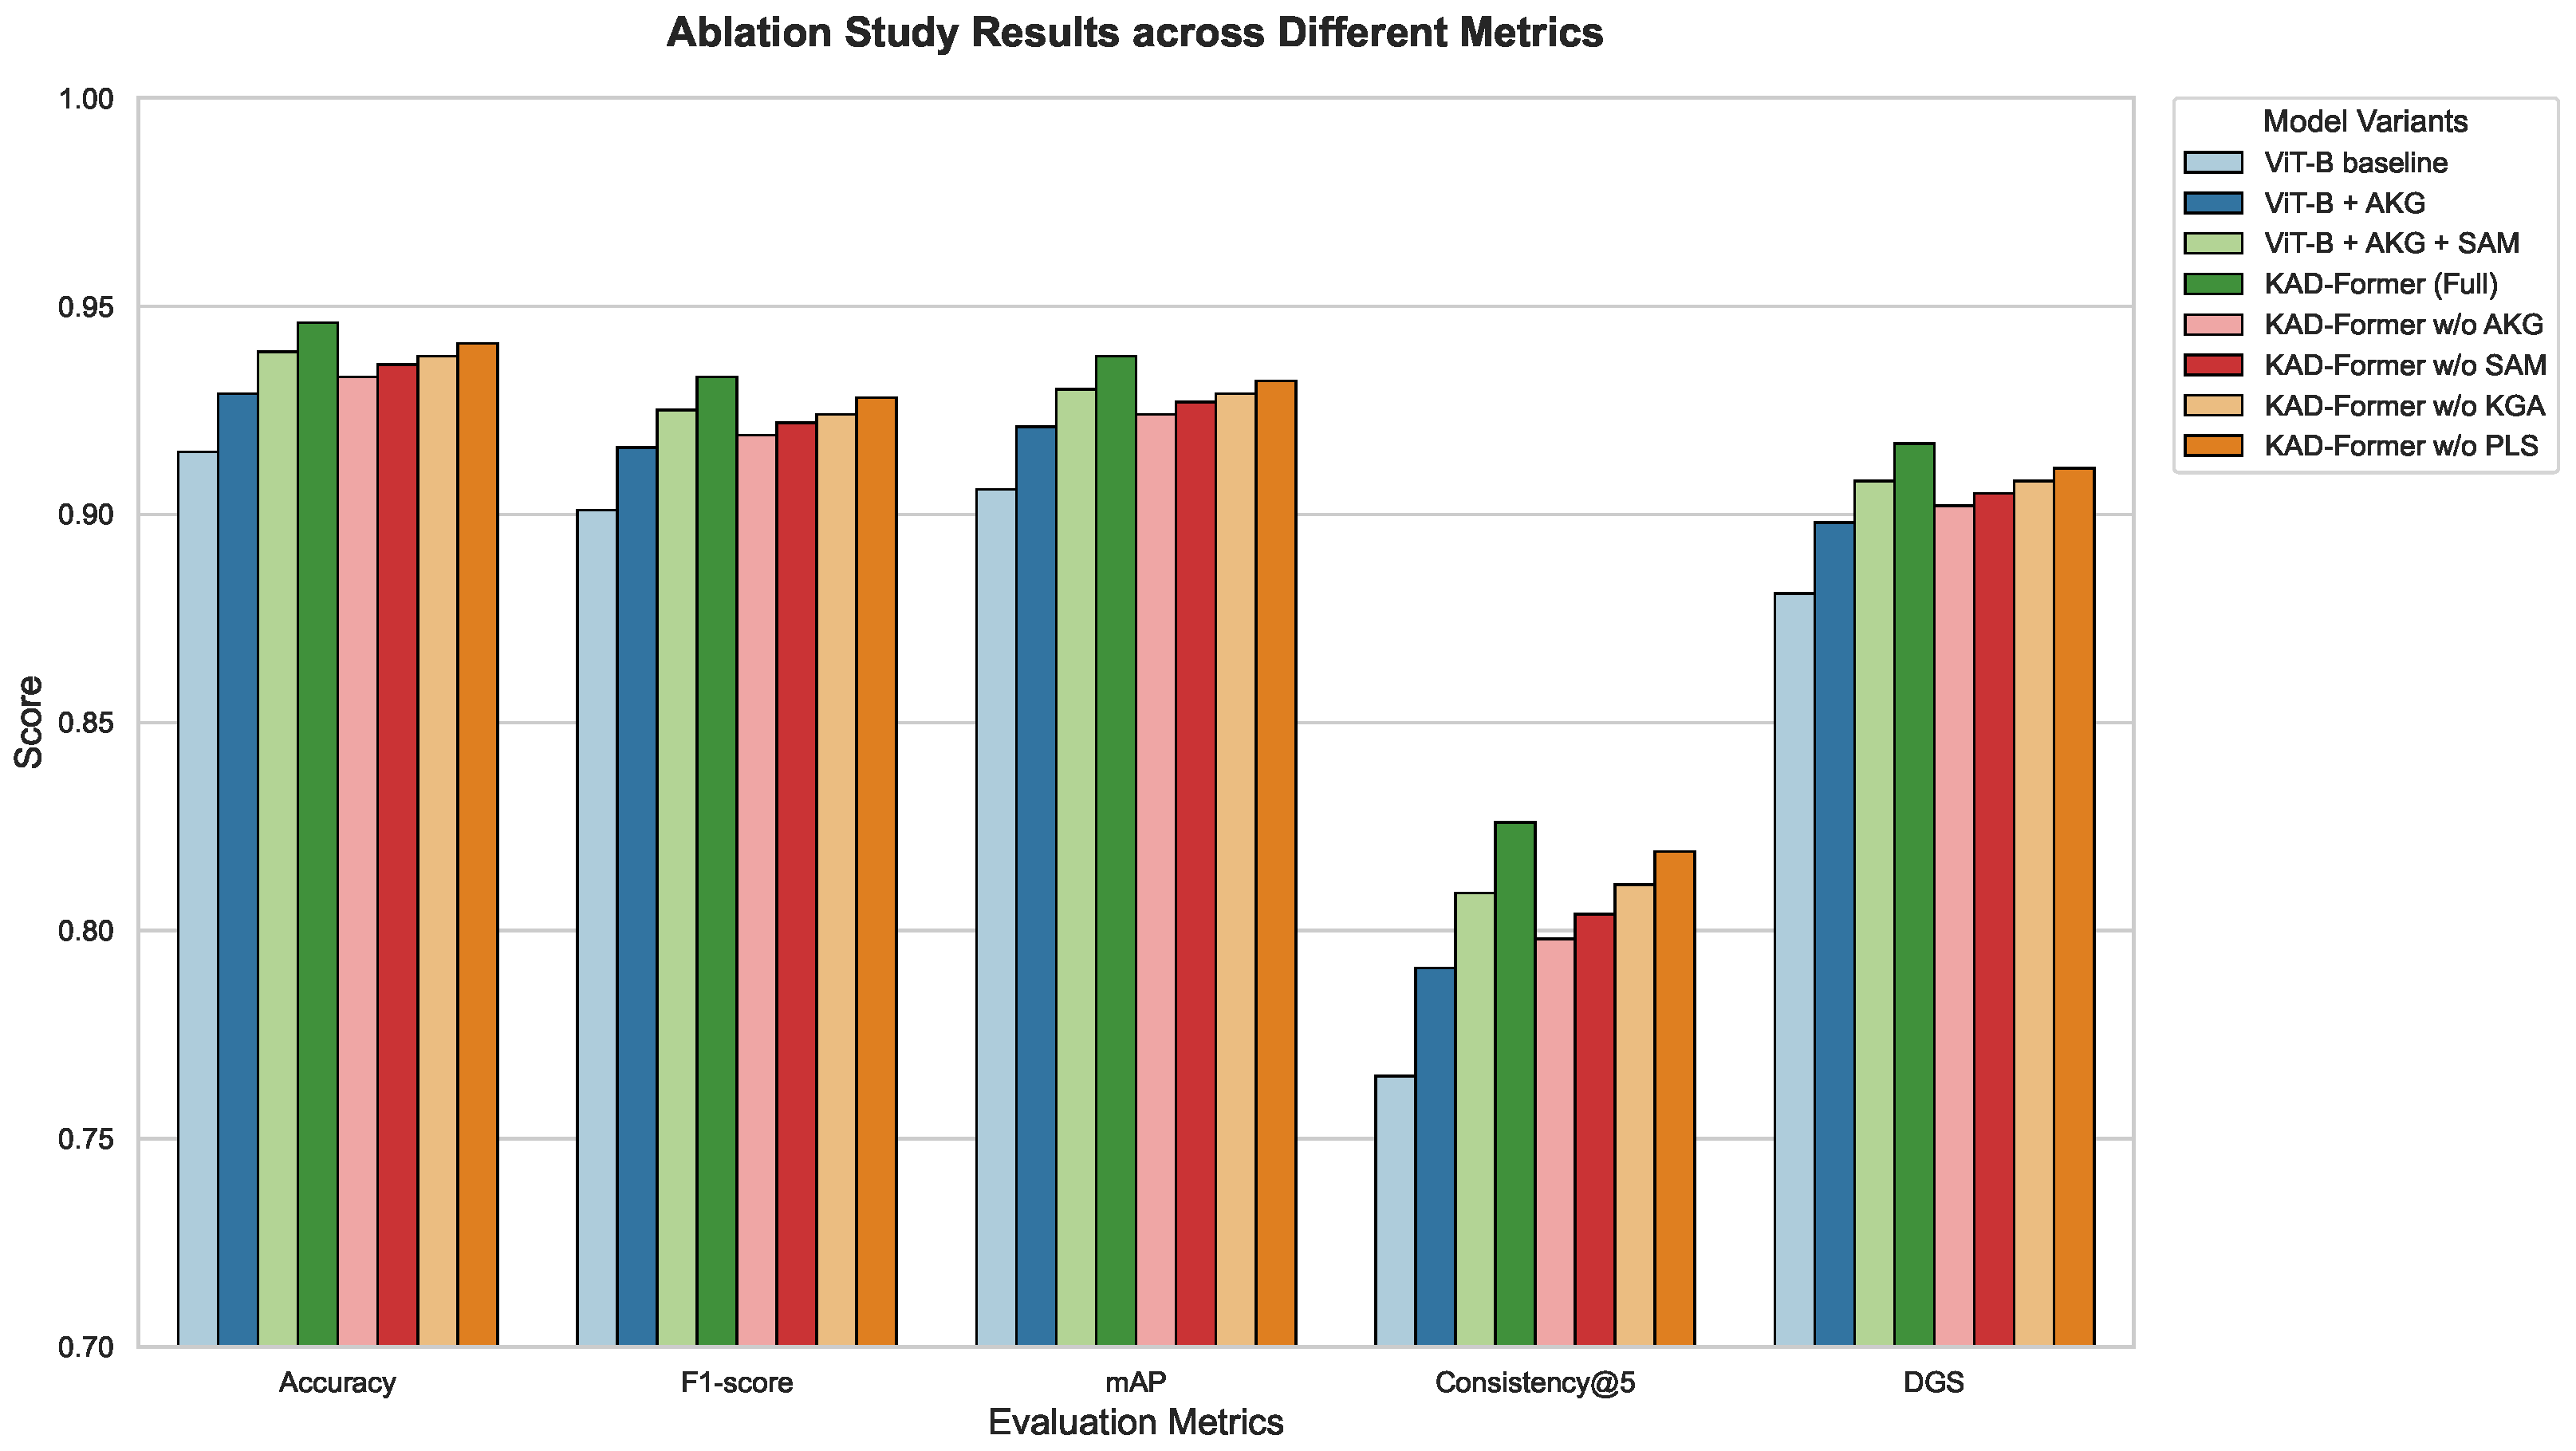
The purpose of this experiment was to verify the individual contributions and combined benefits of the agricultural knowledge graph (AKG), semantic alignment module (SAM), knowledge-guided attention (KGA), and pseudo-lesion simulation (PLS) in the overall performance of the proposed model. Unlike traditional vision-only transformers, KAD-Former introduces structured agricultural knowledge into the visual reasoning pipeline. Systematic comparisons were conducted to assess the influence of each module on disease classification, lesion localization, explainability consistency, and cross-domain robustness. The ViT-B model served as the base, with modules sequentially added or removed to measure performance impact.
As demonstrated in Table 4 and Figure 6, the ViT-B baseline possessed strong global representation capabilities but lacked agricultural semantics, leading to inferior accuracy and F1-score compared to knowledge-enhanced variants. Incorporation of AKG introduced symptom correlations into the model, expanding the recognition process from vision-only input to a combined vision–knowledge space, resulting in improved classification and generalization. The addition of SAM enabled alignment between visual tokens and symptom embeddings in feature space, enhancing lesion localization accuracy, as reflected in increased mAP and Consistency@5. The results for the KAD-Former w/o PLS variant indicate that the pseudo-lesion simulation significantly enhances the model’s sensitivity to early-stage features without introducing artificial bias, as evidenced by the maintained high Consistency@5 score and the marginal performance gap compared to the full model. The complete KAD-Former with KGA achieved the highest Consistency@5 score, confirming that knowledge-guided multi-head attention significantly improves model explainability. From a theoretical perspective, the AKG provided learnable semantic priors, introducing category-specific constraints into feature space that tightened inter-class distributions and stabilized classification boundaries. SAM reduced modality mismatch by projecting visual and knowledge features into a unified semantic space, improving symptom localization and label consistency. KGA introduced knowledge-driven modulation to the attention mechanism by using symptom embeddings as keys and values, replacing pure data-driven attention with semantically grounded weighting. This altered the mathematical distribution of attention scores, biasing them toward semantically relevant regions. The removal of any module, including the PLS enhancement, led to performance degradation, confirming their respective and complementary roles in semantic enhancement, feature alignment, and attention guidance. The full KAD-Former achieved optimal performance across all metrics, validating the effectiveness and necessity of the proposed architectural design.

3.5. Discusssion

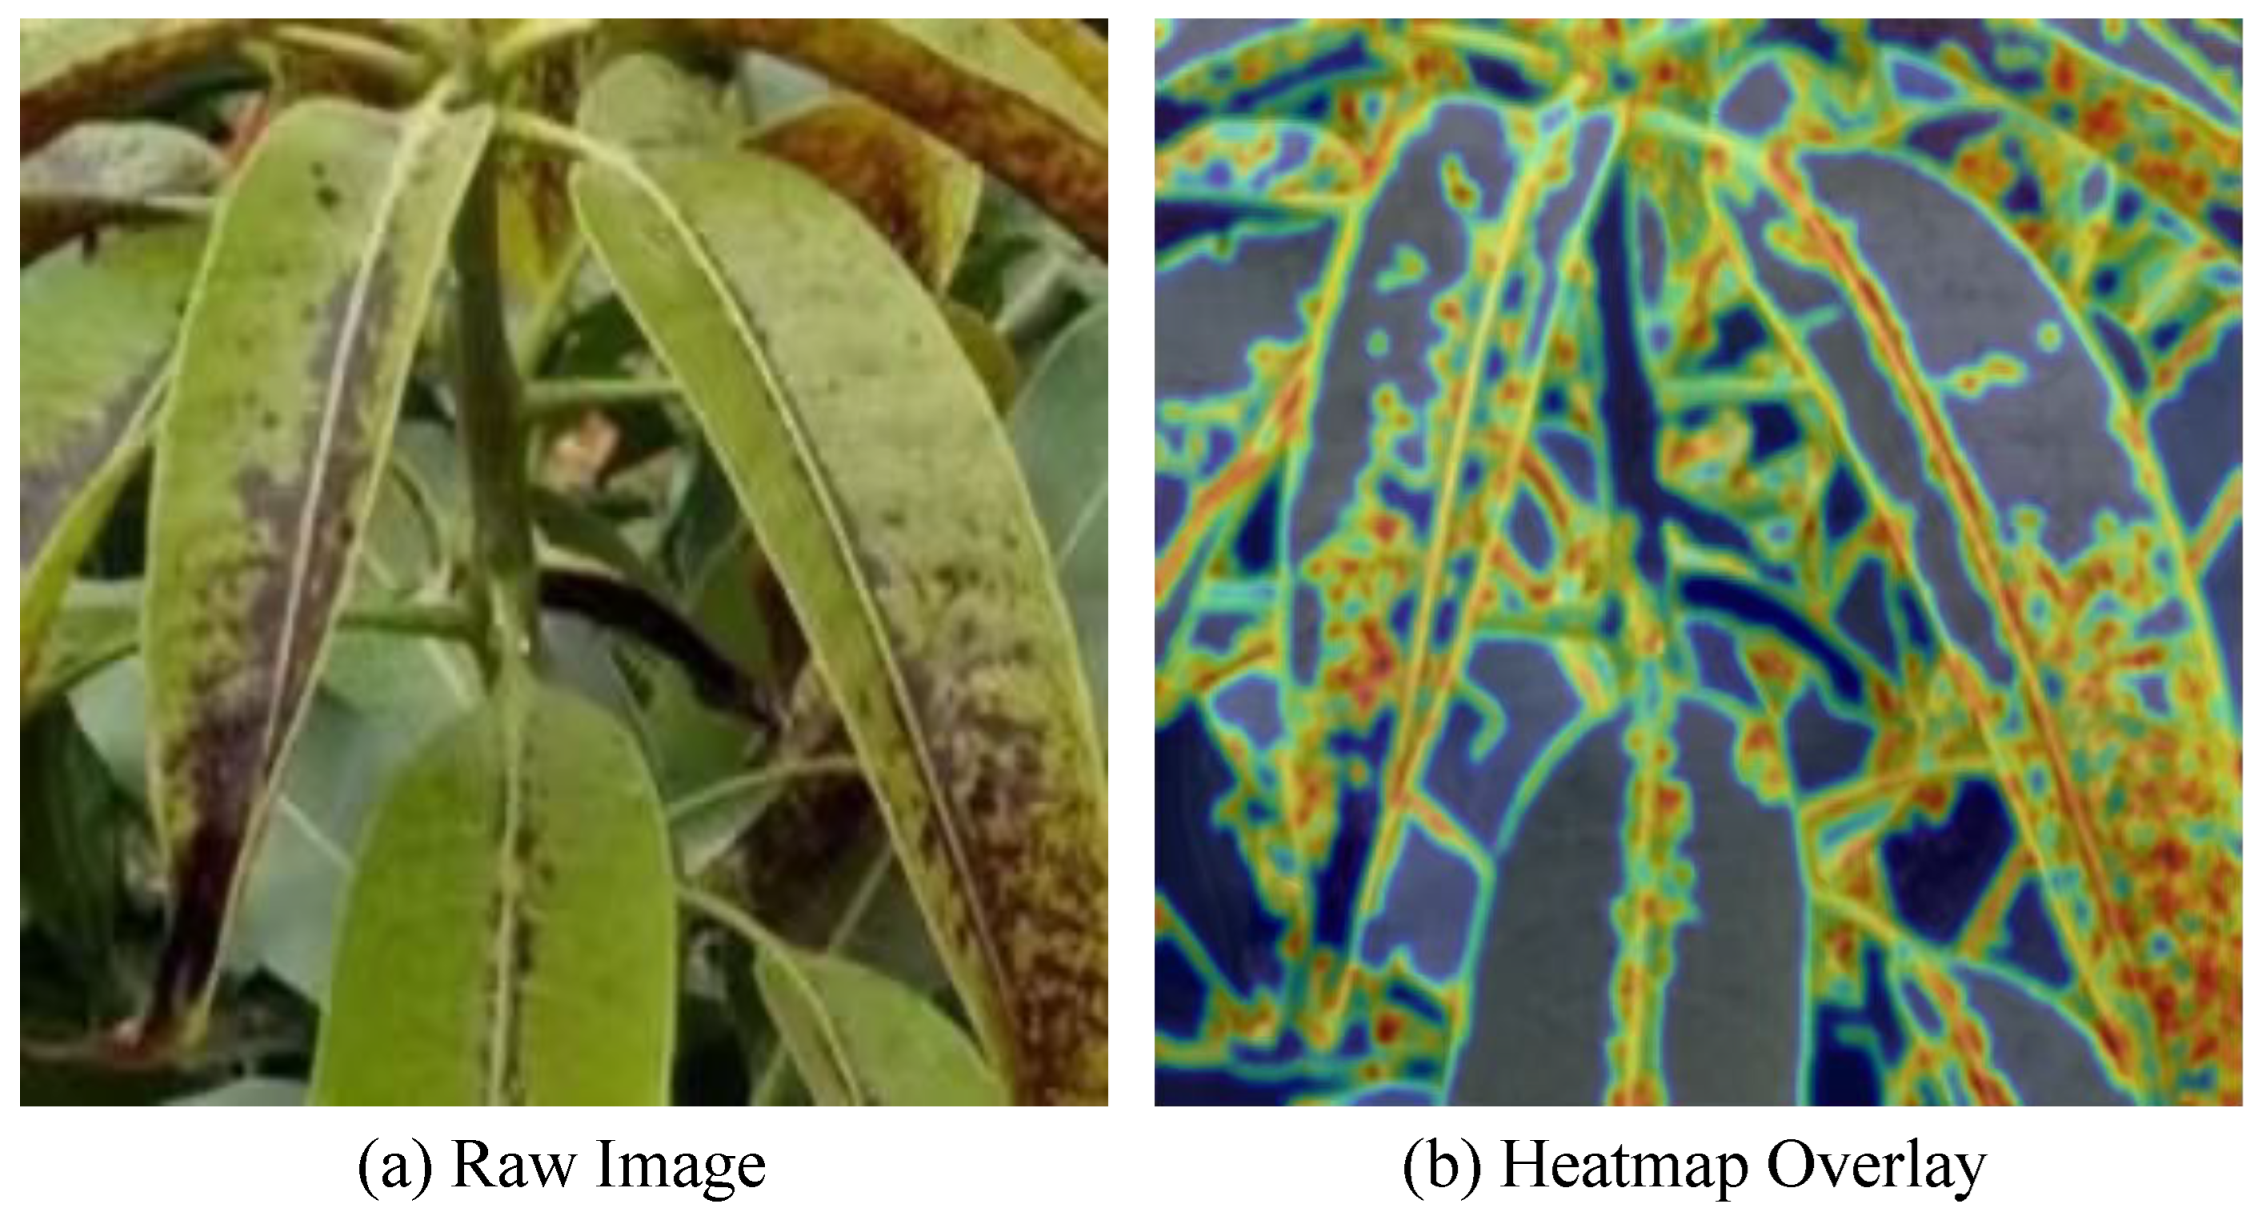
As illustrated in Figure 7, the heatmap generated by the knowledge-guided attention (KGA) module highlights regions that spatially coincide with visually salient disease manifestations, including edge-localized dark spots and variegated areas on the leaf surface. Notably, regions corresponding to weak disease symptoms—such as blurred lesion boundaries and subtle chromatic variations—also receive consistently elevated attention responses. This observation suggests that the model is sensitive to fine-grained visual cues that are easily overlooked by purely data-driven attention mechanisms. It should be emphasized that this visualization provides qualitative evidence of the model’s interpretability rather than a formal validation against human diagnostic reasoning. The highlighted regions reflect areas that the model internally associates with disease-related semantic concepts encoded in the agricultural knowledge graph, and their spatial alignment with recognizable symptom patterns offers intuitive insight into the model’s decision process. While no explicit human-in-the-loop evaluation with agronomists is conducted in this study, the heatmap qualitatively demonstrates that KAD-Former focuses on symptom-relevant regions instead of background artifacts or spurious textures. These results support the interpretability of the knowledge-guided attention mechanism, while a rigorous comparison between model explanations and expert reasoning remains an important direction for future work.
In practical orchard production environments, disease recognition systems are required not only to achieve high classification accuracy but also to remain robust under complex field conditions and provide reliable, actionable explanations. The proposed KAD-Former demonstrates clear advantages in real deployments, maintaining stable recognition under challenging illumination and background variability (e.g., backlighting, canopy shadows, and low-light conditions). In robot- or UAV-based inspection, the knowledge-guided attention module can localize lesion-related regions from high-speed sequential imagery and generate symptom-consistent heatmaps, which supports early warning and timely interventions (e.g., targeted spraying or pruning) before large-scale outbreaks occur.
Beyond performance, an important practical requirement in unmanned orchards is the ability to handle disease dynamics, including unseen diseases and out-of-distribution (OOD) symptom manifestations. From a theoretical perspective, the current semantic alignment loss L align encourages visual and knowledge embeddings to cluster around known disease semantic centers, which is beneficial for closed-set classification but may force novel diseases to be absorbed into the nearest known class. A promising future extension is to modify L align by introducing an explicit rejection region or energy-based margin, where samples with insufficient alignment confidence (e.g., large distance to all known class centers or uniformly low alignment scores) are flagged as unknown. Similarly, the knowledge-guided attention (KGA) can be adapted for open-set recognition by monitoring the entropy or sparsity of attention over symptom nodes: known diseases tend to exhibit concentrated, semantically consistent attention on a small subset of symptom concepts, whereas novel diseases may produce diffuse or contradictory attention patterns. Incorporating a confidence calibration or novelty score based on these attention statistics would allow the system to reject uncertain predictions and trigger expert review or knowledge graph expansion, improving safety and reliability in long-term autonomous deployment.
In cross-regional transfer, AKG provides stable semantic references that reduce the reliance on region-specific textures, enabling consistent localization of key pathological structures (e.g., lesion edges, discoloration centers, or concentric rings) under phenotypic variability. However, the scale and depth of the current AKG impose theoretical limitations. Specifically, AKG mainly represents phenotypic symptom relationships and does not fully encode underlying physiological mechanisms (e.g., pathogen life cycles, host responses) or cultivar-dependent symptom variability. This incompleteness can lead to semantic aliasing, where different physiological causes share similar visible symptoms, or the same disease manifests differently across cultivars, thereby weakening the uniqueness of knowledge constraints and potentially causing misalignment between visual evidence and knowledge priors. These observations indicate that future work should expand AKG toward deeper biological semantics and cultivar-aware representations, so that knowledge injection can constrain the model with mechanism-level and varietal-specific priors rather than only symptom co-occurrence.
Moreover, disease occurrence in real orchards is strongly driven by non-visual context, including meteorological conditions (temperature, humidity, rainfall), soil properties, and growth-stage dynamics. To improve contextual reasoning, an important direction is intermodal fusion between vision, structured knowledge, and non-visual agricultural data. Concretely, sensor and management signals can be encoded into context tokens and injected into the same attention space as KGA, enabling a tri-modal attention mechanism where visual tokens query not only symptom nodes but also environmental context embeddings. Alternatively, environmental variables can be used to modulate KGA via gating or conditional priors, dynamically reweighting symptom nodes according to risk factors (e.g., humidity increasing mildew likelihood), thereby aligning visual evidence with agronomic context. Such fusion mechanisms are expected to enhance robustness under visually ambiguous conditions (e.g., early-stage weak lesions) and provide more actionable explanations by linking predictions to both symptom localization and contextual drivers.
From an agricultural economic perspective, these capabilities translate into tangible value. Accurate early-stage recognition and reliable interpretability reduce pesticide and labor costs through targeted interventions, improve fruit grading and qualification rates on sorting lines, and strengthen auditability for quality certification. In addition, open-set rejection and context-aware reasoning reduce operational risks in unmanned orchards by preventing overconfident misclassification of novel diseases, while providing a structured pathway for expert feedback and incremental knowledge updates. Therefore, KAD-Former not only advances knowledge-enhanced visual diagnosis but also provides a practical foundation for digital orchards, unmanned orchards, and trustworthy intelligent decision-support systems.

3.6. Limitation and Future Work

Although significant progress has been achieved in intelligent fruit tree disease recognition, several limitations remain and warrant further investigation. First, the agricultural knowledge graph constructed in this study captures core semantic relationships among fruit trees, diseases, and symptoms, but its scale and granularity are constrained by available expert annotations. As a result, complex physiological disease mechanisms, rare disease types, and cultivar-specific symptom variations are not yet fully represented. This limitation may reduce the model’s ability to correctly reason about unseen diseases or novel symptom manifestations that deviate from the predefined semantic space. In addition, although KAD-Former demonstrates improved robustness compared with purely vision-based models, its performance may still be challenged under extreme environmental conditions, such as severe leaf occlusion, intense glare, motion blur, or highly cluttered backgrounds, which can obscure visual symptom cues and affect reliable lesion perception.
Furthermore, the current KAD-Former framework primarily relies on visual information and structured agricultural knowledge, without explicitly incorporating dynamic environmental factors such as meteorological conditions, soil properties, or growth-stage variations. These factors play a critical role in disease emergence and progression under real orchard conditions, especially in extreme or rapidly changing environments. Future work will therefore explore multimodal fusion strategies that integrate remote sensing data, in-situ sensor measurements, and agronomic context into the knowledge-guided attention framework, with the aim of improving contextual reasoning and robustness. More importantly, to support long-term deployment in unmanned orchards and address the dynamic evolution of diseases, future research will focus on introducing continuous learning capabilities. Self-supervised learning will be investigated to exploit large-scale unlabeled orchard imagery collected by robots or UAVs, while incremental and continual learning mechanisms, together with open-set recognition, will be explored to enable the detection and adaptation to unseen diseases or novel symptoms without catastrophic forgetting. These directions aim to transform KAD-Former into a more robust and continuously adaptive diagnostic system suitable for complex and evolving orchard environments.

4. Conclusions

This study introduces KAD-Former, a knowledge-augmented visual reasoning framework designed to bridge the gap between deep learning performance and expert-like interpretability in horticultural disease diagnosis. By integrating a hierarchical AKG, a SAM, and KGA, the framework achieves state-of-the-art accuracy and robust cross-regional generalization by emulating the diagnostic logic of agricultural experts. Our key findings demonstrate that the deep fusion of structured domain knowledge and visual Transformers significantly enhances the recognition of weak lesion features and aligns model attention with expert-annotated symptoms. However, the current effectiveness of the model remains inherently dependent on the scale and depth of the AKG; inadequate representation of complex physiological mechanisms or rare cultivar variations can limit reasoning depth in extreme scenarios. Furthermore, the current reliance on visual data suggests a need for future integration of environmental variables like meteorology and soil parameters to achieve true contextual awareness. Beyond technical metrics, KAD-Former offers transformative potential for agricultural economics by enabling early-stage interventions, reducing chemical usage, and supporting digital transformation in orchard management. Despite existing constraints regarding data modalities and open-set recognition, this work provides a transparent and trustworthy foundation for the development of intelligent, sustainable horticultural decision support systems.

Author Contributions

Conceptualization, Y.C., Y.Z., H.Z. and Y.S.; Data curation, K.C., H.T. and Z.W.; Formal analysis, Y.J.; Funding acquisition, Y.S.; Investigation, Y.J. and Z.W.; Methodology, Y.C., Y.Z. and H.Z.; Project administration, Y.S.; Resources, K.C., H.T. and Z.W.; Software, Y.C., Y.Z. and H.Z.; Supervision, Y.S.; Validation, Y.J.; Visualization, K.C. and H.T.; Writing—original draft, Y.C., Y.Z., H.Z., Y.J., K.C., H.T., Z.W. and Y.S. All authors have read and agreed to the published version of the manuscript.

Funding

This research was funded by National Natural Science Foundation of China grant number 61202479.

Data Availability Statement

The original contributions presented in this study are included in the article. Further inquiries can be directed to the corresponding author.

Conflicts of Interest

The authors declare no conflict of interest.

References

  1. Khan, A.; Korban, S.S. Breeding and genetics of disease resistance in temperate fruit trees: Challenges and new opportunities. Theor. Appl. Genet. 2022, 135, 3961–3985. [Google Scholar] [CrossRef] [PubMed]
  2. Ray, R.V. Effects of pathogens and disease on plant physiology. In Agrios’ Plant Pathology; Elsevier: Amsterdam, The Netherlands, 2024; pp. 63–92. [Google Scholar]
  3. He, Y.; Xiao, Q.; Bai, X.; Zhou, L.; Liu, F.; Zhang, C. Recent progress of nondestructive techniques for fruits damage inspection: A review. Crit. Rev. Food Sci. Nutr. 2022, 62, 5476–5494. [Google Scholar] [CrossRef] [PubMed]
  4. Rojas Santelices, I.; Cano, S.; Moreira, F.; Peña Fritz, Á. Artificial Vision Systems for Fruit Inspection and Classification: Systematic Literature Review. Sensors 2025, 25, 1524. [Google Scholar] [CrossRef] [PubMed]
  5. Kumar, M.; Pal, Y.; Gangadharan, S.M.P.; Chakraborty, K.; Yadav, C.S.; Kumar, H.; Tiwari, B. Apple Sweetness Measurement and Fruit Disease Prediction Using Image Processing Techniques Based on Human-Computer Interaction for Industry 4.0. Wirel. Commun. Mob. Comput. 2022, 2022, 5760595. [Google Scholar] [CrossRef]
  6. Palei, S.; Behera, S.K.; Sethy, P.K. A systematic review of citrus disease perceptions and fruit grading using machine vision. Procedia Comput. Sci. 2023, 218, 2504–2519. [Google Scholar] [CrossRef]
  7. Lin, X.; Wa, S.; Zhang, Y.; Ma, Q. A dilated segmentation network with the morphological correction method in farming area image Series. Remote Sens. 2022, 14, 1771. [Google Scholar] [CrossRef]
  8. Zhang, Y.; He, S.; Wa, S.; Zong, Z.; Lin, J.; Fan, D.; Fu, J.; Lv, C. Symmetry GAN detection network: An automatic one-stage high-accuracy detection network for various types of lesions on CT images. Symmetry 2022, 14, 234. [Google Scholar] [CrossRef]
  9. Nancy, C.; Kiran, S. Cucumber leaf disease detection using glcm features with random forest algorithm. Int. Res. J. Multidiscip. Technovation 2024, 6, 40–50. [Google Scholar] [CrossRef]
  10. Li, Q.; Ren, J.; Zhang, Y.; Song, C.; Liao, Y.; Zhang, Y. Privacy-Preserving DNN Training with Prefetched Meta-Keys on Heterogeneous Neural Network Accelerators. In Proceedings of the 2023 60th ACM/IEEE Design Automation Conference (DAC), San Francisco, CA, USA, 9–13 July 2023; pp. 1–6. [Google Scholar]
  11. Gao, X.; Li, S.; Su, X.; Li, Y.; Huang, L.; Tang, W.; Zhang, Y.; Dong, M. Application of advanced deep learning models for efficient apple defect detection and quality grading in agricultural production. Agriculture 2024, 14, 1098. [Google Scholar] [CrossRef]
  12. Kunduracioglu, I. Cnn models approaches for robust classification of apple diseases. Comput. Decis. Mak. Int. J. 2024, 1, 235–251. [Google Scholar] [CrossRef]
  13. Liu, Y.; Gao, G.; Zhang, Z. Crop disease recognition based on modified light-weight CNN with attention mechanism. IEEE Access 2022, 10, 112066–112075. [Google Scholar] [CrossRef]
  14. Azgomi, H.; Haredasht, F.R.; Motlagh, M.R.S. Diagnosis of some apple fruit diseases by using image processing and artificial neural network. Food Control 2023, 145, 109484. [Google Scholar] [CrossRef]
  15. Krishnan, A. RCNN-Based Analysis of Apple Trees Leaves for Early Plant Disease Detection. Master’s Degree, Unitec, Te Pūkenga—New Zealand Institute of Skills and Technology, Auckland, New Zealand, 2024. [Google Scholar]
  16. Parez, S.; Dilshad, N.; Alghamdi, N.S.; Alanazi, T.M.; Lee, J.W. Visual intelligence in precision agriculture: Exploring plant disease detection via efficient vision transformers. Sensors 2023, 23, 6949. [Google Scholar] [CrossRef] [PubMed]
  17. Guo, Y.; Lan, Y.; Chen, X. CST: Convolutional Swin Transformer for detecting the degree and types of plant diseases. Comput. Electron. Agric. 2022, 202, 107407. [Google Scholar] [CrossRef]
  18. Aslan, E.; ÖZÜPAK, Y. Diagnosis and accurate classification of apple leaf diseases using vision transformers. Comput. Decis. Making Int. J. 2024, 1, 1–12. [Google Scholar] [CrossRef]
  19. Liu, W.; Zhang, A. Plant Disease Detection Algorithm Based on Efficient Swin Transformer. Comput. Mater. Contin. 2025, 82, 3045–3068. [Google Scholar] [CrossRef]
  20. Zhang, L.; Zhang, Y.; Ma, X. A new strategy for tuning ReLUs: Self-adaptive linear units (SALUs). In Proceedings of the ICMLCA 2021; 2nd International Conference on Machine Learning and Computer Application, Shenyang, China, 17–19 December 2021; pp. 1–8. [Google Scholar]
  21. Yu, H.l.; Shen, J.m.; Bi, C.g.; Liang, J.; Chen, H.l. Intelligent diagnostic system for rice diseases and pests based on knowledge graph. J. S. China Agric. Univ. 2021, 42, 105–116. [Google Scholar]
  22. Wang, P.; Zhang, C.; Wang, D.; Zhang, S.; Wang, J.; Wang, X.; Huang, L. Relation extraction for knowledge graph generation in the agriculture domain: A case study on soybean pests and disease. Appl. Eng. Agric. 2023, 39, 215–224. [Google Scholar] [CrossRef]
  23. Gong, R.; Li, X. The application progress and research trends of knowledge graphs and large language models in agriculture. Comput. Electron. Agric. 2025, 235, 110396. [Google Scholar] [CrossRef]
  24. Alwan, W.H.; Alturfi, S.M. Multi-Stage Vision Transformer and Knowledge Graph Fusion for Enhanced Plant Disease Classification. Comput. Syst. Sci. Eng. 2025, 49, 419–434. [Google Scholar] [CrossRef]
  25. Zhao, X.; Chen, B.; Ji, M.; Wang, X.; Yan, Y.; Zhang, J.; Liu, S.; Ye, M.; Lv, C. Implementation of large language models and agricultural knowledge graphs for efficient plant disease detection. Agriculture 2024, 14, 1359. [Google Scholar] [CrossRef]
  26. Gao, R.; Dong, Z.; Wang, Y.; Cui, Z.; Ye, M.; Dong, B.; Lu, Y.; Wang, X.; Song, Y.; Yan, S. Intelligent cotton pest and disease detection: Edge computing solutions with transformer technology and knowledge graphs. Agriculture 2024, 14, 247. [Google Scholar] [CrossRef]
  27. Sun, Y.; Huang, Z.; Yang, L.; Wang, Z.; Ruan, M.; Suo, J.; Yan, S. Tree-Guided Transformer for Sensor-Based Ecological Image Feature Extraction and Multitarget Recognition in Agricultural Systems. Sensors 2025, 25, 6206. [Google Scholar] [CrossRef] [PubMed]
  28. Li, R.; Su, X.; Zhang, H.; Zhang, X.; Yao, Y.; Zhou, S.; Zhang, B.; Ye, M.; Lv, C. Integration of diffusion transformer and knowledge graph for efficient cucumber disease detection in agriculture. Plants 2024, 13, 2435. [Google Scholar] [CrossRef]
  29. Wang, H.; Zhao, R. Knowledge graph of agricultural engineering technology based on large language model. Displays 2024, 85, 102820. [Google Scholar] [CrossRef]
  30. Upadhyay, A.; Chandel, N.S.; Singh, K.P.; Chakraborty, S.K.; Nandede, B.M.; Kumar, M.; Subeesh, A.; Upendar, K.; Salem, A.; Elbeltagi, A. Deep learning and computer vision in plant disease detection: A comprehensive review of techniques, models, and trends in precision agriculture. Artif. Intell. Rev. 2025, 58, 92. [Google Scholar] [CrossRef]
  31. Li, J.; Zhao, X.; Xu, H.; Zhang, L.; Xie, B.; Yan, J.; Zhang, L.; Fan, D.; Li, L. An interpretable high-accuracy method for rice disease detection based on multisource data and transfer learning. Plants 2023, 12, 3273. [Google Scholar] [CrossRef]
  32. Pai, D.G.; Balachandra, M.; Kamath, R. Explainable AI in Agriculture: Review of Applications, Methodologies, and Future Directions. Eng. Res. Express 2025, 7, 032202. [Google Scholar] [CrossRef]
  33. Zhang, H.; Zhao, S.; Song, Y.; Ge, S.; Liu, D.; Yang, X.; Wu, K. A deep learning and Grad-Cam-based approach for accurate identification of the fall armyworm (Spodoptera frugiperda) in maize fields. Comput. Electron. Agric. 2022, 202, 107440. [Google Scholar] [CrossRef]
  34. Febriantono, M.A. Xai-Driven Apple Disease Identification Using Efficientnet and Grad-CAM. In Proceedings of the 2025 International Conference on Smart Computing, IoT and Machine Learning (SIML), Surakarta, Indonesia, 3–4 June 2025; pp. 1–6. [Google Scholar]
  35. Karim, M.J.; Goni, M.O.F.; Nahiduzzaman, M.; Ahsan, M.; Haider, J.; Kowalski, M. Enhancing agriculture through real-time grape leaf disease classification via an edge device with a lightweight CNN architecture and Grad-CAM. Sci. Rep. 2024, 14, 16022. [Google Scholar] [CrossRef]
  36. Nirgude, V.; Rathi, S. Improving the accuracy of real field pomegranate fruit diseases detection and visualisation using convolution neural networks and grad-CAM. Int. J. Data Anal. Tech. Strateg. 2023, 15, 57–75. [Google Scholar] [CrossRef]
  37. Stepin, I.; Alonso, J.M.; Catala, A.; Pereira-Fariña, M. A survey of contrastive and counterfactual explanation generation methods for explainable artificial intelligence. IEEE Access 2021, 9, 11974–12001. [Google Scholar] [CrossRef]
  38. Yang, M.D.; Tseng, H.H. Rule-Based Multi-Task Deep Learning for Highly Efficient Rice Lodging Segmentation. Remote Sens. 2025, 17, 1505. [Google Scholar] [CrossRef]
  39. He, K.; Zhang, X.; Ren, S.; Sun, J. Deep residual learning for image recognition. In Proceedings of the IEEE Conference on Computer Vision and Pattern Recognition, Las Vegas, NV, USA, 27–30 June 2016; pp. 770–778. [Google Scholar]
  40. Tan, M.; Le, Q. Efficientnet: Rethinking model scaling for convolutional neural networks. In Proceedings of the International Conference on Machine Learning, PMLR, Long Beach, CA, USA, 9–15 June 2019; pp. 6105–6114. [Google Scholar]
  41. Dosovitskiy, A. An image is worth 16x16 words: Transformers for image recognition at scale. arXiv 2020, arXiv:2010.11929. [Google Scholar]
  42. Liu, Z.; Lin, Y.; Cao, Y.; Hu, H.; Wei, Y.; Zhang, Z.; Lin, S.; Guo, B. Swin transformer: Hierarchical vision transformer using shifted windows. In Proceedings of the IEEE/CVF International Conference on Computer Vision, Montreal, QC, Canada, 11–17 October 2021; pp. 10012–10022. [Google Scholar]
  43. Touvron, H.; Cord, M.; Douze, M.; Massa, F.; Sablayrolles, A.; Jégou, H. Training data-efficient image transformers & distillation through attention. In Proceedings of the 38th International Conference on Machine Learning, PMLR, Virtual Event, 18–24 July 2021; pp. 10347–10357. [Google Scholar]
  44. Liu, Z.; Mao, H.; Wu, C.Y.; Feichtenhofer, C.; Darrell, T.; Xie, S. A convnet for the 2020s. In Proceedings of the IEEE/CVF Conference on Computer Vision and Pattern Recognition, New Orleans, LA, USA, 18–24 June 2022; pp. 11976–11986. [Google Scholar]
  45. Bordes, A.; Usunier, N.; Garcia-Duran, A.; Weston, J.; Yakhnenko, O. Translating embeddings for modeling multi-relational data. Adv. Neural Inf. Process. Syst. 2013, 26, 347–357. [Google Scholar]
  46. Gui, L.; Wang, B.; Huang, Q.; Hauptmann, A.G.; Bisk, Y.; Gao, J. Kat: A knowledge augmented transformer for vision-and-language. In Proceedings of the 2022 Conference of the North American Chapter of the Association for Computational Linguistics: Human Language Technologies, Seattle, WA, USA, 10–15 July 2022; pp. 956–968. [Google Scholar]
Figure 1. Representative samples of typical fruit tree diseases included in the dataset, covering apple, pear, grape, and peach.
Horticulturae 12 00023 g001
Figure 2. Schematic illustration of the agricultural knowledge graph (AKG).
Horticulturae 12 00023 g002
Figure 3. Schematic illustration of the semantic alignment module (SAM).
Horticulturae 12 00023 g003
Figure 4. Architecture of the Knowledge-Enhanced Attention Module (KGA).
Horticulturae 12 00023 g004
Figure 5. Comparison of KAD-Former with baseline models.
Horticulturae 12 00023 g005
Figure 6. Cross-regional generalization performance of representative models on different orchard domains.
Horticulturae 12 00023 g006
Figure 7. The figure shows the heatmap (b) output of the KGA module on the actual diseased leaf image (a). The heatmap uses color gradients to represent the intensity of the model’s regions of interest, with red representing regions of high model interest and blue representing regions of lower model interest.
Horticulturae 12 00023 g007
Table 1. Statistics of Fruit Tree Disease Data from Multiple Sources.
Data SourceNumber of Disease TypesNumber of ImagesTime Range
Real Orchard Collection1218,4202023.03–2024.10
Agricultural Platform Data1068502023.01–2024.08
Public Online Datasets1412,300
Expert Knowledge Texts21502023.05–2024.10
Total3637,570
Table 2. Comparison of KAD-Former with baseline models (Results presented as Mean ± SD from 5-fold cross-validation). Best results are in bold.
ModelAccuracyF1-ScoremAPConsistency@5DGS
ResNet50 0.891 ± 0.005 0.874 ± 0.006 0.881 ± 0.005 0.710 ± 0.012 0.862 ± 0.008
EfficientNet-B3 0.904 ± 0.004 0.889 ± 0.005 0.895 ± 0.004 0.728 ± 0.010 0.875 ± 0.007
ConvNeXt-T 0.918 ± 0.004 0.903 ± 0.004 0.907 ± 0.004 0.752 ± 0.009 0.889 ± 0.006
ViT-B (w/o KG) 0.915 ± 0.005 0.901 ± 0.005 0.906 ± 0.005 0.765 ± 0.008 0.881 ± 0.007
DeiT-B 0.920 ± 0.003 0.906 ± 0.004 0.911 ± 0.004 0.773 ± 0.008 0.886 ± 0.006
Swin-T 0.923 ± 0.003 0.909 ± 0.003 0.915 ± 0.003 0.781 ± 0.007 0.892 ± 0.005
Pure KG 0.842 ± 0.008 0.821 ± 0.009 0.828 ± 0.008 0.694 ± 0.015 0.853 ± 0.010
K-ViT 0.932 ± 0.004 0.918 ± 0.004 0.925 ± 0.004 0.796 ± 0.008 0.903 ± 0.005
KAD-Former 0 . 946 ± 0 . 003 0 . 933 ± 0 . 003 0 . 938 ± 0 . 003 0 . 826 ± 0 . 006 0 . 917 ± 0 . 004
Table 3. Cross-regional generalization performance of representative models (Mean ± SD from 5-fold cross-validation). Best results are in bold.
ModelSource (Inner Mongolia)Target-1 (Hebei)Target-2 (Yunnan)Target-3 (Internet)DGS
ResNet50 0.912 ± 0.006 0.843 ± 0.008 0.827 ± 0.009 0.821 ± 0.009 0.894 ± 0.008
EfficientNet-B3 0.921 ± 0.005 0.861 ± 0.007 0.842 ± 0.008 0.835 ± 0.008 0.901 ± 0.007
ViT-B 0.933 ± 0.004 0.873 ± 0.006 0.858 ± 0.007 0.849 ± 0.007 0.910 ± 0.007
Swin-T 0.936 ± 0.004 0.879 ± 0.005 0.864 ± 0.006 0.857 ± 0.006 0.915 ± 0.005
KAD-Former 0 . 952 ± 0 . 003 0 . 910 ± 0 . 004 0 . 897 ± 0 . 005 0 . 889 ± 0 . 005 0 . 933 ± 0 . 004
Table 4. Ablation study of KAD-Former components (Mean ± SD from 5-fold cross-validation). Best results are in bold.
Model VariantAccuracyF1-ScoremAPConsistency@5DGS
ViT-B baseline 0.915 ± 0.005 0.901 ± 0.005 0.906 ± 0.005 0.765 ± 0.008 0.881 ± 0.007
ViT-B + AKG 0.929 ± 0.004 0.916 ± 0.005 0.921 ± 0.004 0.791 ± 0.007 0.898 ± 0.006
ViT-B + AKG + SAM 0.939 ± 0.004 0.925 ± 0.004 0.930 ± 0.004 0.809 ± 0.007 0.908 ± 0.005
KAD-Former 0 . 946 ± 0 . 003 0 . 933 ± 0 . 003 0 . 938 ± 0 . 003 0 . 826 ± 0 . 006 0 . 917 ± 0 . 004
KAD-Former w/o AKG 0.933 ± 0.004 0.919 ± 0.005 0.924 ± 0.004 0.798 ± 0.008 0.902 ± 0.006
KAD-Former w/o SAM 0.936 ± 0.004 0.922 ± 0.004 0.927 ± 0.004 0.804 ± 0.007 0.905 ± 0.006
KAD-Former w/o KGA 0.938 ± 0.004 0.924 ± 0.004 0.929 ± 0.004 0.811 ± 0.007 0.908 ± 0.005
KAD-Former w/o PLS 0.941 ± 0.004 0.928 ± 0.004 0.932 ± 0.004 0.819 ± 0.007 0.911 ± 0.006
Disclaimer/Publisher’s Note: The statements, opinions and data contained in all publications are solely those of the individual author(s) and contributor(s) and not of MDPI and/or the editor(s). MDPI and/or the editor(s) disclaim responsibility for any injury to people or property resulting from any ideas, methods, instructions or products referred to in the content.