Abstract
Olive trees are generally considered a species well-adapted to drought, but the impact of water shortage is of critical importance on olive production. For this reason, developing tolerant cultivars could be an effective strategy to mitigate the impact of drought in the future. Characterizing drought stress tolerance in olive is a complex task due to the numerous traits involved in this response. In this study, plant growth, pressure–volume curves, gas-exchange and chlorophyll fluorescence traits, and stomata characteristics were monitored in nine cultivars to assess the effects of mild and severe drought stress conditions induced by withholding water for 7 and 21 days, respectively, and were compared to a well-watered control treatment. The plant materials evaluated included traditional cultivars, as well as new developed cultivars suited for high-density hedgerow olive orchards or resistant to verticillium wilt. Significant differences between cultivars were observed for most evaluated traits, with more pronounced differences under severe drought conditions. A multivariate analysis of the complete dataset recorded throughout the evaluation period allowed for the identification of promising cultivars under stress conditions (‘Sikitita’, ‘Sikitita-2’, and ‘Martina’) as well as highly discriminative traits that could serve as key selection parameters in future breeding programs.
1. Introduction
Olive (Olea europaea L.) is currently a worldwide crop that has spread to five continents, although the Mediterranean region represents the main area of cultivation. The Mediterranean climate is characterized by mild and wet winters and hot and dry summers. Under these conditions, temperature could be considered the most significant environmental factor limiting olive growing, because of either heat stress or the lack of chilling, while water availability is the most significant factor conditioning olive yield. Although olive is generally considered a species with good adaptation to drought, the effects of water shortage on olive production are of paramount importance. In general terms, irrigation considerably increases plant growth and oil yield, and even deficit irrigation strategies can more than double the yield compared to rainfed conditions [1,2]. Thus, drought could represent a major threat for future olive cultivation under predicted climate-change scenarios, with noticeable effects already undergoing. The massive reduction in Spanish production over the past two harvest seasons, amounting to around half of a regular year’s output, has led to a striking increase in price, and is a clear example of the huge potential consequences [3].
To cope with this challenge, the use of cultivars and genetic improvements for drought tolerance is considered one of the most efficient practices to contribute to climate-change adaptation and mitigation in cropland, together with other agronomic practices such as increasing soil organic matter, erosion control, and improved crop management [4]. Thus, in a recent survey for the prioritization of olive-breeding objectives in Spain, tolerance to drought stress was ranked among the highest-scoring objectives, alongside higher productivity, Verticillium wilt tolerance, and higher oil content [5].
However, the complexity of drought tolerance mechanisms and the lack of simple and accurate screening methods of selection has, until now, prevented specific breeding works for these traits. Drought-induced water scarcity can impact numerous physiological processes [6] and various drought-related traits have been used as indicators to evaluate the drought tolerance of plants [7]. Also, in olive, different studies have shown marked differences between cultivars in response to drought stress for these traits. Thus, several morpho-physiological traits have been previously reported in studies investigating olive trees under different water regimes [8,9,10], particularly those related to growth, gas exchange, photosynthesis, water-use efficiency, and nutrient uptake, as well as influential aspects of plant morphology and leaf anatomy. Some other physiological traits, classically recognized as a major physiological determinant of plant water-stress response in different plant species, have been less studied in olive. For instance, leaf pressure–volume curves allow us to extract several parameters by plotting the in-verse of leaf water potential against relative water content [11]. This methodology allows for the determination of the water potential at turgor loss point (ΨTLP, MPa), often recognized as the “higher-level” trait that quantifies leaf and plant drought tolerance most directly, by determining the range of leaf potential at which the leaf remains turgid and maintains function. Other important parameters extracted from leaf pressure–volume curves include the relative water content at the turgor loss point (RWCTLP, %), which indicates the leaf hydration at wilting; the apoplastic fraction (af, %), as the proportion of leaf water content contained in the apoplast (inside the vasculature and bound to the cell walls); and the bulk modulus of elasticity (ε, MPa), which estimates cell-wall rigidity averaged across the leaf.
But unfortunately, few cultivars are usually studied in these works, and the extent of evaluation is quite variable, usually involving a limited number of traits. Interestingly, some recent studies represent the first contribution of the response to photosynthesis of many olive cultivars subjected to moderate and severe drought conditions [12,13]. Six of the fourteen different olive cultivars evaluated in these studies were the same as those in our study, so we were able to expand the results for these common cultivars.
In our study, the physiological response to drought stress was evaluated in nine cultivars representing a broad genetic base, including both traditional cultivars and recent breeding releases, under mild and severe drought conditions induced by withholding water for 7 and 21 days, respectively, and compared to a well-watered control. A comprehensive screening of several traits was conducted, with the final objective of establishing the theoretical foundation for future breeding efforts aimed at developing new resilient cultivars adapted to the future challenges of climate change in the Mediterranean area.
2. Materials and Methods
2.1. Plant Material, Experimental Design and Growth Measurements
Nine cultivars were monitored to assess the effects of mild and severe drought stress. The plant material evaluated included traditional cultivars (‘Arbequina’, ‘Frantoio’ and ‘Picual’), as well as newly released cultivars suited for high-density hedgerow olive orchards (Sikitita’, ‘Sikitita-2’ and ‘Martina’) and newly released cultivars resistant to Verticillium wilt (‘Urgavona’, ‘Castula’ and ‘Iliturgitana’). The vegetative propagation of these cultivars was carried out using semi-hardwood stem cuttings in December 2023. The resulting plants were transplanted into 1 L pots and placed in the greenhouse facilities of Ghent University in Merelbeke-Melle, Belgium (50.9945° N, 3.7462° E) in March 2024. An average temperature of 20–25 °C and relative humidity around 80% were maintained throughout the experimental period (Figure S1). Irrigation was carried out by capillary watering mats that allow plants to absorb water from below via capillary action, helping maintain consistent root-zone moisture. Stress conditions were induced on 9 July 2024, by withholding water for 7 (mild stress, MS) and 21 days (severe stress, SS) in the same trees, and compared to a well-watered control treatment. The experiment was arranged in a split-plot design with two blocks and five plants per experimental unit. The larger main plots were assigned to stress treatments and the subplots to cultivars.
Plant height and the number of internodes in the main axis were measured on all plants at the beginning (9 July) and end (30 July) of the stress period.
2.2. Pressure–Volume Curves
Pressure–volume parameters were estimated according to Prometheus protocol in ecological and environmental science [14] via the squeeze method using a pressure chamber (PMS, Corvallis, OR, USA). Leaves were sampled and immediately subjected to rehydration by immersing their recut petioles into distilled water, after which they were stored in darkness at 2–4 °C for 24 h for complete rehydration. P-V curve points were obtained at step increases of 0.25 MPa up to pressures of −4.0 MPa. Measurements were carried out in three control plants per cultivar. Several parameters were extracted from leaf pressure–volume curves by plotting the inverse of leaf water potential against relative water content [11,14]: water potential at turgor loss point (ΨTLP, MPa), relative water content at the turgor loss point (RWCTLP, %), apoplastic fraction (af, %) and the bulk modulus of elasticity (ε, MPa).
2.3. Gas-Exchange and Chlorophyll Fluorescence Parameters
Gas-exchange and fluorescence measurements were recorded on fully expanded mature leaves using a LI-6800 Portable Photosynthesis System (LI-COR Environmental, Lincoln, NE, USA). The gas-exchange parameters monitored were light-saturated net photosynthesis (A, μmol CO2 m−2 s−1), stomatal conductance (gsw, mol H2O m−2 s−1), and leaf intrinsic water-use efficiency (WUE: A/gsw), while chlorophyll fluorescence parameters were light-adapted maximal fluorescence (Fm′), electron transport rate (ETR, µmol m−2 s−1), and quantum yield of PSII (ΦPSII). Measurements were carried out only in two plants per experimental unit close to midday to ensure completion within a short period during which environmental conditions remain as stable as possible. The environmental conditions selected in the leaf chamber were as follows: CO2 concentration: 400 ppm; light (PAR): 500 µmol photons m−2 s−1 (saturating light); flow rate: 500 µmol s−1; relative humidity: 60%; leaf temperature: 25 °C; fan speed: 10,000 r.p.m.
SPAD chlorophyll meter values were also recorded at the end of the experiment (severe stress, 21 days withholding water) on three plants per experimental unit (six leaves per plant) using a SPAD-502 Plus chlorophyll meter (Konika Minolta, Tokyo, Japan).
2.4. Stomata
Epidermal imprints of the abaxial leaf surface were obtained at the end of the experiment in control and severe stress (21 days withholding water) plants using nail polish on fully expanded mature leaves. First, black tape was firmly applied and then peeled off to effectively remove the trichomes. Next, clear nail polish was carefully applied while avoiding the midrib, allowed to dry for 20 min, and then clear tape was firmly pressed over it—avoiding air bubbles—before being removed and mounted onto a glass slide (Figure 1). Imprints were taken before the start of gas-exchange and chlorophyll fluorescence measurements. One leaf sample was prepared per experimental unit, examined with a Nikon light microscope, and four images were randomly captured and measured from each sample. Stomatal size and shape (length/width ratio) were measured on five stomata per image, and stomatal density was calculated as the number of stomata per unit of leaf area using ImageJ v. 1.54 software.
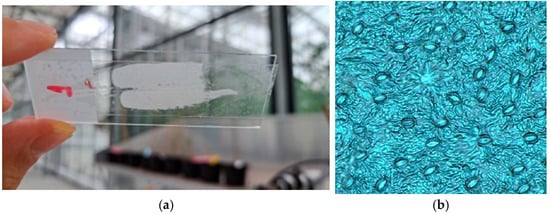
Figure 1.
An example of epidermal imprints (a) and light microscope images (b) from the abaxial leaf surface.
2.5. Statistical Analyses
Split-plot analysis of variance was carried out with block × treatment as the error term for treatments, residual for testing cultivars and cultivars × treatments, and means separated by Tukey’s test. Principal components analysis (PCA) was performed to assess the patterns of association among the different traits across cultivars and treatments. Similarly, a heatmap analysis was also used to analyze the relationships among traits and treatments. Statistical analyses were carried out using Statistix 9 (Analytical Software, Tallahassee, FL, USA), The Unscrambler (CAMO A/S, Trodheim, Norway) for PCA, and R software (v4.3.2) for heatmap using the ComplexHeatmap package.
3. Results
3.1. Characterization of Individual Traits
Plant growth before the onset of the drought stress period showed an average height of 39 cm and 15 nodes per plant, with significant differences among cultivars from ‘Iliturgitana’ to ‘Martina’. After the 21-day period of severe stress on 30 July, plant growth increased on average around 30% and 10% in well-watered control and stress treatments, respectively (Figure 2). Growth increase was similar among cultivars and independent of the trait measured (plant height or number of nodes).
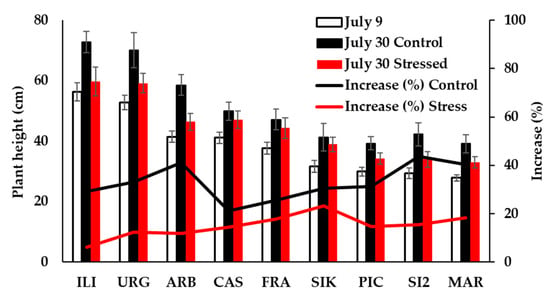
Figure 2.
Plant growth before (9 July) and after the drought stress period (30 July), in both control and stressed plants.
The shape of the pressure–volume curves was similar for all the cultivars evaluated (Figure 3), and no significant differences among them were observed for the water potential at turgor loss point (ΨTLP, MPa), with average values of 2.55 ± 0.01 MPa for all the evaluated cultivars (Table 1). However, significant differences were found for some of the derived parameters. The relative water content at the turgor loss point (RWCTLP, %) and the apoplastic fraction (af, %) showed the highest values in ‘Castula’ and the minimum in ‘Iliturgitana’, while the modulus of elasticity (ε, MPa) was highest in ‘Martina’ and lowest in ‘Picual’.
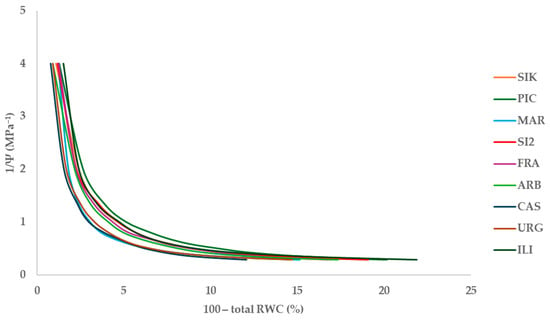
Figure 3.
Pressure–volume curves for the nine evaluated cultivars.

Table 1.
Comparison of means by cultivar for parameters extracted from pressure–volume curves.
Significant stress treatment × cultivar interactions were observed for most of the gas-exchange and fluorescence parameters studied under both mild and severe stress conditions (Figure 4). A general decrease (the opposite for WUE) in all gas-exchange and chlorophyll fluorescence parameters was observed in all cultivars, but the extent of these changes varied among cultivars. Thus, for instance, Iliturgitana’ showed marked decreases even under mild stress conditions, while ‘Sikitita’ was able to maintain these traits, particularly under mild stress conditions. Overall, Sikitita’, ‘Sikitita-2’ and ‘Martina’ exhibited the best performance in terms of gas-exchange and chlorophyll fluorescence traits, maintaining the highest values for these traits under severe stress conditions.
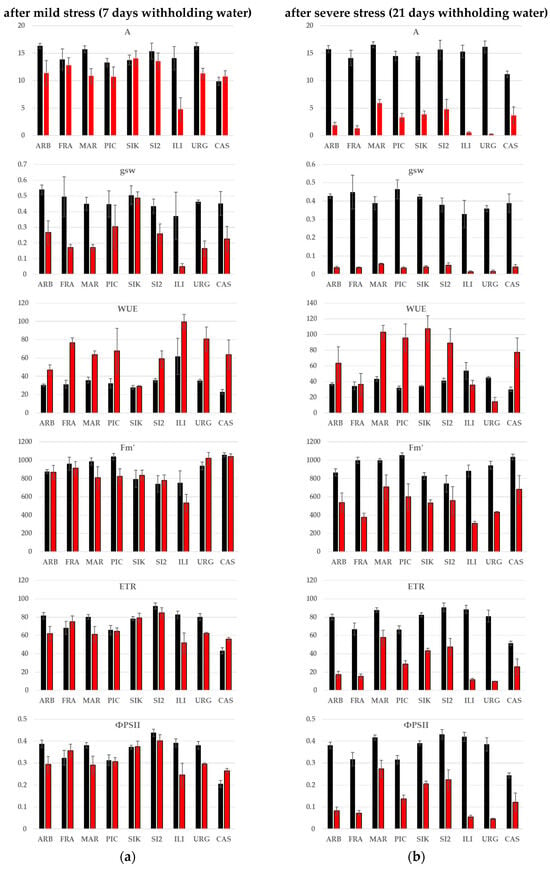
Figure 4.
Average values for gas-exchange and chlorophyll fluorescence parameters in well-watered control (black) and stress (red) plants after mild (a) and severe (b) stress (7 and 21 days after withholding water, respectively): light-saturated net photosynthesis (A, μmol CO2 m−2 s−1), stomatal conductance (gsw, mol H2O m−2 s−1), leaf intrinsic water-use efficiency (WUE: A/gsw), light-adapted maximal fluorescence (Fm′, a.u.), electron transport rate (ETR, µmol m−2 s−1), quantum yield of PSII (ΦPSII, a.u.).
Similarly, a significant stress treatment × cultivar interaction was observed for SPAD values after severe stress conditions, with values decreasing in some cultivars and increasing in others because of the stress treatment (Figure 5). In general, ‘Arbequina’ and ‘Iliturgitana’ showed the highest values, while ‘Castula’ and ‘Urgavona’ showed the lowest.
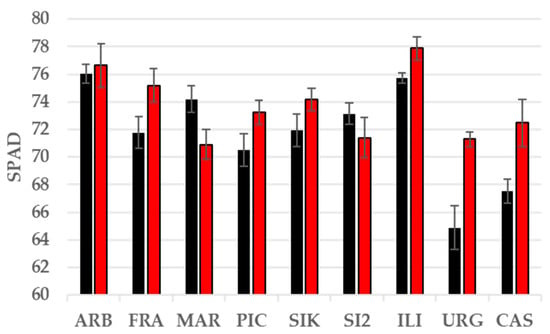
Figure 5.
Average SPAD values in well-watered control (black) and severely stressed (red) plants after withholding water for 21 days.
For stomata traits, significant differences were not obtained according to either severe stress conditions or interaction stress × cultivars. Significant differences were obtained only according to cultivar factor, except for the shape (length/width ratio) of the stomata (Figure 6). `Picual’, ‘Sikitita’, and ‘Iliturgitana’ stood out for stomatal density and total stomatal size, while ‘Sikitita2’ showed the highest individual stomatal size.
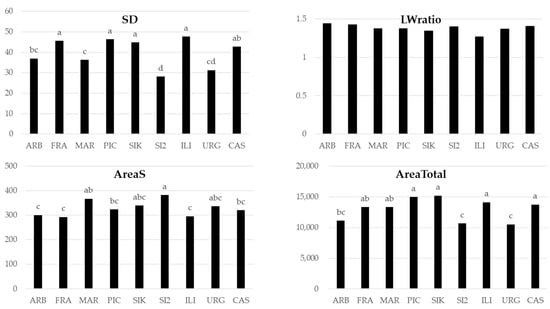
Figure 6.
Comparison of means by cultivar for stomata traits: stomatal density (SD, n mm−2), shape (length/width ratio), individual stomatal size (AreaS, μm2), and total stomatal size (AreaTotal, μm2 stomata/mm2 leaf). Different letters indicate significant differences at p < 0.05.
3.2. Multivariate Analysis
Both principal components analysis (PCA) and heatmap analysis were performed to assess association patterns among cultivars and to analyze the relationships among traits and treatments.
The first two PC explained 33% and 21% of the variability, respectively (Figure 7). A clear grouping of cultivars could be observed: ‘Sikitita2’, ‘Martina’, and ‘Sikitita’ were grouped together in the left part of PC1; ‘Urgavona’, ‘Arbequina’, ‘Frantoio’, and ‘Picual’ in the central part of the plot; while ‘Iliturgitana’ and ‘Castula’ occupied extreme values of PC1 and PC2, respectively. Several important variables can be inferred from the loadings plot. Thus, the group of ‘Sikitita2’, ‘Martina’, and ‘Sikitita’ was associated with high height increase during stress period, while maintaining high values of light-saturated net photosynthesis, light-adapted maximal fluorescence and stomatal conductance under mild and severe stress, together with high stomatal area. Strong relationships were observed for specific cultivars such as high WUE of ILI, high light-adapted maximal fluorescence of CAS. Finally, several traits, located near the origin of coordinates of the PCA plot, have apparently low discriminant weight such as parameters extracted from pressure–volume curves and SPAD.
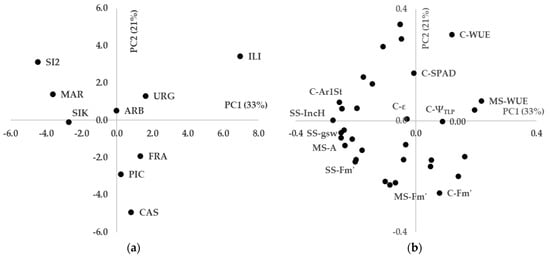
Figure 7.
PCA with average values per cultivar under control (C), moderate stress (MS), and severe stress (SS) conditions: (a) scores plot; (b) loadings plot. IncH: height increase during stress period; A: light-saturated net photosynthesis; WUE: water-use efficiency; Fm’: light-adapted maximal fluorescence; StD: stomatal density; ε: modulus of elasticity; gsw: stomatal conductance; ΨTLP: water potential at turgor loss point.
Similarly, the heatmap revealed comparable associations among cultivars with three main groups: ‘Sikitita’-‘Martina’-‘Sikitita-2’, ‘Castula’-‘Frantoio’-‘Picual’, and ‘Arbequi-na’-‘Iliturgitana’-‘Urgavona’, respectively (Figure 8). The variables are also grouped in a manner similar to the PCA results, with high correlations between some of them.
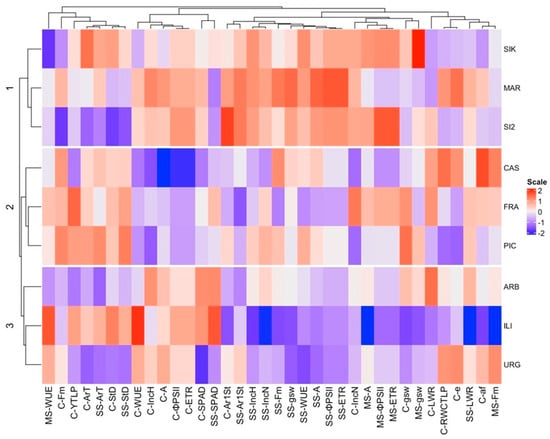
Figure 8.
A heatmap with average values per cultivar under control (C), moderate stress (MS), and severe stress (SS) conditions. WUE: water-use efficiency; Fm′: light-adapted maximal fluorescence; ΨTLP: water potential at turgor loss point; ArT: total stomatal area; StD: stomatal density; IncH: height increase during stress period; A: light-saturated net photosynthesis; ΦPSII: quantum yield of PSII; ETR: electron transport rate; Ar1St: stomata area; IncN: number of nodes increase during stress period; gsw: stomatal conductance; ε: modulus of elasticity; LWR: stomata length/width ratio; RWCTLP: relative water content at the turgor loss point; af: apoplastic fraction.
4. Discussion
From an agronomic perspective, breeding for drought tolerance should aim to enhance this trait while minimizing the impact on other traits, particularly yield, also called agronomic drought tolerance [15]. Thus, general selection for yield could represent an integrated empirical approach considering the wide array of traits related to productivity under drought stress conditions. However, this strategy is difficult to implement in fruit trees like olive due to the amount of space, time, and work needed.
Therefore, an indirect approach based on understanding and measuring of specific morphological, physiological, biochemical, and molecular traits could be highly beneficial instead of empirical selection. In olives, drought-induced water scarcity affects certain traits that have been previously used to assess drought tolerance [6]. However, in the studies conducted so far, only a limited number of cultivars have typically been examined, and the scope of evaluation is quite variable, often involving a few traits. A comprehensive evaluation of these traits under drought stress conditions induced by withholding water for 7 and 21 days in a wide set of plant materials was carried out in our study.
The general growth of olive plants was reduced under drought stress conditions compared to control ones, as previously reported in similar studies growing olive trees in pots under greenhouse conditions [9]. Under field conditions, canopy growth (but not root growth) was drastically reduced in non-irrigated plants, as a potential defense strategy against water deficit, having a better root/leaf ratio and consequently a greater availability of water for the leaves [16]. However, this effect reported under field conditions was not always observed in pot experiments even when genotypes with contrasting growth habit were tested [17,18]. Root growth could not be characterized in our study and the growth of the aerial part of the plants was similarly affected among cultivars for the drought stress treatments.
Cell turgor loss is a classical indicator of plant drought stress related to whole-plant performance and consequently used to assess physiological drought tolerance. Several works have attempted to correlate parameters extracted from leaf pressure–volume curves with various aspects of drought tolerance in different plant species [19,20]. However, in olive, this methodology has been very occasionally reported and usually only for single cultivars [21,22]. The only comparative work so far reported [8] showed significant differences among olive cultivars for some of these traits, with some cultivars showing lower values for osmotic potential and relative water content at full turgor, suggesting a greater capability for osmotic adjustment. We found no significant differences among cultivars for water potential at turgor loss point (ΨTLP), but a group of cultivars showed significant lower values for relative water content at the turgor loss point (RWCTLP), suggesting a greater capability for osmotic adjustment (‘Picual’, ‘Sikitita’, ‘Sikitita-2’, and ‘Iliturgitana’). The same cultivars also showed low values for their modulus of elasticity (flexible walls). This should allow for more volume change (greater cell shrinkage following dehydration), enhancing turgor maintenance and buffering under drought [8].
The olive tree tightly regulates its stomatal behavior to uphold optimal water potential and prevent unnecessary water loss [23]. Drought stress reduces stomatal conductance and therefore the quantity of CO2 taken up by the leaves, as well as net carbon assimilation and the general plant growth [10]. The extent and pace at which these processes (a reduction in stomatal conductance and net carbon assimilation) took place were different among cultivars and stress treatment × cultivar interactions, which affects their tolerance to drought stress [9,10]. As expected from previous studies [6,12], stomatal conductance was relatively more affected than net carbon assimilation. Therefore, water-use efficiency (WUE), defined as the relationship between assimilation and stomatal conductance, was higher under drought stress conditions. Overall, ‘Iliturgitana’ showed the best WUE under control and mild stress conditions, and behaved poorly under severe stress conditions, where ‘Martina’, ‘Picual’, ‘Sikitita’, ‘Sikitita-2’, and ‘Castula’ showed the best performance in terms of WUE.
Several characteristics of olive leaves have been associated with drought adaptation, showing inherent differences among cultivars. It has been previously reported that leaves developed under drought stress usually have more but smaller stomata than leaves under well-watered conditions [24]. Stomata traits evaluated in our study showed no effect of stress conditions, with only constitutive differences according to cultivars. However, it should be noted that the leaves were already developed before the onset of the water-stress treatments. A higher stomatal density has been suggested to allow for a more precise regulation of transpiration [25], although the opposite effect has also been reported [10].
Even when stomatal restrictions do not result in the inactivation of photosynthetic activity, non-stomatal factors could finally inhibit primary photochemistry and electron transport in chloroplasts by photoinhibition [26]. Thus, the photosynthetic light-reaction responses, measured with some chlorophyll fluorescence parameters, generally decrease during drought stress [9,27]. However, as for gas-exchange parameters, the extent and pace at which these processes took place showed differences among cultivars and stress treatment × cultivar interactions. Some cultivars even achieved more efficient photosynthesis under moderate drought conditions than under control conditions, although all parameters significantly decreased under severe drought stress conditions. Similar variability was also previously reported [13].
For SPAD values, measured in this study only after severe stress conditions, no clear results were obtained. A significant stress treatment × cultivar interaction was observed, with values decreasing in some cultivars and increasing in some others. It should be noted that there are specific challenges and limitations for SPAD measurements due to the unique characteristics of olive leaves. The calibration of meter readings is difficult, and a generic approach for this conversion remains elusive [28]. The thick, leathery nature of olive leaves often leads to saturation and structural variability that SPAD meters do not account for directly. In addition, previous studies in olive by the direct quantification of pigments determined a decrease under drought stress [27], although no stress-related differences were observed in other studies [10].
Finally, a multivariate analysis of the complete dataset recorded throughout the evaluation period allowed for the identification of the most promising cultivars, i.e., those showing consistently high values for most physiological traits under different drought stress scenarios, could be considered as more efficient or tolerant genotypes (Sikitita’, ‘Sikitita-2’, and ‘Martina’). It should be noted that a quite similar classification was previously reported for some of the cultivars evaluated in our study according to their tolerance to water deficit and their optimal light intensity interval of growth [12,13]. The results obtained when evaluating the drought tolerance of common cultivars under similar controlled conditions were quite similar, with ‘Martina’ and ‘Sikitita2’ classified as tolerant, ‘Frantoio’, ‘Sikitita’, and ‘Picual’ as moderately tolerant, and ‘Arbequina’ as moderately sensitive. The grouping among variables also indicates different loading weights and correlations between some of them, which suggests the possibility of simplifying the number of traits needed to be evaluated for classification.
It should be noted that these results were obtained under controlled greenhouse conditions, where temperature and humidity resulted in a relatively low vapor pressure deficit—unlike what typically occurs in the field under drought stress. Therefore, stomatal responses to reduced soil water content in field conditions may not necessarily mirror those observed in the greenhouse [29]. Additionally, cultivar behavior could differ under environmental drought compared to controlled settings.
5. Conclusions
Breeding for drought tolerance in fruit trees like olive represents a huge challenge that will be necessary to address in the coming years. The complexity of drought tolerance mechanisms and limited information regarding olive currently makes it difficult to develop new tolerant cultivars. This study aims to increase the knowledge on the above-mentioned topics in olive, with the final objective of promoting breeding attempts in the coming years. The final classification of cultivars as tolerant to drought stress could be variable, according to the evaluated traits, which do not always go in the same direction. The results of our study suggest some traits that are highly efficient for selection, particularly gas-exchange parameters and stomatal area. From a breeding perspective, the final selection of screening traits should also fulfill specific requirements to value its usefulness, such as wide genetic variability, high heritability and correlation with yield traits, and fast, cheap, and easy measurement. This should be considered in future studies. The results obtained also highlight certain cultivars as potentially better adapted to future drought scenarios. Interestingly, the most promising ones (‘Sikitita’, ‘Sikitita-2’, and ‘Martina’) were newly released cultivars selected for other traits, which underlines the potential of breeding for the selection of new adapted materials. These conclusions must, however, be confirmed under field conditions for a proper validation of the results.
Supplementary Materials
The following supporting information can be downloaded at: https://www.mdpi.com/article/10.3390/horticulturae11070745/s1, Figure S1: Average temperature and relative humidity during the experimental period.
Author Contributions
Conceptualization, L.L. and K.S.; Data curation, L.L.; Funding acquisition, L.L. and K.S.; Methodology, L.L., W.G., H.C., O.L. and K.S.; Writing—original draft, L.L.; Writing—review and editing, L.L., W.G., H.C., O.L. and K.S. All authors have read and agreed to the published version of the manuscript.
Funding
L.L. is thankful for the research mobility grant PRX22/00329 from the Spanish Ministry of Universities. H.C. and W.G. acknowledge funding by the Research Foundation-Flanders (FWO), grant numbers FWO.3F0.2022.0048.01 and 1S16024N, respectively.
Data Availability Statement
The data presented in this study are available on request from the corresponding author.
Acknowledgments
We thank Hande Yılmaz-Düzyaman for assistance with the statistical analyses using R software, and Raúl de la Rosa for careful review of the manuscript.
Conflicts of Interest
The authors declare no conflicts of interest.
Abbreviations
The following abbreviations are used in this manuscript:
| MS | mild stress |
| SS | severe stress |
| A | light-saturated net photosynthesis |
| WUE | water-use efficiency |
| Fm′ | light-adapted maximal fluorescence |
| ETR | electron transport rate |
| ΦPSII | quantum yield of PSII |
| PCA | Principal components analysis |
| P-V | Pressure–volume |
| RWCTLP | relative water content at the turgor loss point |
| Af | apoplastic fraction |
| ε | modulus of elasticity |
References
- Moriana, A.; Orgaz, F.; Pastor, M.; Fereres, E. Yield Responses of a Mature Olive Orchard to Water Deficits. J. Am. Soc. Hortic. Sci. 2003, 128, 425–431. [Google Scholar] [CrossRef]
- Fernandes-Silva, A.A.; Ferreira, T.C.; Correia, C.M.; Malheiro, A.C.; Villalobos, F.J. Influence of Different Irrigation Regimes on Crop Yield and Water Use Efficiency of Olive. Plant Soil 2010, 333, 35–47. [Google Scholar] [CrossRef]
- Economic Affairs & Promotion Unit. Available online: https://www.internationaloliveoil.org/what-we-do/economic-affairs-promotion-unit/ (accessed on 30 May 2025).
- Nabuurs, G.-J.; Mrabet, R.; Abu Hatab, A.; Bustamante, M.; Clark, H.; Havlík, P.; House, J.I.; Mbow, C.; Ninan, K.N.; Popp, A.; et al. Agriculture, Forestry and Other Land Uses (AFOLU). In Climate Change 2022: Mitigation of Climate Change. Contribution of Working Group III to the Sixth Assessment Report of the Intergovernmental Panel on Climate Change; Shukla, P.R., Skea, J., Slade, R., Al Khourdajie, A., van Diemen, R., McCollum, D., Pathak, M., Some, S., Vyas, P., Fradera, R., et al., Eds.; Cambridge University Press: Cambridge, UK; New York, NY, USA, 2022; pp. 747–860. [Google Scholar]
- León, L.; De La Rosa, R.; Arriaza, M. Prioritization of Olive Breeding Objectives in Spain: Analysis of a Producers and Researchers Survey. Span. J. Agric. Res. 2021, 19, e0701. [Google Scholar] [CrossRef]
- Brito, C.; Dinis, L.-T.; Moutinho-Pereira, J.; Correia, C.M. Drought Stress Effects and Olive Tree Acclimation under a Changing Climate. Plants 2019, 8, 232. [Google Scholar] [CrossRef] [PubMed]
- Fang, Y.; Xiong, L. General Mechanisms of Drought Response and Their Application in Drought Resistance Improvement in Plants. Cell. Mol. Life Sci. 2015, 72, 673–689. [Google Scholar] [CrossRef] [PubMed]
- Bacelar, E.A.; Moutinho-Pereira, J.M.; Gonçalves, B.C.; Lopes, J.I.; Correia, C.M. Physiological Responses of Different Olive Genotypes to Drought Conditions. Acta Physiol. Plant 2009, 31, 611–621. [Google Scholar] [CrossRef]
- Boussadia, O.; Omri, A.; Mzid, N. Eco-Physiological Behavior of Five Tunisian Olive Tree Cultivars under Drought Stress. Agronomy 2023, 13, 720. [Google Scholar] [CrossRef]
- Parri, S.; Romi, M.; Hoshika, Y.; Giovannelli, A.; Dias, M.C.; Piritore, F.C.; Cai, G.; Cantini, C. Morpho-Physiological Responses of Three Italian Olive Tree (Olea europaea L.) Cultivars to Drought Stress. Horticulturae 2023, 9, 830. [Google Scholar] [CrossRef]
- Bartlett, M.K.; Scoffoni, C.; Sack, L. The Determinants of Leaf Turgor Loss Point and Prediction of Drought Tolerance of Species and Biomes: A Global Meta-Analysis. Ecol. Lett. 2012, 15, 393–405. [Google Scholar] [CrossRef]
- Rico, E.I.; De La Fuente, G.C.M.; Morillas, A.O.; Ocaña, A.M.F. Physiological and Biochemical Study of the Drought Tolerance of 14 Main Olive Cultivars in the Mediterranean Basin. Photosynth. Res. 2024, 159, 1–16. [Google Scholar] [CrossRef]
- Martos De La Fuente, G.C.; Viñegla, B.; Illana Rico, E.; Fernández Ocaña, A.M. Study of the Photosynthesis Response during the Gradual Lack of Water for 14 Olea europaea L. Subsp Europaea Cultivars and Their Adaptation to Climate Change. Plants 2023, 12, 4136. [Google Scholar] [CrossRef]
- Leaf Pressure-Volume Curve Parameters. Available online: https://prometheusprotocols.net/function/water-relations/pressure-volume-curves/leaf-pressure-volume-curve-parameters/ (accessed on 30 May 2025).
- Liu, Y.; Ning, K.; Chen, S.; Moshelion, M.; Xu, P. Potential Breeding Target Genes for Enhancing Agronomic Drought Resistance: A Yield-survival Balance Perspective. Plant Breed. 2023, 142, 721–731. [Google Scholar] [CrossRef]
- Dichio, B.; Romano, M.; Nuzzo, V.; Xiloyannis, C. Soil Water Availability and Relationship Between Canopy and Roots in Young Olive Trees (cv. Coratina). Acta Hortic. 2002, 586, 255–258. [Google Scholar] [CrossRef]
- Di Vaio, C.; Marra, F.P.; Scaglione, G.; La Mantia, M.; Caruso, T. The Effect of Different Vigour Olive Clones on Growth, Dry Matter Partitioning and Gas Exchange under Water Deficit. Sci. Hortic. 2012, 134, 72–78. [Google Scholar] [CrossRef]
- Tognetti, R.; Costagli, G.; Minnocci, A.; Gucci, R. Stomatal behaviour and water use efficiency in two cultivars of Olea europaea L. Agric. Mediterr. 2002, 132, 90–97. [Google Scholar]
- Bartlett, M.K.; Scoffoni, C.; Ardy, R.; Zhang, Y.; Sun, S.; Cao, K.; Sack, L. Rapid Determination of Comparative Drought Tolerance Traits: Using an Osmometer to Predict Turgor Loss Point. Methods Ecol. Evol. 2012, 3, 880–888. [Google Scholar] [CrossRef]
- Lenz, T.I.; Wright, I.J.; Westoby, M. Interrelations among Pressure–Volume Curve Traits across Species and Water Availability Gradients. Physiol. Plant. 2006, 127, 423–433. [Google Scholar] [CrossRef]
- Dichio, B.; Xiloyannis, C.; Angelopoulos, K.; Nuzzo, V.; Bufo, S.A.; Celano, G. Drought-Induced Variations of Water Relations Parameters in Olea europaea. Plant Soil 2003, 257, 381–389. [Google Scholar] [CrossRef]
- Fernandes, R.D.M.; Cuevas, M.V.; Diaz-Espejo, A.; Hernandez-Santana, V. Effects of Water Stress on Fruit Growth and Water Relations between Fruits and Leaves in a Hedgerow Olive Orchard. Agric. Water Manag. 2018, 210, 32–40. [Google Scholar] [CrossRef]
- Hernandez-Santana, V.; Diaz-Rueda, P.; Diaz-Espejo, A.; Raya-Sereno, M.D.; Gutiérrez-Gordillo, S.; Montero, A.; Perez-Martin, A.; Colmenero-Flores, J.M.; Rodriguez-Dominguez, C.M. Hydraulic Traits Emerge as Relevant Determinants of Growth Patterns in Wild Olive Genotypes Under Water Stress. Front. Plant Sci. 2019, 10, 291. [Google Scholar] [CrossRef]
- Fernández, J.-E. Understanding Olive Adaptation to Abiotic Stresses as a Tool to Increase Crop Performance. Environ. Exp. Bot. 2014, 103, 158–179. [Google Scholar] [CrossRef]
- Bosabalidis, A.M.; Kofidis, G. Comparative Effects of Drought Stress on Leaf Anatomy of Two Olive Cultivars. Plant Sci. 2002, 163, 375–379. [Google Scholar] [CrossRef]
- Petridis, A.; Therios, I.; Samouris, G.; Koundouras, S.; Giannakoula, A. Effect of Water Deficit on Leaf Phenolic Composition, Gas Exchange, Oxidative Damage and Antioxidant Activity of Four Greek Olive (Olea europaea L.) Cultivars. Plant Physiol. Biochem. 2012, 60, 1–11. [Google Scholar] [CrossRef]
- Dias, M.C.; Correia, S.; Serôdio, J.; Silva, A.M.S.; Freitas, H.; Santos, C. Chlorophyll Fluorescence and Oxidative Stress Endpoints to Discriminate Olive Cultivars Tolerance to Drought and Heat Episodes. Sci. Hortic. 2018, 231, 31–35. [Google Scholar] [CrossRef]
- Zhang, R.; Yang, P.; Liu, S.; Wang, C.; Liu, J. Evaluation of the Methods for Estimating Leaf Chlorophyll Content with SPAD Chlorophyll Meters. Remote Sens. 2022, 14, 5144. [Google Scholar] [CrossRef]
- Fernández, J.E.; Moreno, F.; Girón, I.F.; Blázquez, O.M. Stomatal Control of Water Use in Olive Tree Leaves. Plant Soil 1997, 190, 179–192. [Google Scholar] [CrossRef]
Disclaimer/Publisher’s Note: The statements, opinions and data contained in all publications are solely those of the individual author(s) and contributor(s) and not of MDPI and/or the editor(s). MDPI and/or the editor(s) disclaim responsibility for any injury to people or property resulting from any ideas, methods, instructions or products referred to in the content. |
© 2025 by the authors. Licensee MDPI, Basel, Switzerland. This article is an open access article distributed under the terms and conditions of the Creative Commons Attribution (CC BY) license (https://creativecommons.org/licenses/by/4.0/).