Abstract
In the conventional agricultural production process, the harvesting of mature fruits is frequently dependent on the observation and labor of workers, a process that is often time-consuming and labor-intensive. This study proposes an enhanced YOLOv7 detection and recognition model that incorporates a cross-spatial-channel 3D attention mechanism, a prediction head, and a weighted bidirectional feature pyramid neck optimization. The motivation for this study is to address the issues of uneven target distribution, mutual occlusion of fruits, and uneven light distribution that are prevalent in harvesting operations within orchards. The experimental findings demonstrate that the proposed model achieves an mAP@0.5–0.95 of 89.3%, representing an enhancement of 8.9% in comparison to the initial network. This method has resolved the issue of detecting and positioning the harvesting manipulator in complex orchard scenarios, thereby providing technical support for unmanned agricultural operations.
1. Introduction
The comprehensive mechanization rate of orchards in China is only 25.88% [1], while the mechanization rate is only around 5%. According to data from the US Department of Agriculture (USDA) database and the China Apple Industry Association, the apple output in the 2021–2022 production season reached 459.73 million tons, accounting for 56.4%. China’s apple production ranks first in the world, with a national apple cultivation area of 2 million hectares [2]. Apples are the most widely planted fruit in China, and their output accounts for one-eighth of the total fruit output [3]. The fruit-harvesting process in orchards is mainly done by hand, and the overall level of mechanization is even lower [4]. The harvesting process is time-consuming and labor-intensive. Currently, the labor input in this stage accounts for almost half of the entire production and planting process, ranging from 40% to 50%, and even reaching 67% [5]. The cost of picking the fruits can reach 50% to 70% of the total cost. Coupled with the shortage of the rural labor force, it is difficult to recruit workers during the picking season, resulting in delayed picking and thus affecting the quality of the fruits. This has had a significant negative impact on farmers’ income and the development of the industry [6]. Zhao [7] once used apples as an example to illustrate that 55% of the world’s apple production comes from China, but the mechanization rate of apple harvesting in China is less than 3%. The manual operation efficiency is very low, and workers can only harvest 300 kg per day. The existing mechanical harvesting equipment often fails to accurately identify the positions of the fruits, resulting in missed harvests of fruits or incorrect harvests of leaves. This makes it difficult to effectively enhance the efficiency and quality of robotic harvesting [8].
Computer vision, based on the large-scale popularization of computers, is widely applied in machine understanding and high-level computational analysis of visual information, including scene object recognition, detection, object tracking, instance segmentation, pose and motion estimation [9], object and scene modeling, and pixel restoration [10]. Object detection is one of the challenging problems in computer vision. In recent years, with the rapid advancement of deep learning, scholars both domestically and internationally have conducted extensive research.
Hu proposed an apple target detection and localization method based on the combination of the improved YOLOX and RGB-D depth camera [11]. The experiments have shown that the F1 value of the proposed method reaches 93%, the mAP@0.5 reaches 94.09%, and the positioning errors in the X, Y, and Z directions are less than 7 mm, 7 mm, and 5 mm, respectively. Ji et al. [12] proposed an improved YOLOX algorithm for target detection of apple fruits. It is based on the YOLOX-tiny network and incorporates the lightweight model ShuffleNetv2 and the CBAM attention mechanism. Additionally, an Adaptive Spatial Feature Fusion (ASFF) module is added to the PANet network. The results show that the mAP@0.5, precision, recall rate, and F1 score of this network model are 96.76%, 95.62%, 93.75% and 0.95, respectively. Kumar integrated an adaptive pooling scheme and an attribute enhancement model into the YOLOv5 architecture and introduced a loss function to obtain accurate bounding boxes, thereby maximizing the detection accuracy [13]. This model can detect smaller objects and improve feature quality to detect apples in complex backgrounds, with precision, recall rate, and F1 score being 97%, 99%, and 98%, respectively.
Deep learning methods can extract high-dimensional features of fruits, effectively resisting the effects of lighting, overlap, and occlusion [14,15], and have robustness in detecting apple targets with high recognition accuracy. The training time of the AlexNet and VGG16 network models is relatively long, and they are not easily deployable; the network structure of CenterNet is prone to misjudging the center points of two objects of the same category that are close to each other. Although two-stage recognition algorithms such as Mask RCNN boast high accuracy, their models are large and the recognition time is lengthy; The YOLO algorithm, with its advantages of easy deployment, efficient training, and high recognition accuracy, meets the requirements for real-time apple target detection in unstructured orchard environments [16,17,18]. However, it demonstrates suboptimal performance in scenarios involving object occlusion, overlapping instances, and small-target detection tasks within unstructured orchard environments. Therefore, modifications to the original model framework are required to achieve accurate identification of fruit targets under these agriculturally challenging conditions.
Typical object detection algorithms are primarily categorized into two-stage and one-stage approaches. Representative two-stage algorithms, such as Faster R-CNN, R-CNN, and Fast R-CNN, require generating Region Proposals through heuristic methods or convolutional neural networks, followed by classification and regression operations. This framework necessitates a two-step training process: (1) training the Region Proposal Network (RPN); (2) training the core object detection network. Two-stage algorithms exhibit slightly higher detection accuracy while demonstrating relatively lower detection speed [19]. Representative one-stage algorithms, such as SSD and YOLO, directly output class and location information through their backbone networks without requiring Region Proposal Networks (RPNs). Compared to two-stage approaches, these methods achieve faster detection speeds at the expense of slightly reduced accuracy [20]. To achieve the detection and recognition of apple fruits in complex orchard environments, it is necessary to select a detection network that features fast detection speed, high recognition accuracy and excellent performance [21]. Wang proposed a multi-pose pitaya detection method based on the optimized YOLOv7 model. They compared the YOLOv7 algorithm with YOLOv4-tiny, YOLOv5, YOLOX, SSD, Faster-RCNN and other algorithms. The results showed that the YOLOv7 network had higher inference speed and detection accuracy than the other algorithms. Specifically, P was 82.3%, R was 83.7%, F1 was 83.0%, and mAP was 91.9%, demonstrating its performance advantage [22].
YOLOv7 is a typical single-stage object detection algorithm that features high accuracy, ease of training, and fast detection speeds. Higher detection accuracy and faster reasoning speed can be achieved without increasing computational cost, meeting the requirements of precise real-time picking. However, in the detection tasks of complex orchard environments with occlusions, there are still missed detections, indicating that there is room for improvement and enhancement. Without increasing the cost of reasoning, higher detection accuracy and faster reasoning speed were achieved, meeting the requirements of precise real-time harvesting [23]. However, in the detection tasks of complex orchard environments with occlusions, there are still missed detections, indicating that there is room for improvement and enhancement.
The present study utilized real orchard images as the underlying dataset. The characteristics of apples were utilised to enhance the feature extraction network, loss function, and detection boxes of YOLOv7. The photographs were initially labelled and subsequently underwent a training process to derive the model parameters. The trained model was then utilised for the purpose of performance evaluation. The primary components of this study were as follows: (1) an enhanced YOLOv7-based apple recognition model is proposed, integrating the Game Attention Mechanism, BiFPN multi-scale neck optimization, and improved prediction heads; (2) ablation and comparative experiments were conducted to clarify the contribution of each module; and (3) the optimized model was integrated into an apple harvesting system to achieve practical visual recognition for robotic harvesting applications.
2. Materials and Methods
2.1. Improvement of the Apple Detection Model Architecture Based on YOLOv7
The YOLOv7 model is primarily composed of a backbone network and a head module. The network structure diagram utilised in this study is depicted in Figure 1. Initially, the input image is resized to convert it into a 640 × 640 × 3 RGB image. During the scaling and padding process, the samples are adaptively padded to preserve the aspect ratio. Prior to the training phase, the K-means++ algorithm is employed to execute clustering calculations on the dataset, with the anchor boxes undergoing a reverse update process. The function of the backbone is to perform feature extraction from the input image. The purpose of the head module is to fuse multi-scale feature information to generate four effective feature layers. Finally, the detection head identifies the feature points within these layers and provides the position, confidence level and category information of the target object.
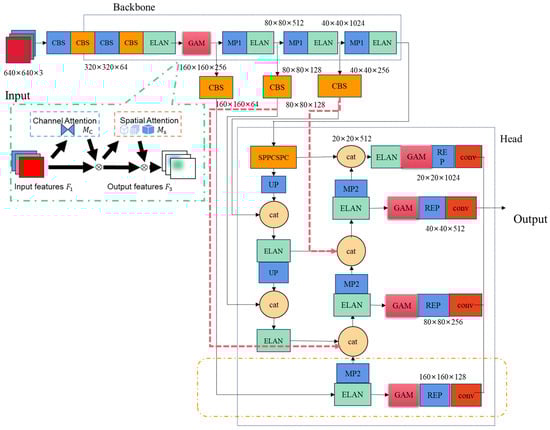
Figure 1.
YOLOv7-imp network structure, where the YOLOv7 network integrates the gam attention mechanism, the BiFPN module and the small target detection layer. Note: The GAM attention mechanism is within the green box; The red arrows indicate the flow direction of the newly added information; The orange box contains the added auxiliary detection head. The feature map dimension of 640 × 640 × 3 follows the standard tensor dimension representation of Height × Width × Channels, and the same notation applies to all subsequent dimension descriptions.
The head adopts a Bi-directional Feature Pyramid Network (BiFPN) structure, serving as the classification and regression component. First, the C5 feature map output from the backbone undergoes SPPCSPC processing for channel dimensionality reduction. The SPPCSP module integrates CSP (Cross Stage Partial) and SPP (Spatial Pyramid Pooling): The CSP splits the feature map into two branches: one passes directly to the module’s end via standard convolutions; The SPP branch applies four parallel pooling kernels of varying sizes, consolidating multi-scale features into a fixed-size output. These two branches are concatenated and processed by a standard convolution, reducing channels from 1024 to 512. This design enhances the receptive field, improves discriminative feature extraction, avoids redundancy, and reduces computational costs. Subsequently, the refined features are upsampled and fused with C4 and C3 to generate feature maps {P2, P3, P4}. Starting from P2, a bottom-up path performs downsampling and fuses with {P3, P4, C3, C4, C5}, enabling bidirectional cross-scale feature refinement. This bidirectional propagation facilitates the decoupling and enhancement of semantic information and spatial localization across different scales. Finally, the Neck’s output features are passed through a RepConv (re-parameterized convolution) and a GAM (Global Attention Mechanism) module to further adjust channel-wise dependencies. A 1 × 1 convolutional head then predicts object classes, confidence scores, and bounding-box coordinates.
2.1.1. Backbone Network Optimization Based on Gam (Global Attention Mechanism)
Convolutional Neural Networks (CNNs) have been extensively applied to a wide range of tasks and applications in the field of computer vision. During the process of feature extraction through layered convolutions, the presence of superfluous background information frequently impedes the acquisition of discriminative feature representations. Attention mechanisms are thus introduced with a view to inhibiting background interference and focusing model learning on critical information extraction [13]. The attention mechanism in deep learning is a computational approach that mimics the human brain’s visual perception process. In a manner analogous to biological perceptual systems, the subject guides neural networks to concentrate computational resources on task-relevant segments of input data. The mechanism is enabled by tadaptive assignment of weights to different input components, where the weights mathematically reflect the criticality of each segment to the task. This enables models to selectively prioritise essential information while suppressing irrelevant background noise. The present study adopts the Global Attention Mechanism (GAM) module, which operates across both spatial and channel dimensions to mitigate information attenuation and enhance global cross-dimensional feature interactions. The calculation of weights for three dimensions—channels, spatial width and height—has been demonstrated to enhance feature extraction efficiency and strengthen the network’s representational capacity. This mechanism effectively preserves global contextual information while amplifying cross-dimensional interactions. As demonstrated in Figure 2, in a manner analogous to CBAM’s sequential processing of spatial and channel information to generate distinct weights 12, Gam remodels sub-modules to optimise cross-dimensional mapping.
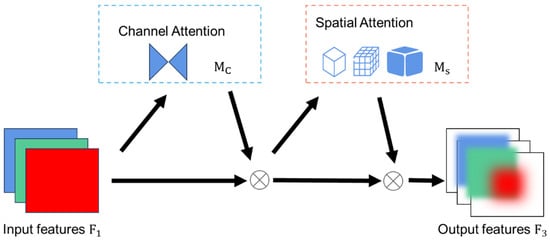
Figure 2.
Schematic diagram of gam attention mechanism, where the blue box represents the channel attention module, and the red box represents the spatial attention module.
The Global Attention Mechanism (GAM) performs sequential attention processing across the channel and spatial dimensions, computing attention weights among the channels, spatial width, and height. The model demonstrates notable capacity for generalization, as well as considerable robustness. In a manner analogous to the sequential processing of CBAM (channel-first followed by spatial), the channel-processed feature mapping, denoted F2, is defined as a function of the input feature map , and the output state resulting from spatial processing is designated F3. The computational expressions formulas for F2 and F3 are as follows:
The symbol Mc designates the channel attention map, Ms denotes the spatial attention map, and ⨂ denotes elementwise multiplication.
As illustrated in Figure 3, the channel attention submodule employs 3D permutation to extract cross-dimensional feature information, followed by a two-layer MLP (Multilayer Perceptron) to amplify channel-spatial dependencies. The MLP adopts an encoder–decoder structure analogous to BAM, with a compression ratio of ‘r’.
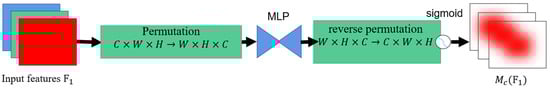
Figure 3.
Channel attention module, where the channel attention component employs a two-layer MLP to refine features through dimensionality reduction, nonlinear activation, and dimensionality restoration, ultimately generating channel weights via a sigmoid function for feature recalibration.
The symbol ‘σ’ denotes the sigmoid activation function, whilst ‘P’ denotes dimension transformation. The symbol ‘RP’ denotes the inverse dimension transformation, and ‘MLP’ denotes the operation of a two-layer perceptron.
As demonstrated in Figure 4, within the channel attention submodule, a dual convolutional layer is utilized to amalgamate spatial information, thereby enhancing the focus on spatial features. In comparison with CBAM’s channel information processing, this approach reduces computational load by circumventing max-pooling operations. As richer feature information from the network is of greater critical importance, the pooling layer is removed in order to preserve feature maps [24].
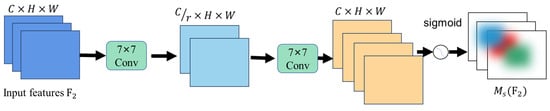
Figure 4.
Spatial attention module, where the spatial attention mechanism employs two convolutional layers and batch normalization to refine spatial details and stabilize features, ultimately generating a synthesized feature contour that enhances the model’s contextual understanding.
The symbol ‘σ’ denotes the sigmoid activation function, ‘R’ denotes data compression, and ‘Conv’ denotes convolution.
Initially, the number of channels is to be compressed using a convolution with a kernel size of seven. This is then to be expanded by means of an additional convolution operation with a kernel size of seven. The process is then activated by applying sigmoid activation.
2.1.2. Optimization Based on Normalized Wasserstein Distance over IoU
The scale and aspect ratio of anchor boxes are manually initialized based on dataset annotations. In the process of modifying anchor boxes for orchard datasets using the k-means algorithm according to feature layers, misalignment with the network may occur. It is imperative to acknowledge the pivotal role that the scale and aspect ratio of anchor boxes play in determining the accuracy of object detection.
The positive/negative sample assignment is contingent upon the utilisation of IoU thresholds. During the computational process, Non-Maximum Suppression (NMS) for label assignment employs the Intersection Over Union (IoU) metric as the evaluation criterion. However, the IoU is susceptible to substantial variations when subjected to minor positional adjustments in low-pixel targets.
It is evident that minor deviations in positional data can result in significant fluctuations in the IoU, thereby exerting a substantial influence on the process of label assignment. It has been demonstrated that variations in deviation magnitude have the capacity to result in erroneous positive/negative sample assignments. In instances where target scales are of a particularly diminutive nature, anchor boxes may be found to lack the necessary overlap with ground-truth boxes to meet the IoU threshold. It is evident that the IoU function is only operational when there is an overlap between bounding boxes. In contrast, the GIoU introduces a penalty term, yet it reduces to the conventional IoU when boxes fully contain each other. Consequently, DIoU and CIoU were proposed to address the sensitivity of IoU-based loss functions to positional shifts in small-sized objects.
By replacing IoU with the Normalized Wasserstein Distance (NWD) as the similarity metric, bounding boxes are modeled as 2D Gaussian distributions, and NWD measures the similarity between these Gaussian distributions. NWD exhibits three key advantages for small-object detection: scale invariance, smoothness to positional deviations, and the ability to measure similarity between non-overlapping or nested bounding boxes. Therefore, NWD is integrated into anchor-based detectors to replace IoU in label assignment, non-maximum suppression (NMS), and loss functions, thereby improving the IoU metric.
The NWD loss function converts the rectangular box into a smooth two-dimensional Gaussian distribution and establishes an inscribed elliptical model for the bounding box. It has been demonstrated that detected objects frequently manifest non-rectangular shapes, a phenomenon that results in rectangular bounding boxes encompassing intricate background information. The target object features and background information are both concentrated near the centre and boundaries of the bounding box. By constructing a 2D Gaussian distribution within the bounding box, the model assigns the highest weight to the central pixel, with pixel importance progressively decreasing from the center toward the boundaries. The density contour of the two-dimensional Gaussian distribution is expressed as follows for a bounding box with centre coordinates (x, y), width w, and height h.
The centre coordinates of the ellipse are denoted by (μx, μy), whilst the semi-axis lengths along the x and y axes are denoted by σx and σy, respectively.
Where, , , , . The probability density function of the two-dimensional Gaussian distribution is as follows:
In this study, the centre coordinates (x, y) are denoted by , the mean vector of the Gaussian distribution is denoted by , and the mean vector of the Gaussian distribution is denoted by .
The horizontal bounding box is modeled as a 2D Gaussian distribution , where and . The similarity between bounding boxes is replaced by the distribution distance of Gaussian distributions. The distribution distance is calculated using the Wasserstein distance. For two Gaussian distributions and , the second-order Wasserstein distance between them is defined as follows:
Gaussian distributions and are defined as follows. represents the bounding box , and denotes the detection box B in an analogous manner.
The term is employed to denote a distance metric, whilst IoU is a ratio ranging from 0 to 1. It is not possible to measure IoU directly by . Rather, exponential normalisation is required in order to derive a new metric, which is termed the NWD, as follows.
The NWD loss function is defined as the transformation from similarity to difference:
2.1.3. Optimization of Neck Network Based on Bidirectional Weighted Feature Pyramid
Shallow layers contain rich target localization information, contour details, and edge features, which are crucial for extracting finer-grained target characteristics. While mature apples exhibit distinctive and stable texture features, complex unstructured orchard environments introduce challenges such as uneven lighting, mutual occlusion, foliage obstruction, and blurred edges. Following the application of successive convolutional operations, background information is progressively extracted, thereby interfering with the model’s learning of useful features and resulting in feature map blurring [25].
In order to mitigate the adverse effects of complex scenes on fruit detection, the Path Aggregation Network (PAN) shortens the propagation path of shallow-layer information by establishing a top-down information flow. This results in a reduction in the propagation difficulty of localization information. As demonstrated in Figure 5a, Feature Pyramid Network (FPN) displays inconsistencies across multi-scale features: during detection, small targets primarily associate with smaller-scale feature maps, whereas large targets rely more on larger-scale feature maps.
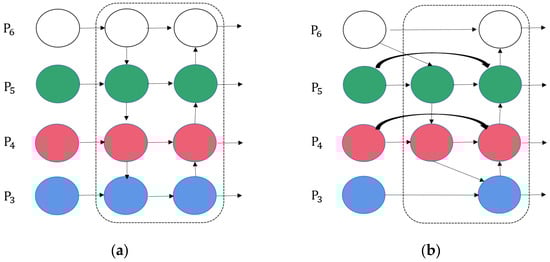
Figure 5.
Diagrams of two kinds of neck network structures. (a) Feature pyramid network and path aggregation network block (FPN+PAN), (b) bidirectional feature network (BiFPN) block. Note: The area within the dashed line represents the neck structure of the network. White represents a 20 × 20 feature map, green represents a 40 × 40 feature map, red represents an 80 × 80 feature map, and blue represents a 160 × 160 feature map.
To further control computational complexity, BiFPN removes the edge nodes at the highest and lowest resolutions and performs bidirectional feature fusion only within the intermediate two to three scales, thereby improving feature fusion efficiency without increasing FLOPs. At the same time, cross-layer skip connections are added within each fusion unit to shorten the information path, ensuring that detailed spatial information and high-level semantic features can fully interact during both bottom-up and top-down flows, which further enhances the model’s adaptability and efficiency in complex backgrounds.
In order to enhance the performance of detection, this study introduces a BiFPN replacement based on the bidirectional connection design of PANet, thereby enabling richer feature maps in the neck module. As demonstrated in Figure 5b, BiFPN utilizes a bottom-up downsampling pathway to provide low-level spatial localisation information, while a top-down upsampling pathway conveys high-level semantic information.
In comparison with the baseline PANet, the BiFPN demonstrates the following structural characteristics. First, single-input nodes are removed, and nodes that contribute negligibly to feature fusion are eliminated, thereby simplifying the network architecture and suppressing redundant features. Second, the bidirectional path is treated as a single feature layer and is stacked repeatedly to achieve higher-level feature fusion, thereby enhancing multi-scale representation capability. Third, additional fusion paths are introduced between the input and output nodes at the same scale, which enriches multi-scale information without increasing computational complexity.
The process of feature fusion typically necessitates that input feature maps have identical spatial dimensions. However, the contribution of features at different resolutions to multi-scale feature are not equivalent. In the BiFPN model, learnable weights are assigned to features of varying scales in order to determine their relative importance during the fusion process. The Fast Normalized Fusion method is adopted, in which the weights are normalized to the interval [0,1] by dividing each individual weight by the sum of all weights. The computation is defined as follows:
The symbol is employed to denote input features, whilst ε is used to represent a constant. In order to ensure model stability, it is typical for ε to take a small value, with positive weights being enforced by the ReLU activation function.
2.1.4. Optimization Based on Adding Auxiliary Detection Heads
The manifestation of both shallow and deep features is characterised by the exhibition of complementary properties. Shallow features possess smaller receptive fields with a higher proportion of spatial information, while deep features have larger receptive fields enriched by semantic information through downsampling. Consequently, features at different scales yield distinct detection effects for targets of varying pixel sizes.
To enhance the spatial localization accuracy of low-resolution, small-scale apple targets in high-density complex environments, an auxiliary detection head is added to the network. This enhancement leads to an improvement in the precision of recognition for multi-scale objects and serves to strengthen the fusion capability of shallow semantic information. As illustrated in Figure 6, the neck network further incorporates a P2 feature map with a resolution of 160 × 160.
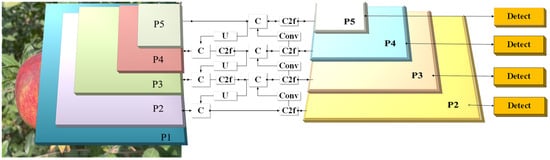
Figure 6.
Adding auxiliary detection head network model structure.
It has been determined that the original anchor box parameters are no longer suitable for network training, due to the addition of an auxiliary detection head and the division of detection heads according to receptive field dimensions. The K-means++ clustering algorithm is employed to recluster the dataset in this study, generating optimized anchor box dimensions for the 4 detection heads. K-means++ is a widely utilized unsupervised learning approach that automatically categorizes data into homogeneous or heterogeneous groups based on feature distances between input data points. The initialisation of cluster centres is achieved by maximising inter-center distance, thereby effectively mitigating issues pertaining to local optima. The results of the clustering process are presented in Figure 7.
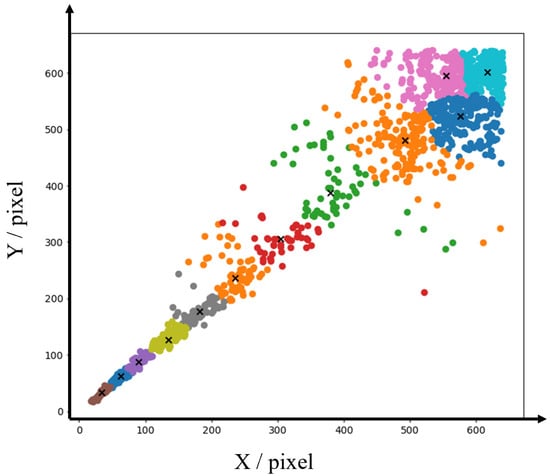
Figure 7.
K-means++ generates anchor box, where 'x' represents the center coordinates obtained by the clustering algorithm.
The reclustered anchor parameters are displayed in Table 1. These optimised anchors are then integrated into the network training process, with the objective of achieving enhanced adaptation to the custom dataset.

Table 1.
K-means++ Anchor box value.
2.2. Data Acquisition and Model Training
2.2.1. Dataset Acquisition and Construction
The Apple dataset was collected at two demonstration bases in China: Shangluojia Village (36°28′13.83″ N, 117°12′21.57″ E) in Jinan City and Lanting Xincun (37°37′29.69″ N, 120°35′38.28″ E) in Yantai City (Figure 8). The orchards are notable for the cultivation of ‘Yantai Red Fuji’ apples, which are grown using a dwarf rootstock close planting system.
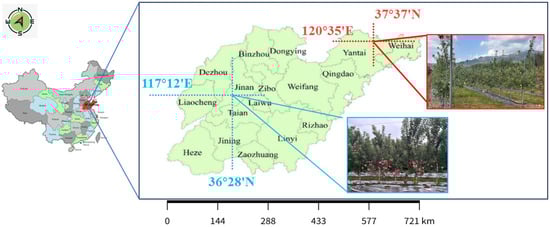
Figure 8.
Data Collection Site.
In order to simulate real-world robotic harvesting conditions, images were captured at specific camera positions and heights, across a range of angles, at different time periods (morning, noon, afternoon), under diverse illumination conditions (100–80,000 lux), and with complex backgrounds (foliage occlusion, clustered fruit), as well as natural environmental variations. A total of 3350 images were obtained using an iPhone 14 (Apple Inc., Cupertino, CA, USA) camera at 2532 × 1170-pixel resolution. The dataset was partitioned into eight distinct sets, constituting 80% of the training data (2680 images), 10% of the testing data (335 images), and an additional 10% of the validation data (335 images). This configuration was maintained in an 8:1:1 ratio.
As illustrated in Figure 9, image data augmentation techniques were employed to expand the dataset, thereby enhancing its diversity with a view to more accurately simulating visual conditions during robotic harvesting operations. The efficacy of this process has been demonstrated through its ability to enhance model generalisation and robustness, while concomitantly mitigating the occurrence of overfitting. These benefits were achieved by addressing a range of challenges encountered in real-world settings, including extensive occlusion, overlapping fruits, varying illumination conditions (frontlight, backlight, sidelight), irregular branch growth patterns, equipment vibration, hardware degradation-induced noise, and chromatic variations (shadows, overlaps). The augmentation process involved the implementation of four distinct methods: rotation, brightness adjustment, noise addition, and zoom cropping. Each original image underwent precisely one augmentation operation. It is evident that the employment of these techniques has been demonstrated to be an effective method of reducing the impact of noise, chromatic shifts, and shadow overlaps. The augmented dataset comprised a total of 6700 images, of which 5360 images were allocated for training, containing 6890 annotated apple instances, while 670 images were assigned to the test set and 670 images to the validation set. The apples were manually annotated using LabelImg (https://github.com/tzutalin/labelImg, accessed on 9 December 2025) on to generate ground truth data, which was stored in TXT format. These files captured fruit locations and category information, thereby establishing a structured apple orchard dataset in YOLO format.
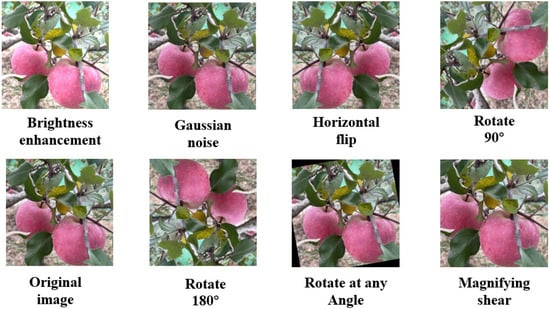
Figure 9.
Original image and data-enhanced image.
2.2.2. Model Training
The network training and testing were performed on a high-performance workstation equipped with an Intel (R) Core™ i7-12700F CPU (Intel Corporation, Santa Clara, CA, USA), 32 GB RAM (Kingston Technology Company, Inc., Fremont, CA, USA), and an NVIDIA GeForce RTX 4080 16 GB GPU (NVIDIA Corporation, Santa Clara, CA, USA), running Windows 10 (64-bit) (Microsoft Corporation, Redmond, WA, USA) with CUDA 11.7 (NVIDIA Corporation, Santa Clara, CA, USA) acceleration. The implementation utilised the PyTorch 1.13 (Meta Platforms, Inc., Menlo Park, CA, USA) framework in Python 3.8 (Python Software Foundation, Beaverton, OR, USA), adopting an initial learning rate of 0.01. This was optimised by a cosine annealing scheduler, which rapidly converged the model to local optima. The optimised models were saved, followed by warm restarts of the learning rate to enable reconvergence to new local optima. The training process incorporated an SGD optimiser with a momentum factor of 0.937 and a weight decay coefficient of 0.0005, operating on a batch size of 8. Prior to the training phase, all images were subjected to preprocessing, resulting in a uniform resolution of 640 × 640 pixels. The model was trained on the orchard apple dataset described in Section 2.2.1, and was further enhanced using Mosaic online data augmentation to increase background diversity and improve the generalization capability and robustness of the model.
2.2.3. Performance Index
The efficacy of the model for orchard apple detection was evaluated using precision (P), recall (R), and mean average precision (mAP), with all metrics assessed on an orchard-specific dataset. Precision was defined as the ratio of correctly detected targets to the total number of detected objects, while recall represented the ratio of correctly identified targets to the total expected targets. The following formula was utilised in the calculation of these metrics:
True positive (TP) is indicative of accurate identification and prediction of the quantity of apple fruit. False positive (FP) is indicative of the quantity of misclassified apple fruit categories and background false positives. False negative (FN) is indicative of the quantity of apples with erroneous detection and samples incorrectly detected as false positives.
It is evident that as the IoU threshold undergoes variation, there is a concomitant alteration in P and R. The Precision-Recall (P-R) curve is plotted with Recall as the horizontal axis and Precision as the vertical axis. The area beneath this P-R curve is known as the Average Precision (AP), calculated using the following formula:
In scenarios where the detection task encompasses k classes, the model’s performance metric is delineated as the mean average precision (mAP). In this study, k is set to 1, calculated as follows:
3. Experimental Results
3.1. Ablation Study
The impact of model improvements on recognition performance was demonstrated, and the effectiveness of each modified module was validated by conducting an experiment on the apple dataset under identical experimental configurations. The performance of the detection system was analysed by sequentially incorporating three improvement methods based on the YOLOv7 model. The experimental results were presented in Table 2.
Table 2.
Comparison table of results of ablation experiments.
A comparison of the baseline YOLOv7 model with the model incorporating the Global Attention Mechanism (GAM) in the final layer of the backbone network reveals a substantial enhancement in performance. The precision is augmented by 0.9 percentage points, the recall by 0.3 percentage points, the mAP@0.5 by 0.9 percentage points, and the mAP@0.5:0.95 by 3.2 percentage points.
The replacement of the original neck structure with the Bidirectional Feature Pyramid Network (BiFPN) enhances precision by 1.4 percentage points, mAP@0.5 by 0.1 percentage points, and mAP@0.5:0.95 by 0.5 percentage points. However, this modification led to a reduction in recall, which is attributed to insufficient feature fusion between shallow and deep feature maps during multi-scale integration.
The incorporation of an auxiliary detection head, when executed in isolation, has been demonstrated to enhance precision by 0.3 percentage points, recall by 1.3 percentage points, mAP@0.5 by 0.8 percentage points, and mAP@0.5:0.95 by 3.4 percentage points. This enhancement significantly strengthened the detection capability for small targets.
The findings of this study demonstrate that when GAM and BiFPN are deployed in conjunction, there is a marginal decline in precision. However, it is notable that the recall increased by 1.3 percentage points, the mAP@0.5 by 0.8 percentage points, and the mAP@0.5:0.95 by 4.8 percentage points. While both modules enhance the extraction of features, the multi-scale fusion introduced by BiFPN gives rise to background interference, thereby adversely affecting recognition accuracy.
The combination of the auxiliary head and GAM has been demonstrated to achieve improvements of 1.8 percentage points in precision, 0.1 percentage points in recall, 2.2 percentage points in mAP@0.5, and 2.3 percentage points in mAP@0.5:0.95.
The integration of all three components (auxiliary head + GAM + BiFPN) has been demonstrated to yield optimal results, with a 4.3% increase in precision, a 1.8% increase in recall, an 4.4% increase in mAP@0.5, and a 7.9% increase in mAP@0.5:0.95. This synergy enhances multi-scale feature fusion while suppressing complex background interference through the attention mechanism of the Graph Attention Mechanism (GAM) and the detection capabilities of the auxiliary head.
In order to analyse the impact of GAM on feature extraction, visualisation studies (see Table 3) have been conducted, which have revealed that the addition of GAM results in a significant enhancement of apple detection regions, indicating an improvement in feature focusing. In Scenarios 1 and 4, the presence of background noise at the image edges results in feature dispersion. Conversely, in Scenarios 2 and 3, features exhibit a pronounced concentration within apple regions, characterised by darker colouration. Following the incorporation of BiFPN and the auxiliary head, multi-scale fusion has been demonstrated to enhance target perception and effectively suppress background interference in challenging scenarios (1 and 4), thereby enabling more precise feature focusing.
Table 3.
Grad-CAM model heat map visualization.
3.2. Comparative Experiments of Different Models
Based on the comparative analysis of the training loss curves obtained using different optimization strategies in Figure 10, our improved optimization algorithm demonstrates accelerated convergence in both bounding box loss and object loss curves during training. As shown in Figure 10a, the bounding box loss stabilizes around 200 epochs for baseline models, while our model converges below 0.01 at approximately 50 epochs—significantly outperforming other networks. This improvement stems from BiFPN’s optimization of feature fusion pathways and removal of redundant network nodes, which collectively enhance training efficiency.
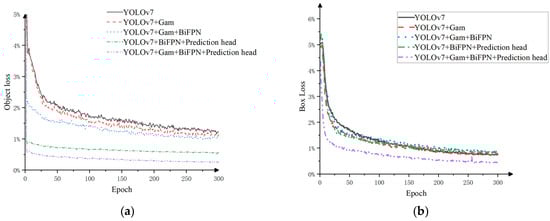
Figure 10.
The loss curves of different optimization algorithm combinations. (a) Box loss curve (b) Object loss curve.
As demonstrated in Figure 10b, our object loss achieves the lowest recorded value (≈0.04), maintaining a 20% reduction compared to the second-best performer after stabilization26. These experimental results confirm that integrating GAM (Global Attention Mechanism), auxiliary detection heads, and BiFPN modules into the YOLOv7 architecture substantially accelerates model convergence and training speed.
As demonstrated in Table 4, while the recall rate of our algorithm is marginally lower than that of YOLOX, it surpasses YOLOX in all other critical metrics. Specifically, the YOLOv7-imp model demonstrates superior performance in terms of precision, recall, mAP@0.5, and F1-score when compared to all baseline algorithms. It is important to note the following: For mAP@0.5, YOLOv7-imp surpasses competing algorithms by 8.5, 4.2, 7.5, 10.2, 6.1, and 4.4 percentage points, respectively. These findings underscore the efficacy of the proposed enhanced model in achieving superior detection capabilities, characterised by enhanced localization accuracy and classification confidence.
Table 4.
Experimental results comparing the performance of different object detection models on the test set .
3.3. Comparison Tests of Detection Performance in Different Scenarios
To validate the detection performance of the improved model across diverse scenarios, this study selected Faster-RCNN, YOLOv5s, YOLOv7, and YOLOv7-imp algorithms for apple detection in orchards under four distinct lighting and distance conditions: Close-range front lighting, Close-range back lighting, Long-range front lighting, Long-range back lighting. The missed detection counts of apples were recorded for each algorithm to compare detection performance. As visually evidenced in Figure 11, the black circles highlight regions where the three baseline algorithms (Faster-RCNN, YOLOv5s, YOLOv7) exhibited either missed detections (undetected apples) or misdetections (incorrect identifications), while the YOLOv7-imp algorithm successfully identified these targets. The results demonstrate that YOLOv7-imp maintains robust detection accuracy under challenging lighting and distance variations, significantly reducing both omission and commission errors compared to other state-of-the-art detectors.
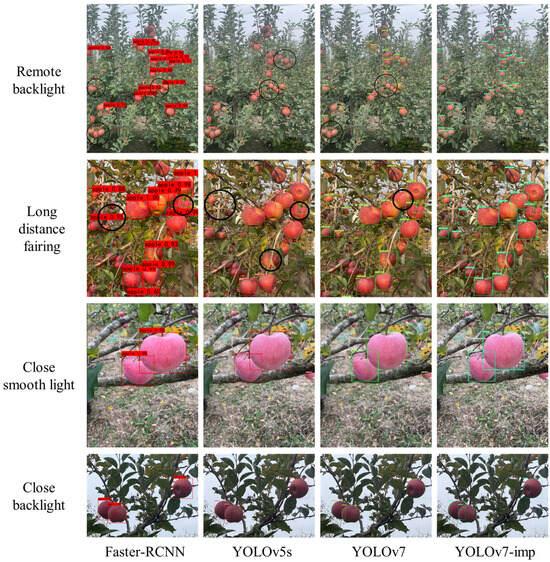
Figure 11.
Detection effect under different conditions. Note: The black circle in the figure represents an unidentified apple.
As demonstrated in Figure 11 and Table 5, in close-range front lighting and close-range backlighting scenarios, both Faster-RCNN and the YOLO-series algorithms demonstrate zero missed detections. This phenomenon can be attributed to the fact that apples occupy distinct pixel areas with high contrast against the background when viewed at close range.
Table 5.
Experimental results of multiple object detection algorithms in fruit detection tasks.
In the context of long-range front lighting and long-range backlighting scenarios, it has been observed that all networks exhibit a prevalence of missed detections. This phenomenon can be attributed to the presentation of apple images exhibiting reduced brightness and contrast in comparison to the background, thereby increasing the difficulty of detection. It is noteworthy that YOLOv7 demonstrates a significant rate of false negatives (54.83% and 25.53%) in instances of occluded or overlapping apples, attributable to the indistinguishability of boundaries between overlapping fruits and the constrained expression of complex background characteristics.
In both long-range scenarios, challenges such as interlaced branches, leaf occlusion, and fruit overlap have been shown to result in missed or false detections. The YOLOv7-imp detection algorithm has been shown to outperform competing algorithms due to its enhanced network optimisation, which facilitates superior feature extraction capabilities. The Game Attention Mechanism (GAM) has been demonstrated to enhance the network’s feature focusing capabilities, and the application of auxiliary detection heads has been shown to improve the network’s small target detection capabilities. Furthermore, the Networked Multi-Purpose Detector (NMD) has been shown to optimise the identification of apples in long-distance scenes.
3.4. Field Harvesting Experiment
The field experiment was conducted on 30 September 2023 at Huamanyuan Apple Orchard, which is located in Huancui District, Weihai City, Shandong Province. The experiment was conducted during clear weather conditions, which were observed between 10:00 a.m. and 3:00 p.m.
The trial was conducted using Yantai Red Fuji apples cultivated in a dwarf rootstock high-density planting system. The apples were randomly selected for harvesting tests. The system sequentially executed fruit detection and recognition, spatial positioning, and motion planning, and all operational data were recorded in real time.
In the context of autonomous apple harvesting, the manipulator executed a series of coordinated actions in accordance with the following workflow, facilitated by its vision and motion planning systems. The host computer processed the orchard images captured by the depth camera to derive 3D coordinates in the camera coordinate system. These coordinates were then transformed into the robotic arm’s base coordinate system to generate spatial positioning data. Consequently, the robotic arm planned and executed its trajectory with the objective of reaching the target picking locations. As demonstrated in Figure 12, upon arrival at the initial pose, the vision system detected ripe apples, and the motion control system computed and executed optimal paths. In conclusion, the end-effector was successfully calibrated to achieve accurate positioning, and the functionality of stem detachment was successfully executed.
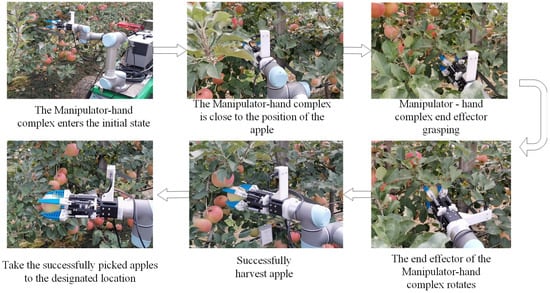
Figure 12.
Apple harvesting manipulator-hand harvesting process figure.
In order to validate the efficiency of the vision system within the integrated harvesting system, multiple field trials were conducted on the robotic arm-end effector assembly in an orchard setting. The harvest was considered successful only if the peduncle detachment occurred without any damage to the fruit. An analysis of 20 harvest cycles (see Table 6) reveals that the host computer’s path planning computation time accounted for a minor proportion of the total harvesting cycle. The deployed vision model has been demonstrated to exhibit rapid inference speed and high localization accuracy, thus meeting the real-time operational requirements of the harvesting system. The overall success rate of 85% is indicative of the vision system’s efficacy in the context of automated apple harvesting. The primary failures were attributable to suboptimal path solutions during the motion planning stage.
Table 6.
Results of picking experiments.
4. Discussion
Currently, traditional fruit-detection methods exhibit significant limitations, as they primarily focus on the straightforward recognition of unobstructed and easily pickable apples, while struggling to cope with the unstructured conditions typical of real-world orchard environments. Although various solutions have been proposed in existing research, achieving a balance between model accuracy and recognition efficiency remains a persistent challenge, largely due to the algorithms’ sensitivity to environmental variations. Consequently, the development of a high-performance and accurate vision system for apple recognition and localization that can operate robustly in complex environments is critical for advancing agricultural automation in harvesting operations [26].
In apple detection tasks, various studies have proposed multiple improvement approaches for complex lighting and dense scene conditions. Zhu et al. [27] verified that the combination of YOLOv5s and the CBAM attention mechanism is superior to the original model. Chen et al. [28] demonstrated in the apple inflorescence recognition experiment that YOLOv7 is superior to YOLOv5s and YOLOv5 with the CA attention mechanism integrated. Chai et al. [8] employ the CBAM attention mechanism to enhance the focus and expression of key features in the YOLOv8 network, enabling the detection of cherry tomatoes. The GAM attention mechanism enhances the performance of CNN by amplifying the cross-dimensional receptive areas, compared with CBAM, GAM eliminates the maximum pooling in the spatial channel and retains some feature information [24]. Yang et al. [29] suggested replacing the backbone with MobileOne to achieve lightweight processing, yet still encountered a 23.40% false negative rate in dense orchards, indicating that relying solely on backbone compression cannot effectively address occlusion and background interference issues. In contrast, this study avoids backbone replacement by introducing a GAM attention mechanism to suppress irrelevant feature interference and enhance target focus. Previous research has validated this approach’s effectiveness: Zang et al. [30] improved wheat ear detection accuracy by 4.95% by embedding a GAM attention module into YOLOv5s. Zhang et al. [31] similarly observed that incorporating GAM significantly improved feature representation capabilities in complex backgrounds during crop pest and disease identification. Consistent with these efforts, our findings demonstrate that attention enhancement offers greater specificity and practicality than backbone replacement in complex orchard environments.
To address the challenges of small-target and long-distance fruit detection, this study adopted Bi-FPN for multi-scale feature fusion and additionally designed an auxiliary detection head to enhance the recognition capability of apples at a distance. Similar improvement approaches have been proven effective in related research, such as Wen et al. [32] proposing PcMNet, which achieved lightweight high-precision detection in orchard environments by refining the feature fusion structure. Jin et al. [33] presented an enhanced deep learning model designed to improve the accuracy and adaptability of recognition algorithms for robotic arm-based harvesting. Zhang et al. [34] employed a highly effective weighted bi-directional feature pyramid network (BiFPN) for effective cross-scale feature fusion, significantly enhancing the multi-scale object detection capability of the YOLO framework, particularly for small objects. Additionally, Weng et al. [35] introduced GAM and feature fusion strategies in tomato detection to enhance small target recognition capabilities. These comparisons further demonstrate the rationality and applicability of our approach in complex environments.
Regarding boundary localization, this research applied the NMD loss function to enhance positioning accuracy. For instance, Yang et al. [36] replaced CIoU with Shape-IoU in the lightweight ELD fruit detector, achieving greater robustness in complex scenarios. Experimental results from this study also demonstrate that NMD loss effectively reduces positioning errors, providing more precise path guidance for robotic harvesting. Additionally, the model weight in this study was 76 MB, significantly reducing memory consumption. Similar lightweight attempts have been validated in studies such as a lightweight CCG-YOLOv5n model [37] and YOLOv5s-BC [38]. Fu et al. [26] adopted a method combining IoU and NWD to reduce the false negative rate under low-density overlapping conditions in YOLOv10, achieving an accuracy of 89.3%. This demonstrates the feasibility of NWD optimization. Therefore, this research balances engineering deployment requirements while maintaining accuracy.
It should be noted that the proposed method is primarily designed for dwarf rootstock high-density planting systems, and its generalization capability under other cultivation patterns or regional varietal conditions requires further validation. Previous studies have achieved 94% detection accuracy in high-occlusion scenarios by modeling fruit-to-fruit occlusion relationships [38]. Semi-supervised strategies have also been employed to enhance cross-scenario recognition performance for small objects [39]. Future research may integrate domain adaptation, occlusion modeling, or semi-supervised learning mechanisms to further enhance the method’s universality across diverse orchard conditions. The method proposed in this study is designed for apple detection in dense dwarf rootstock orchards, yet it is adaptable to other agricultural environments. Its cross-dimensional information fusion enhances the network’s ability to effectively detect objects of varying sizes, which is crucial in agricultural scenarios where factors like fruit color and size variation, as well as differing camera distances, come into play. The integration of the GAM and the BiFPN strengthens this capability. Consequently, this research approach can be extended to a wide range of agricultural robotics applications, including fruit detection in orchards and object recognition in broader agricultural settings such as vegetable and crop monitoring.
5. Conclusions
This study improves computational efficiency through an optimized network architecture and model scaling strategy, resulting in an enhanced YOLOv7-based model capable of addressing apple recognition challenges in complex orchard environments. To this end, an orchard apple dataset was first constructed, and model generalization and robustness were reinforced through offline data augmentation. An attention mechanism was incorporated into the backbone network, the NMD bounding box regression loss was employed to improve prediction accuracy, and an auxiliary detection head was introduced to enhance small-target recognition.
The ablation experiments demonstrate that the optimized model achieves a precision of 94.7%, a recall of 85.9%, and an mAP@0.5 of 95.9%. The combined contributions of the auxiliary detection head, the GAM attention mechanism, and the BiFPN substantially improve model performance, with gains of 4.3%, 1.8%, 4.4%, and 7.9% in precision, recall, mAP@0.5, and mAP@0.5–0.95, respectively, relative to the baseline. These findings highlight the effectiveness of the attention mechanism in suppressing background interference, the auxiliary detection head in improving small-target detection, and the BiFPN in facilitating multi-scale feature fusion.
Comparative evaluations against SSD, Faster R-CNN, YOLOv4, YOLOv5, and YOLOv7 indicate that the proposed model achieves superior target recognition performance while maintaining real-time inference speed. Specifically, the model improves mean average precision (mAP) by 8.5, 4.2, 7.5, 10.2, 6.1, and 4.4 percentage points, respectively, over the compared benchmarks. In orchard apple detection scenarios with varying distances and illumination conditions, the enhanced model exhibits higher accuracy, lower missed detection rates, and fewer false positives than Faster R-CNN, YOLOv5, and YOLOv7. These results confirm the methodology’s capacity to address the complex characteristics of orchard apples and underscore its practical applicability in agricultural and plant science applications.
Author Contributions
Conceptualization, J.W. and H.Y.; methodology, J.W. and S.W. (Shaowei Wang); validation, Z.L., X.S. and S.W. (Shucheng Wang); formal analysis, N.L. and S.W. (Shaowei Wang); investigation, S.W. (Shucheng Wang) and X.S.; resources, H.Y. and Z.L.; data curation, X.L. and S.W. (Supakorn Wongsuk); writing—original draft preparation, J.W. and P.Q.; writing—review and editing, J.W., P.Q. and S.W. (Supakorn Wongsuk); visualization, S.W. (Supakorn Wongsuk) and X.L.; supervision, H.Y. and P.Q.; project administration, H.Y. and P.Q.; funding acquisition, H.Y. All authors have read and agreed to the published version of the manuscript.
Funding
This research was funded by National Key Research and Development Plan Project of China, No. 2023YFD2001100 and 2023YFD2001104. Agricultural Science and Technology Innovation Project of Shandong Academy of Agricultural Sciences No: CXGC2025G11.
Data Availability Statement
The raw data supporting the conclusions of this article will be made available by the authors on request.
Acknowledgments
We extend our heartfelt gratitude once more to ZOU of the Intelligent Systems Division at Golden State Farmer LLC, USA, for his invaluable assistance in refining our manuscript and correcting grammatical issues. We have collaborated with them on research concerning intelligent almond harvesting in the United States, and we hope this research can be implemented in the United States.
Conflicts of Interest
The authors declare no conflicts of interest. The funders had no role in the design of the study; in the collection, analyses, or interpretation of data; in the writing of the manuscript; or in the decision to publish the results.
References
- Meng, Z.; Wang, H.; Fu, W.; Liu, M.; Yin, Y.; Zhao, C. Research Status and Prospects of Agricultural Machinery Autonomous Driving. Nongye Jixie Xuebao/Trans. Chin. Soc. Agric. Mach. 2023, 54, 1–24. [Google Scholar] [CrossRef]
- Bhattacharya, S.; Arunachalam, C.; Zhang, K.; Li, J.; Lu, R.; Li, Z. Detect, segment, cluster: Apple localization for robotic harvesting in complex orchards. Smart Agric. Technol. 2025, 12, 101642. [Google Scholar] [CrossRef]
- Zhou, J.; Chen, M.; Zhang, M.; Zhang, Z.; Zhang, Y.; Wang, M. Improved YOLOv8 for multi-colored apple fruit instance segmentation and 3D localization. Artif. Intell. Agric. 2026, 16, 381–396. [Google Scholar] [CrossRef]
- Guo, Z.; Yin, C.; Wu, X.; Chen, Q.; Wang, J.; Zhou, H. Research status and prospect of key technologies of fruit picking manipulator. Jiangsu J. Agric. Sci. 2024, 40, 1142–1152. [Google Scholar] [CrossRef]
- Verbiest, R.; Ruysen, K.; Vanwalleghem, T.; Demeester, E.; Kellens, K. Automation and robotics in the cultivation of pome fruit: Where do we stand today? J. Field Robot. 2021, 38, 513–531. [Google Scholar] [CrossRef]
- Shi, S.; Yang, F.; Liu, Z.; Xu, X.; Zhang, F.; Wang, Z. Design and Experiment of Composite Pneumatic Apple Picking Manipulator. Trans. Chin. Soc. Agric. Mach. 2024, 55, 93–105. [Google Scholar] [CrossRef]
- Zhao, C.; Fan, B.; Li, J.; Feng, Q. Agricultural robots: Technology progress, challenges and trends. Smart Agric. 2023, 5, 1–15. [Google Scholar] [CrossRef]
- Chai, S.; Wen, M.; Li, P.; Zeng, Z.; Tian, Y. DCFA-YOLO: A Dual-Channel Cross-Feature-Fusion Attention YOLO Network for Cherry Tomato Bunch Detection. Agriculture 2025, 15, 271. [Google Scholar] [CrossRef]
- Tan, H.; Zhao, X.; Fu, H.; Yang, M.; Zhai, C. A novel fusion positioning navigation system for greenhouse strawberry spraying robot using LiDAR and ultrasonic tags. Agric. Commun. 2025, 3, 100087. [Google Scholar] [CrossRef]
- Zu, L.; Zhao, Y.; Liu, J.; Su, F.; Zhang, Y.; Liu, P. Detection and segmentation of mature green tomatoes based on mask r-cnn with automatic image acquisition approach. Sensors 2021, 21, 7842. [Google Scholar] [CrossRef] [PubMed]
- Hu, T.; Wang, W.; Gu, J.; Xia, Z.; Zhang, J.; Wang, B. Research on Apple Object Detection and Localization Method Based on Improved YOLOX and RGB-D Images. Agronomy 2023, 13, 1816. [Google Scholar] [CrossRef]
- Ji, W.; Pan, Y.; Xu, B.; Wang, J. A Real-Time Apple Targets Detection Method for Picking Robot Based on ShufflenetV2-YOLOX. Agriculture 2022, 12, 856. [Google Scholar] [CrossRef]
- Sekharamantry, P.K.; Melgani, F.; Malacarne, J. Deep Learning-Based Apple Detection with Attention Module and Improved Loss Function in YOLO. Remote Sens. 2023, 15, 1516. [Google Scholar] [CrossRef]
- Wei, J.; Yi, D.; Bo, X.; Guangyu, C.; Dean, Z. Adaptive Variable Parameter Impedance Control for Apple Harvesting Robot Compliant Picking. Complexity 2020, 2020, 4812657. [Google Scholar] [CrossRef]
- Zheng, T.; Jiang, M.; Feng, M. Vision based target recognition and location for picking robot: A review. Yi Qi Yi Biao Xue Bao/Chin. J. Sci. Instrum. 2021, 42, 28–51. [Google Scholar] [CrossRef]
- Bochkovskiy, A.; Wang, C.Y.; Liao, H.Y.M. YOLOv4: Optimal Speed and Accuracy of Object Detection. arXiv 2020, arXiv:2004.10934. [Google Scholar] [CrossRef]
- Mekhalfi, M.L.; Nicolò, C.; Bazi, Y.; Al Rahhal, M.M.; Alsharif, N.A.; Al Maghayreh, E. Contrasting YOLOv5, Transformer, and EfficientDet Detectors for Crop Circle Detection in Desert. IEEE Geosci. Remote Sens. Lett. 2022, 19, 3003205. [Google Scholar] [CrossRef]
- Zeng, T.; Li, S.; Song, Q.; Zhong, F.; Wei, X. Lightweight tomato real-time detection method based on improved YOLO and mobile deployment. Comput. Electron. Agric. 2023, 205, 107625. [Google Scholar] [CrossRef]
- Fu, L.; Gao, F.; Wu, J.; Li, R.; Karkee, M.; Zhang, Q. Application of consumer RGB-D cameras for fruit detection and localization in field: A critical review. Comput. Electron. Agric. 2020, 177, 105687. [Google Scholar] [CrossRef]
- Liu, X.; Zhao, D.; Jia, W.; Ruan, C.; Ji, W. Fruits Segmentation Method Based on Superpixel Features for Apple Harvesting Robot. Nongye Jixie Xuebao/Trans. Chin. Soc. Agric. Mach. 2019, 50, 15–23. [Google Scholar] [CrossRef]
- Zhao, D.; Wu, R.; Liu, X.; Zhao, Y. Apple positioning based on YOLO deep convolutional neural network for picking robot in complex background. Nongye Gongcheng Xuebao/Trans. Chin. Soc. Agric. Eng. 2019, 35, 164–173. [Google Scholar] [CrossRef]
- Wang, J.; Zhou, J.; Zhang, Y.; Hu, H. Multi-pose dragon fruit detection system for picking robots based on the optimal YOLOv7 model. Nongye Gongcheng Xuebao/Trans. Chin. Soc. Agric. Eng. 2023, 39, 276–283. [Google Scholar] [CrossRef]
- Wang, C.Y.Y.; Bochkovskiy, A.; Liao, H.Y.Y.M. YOLOv7: Trainable Bag-of-Freebies Sets New State-of-the-Art for Real-Time Object Detectors. In Proceedings of the IEEE Computer Society Conference on Computer Vision and Pattern Recognition 2023, Vancouver, BC, Canada, 17–24 June 2023; pp. 7464–7475. [Google Scholar] [CrossRef]
- Liu, Y.; Shao, Z.; Hoffmann, N. Global Attention Mechanism: Retain Information to Enhance Channel-Spatial Interactions. arXiv 2021, arXiv:2112.05561. [Google Scholar] [CrossRef]
- Xiao, F.; Wang, H.; Li, Y.; Cao, Y.; Lv, X.; Xu, G. Object Detection and Recognition Techniques Based on Digital Image Processing and Traditional Machine Learning for Fruit and Vegetable Harvesting Robots: An Overview and Review. Agronomy 2023, 13, 639. [Google Scholar] [CrossRef]
- Fu, H.; Guo, Z.; Feng, Q.; Xie, F.; Zuo, Y.; Li, T. MSOAR-YOLOv10: Multi-Scale Occluded Apple Detection for Enhanced Harvest Robotics. Horticulturae 2024, 10, 1246. [Google Scholar] [CrossRef]
- Zhu, R.; Zou, H.; Li, Z.; Ni, R. Apple-Net: A Model Based on Improved YOLOv5 to Detect the Apple Leaf Diseases. Plants 2023, 12, 169. [Google Scholar] [CrossRef]
- Chen, J.; Ma, B.; Ji, C.; Zhang, J.; Feng, Q.; Liu, X.; Li, Y. Apple inflorescence recognition of phenology stage in complex background based on improved YOLOv7. Comput. Electron. Agric. 2023, 211, 108048. [Google Scholar] [CrossRef]
- Yang, H.; Liu, Y.; Wang, S.; Qu, H.; Li, N.; Wu, J.; Yan, Y.; Zhang, H.; Wang, J.; Qiu, J. Improved Apple Fruit Target Recognition Method Based on YOLOv7 Model. Agriculture 2023, 13, 1278. [Google Scholar] [CrossRef]
- Zang, H.; Wang, Y.; Ru, L.; Zhou, M.; Chen, D.; Zhao, Q.; Zhang, J.; Li, G.; Zheng, G. Detection method of wheat spike improved YOLOv5s based on the attention mechanism. Front. Plant Sci. 2022, 13, 993244. [Google Scholar] [CrossRef] [PubMed]
- Zhang, Y.; Liu, D. Rethinking feature representation and attention mechanisms in intelligent recognition of leaf pests and diseases in wheat. Sci. Rep. 2025, 15, 15624. [Google Scholar] [CrossRef]
- Wen, S.; Zhou, J.; Hu, G.; Zhang, H.; Tao, S.; Wang, Z.; Chen, J. PcMNet: An efficient lightweight apple detection algorithm in natural orchards. Smart Agric. Technol. 2024, 9, 100623. [Google Scholar] [CrossRef]
- Jin, T.; Han, X.; Wang, P.; Zhang, Z.; Guo, J.; Ding, F. Enhanced deep learning model for apple detection, localization, and counting in complex orchards for robotic arm-based harvesting. Smart Agric. Technol. 2025, 10, 100784. [Google Scholar] [CrossRef]
- Zhang, Z.; Lu, X.; Cao, G.; Yang, Y.; Jiao, L.; Liu, F. ViT-YOLO:Transformer-Based YOLO for Object Detection. In Proceedings of the 2021 IEEE/CVF International Conference on Computer Vision Workshop (ICCVW), Montreal, BC, Canada, 11–17 October 2021; pp. 2799–2808. [Google Scholar] [CrossRef]
- Weng, W.; Lai, Z.; Cui, Z.; Chen, Z.; Chen, H.; Lin, T.; Wang, J.; Zheng, S.; Chen, G. GCD-YOLO: A Deep Learning Network for Accurate Tomato Fruit Stalks Identification in Unstructured Environments. Smart Agric. Technol. 2025, 12, 101465. [Google Scholar] [CrossRef]
- Yang, X.; Zhao, W.; Wang, Y.; Yan, W.Q.; Li, Y. Lightweight and efficient deep learning models for fruit detection in orchards. Sci. Rep. 2024, 14, 26086. [Google Scholar] [CrossRef] [PubMed]
- Li, J.; Liu, Z.; Wang, D. A Lightweight Algorithm for Recognizing Pear Leaf Diseases in Natural Scenes Based on an Improved YOLOv5 Deep Learning Model. Agriculture 2024, 14, 273. [Google Scholar] [CrossRef]
- Liu, J.; Liu, Z. YOLOv5s-BC: An improved YOLOv5s-based method for real-time apple detection. J. Real-Time Image Process. 2024, 21, 88. [Google Scholar] [CrossRef]
- Johanson, R.; Wilms, C.; Johannsen, O.; Frintrop, S. S3AD: Semi-supervised Small Apple Detection in Orchard Environments. In Proceedings of the 2024 IEEE Winter Conference on Applications of Computer Vision(WACV), Waikoloa, HI, USA, 3–8 January 2024; pp. 7061–7070. [Google Scholar] [CrossRef]


Disclaimer/Publisher’s Note: The statements, opinions and data contained in all publications are solely those of the individual author(s) and contributor(s) and not of MDPI and/or the editor(s). MDPI and/or the editor(s) disclaim responsibility for any injury to people or property resulting from any ideas, methods, instructions or products referred to in the content. |
© 2025 by the authors. Licensee MDPI, Basel, Switzerland. This article is an open access article distributed under the terms and conditions of the Creative Commons Attribution (CC BY) license (https://creativecommons.org/licenses/by/4.0/).