1. Introduction
The cabbage (
Brassica oleracea L. var.
capitata) is an herbaceous plant and an important dietary vegetable due to its high biological and low caloric value. In Serbia, it has been cultivated for a long time, especially in the Vojvodina Province, where the most notable domestic cultivar, ‘Futoški’, is traditionally grown and protected by geographical indication. This cultivar is widely used for both fresh consumption and industrial fermentation. Another well-known variety, ‘Srpski melez’, is commonly grown in Central Serbia [
1].
Although fermented cabbage has traditionally been produced using simple methods, modern consumers are increasingly demanding products with enhanced levels of bioactive compounds. This shift in consumer preference highlights the need to improve traditional fermentation methods to meet these expectations.
Fermentation is an effective method for preserving food and extending its shelf life, as the organic acids produced by lactic acid bacteria inhibit the growth of undesirable microorganisms [
2]. Moreover, fermentation leads to the formation of numerous new bioactive compounds and enhances sensory properties, including color, texture, taste, and aroma, which are key qualitative attributes perceived by consumers during food selection [
3,
4].
Before being considered as a food, cabbage was valued for its medicinal properties, including its use to treat headaches, gout, diarrhea, and peptic ulcers [
5,
6]. Fermented cabbage and other fermented foods have been reported to exhibit important health benefits, including antimicrobial, antioxidant, and cholesterol-lowering effects [
7].
In addition, fermented cabbage is rich in vitamins, phenolic compounds, and antioxidants, which contribute to its important role in human health [
4,
8]. It is commonly consumed as a side dish or used in the preparation of traditional meals such as “sarma”.
L-isoascorbic acid, as an isomer of vitamin C, is widely used in the food industry for its reducing and antioxidative activity as food ingredients, e.g., for preventing enzymatic browning of fruits and vegetables or for the curing of meats [
9].
Citric acid is often used as an additive (E 330) in numerous food products, such as fruit and vegetable preserved products. The low pH of this acid, determines a wide range of technological applications, being an important acidifying agent, acidity regulator, antioxidant and can also act as synergist of other antioxidants [
10]. Moreover, it shows no side effects [
11,
12]. As it is far more affordable than ascorbic acid, citric acid is a more cost-effective option for the food industry.
The main aim of the study was to examine the impact of different concentrations of ascorbic acid and citric acid on the fermentation process and sensory characteristics of cabbage and to compare the results with cabbage obtained through traditional fermentation. The experiment was conducted under industrial conditions. At appropriate concentrations, these additions are expected to improve fermentation efficiency and enhance sensory qualities of fermented cabbage heads, including flavor and texture.
2. Materials and Methods
2.1. Sample
The heads of the semi-sweet white cabbage cultivar “Marloo F1” (Sakata®, Uchaud, France) were subjected to fermentation under industrial conditions at the “Agricultural holding Predrag Kurjakov”, Futog (Vojvodina Province, Serbia) (45°14′10.3″ N 19°43′04.3″ E) in December 2023. The cabbage heads used for the fermentation process were harvested at the same day when the fermentation was initiated, without prior storage of the raw material. A selection of fresh raw material was performed beforehand. Diseased and damaged cabbage heads were not used for the experiment. The outer leaves of each cabbage head were removed to reduce impurities and undesirable microorganisms from the environment. The cabbage stem was incised in a cross shape to facilitate the diffusion of salt into the heads.
2.2. Chemicals
1,1-Diphenyl-2-picryl-hydrazyl-hydrate (DPPH), 7 mM aqueous solution of 2,2′-azino-bis(3-ethylbenzothiazoline-6-sulfonic acid) diammonium salt (ABTS), Folin–Ciocalteu reagent, and 10 mM 2,4,6-tripyridyl-s-triazine (TPTZ) were purchased from “Sigma Aldrich” GmbH (Steinheim, Germany) PVPP (poly(vinylpolypyrrolidone)) was purchased from “Merck KGaA” (Darmstadt, Germany), gallic acid was purchased from “Merck Schuchardt OHG” (Hohenbrunn, Germany), 4,6-Dixydroxy-2-mercaptopyrimidine was purchased from “Alfa Aesar” GmbH & Co. (Karlsruhe, Germany).
All other chemicals and reagents were of analytical grade.
2.3. Experimental Procedures
The experiment was conducted under controlled conditions and included three replications. The treatments consisted of different concentrations of ascorbic and citric acid, as follows:
Traditional fermentation without ascorbic and citric acid (Control, K)
Ascorbic acid 0.025% (C15)
Ascorbic acid 0.05% (C30)
Citric acid 0.025% (LK15)
Citric acid 0.05% (LK30)
Citric acid 0.1% (LK60)
The selected concentrations were defined based on preliminary industrial trials and previous experience with the use of these acids in similar food processing technologies, where they are commonly applied to improve product stability and sensory quality.
The cabbage was placed in white plastic barrels with a capacity of 60 L. Each barrel contained 23 kg of tightly packed cabbage heads, and brine was added until the cabbage was completely submerged.
For fermentation, table salt was added at a concentration of 2%, and potassium sorbate was used as a preservative at 0.1%. Tap water from the municipal water supply system was used to prepare the brine. The barrels were sealed to ensure anaerobic conditions, and the fermentation process lasted 45 days. The temperature in the fermentation room was maintained at 20 °C, which is considered optimal for fermented cabbage.
2.4. Analysis of Quality Indicators
2.4.1. Total Dry Matter
Using the gravimetric analysis method, all samples were dried to a constant weight at 105 ± 0.5 °C in order to calculate their total dry matter (DM) [
13].
2.4.2. Reducing Sugars
The Luff-Schoorl method was used to determine the total amount of sugar in fresh samples [
13].
2.4.3. Titratable Acidity and pH
The titratable acidity of the cabbage samples was determined and expressed as lactic acid. The analysis was carried out by titrating the samples with 0.1 M NaOH, using phenolphthalein as an indicator [
13].
The pH of the samples was measured using the SevenCompact S210 (Mettler Toledo, Greifensee, Switzerland) at 25 °C by immersing the pH electrode in the cabbage pulp and recording the values after equilibrium.
All measurements, including dry matter (determined by drying), reducing sugars, titratable acidity and pH were performed in triplicate, and the results are presented as mean values in percentages.
2.4.4. Ascorbic Acid Content
Ascorbic acid content was measured instrumentally using the MACHEREY-NAGEL QUANTOFIX
® Relax (QR31230) reflectometer (Düren, Germany). Pantelidis et al.’s procedure [
14] was followed in the fabrication of the sample. Twenty milliliters of 1% oxalic acid were combined with five grams of cabbage, homogenized for one minute, and then filtered. Ten milliliters of the filtered sample were treated with 500 mg of PVPP (poly(vinylpolypyrrolidone)) to eliminate phenols, and six to seven drops of 25% H
2SO
4 were added to lower the pH below 1. As directed by the manufacturer, test strips Quantofix
® Ascorbic acid by MACHEREY-NAGEL (Düren, Germany) were utilized from the prepared sample, and the device’s readout was given in milligrams per liter. The value read from the device was recalculated, and the results were expressed as mg of ascorbic acid (AsA) per 100 g (DM).
2.4.5. Preparation of Extracts for Determination of Total Phenolics and Antioxidant Activity
Samples of cabbage were pulverized prior to extraction. After weighing about 10 g of the cabbage puree sample, it was put into a 50 mL Erlenmeyer flask, filled with 25 mL of methanol (the extraction solvent), and covered with foil. After that, the sample-containing Erlenmeyer flasks were set on a shaker (UNIMAX 1010, Heidolph, Germany) and swirled for a whole day at room temperature and in the dark at 100 rpm. The samples were then quantitatively moved into 50 mL volumetric flasks, which were then filled to a nominal volume of 50 mL with the extraction solvent. After that, quality filter paper was used to filter the flask contents. The prepared extracts were stored in a refrigerator (4 °C) until analysis and were used to determine total phenolics content, total flavonoid content, and antioxidant activity [
15].
2.4.6. Total Phenolics Content
Using gallic acid as the standard, the Folin–Ciocalteu method [
16] was used to spectrophotometrically estimate the total phenolics content (TPC) in the previously produced extracts. The LLG-uniSPEC 2 Spectrophotometer, manufactured by Lab Logistics Group GmbH in Meckenheim, Germany, was used to detect absorbance at 765 nm. Gallic acid equivalents (mg GAE/100 g DM) were used to quantify the total phenolic content using the gallic acid calibration curve.
2.4.7. Total Flavonoid Content
Using a colorimetric technique with aluminum chloride, the total flavonoid content (TFC) of the previously made extracts was ascertained spectrophotometrically [
17]. Using a Lab Logistics Group GmbH LLG-uniSPEC 2 Spectrophotometer from Meckenheim, Germany, absorbance was recorded at 510 nm. Using the catechin calibration curve, the total flavonoid content was determined and represented as catechin equivalents (mg CE/100 g DM).
Every measurement of total phenolics and total flavonoid content was performed three times.
2.4.8. DPPH⦁
The sample’s capacity to scavenge 1,1-diphenyl-2-picrylhydrazyl (DPPH
⦁) free radicals was assessed using a modified version of the method described by Brand-Williams et al. [
18]. A fresh 65 μM methanolic solution of DPPH
⦁ was prepared and adjusted with methanol to an absorbance of 0.70 (±0.01). The sample extract (0.1 mL) was combined with 2.9 mL of the DPPH
⦁ solution in plastic cuvettes with a 10 mm path length and incubated at room temperature for 60 min. The decrease in absorbance at 517 nm was measured using an LLG-uniSPEC 2 spectrophotometer (Lab Logistics Group GmbH, Meckenheim, Germany). Results are reported as mg Trolox equivalents per gram of dry matter (mg Trolox/g DM) [
15].
2.4.9. ABTS⦁+
The radical-scavenging activity of the sample against ABTS
⦁+ radicals was evaluated using a modified procedure reported by Re et al. [
19]. A 7 mM aqueous solution of 2,2′-azino-bis (3-ethylbenzothiazoline-6-sulfonic acid) diammonium salt (ABTS
⦁+) was combined with a 2.45 mM potassium persulfate solution in a 1:1 (
v/
v) ratio to create a fresh ABTS reagent solution, which was then allowed to sit at room temperature in the dark for 16 h. To bring the absorbance down to 0.70 (±0.01), the ABTS
⦁+ reagent was diluted with 300 mM acetate buffer (pH 3.6). After mixing 0.1 mL and 2.9 mL of the previously produced extract with the ABTS
⦁+ reagent, the mixture was allowed to sit at room temperature for 300 min in the dark. Following the incubation, the sample’s absorbance was recorded at 734 nm using an LLG-uniSPEC 2 spectrophotometer (Lab Logistics Group GmbH, Meckenheim, Germany). The antioxidant capacity is presented as mg Trolox equivalents per gram of dry matter (mg Trolox/g DM) [
15].
2.4.10. FRAP
A modified approach first reported in the work by Benzie and Strain [
20] was used to assess the sample’s capacity to eliminate Fe
3+ ions. A 300 mM acetate buffer (pH 3.6), a 10 mM 2,4,6-tripyridyl-s-triazine (TPTZ) solution in 40 mmol/L HCl, and a 20 mM/L FeCl
3 aqueous solution were combined in a 10:1:1 (
v/
v/
v) ratio to create the freshly made FRAP reagent. After mixing the FRAP reagent (0.1 mL + 2.9 mL) with the previously made extracts, they were incubated for 10 min at 37 °C in the dark. Following incubation, the sample’s absorbance was measured at 593 nm using a Lab Logistics Group GmbH LLG-uniSPEC 2 Spectrophotometer located in Meckenheim, Germany. The findings were presented as mg Fe
2+ equivalents per g of DM (mg Fe
2+/g DM) [
15].
Every antioxidant activity measurement (DPPH⦁, ABTS⦁+, and FRAP) was carried out three times.
2.5. Sensory Analysis
The samples of fermented cabbage heads were evaluated by a six-member panel of trained and experienced assessors. The selection, training, and monitoring of the panelists were conducted in accordance with ISO 8586 [
21]. The training included familiarization with the product category, definition of key sensory attributes, and alignment sessions to ensure consistent use of the scoring criteria.
Prior to evaluation, the panel defined the representative sensory attributes of fermented cabbage heads, including taste, color, odor, overall product condition, and appearance, following general guidance for sensory profiling as described in ISO 13299 [
22]. All attributes were assessed independently by each panelist using a quantitative scoring method in accordance with ISO 4121 [
23]. The samples were randomly presented and coded with three-digit numbers to avoid bias. Sensory evaluation was performed at room temperature after sample tempering. Between samples, panelists rinsed their palates with water to minimize carry-over effects.
The evaluation was conducted under controlled environmental conditions, including appropriate lighting and a quiet testing environment to ensure objective assessment. The results are presented as mean values of the panel scores. The sensory evaluation involved voluntary adult participants and fermented food samples intended for human consumption, presenting no more than minimal risk. The study was conducted in accordance with internationally recognized ethical standards for research involving human participants and in line with the principles of the Declaration of Helsinki. Informed consent was obtained from all participants prior to their involvement.
2.6. Standard Score Analysis
For ranking purposes, six samples were evaluated based on their raw data in comparison to extreme values, following the approach of Brlek et al. [
24]. The ranking considered parameters such as TPC, DPPH
⦁, FRAP, and ABTS
⦁+, where higher values were favored, as well as ascorbic acid, where lower values were considered preferable.
In order to ensure comparability among variables with different units and magnitudes, a standard score normalization procedure was applied prior to further statistical analysis. In this study, min–max normalization was employed to rescale all variables into a common range between 0 and 1. This approach preserves the relative relationships within the data while eliminating the influence of differing measurement scales.
The normalized value
xnorm for each original variable was calculated according to the following equation:
where
xmin and
xmax represent the minimum and maximum values of the respective variable across the dataset.
2.7. Statistical Analysis
The data were first tested for normality using the Shapiro–Wilk and Anderson-Darling methods. The results indicated that most of the variables did not follow a normal distribution (p < 0.05). Consequently, the non-parametric Kruskal–Wallis test was applied to provide a more reliable assessment of differences between groups. Post hoc comparisons were performed using Dunn’s test with appropriate correction for multiple comparisons. All values are expressed as the mean of three replicates, along with their standard deviations. Comparisons among sample means were performed using Tukey’s HSD test. Principal Component Analysis (PCA) was performed to explore the underlying structure of the dataset and to identify patterns, similarities, and differences among the analyzed samples based on the measured variables. Prior to PCA, all variables were standardized using min–max normalization to ensure comparability and to eliminate the influence of differing scales and units. The PCA was conducted using the correlation matrix, and principal components (PCs) were extracted based on eigenvalues greater than 1 (Kaiser criterion).
All PCA calculations were performed using STATISTICA 10.0 software (StatSoft Inc., Tulsa, OK, USA).
3. Results and Discussion
The analysis of cabbage fermentation indicated significant variations in chemical composition and bioactivity among the samples.
The dry matter (DM) content of a cabbage cultivar is an important factor influencing the fermentation process of cabbage heads, as it directly affects texture, flavor, and microbial activity during fermentation [
25]. Higher DM content usually means more soluble solids (like sugars) are available, which serve as food for the fermenting microorganisms (primarily lactic acid bacteria). In this study, the DM content ranged from 7.61 ± 0.10% in LK60 to 8.98 ± 0.09% in K, with significantly lower values in LK15 and LK60. Drašković-Berger et al. [
8] and Dobričević et al. [
26] in their studies obtained similar DM values, ranging from 7.54% to 10.47%.
An optimal level of acidity ensures the inhibition of undesirable microorganisms, extends shelf life, and contributes to microbiological stability, while also providing a pleasant taste and a balance between acidic and other flavor notes. The most important prerequisite for the growth of lactic acid bacteria is the availability of fermentable sugars. Cabbage cultivars intended for the fermentation process contain a sufficient amount of sugars for successful fermentation. Additionally, the residual sugar content after fermentation contributes to a pleasant taste, making it a desirable characteristic of fermented cabbage [
27].
In this study, head cabbage samples of the Marloo cultivar were fermented at a temperature of 20 °C, and no residual sugars were detected, indicating that fermentation in the cabbage samples was completely finished.
Titratable acidity was highest in C15 (0.74 ± 0.00%) and LK15 (0.73 ± 0.06%) and lowest in C30 (0.57 ± 0.06%), indicating differences in organic acid production. These results were confirmed in the study by Drašković-Berger et al. [
28], where the values of titratable acidity ranged from 0.54% to 0.89%. The dynamics of the process are monitored based on pH values, which determine the endpoint of fermentation [
29]. It is considered that cabbage fermentation is complete if the pH value of end product is round 3.4–3.6 [
30]. The pH values ranged from 3.24 ± 0.00 in LK60 to 3.46 ± 0.00 in control sample, indicating slight but significant differences among the samples. These values are consistent with the results obtained by Cvetković [
31], where the final fermentation endpoint of “Futoški” cabbage ranged from a pH value of 3.3 to 3.4.
Ascorbic acid content varied considerably, with the highest value found in C30 (400 ± 37.2 mg AsA/100 g DM) and the lowest in LK60 (52.4 ± 4.8 mg AsA/100 g DM). It was expected that the samples with added ascorbic acid would have a significantly higher ascorbic acid content compared to the control sample. However, the sample with added citric acid at a concentration of 0.025% (LK15) at the beginning of fermentation also showed a higher ascorbic acid content in the final product compared to the control sample.
The increase in ascorbic acid content, including the unexpectedly higher values observed in the citric acid-treated sample (LK15), may be attributed to the complex interplay between microbial activity and chemical transformations during fermentation. Microorganisms are known to influence the synthesis and release of certain compounds during fermentation [
32], and the acidic environment can facilitate the breakdown of antioxidant precursors such as ascorbigen, which may contribute to elevated ascorbic acid levels [
33]. Previous research has also shown that ascorbic acid content can vary widely in fermented cabbage, ranging from 156.72 mg/100 g to 256.31 mg/100 g during natural fermentation [
34], reflecting both metabolic processes and matrix effects. At the same time, ascorbic acid is susceptible to oxidative degradation [
35] and can rapidly decrease under storage conditions due to its inherent instability [
36]. The involvement of ascorbic acid in the formation of antioxidant compounds such as ascorbigen has also been proposed as a potential mechanism for changes in its concentration during cabbage fermentation [
37]. Taken together, these factors can lead to dynamic changes in ascorbic acid levels and contribute to the overall antioxidant activity of fermented cabbage.
Because of their antibacterial, antiviral, and anti-inflammatory properties, phenolic compounds are among the biologically active substances crucial for human health [
38]. Raw cabbage naturally contains phenolic components, and as a result, fermented cabbage exhibits a strong capacity to scavenge free radicals [
8]. While phenolic compounds contribute significantly to the antioxidant activity of fermented cabbage, they are not the sole contributors. Other bioactive compounds, such as flavonoids and vitamin C, along with metabolites produced during fermentation, also play important roles. To provide a comprehensive assessment of the antioxidant potential of the samples, multiple assays (DPPH
⦁, ABTS
⦁+, and FRAP) were performed. In this study, total flavonoid content (TFC) was not detected in the fermented cabbage samples, whereas total phenolic content (TPC) values are presented in
Table 1, reflecting differences in phenolic compound retention.
TPC was highest in LK15 (419.05 ± 16.01 mg GAE/100 g DM) and lowest in LK60 (239.48 ± 2.10 mg GAE/100 g DM), reflecting differences in phenolics compound retention. Total TPC measured by the Folin–Ciocalteu method from methanolic extracts of fresh cabbage ranged from 2.41 to 4.91 mg GAE/g DM, which is in accordance with the results of this study [
39,
40]. A higher total phenolics content in fermented cabbage samples could be expected compare to fresh cabbage, given that lactic acid bacteria are capable of releasing polyphenolic compounds that are bound within cabbage cells. The release of phenolic compounds in cabbage heads consequently leads to an increase in TPC during the fermentation process [
41].
According to Kusznierewicz et al. [
39], the antioxidant activity of cabbage can fluctuate based on the fermentation process and its conditions. Fermented cabbage heads contain high concentrations of vitamins C and E, as well as total phenolic compounds (TPC), which act as powerful free radical scavengers and help protect the human body against oxidative stress [
42]. Fermented cabbage often shows a higher antioxidant potential compared to fresh cabbage, suggesting that fermentation could be one of the most effective methods for preserving and enhancing its antioxidant activity. This phenomenon can be explained by the fact that lactic acid bacteria modify the composition of bioactive compounds during fermentation, leading to the breakdown of plant cells, the release of phenolics compounds, and the synthesis of new bioactive components [
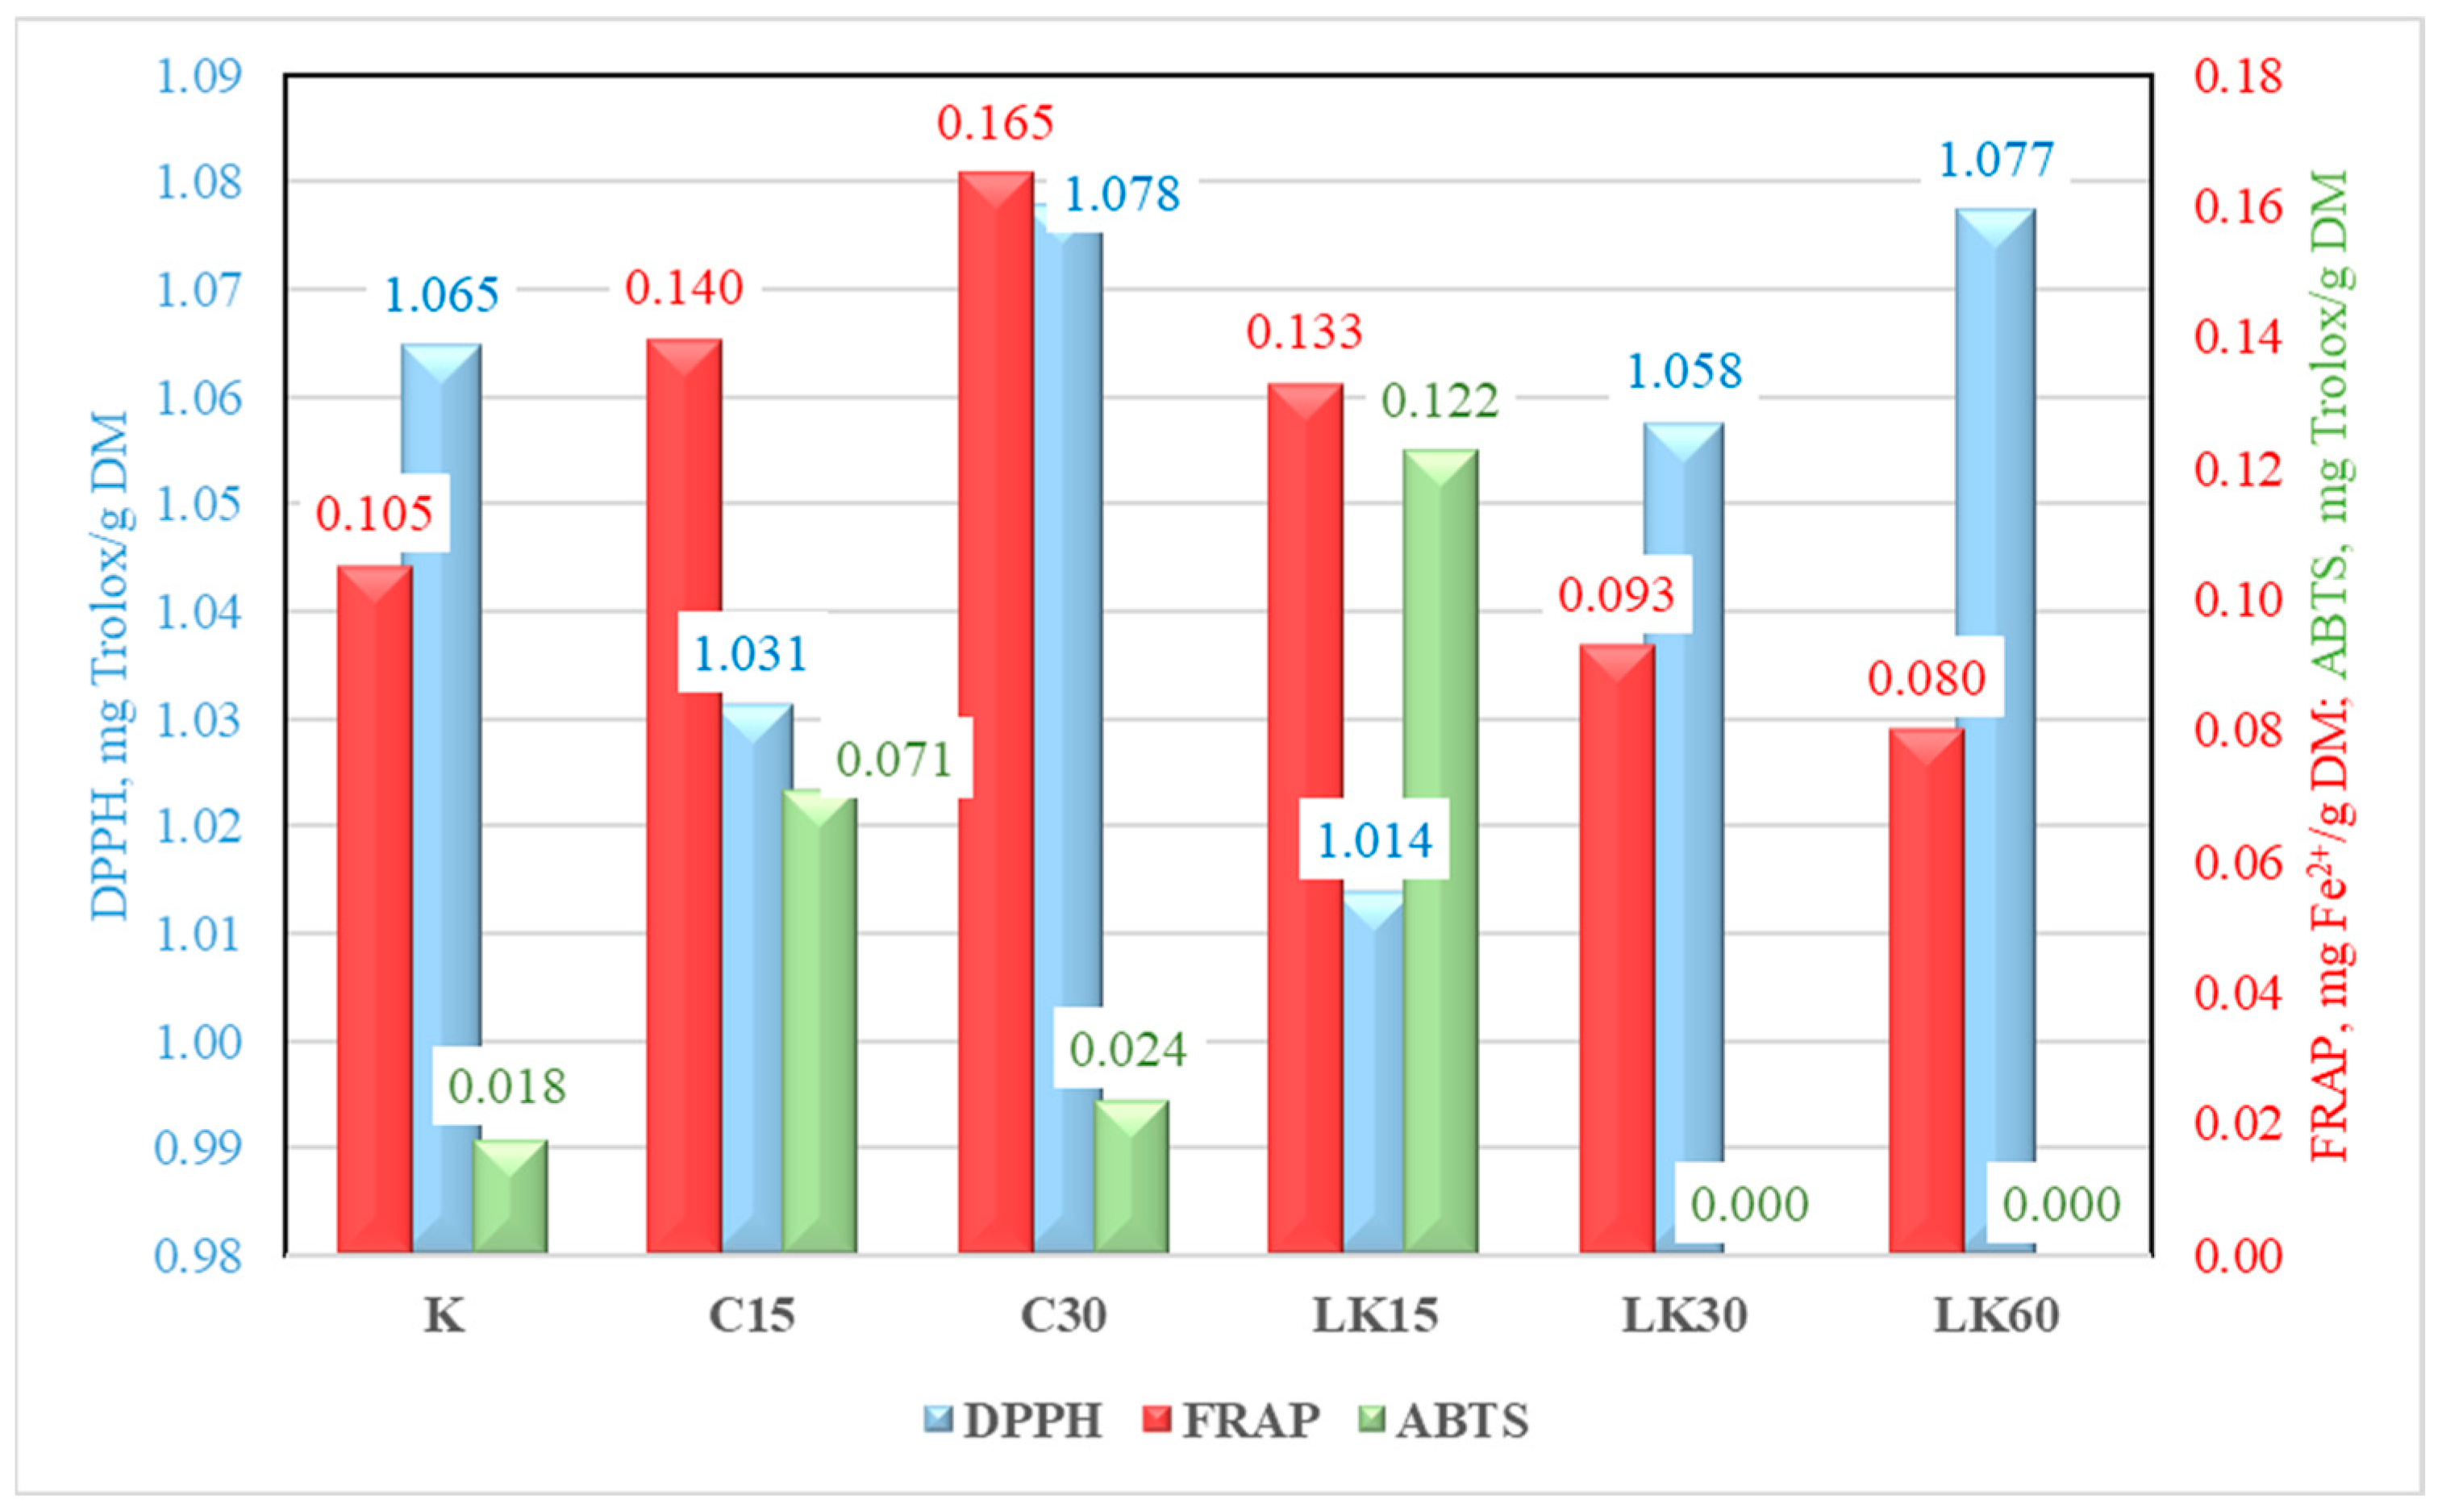
43]. The results of antioxidant activity determined by the DPPH
⦁, FRAP, and ABTS
⦁+ tests in this study are presented in
Figure 1. DPPH
⦁ activity showed smaller variations, ranging from 1.0139 ± 0.01 mg Trolox/g DM in LK15 to 1.0777 ± 0.01 mg Trolox/g DM in C30. FRAP values differed significantly, with the highest observed in C30 (0.1647 ± 0.00 mg Fe
2+/g DM) and the lowest in LK60 (0.0802 ± 0.00 mg Fe
2+/g DM), while ABTS
⦁+ activity was highest in LK15 (0.1224 ± 0.01 mg Trolox/g DM) and absent in LK30 and LK60.
3.1. Sensory Analysis
Sensory analysis is an important factor in the evaluation of food products, playing a key role in consumers’ purchasing decisions. In fermented products such as fermented cabbage heads, sensory analysis helps determine the impact of different ingredients and processing conditions on the final product’s quality. It is essential to identify the most desirable sensory attributes so that manufacturers can improve the product formulation during production.
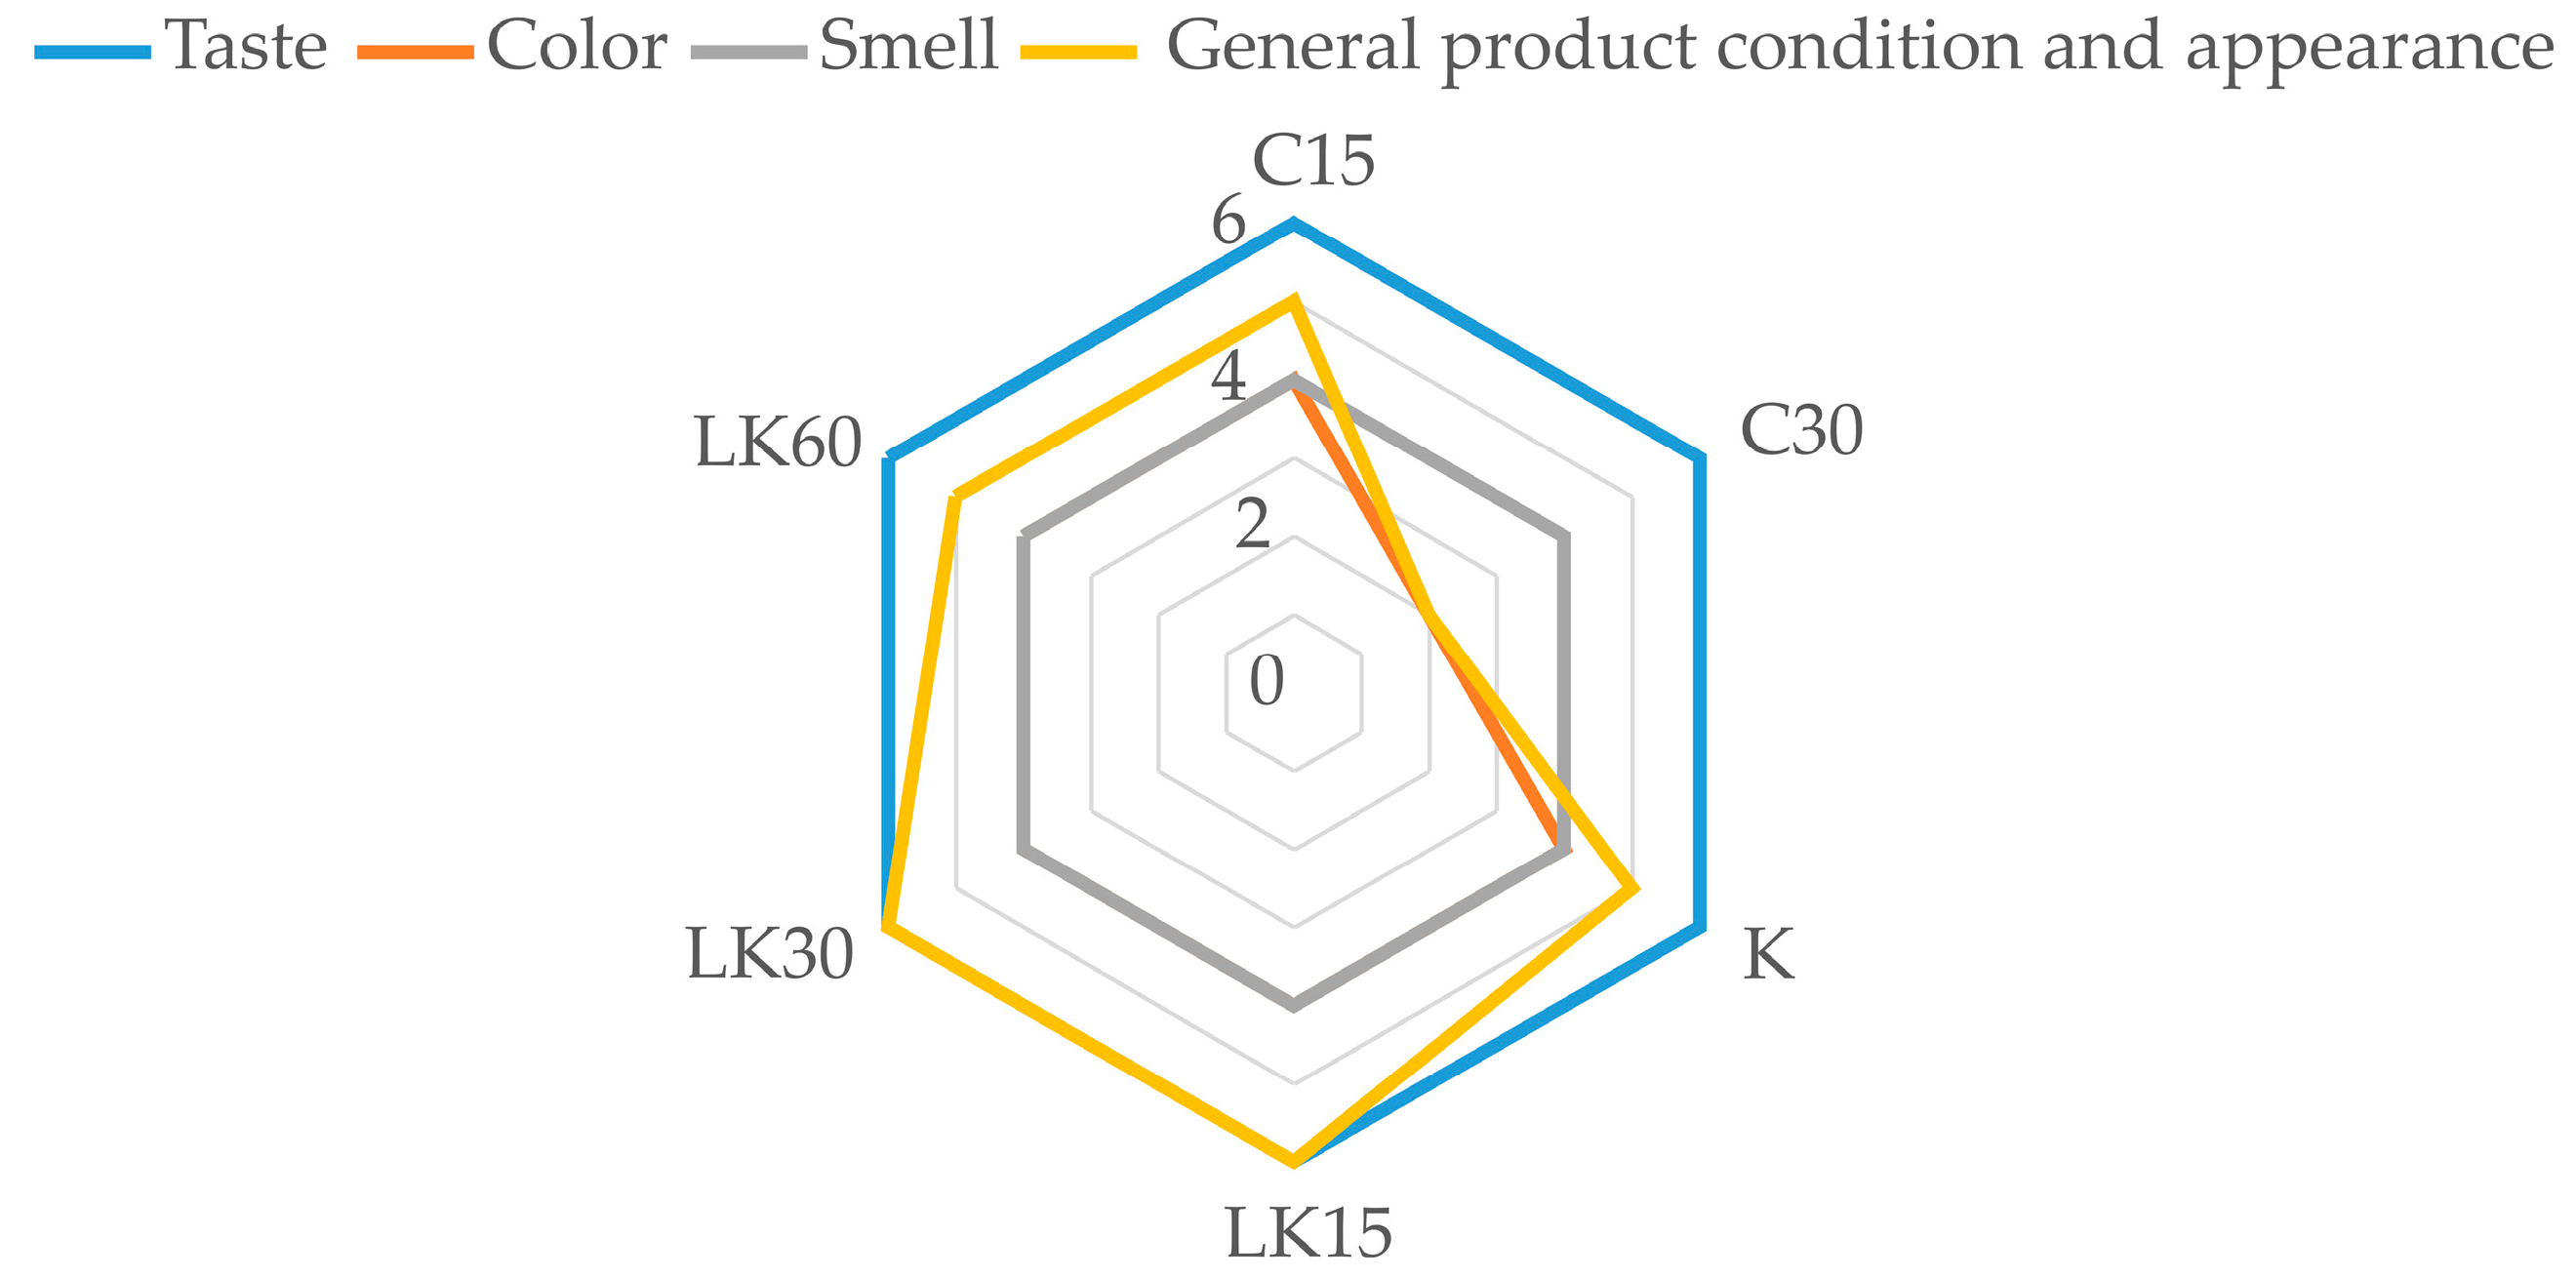
Sensory evaluation was performed using a standardized 20-point scoring system, where individual sensory attributes such as taste, color, smell, and general product condition and appearance were evaluated according to predefined maximum scores (either 4 or 6 points per attribute), depending on their relative importance.
The average scores of the panel of six assessors are presented in
Figure 2. Based on the sensory evaluation of the samples, it was recorded that the least appealing sample in terms of overall condition was the one with added ascorbic acid at a concentration of 0.05% (C30). In contrast, the samples LK15 and LK30 received the highest scores, indicating a greater preference for samples with added citric acid compared to those with added ascorbic acid at the beginning of fermentation.
The preference for LK15 and LK30 can be explained by the positive effects of citric acid on key sensory attributes. Citric acid contributes to the characteristic sour taste, improves color retention, and enhances texture by maintaining firmness of the cabbage leaves. In contrast, the lower acceptability of C30 may result from early oxidative changes caused by ascorbic acid, affecting flavor and appearance.
Among the evaluated samples, LK15 and LK30 received the highest overall acceptability. For these samples, the individual sensory attributes—color, taste, aroma, and general appearance—were consistently rated the highest by the panel, with average scores of 4 for color, 6 for taste, 4 for smell, and 6 for overall impression. These results indicate that both LK15 and LK30 achieved a harmonious balance of sensory qualities, confirming that the addition of citric acid at these concentrations optimally enhanced the product’s appeal.
Overall, the results indicate that citric acid-treated samples were preferred due to their more balanced taste, better color, and overall visual and flavor appeal, emphasizing the importance of ingredient selection in optimizing sensory quality and consumer acceptability.
3.2. Standard Scores
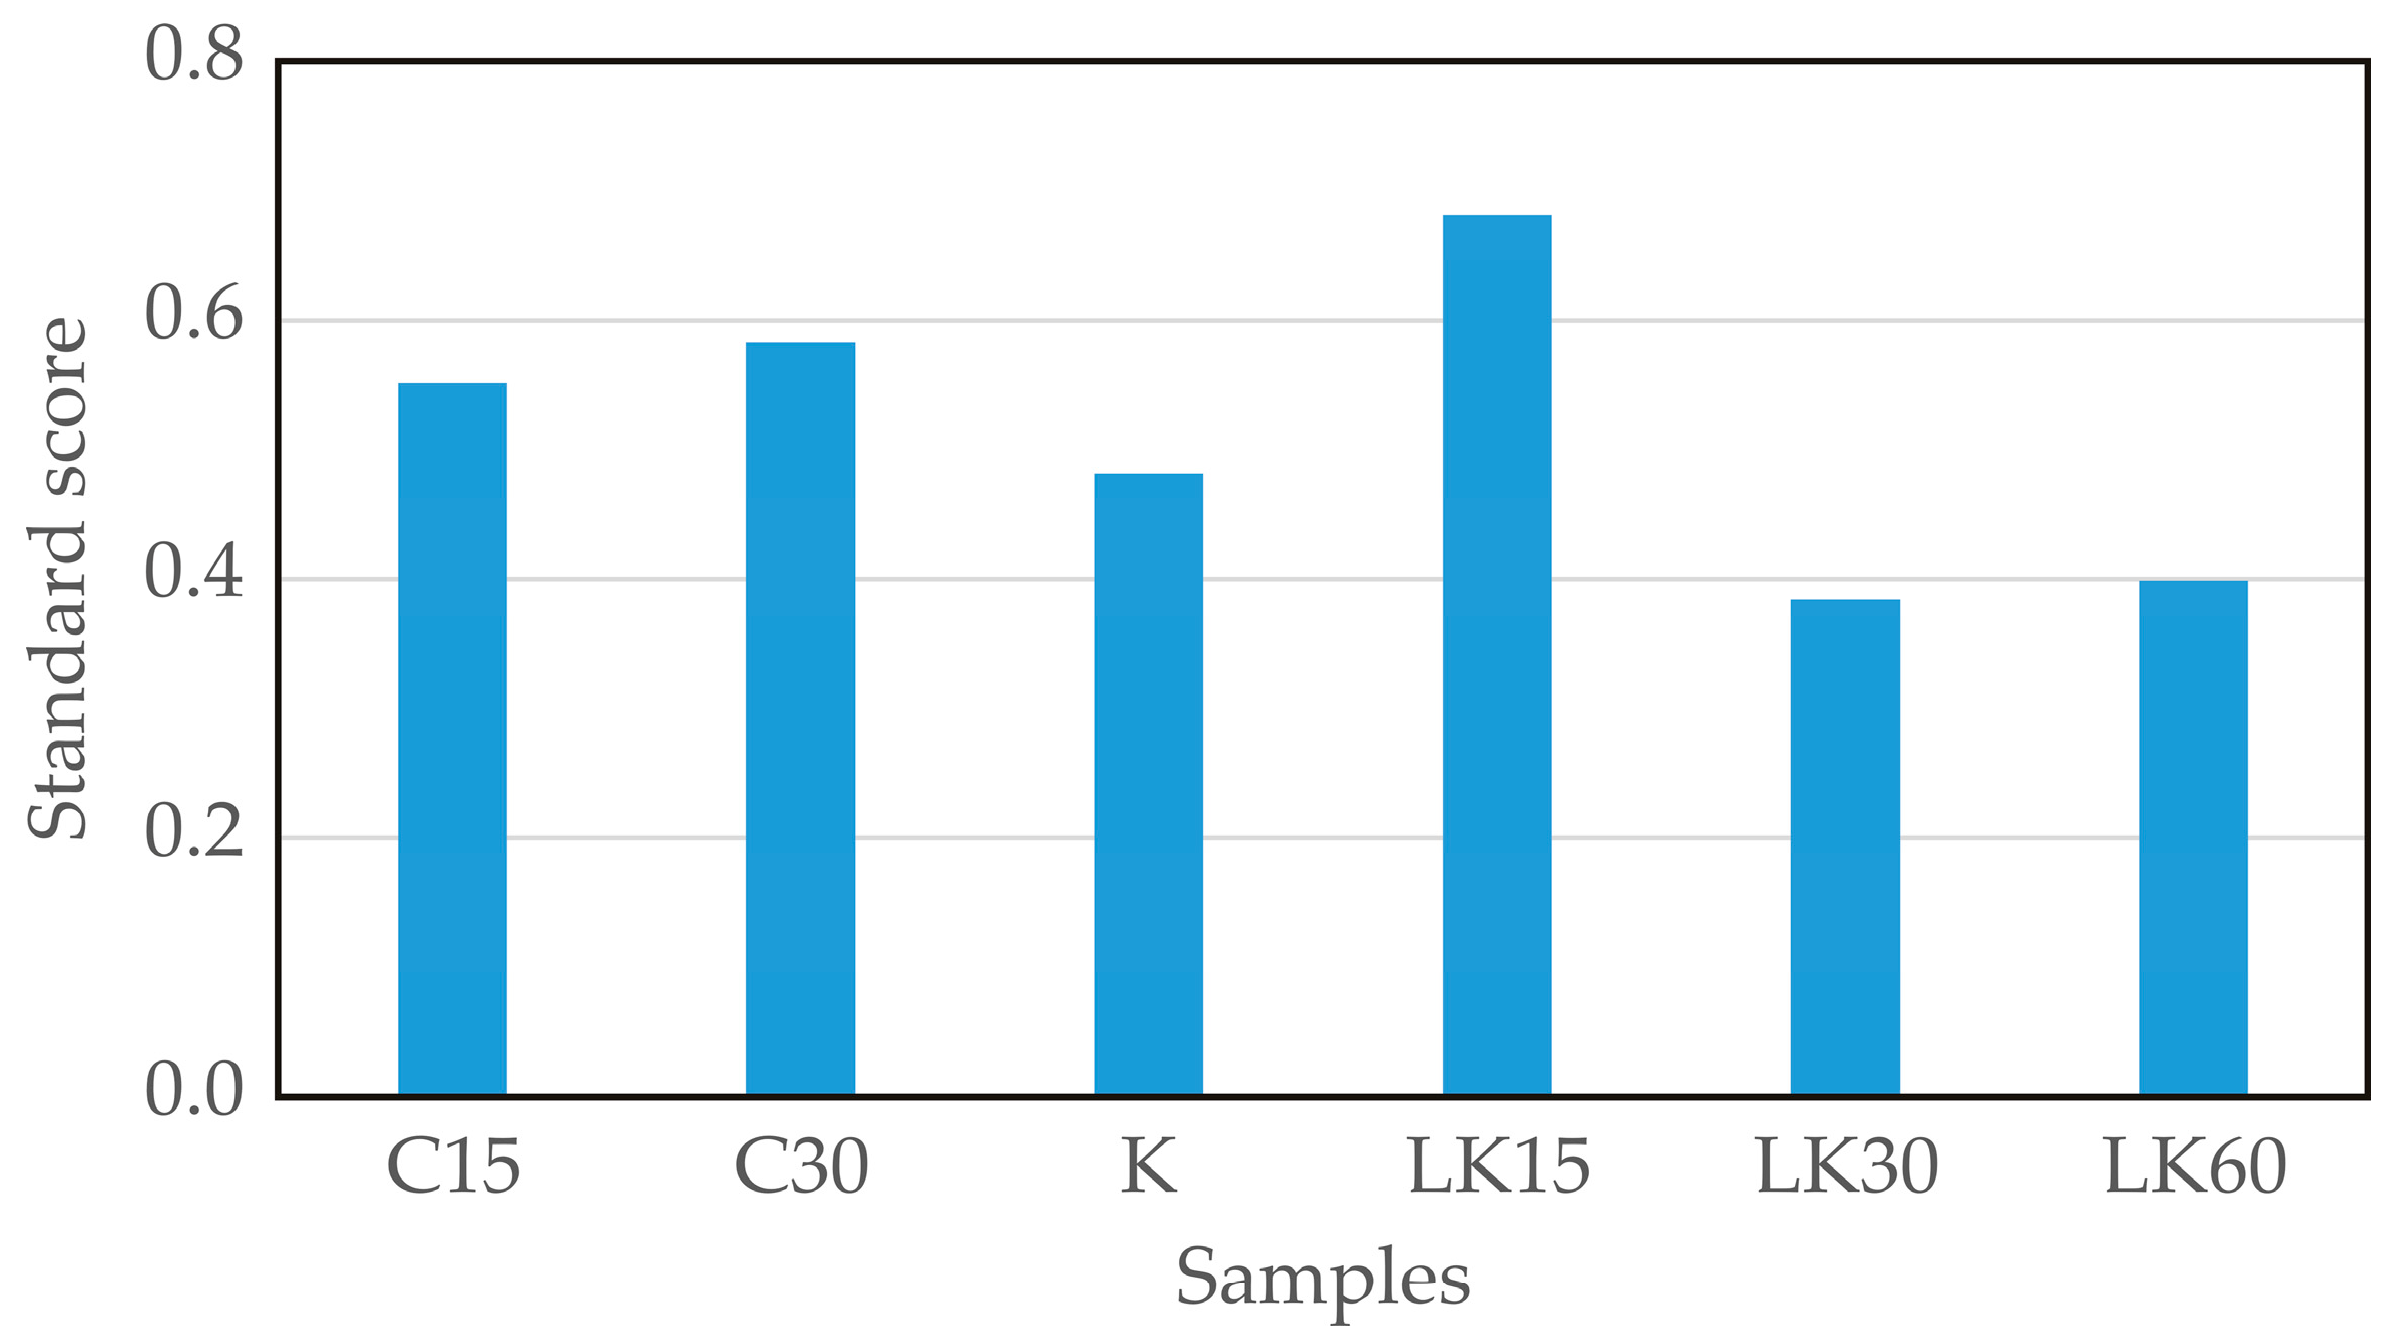
The standard score (
Figure 3) was obtained by summing the normalized scores for each variable (TPC, DPPH
⦁, FRAP, ABTS
⦁+, and ascorbic acid). By maximizing the SS function, the optimal sample was found (when the SS function approaches a value of 1, it indicates a stronger likelihood that the tested processing parameters are optimal).
The standard score (SS) was calculated by summing the min–max normalized values of all antioxidant-related variables (TPC, DPPH⦁, FRAP, ABTS⦁+, and ascorbic acid), allowing their integration into a single composite index. This approach enables multi-criteria optimization by placing all variables on a comparable scale (0–1), thereby avoiding bias due to differences in units and magnitudes. The optimal result obtained using the standard score (0.681), maximizing ascorbic acid, TPC, DPPH⦁, FRAP and ABTS⦁+ were 1671.48 mg AsA/100 g DM; 419.050 mg GAE/100 g DM; 1.0139 mg Trolox/g DM; 0.1328 mg Fe2+/g DM; 0.1224 mg Trolox/g DM, respectively, and according to this optimal sample was LK15.
3.3. Correlation Analysis
The correlation analysis (
Table 2) revealed significant relationships between chemical composition parameters and antioxidant capacity, enabling a better understanding of the interactions between bioactive compounds formed during fermentation. TPC showed a strong positive correlation with both FRAP (r = 0.843,
p = 0.035) and ABTS (r = 0.867,
p = 0.025), confirming that phenolic compounds play an important role in the overall antioxidant potential. This is expected since phenolics are known to act as reducing agents and free radical scavengers, which is directly reflected in FRAP and ABTS assays. A similar correlation has been reported in cucumber and celery [
44,
45].
A strong positive correlation was also observed between ascorbic acid and FRAP (r = 0.907, p = 0.013), indicating that vitamin C significantly contributes to the reducing power of the samples. This suggests that antioxidant capacity is not determined solely by phenolic compounds but also by other antioxidants such as ascorbic acid, as well as possible bioactive compounds formed during fermentation.
On the other hand, DPPH showed a strong negative correlation with ABTS (r = −0.911, p = 0.012), which may indicate differences in the mechanisms of antioxidant action measured by these methods. While ABTS measures both hydrophilic and lipophilic antioxidant activity, DPPH is more selective toward hydrophobic compounds, which may explain the observed differences.
Additionally, dry matter and titratable acidity did not show significant correlations with antioxidant parameters, suggesting that basic physicochemical properties were less influential on antioxidant capacity compared to bioactive compounds. Similarly, pH values were not significantly correlated with antioxidant assays, although slight trends may indicate indirect effects through the stability of antioxidant compounds.
Overall, these results suggest that antioxidant activity is influenced by multiple compounds present in the samples rather than a single component, indicating the possible combined contribution of different antioxidants.
3.4. Principal Component Analysis (PCA)
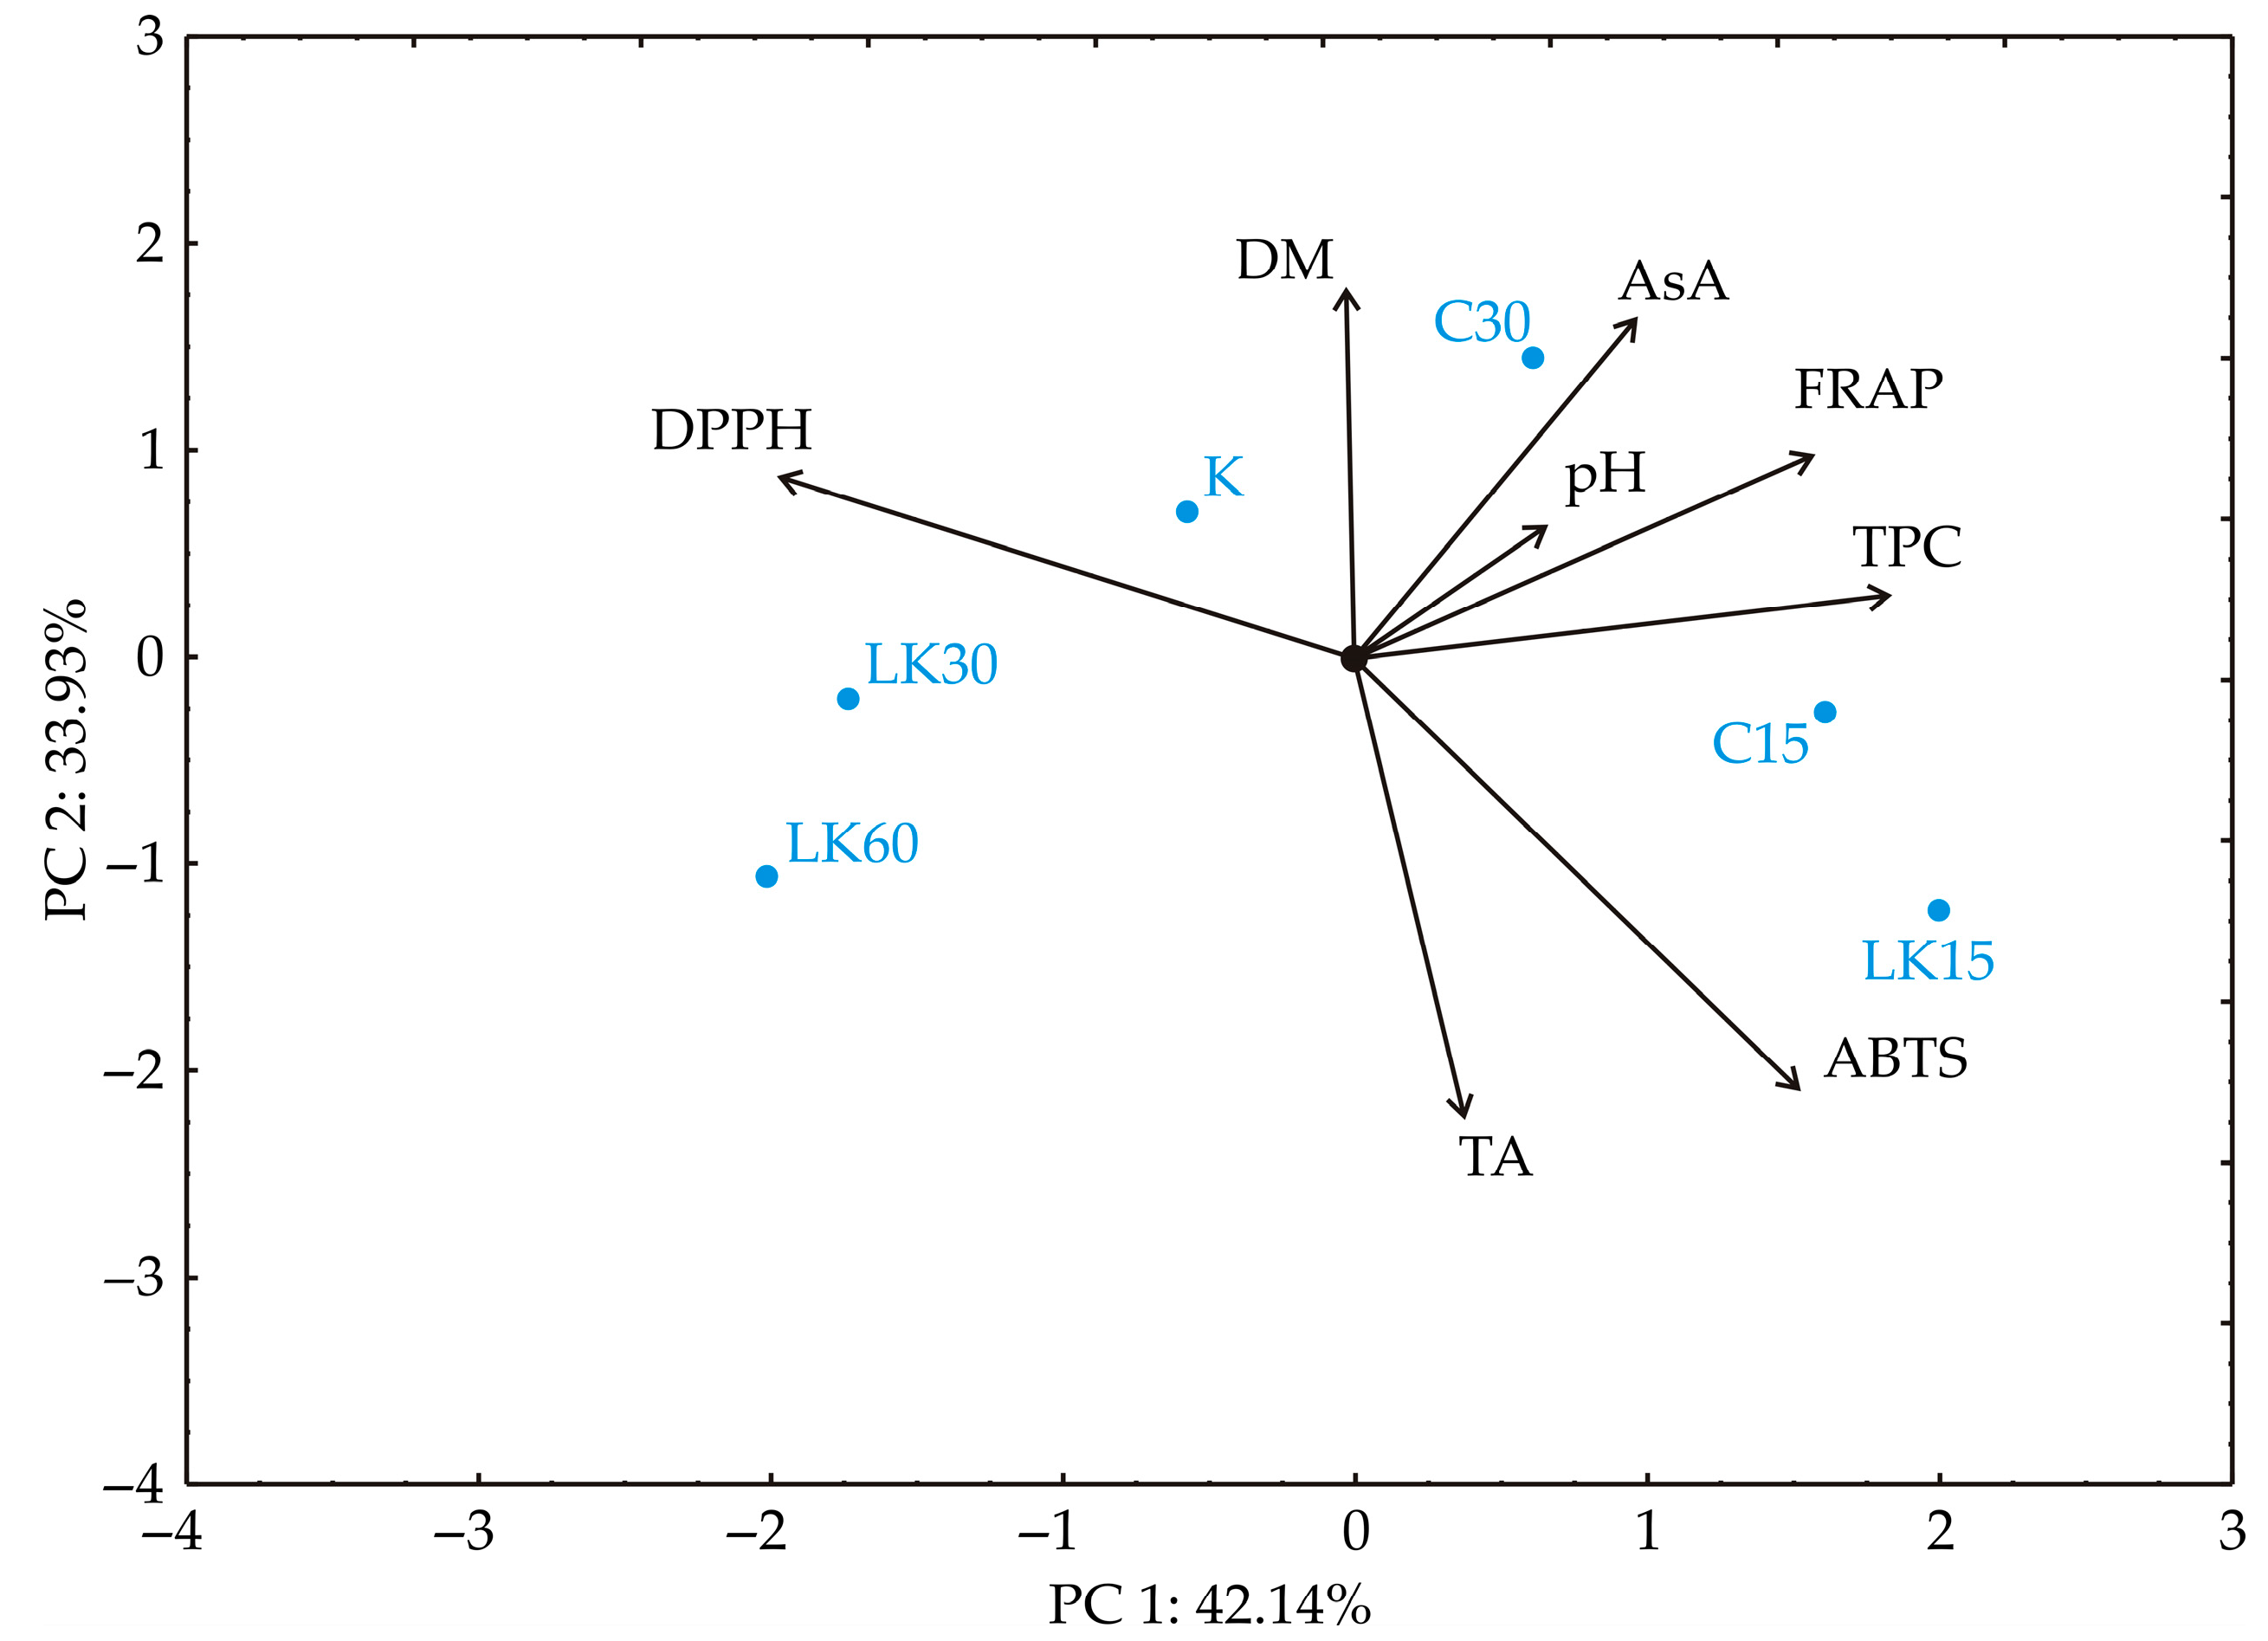
The principal component analysis (PCA) revealed distinct patterns among cabbage fermentation samples, with PC1 and PC2 explaining 42.14% and 33.93% of the total variance in the dataset (
Figure 4).
The PCA results indicated that principal component 1 (PC1) and principal component 2 (PC2) collectively explained the variability in the dataset and provided insights into the relationships between variables. PC 1 was primarily influenced by strong positive loadings from FRAP (19.83%, based on correlation), ABTS (24.50%), ascorbic acid (VC; 7.86%), and total phenolics content (TPC; 28.80%), highlighting these variables as the dominant contributors along this dimension. This finding suggests that PC 1 represents a gradient of antioxidant and chemical content.
PC 2, on the other hand, was characterized by strong positive contributions from DM (23.63%, based on correlation), AsA (17.98%), DPPH (11.02%) and FRAP (9.29%). These results imply that PC 2 is driven by antioxidant capacity and acidity-related characteristics. pH showed minimal contribution to both factors, indicating its negligible impact on the differentiation of samples along these axes.
The opposing trends between variables such as TPC, DPPH and ABTS, as well as TA and DM, reflect their contrasting roles in characterizing the samples.
The clustering of samples indicated differentiation based on chemical and bioactive properties. The sample C30 was characterized by high levels of ascorbic acid. Conversely, LK15 exhibited the highest contributions from total phenolics content and ABTS, positioned positively along PC1. The variables DPPH and DM contributed predominantly along PC2, whereas pH and titratable acidity demonstrated a strong negative correlation, with pH driving the clustering of samples LK60, LK30, and K. The results suggested that C15 exhibited moderate contributions from total phenolics content and FRAP, whereas samples K, LK30, and LK60 were associated with lower pH values and lower bioactive properties.




 ,
,