

Aerodynamic Study of a Drag Reduction System and Its Actuation System for a Formula Student Competition Car


Abstract
:1. Introduction
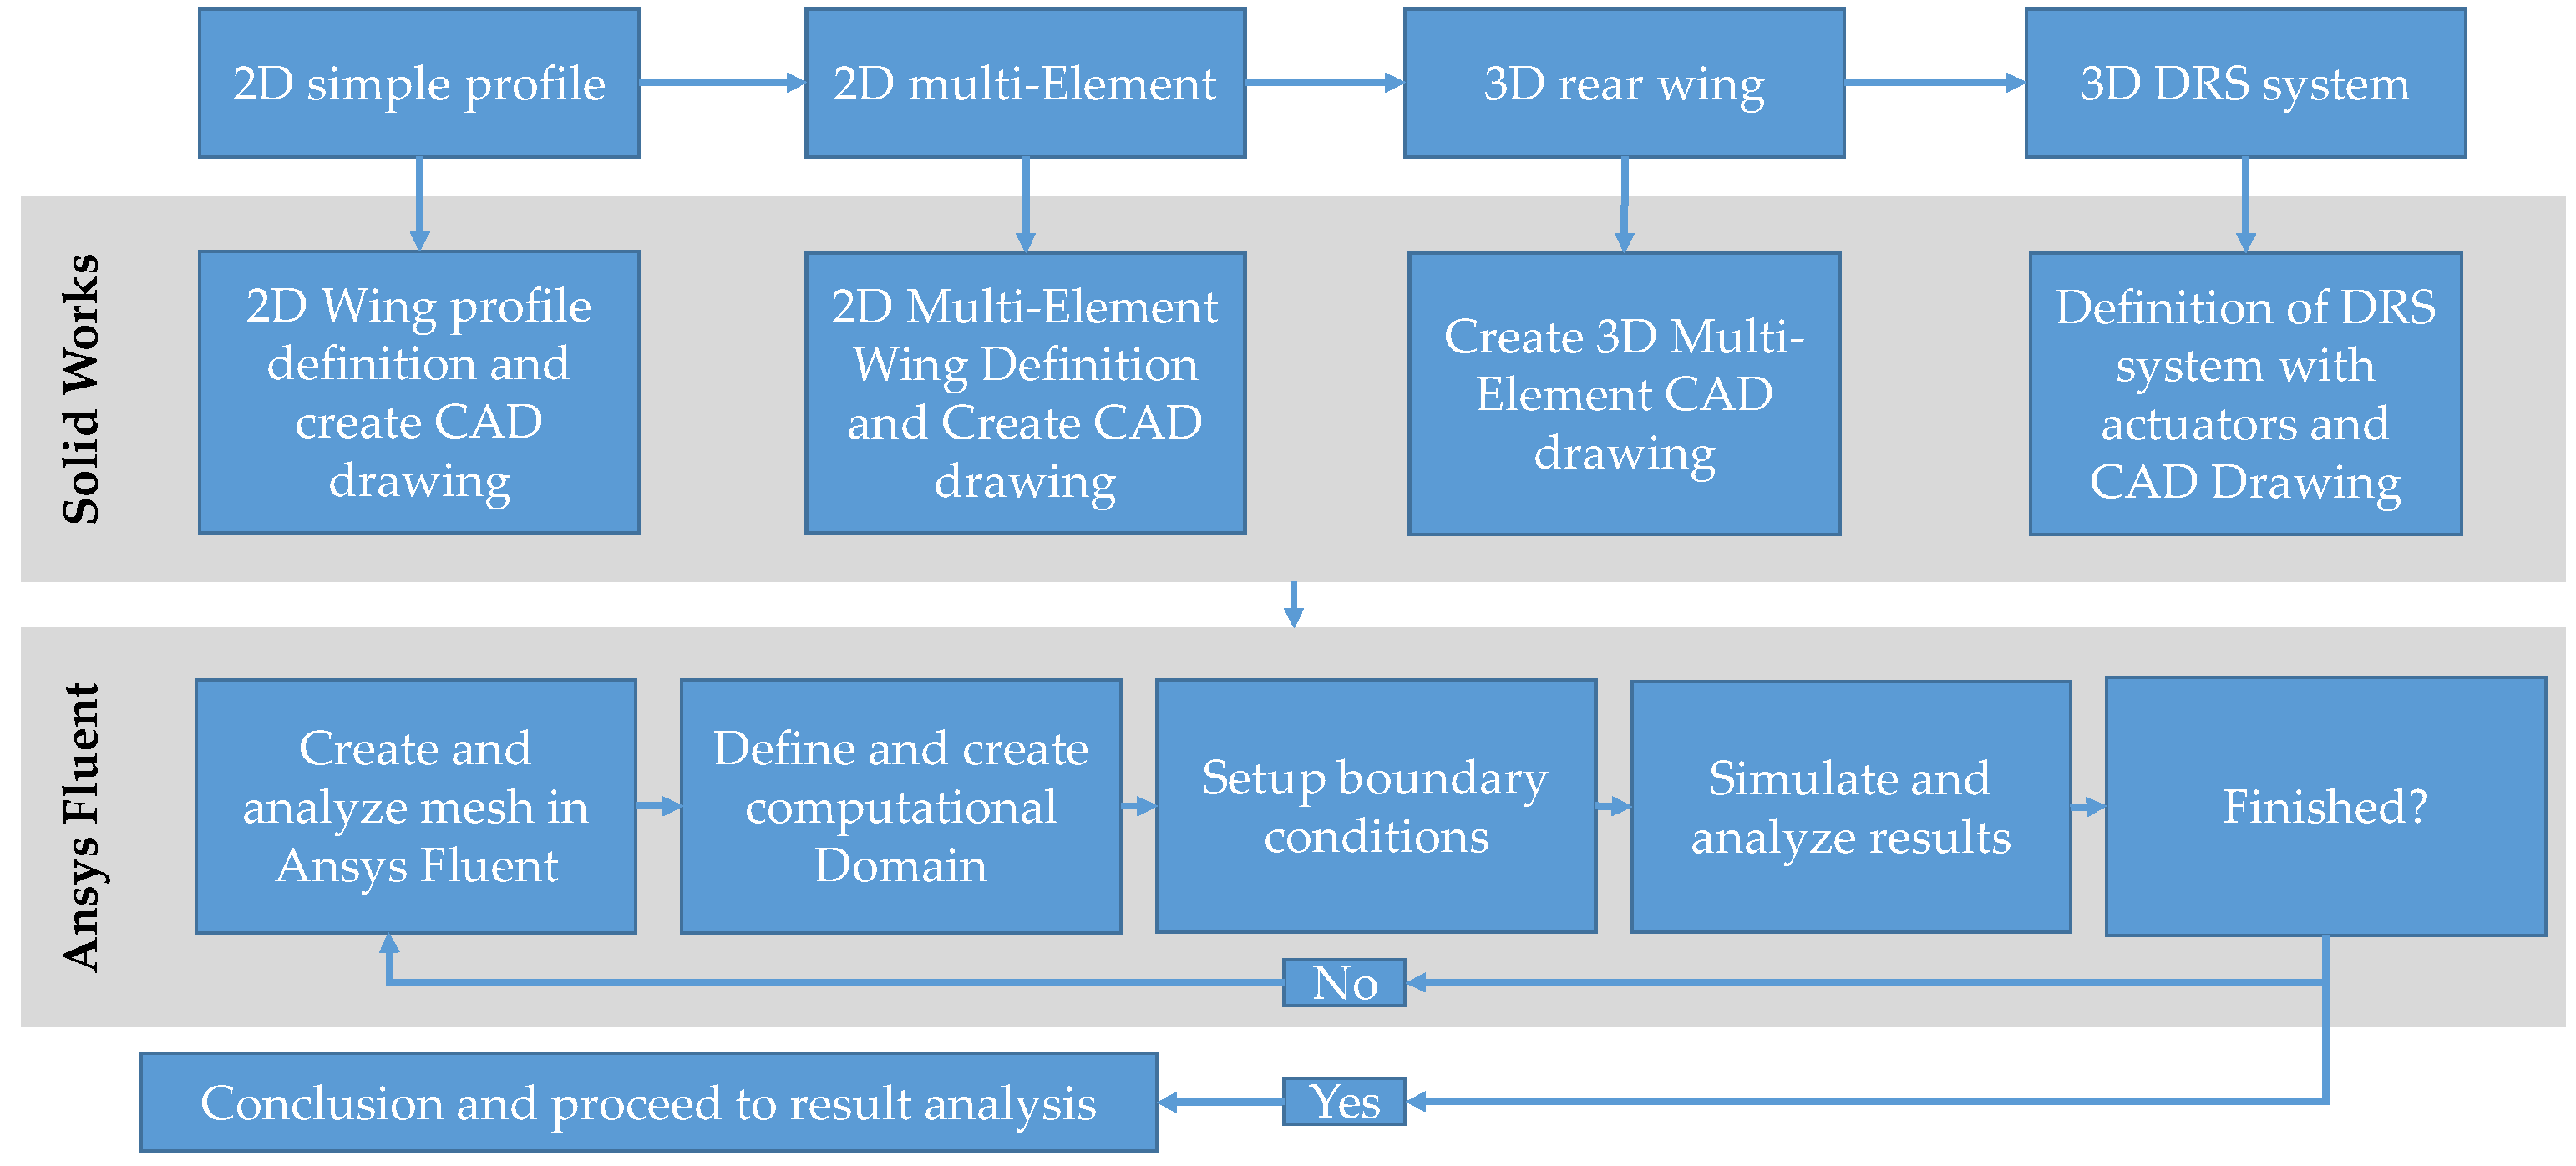
2. Materials and Methods
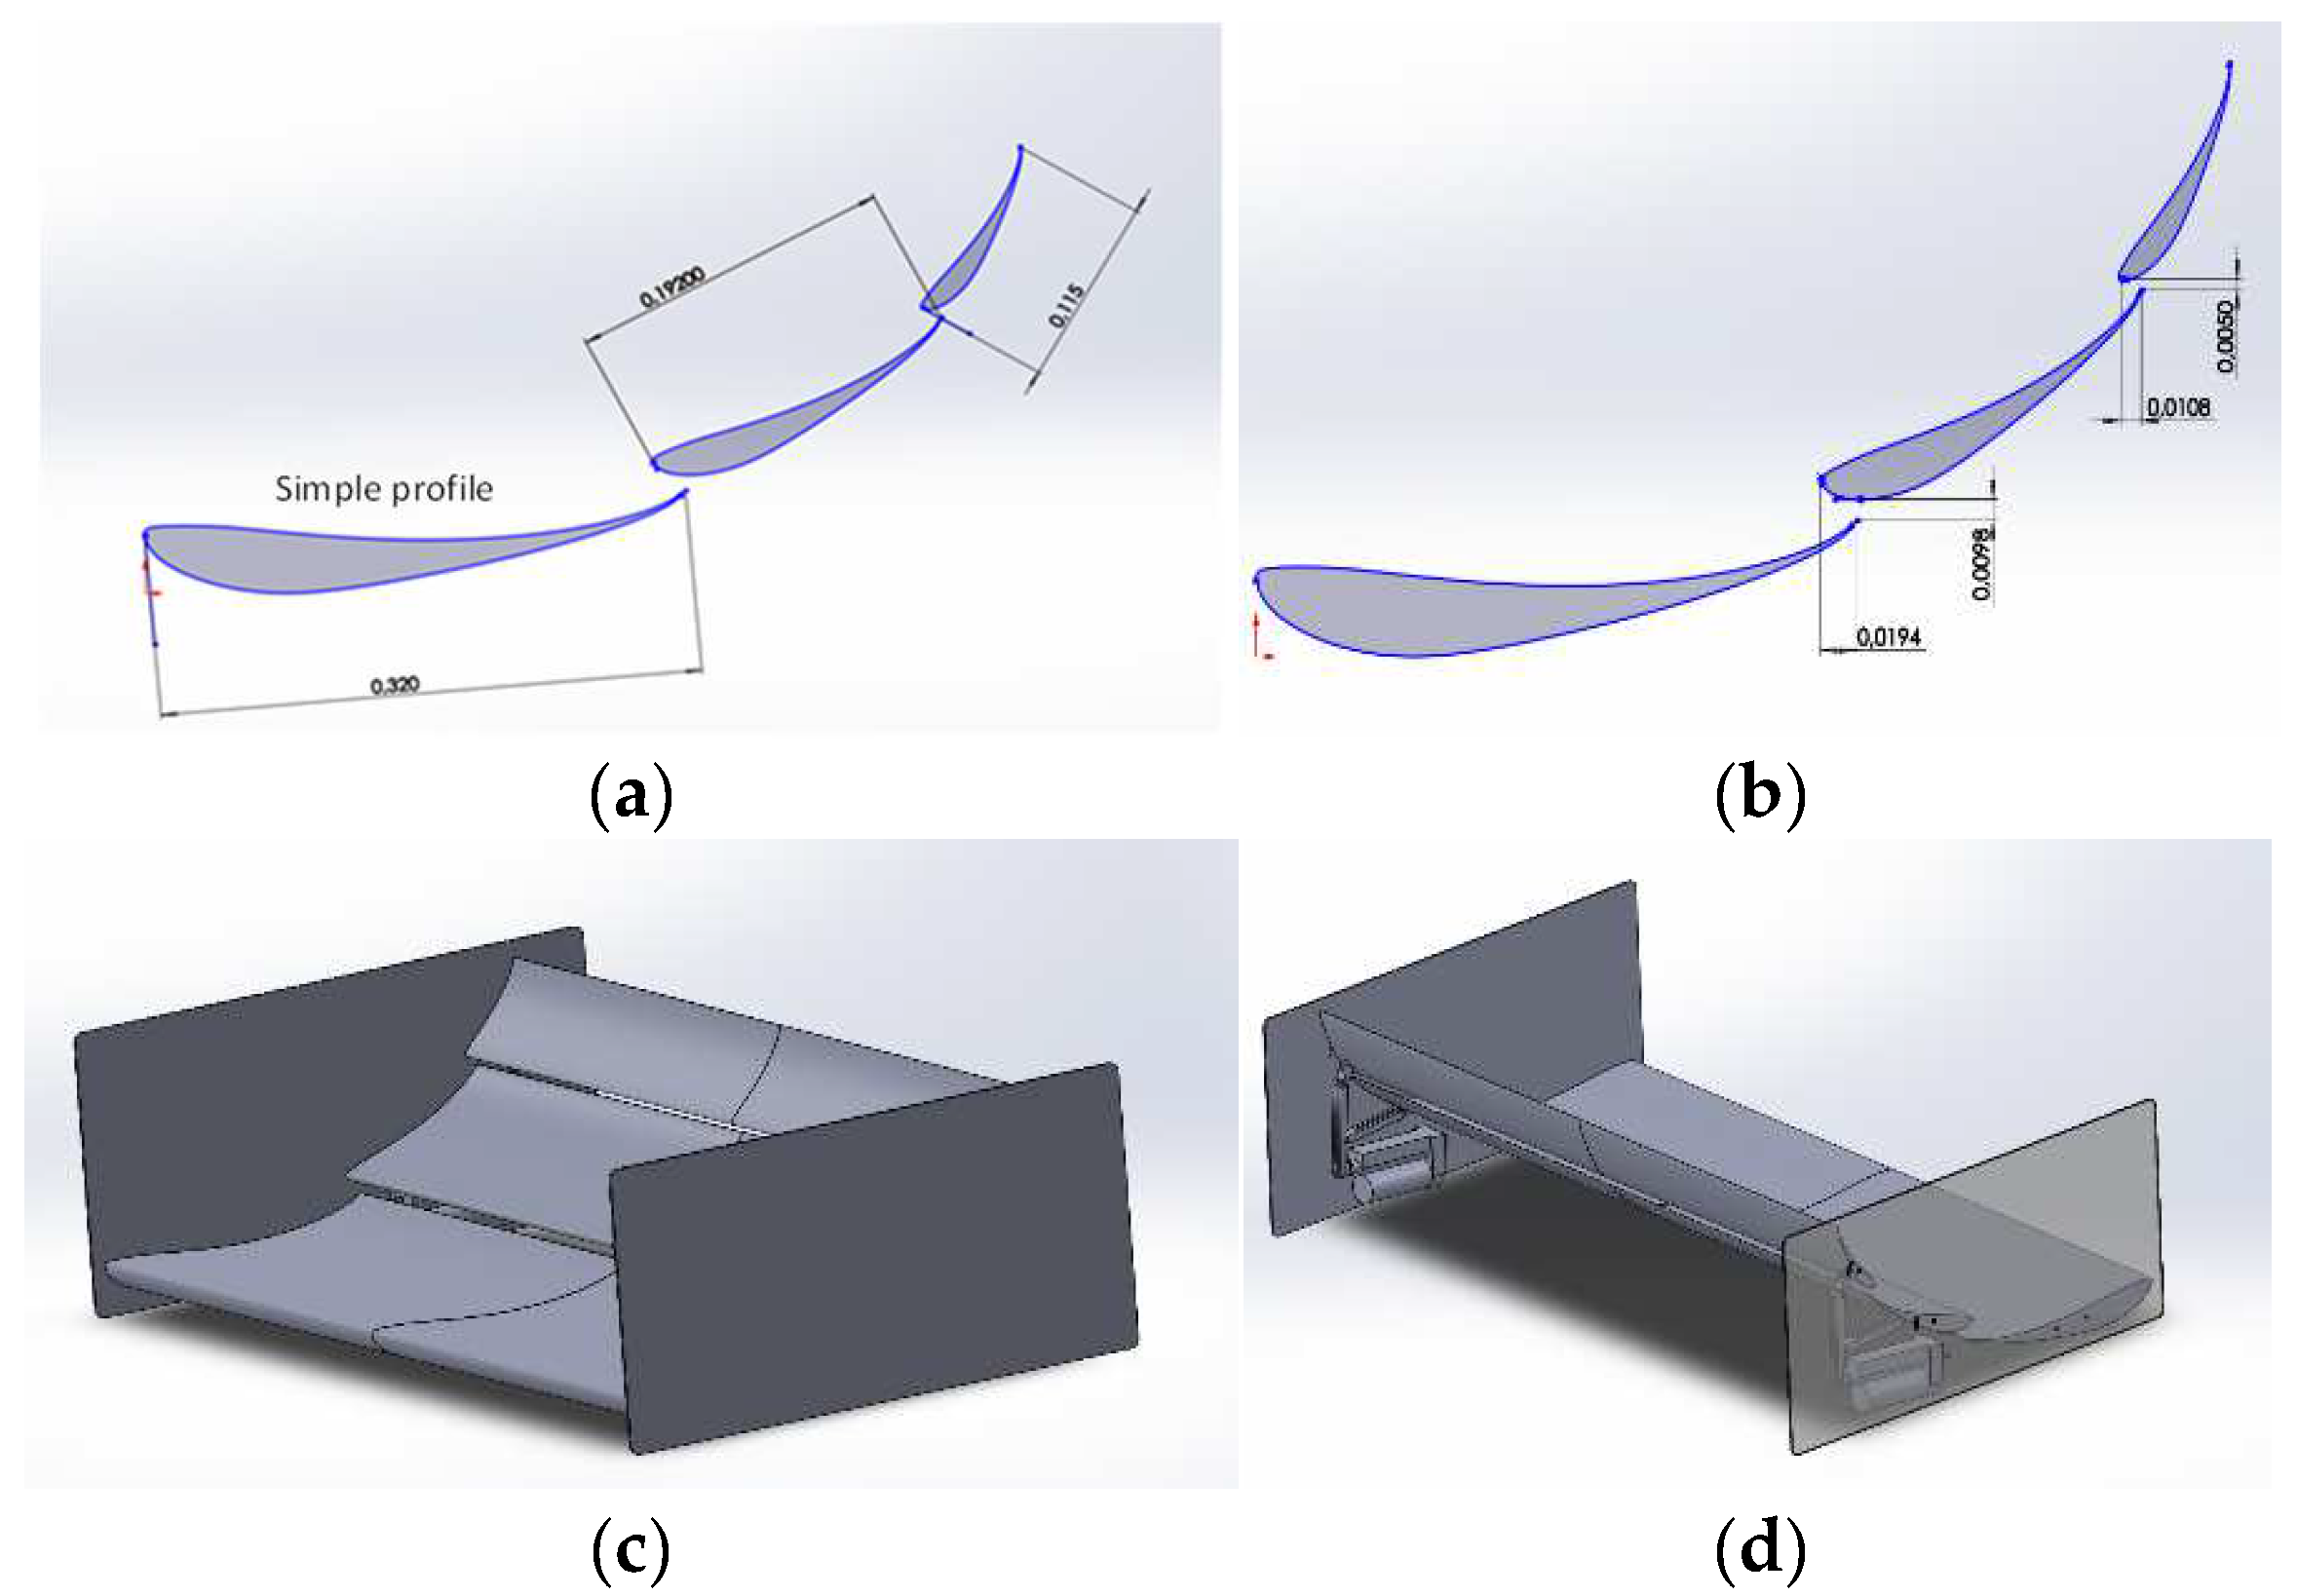
2.1. Profile
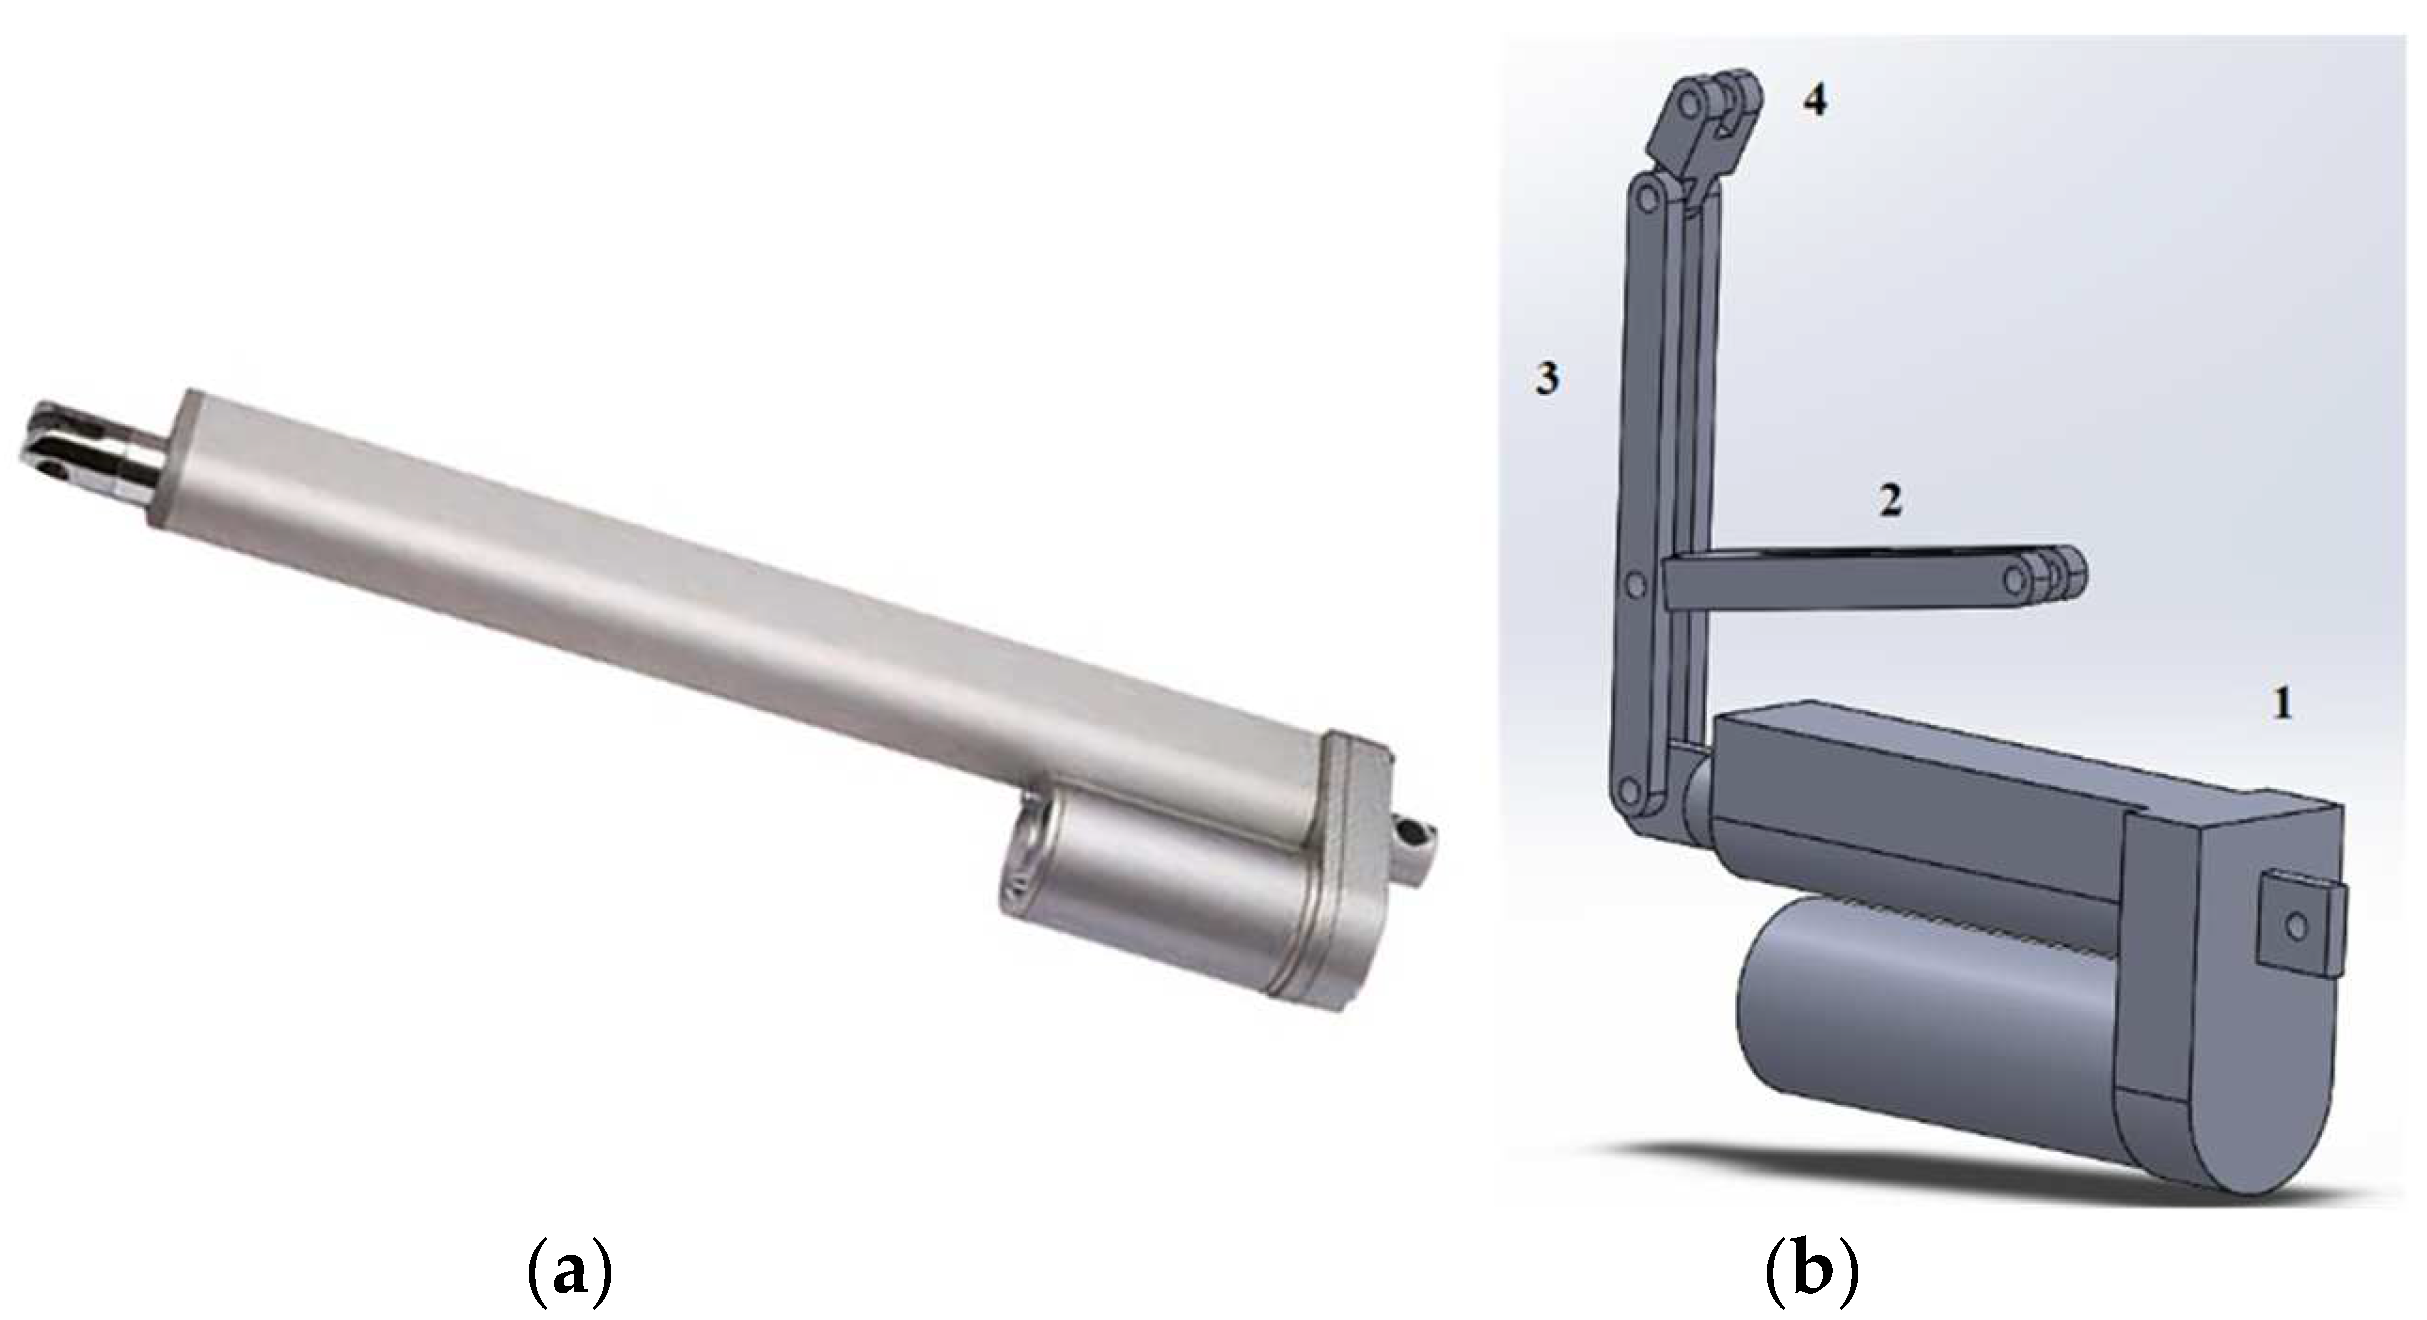
2.2. Actuator
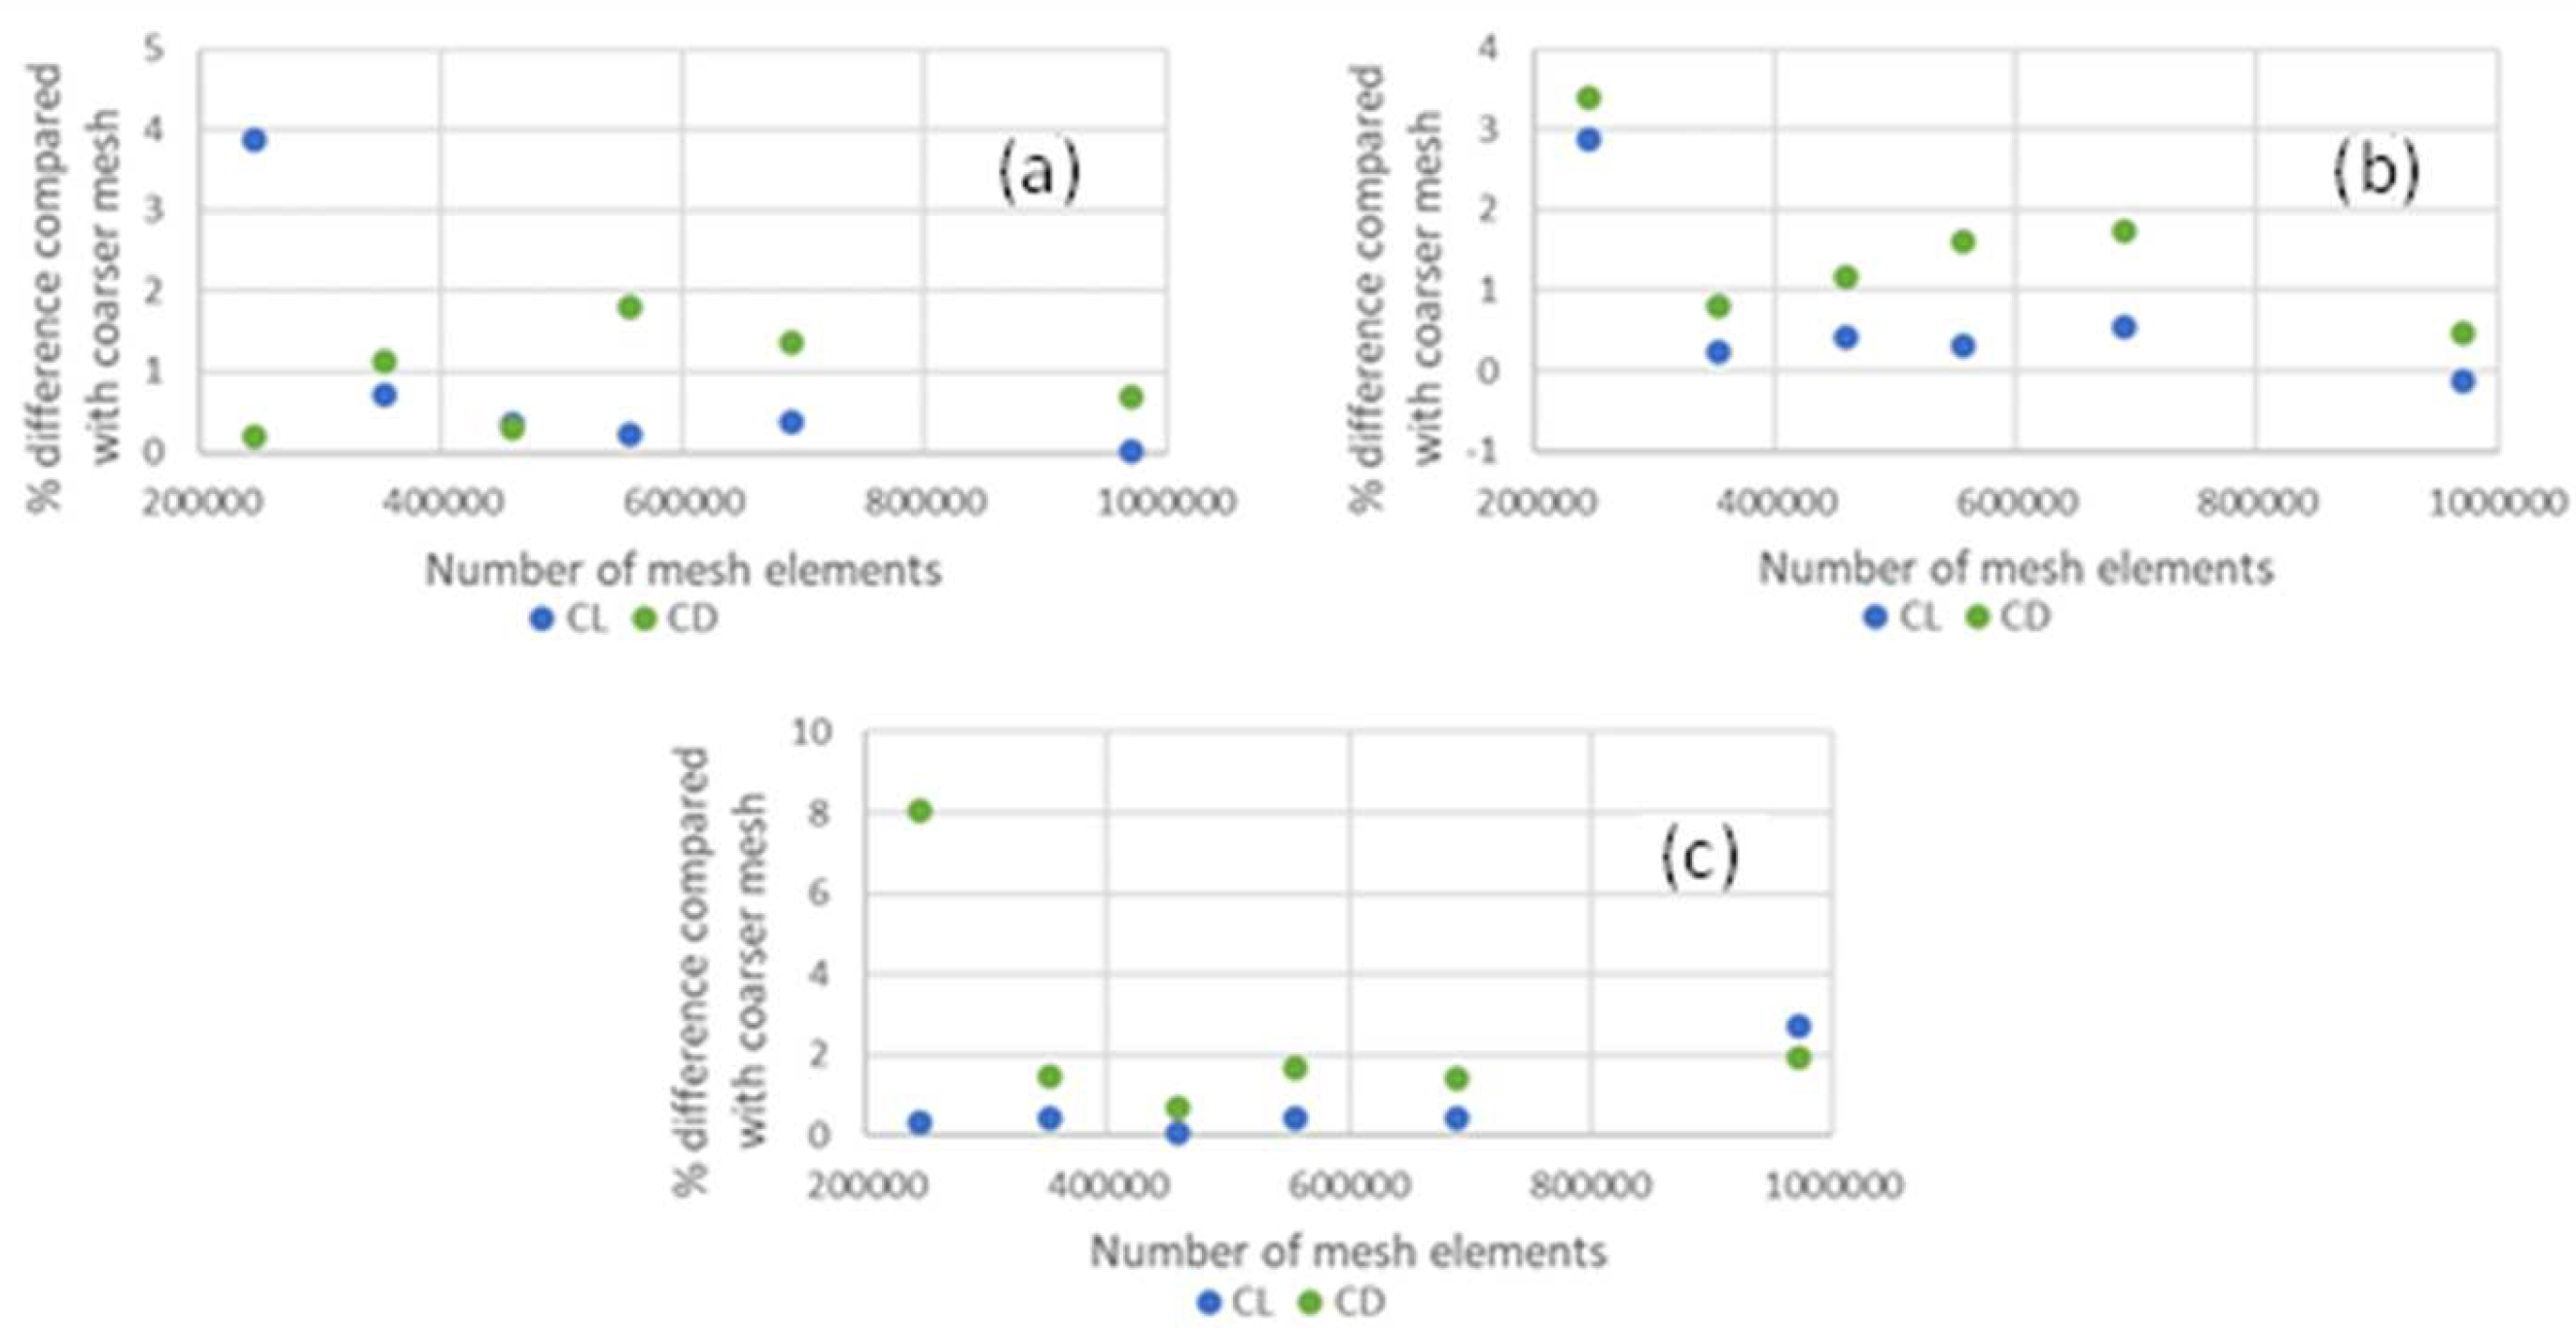
2.3. CFD Domain
3. Results
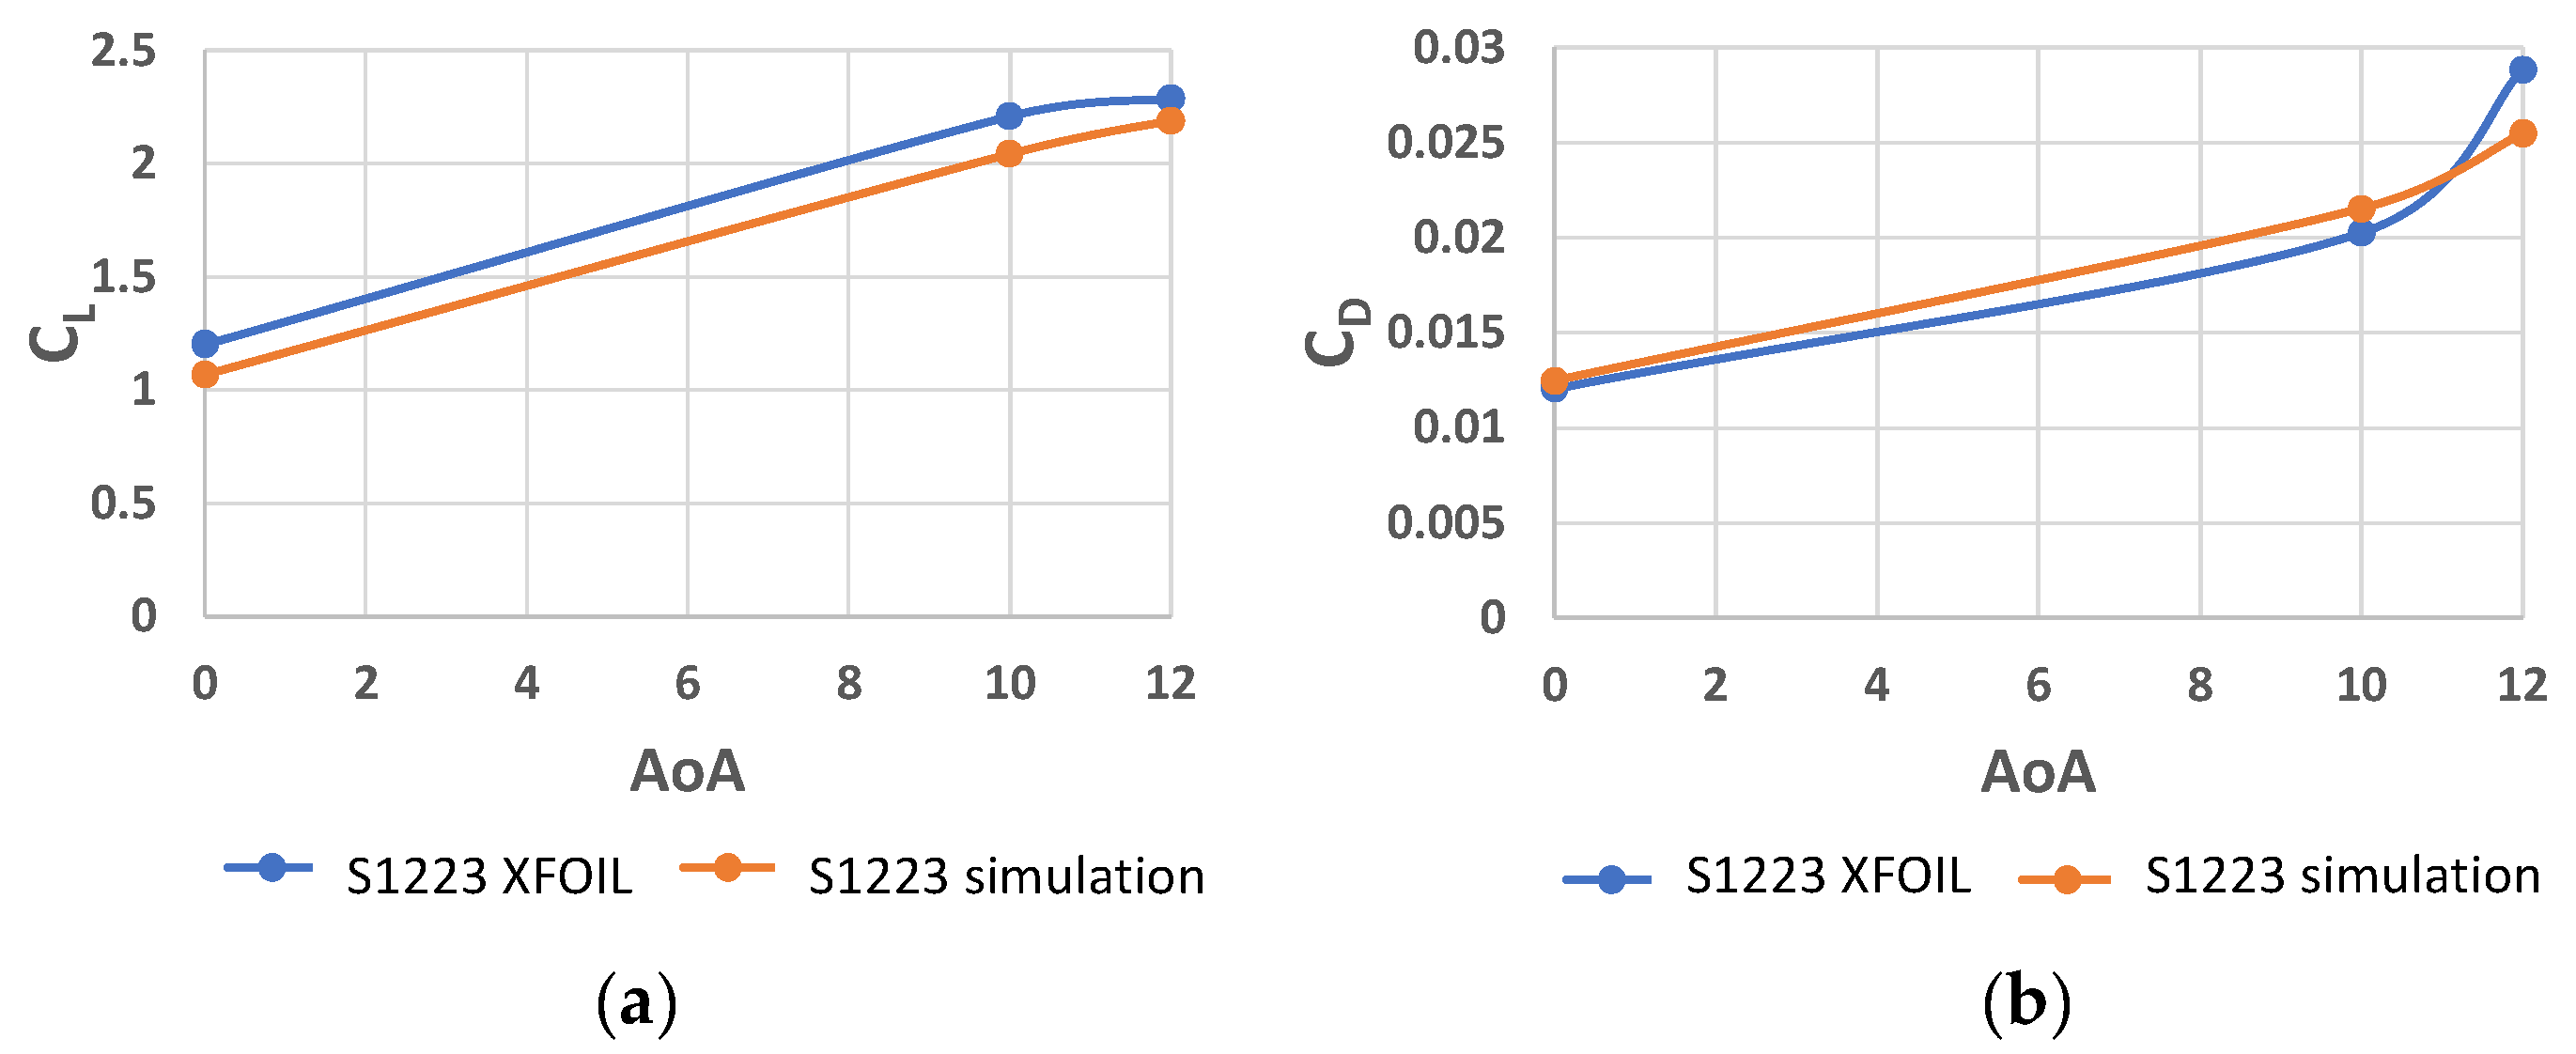
3.1. S1123 Profile (2D)
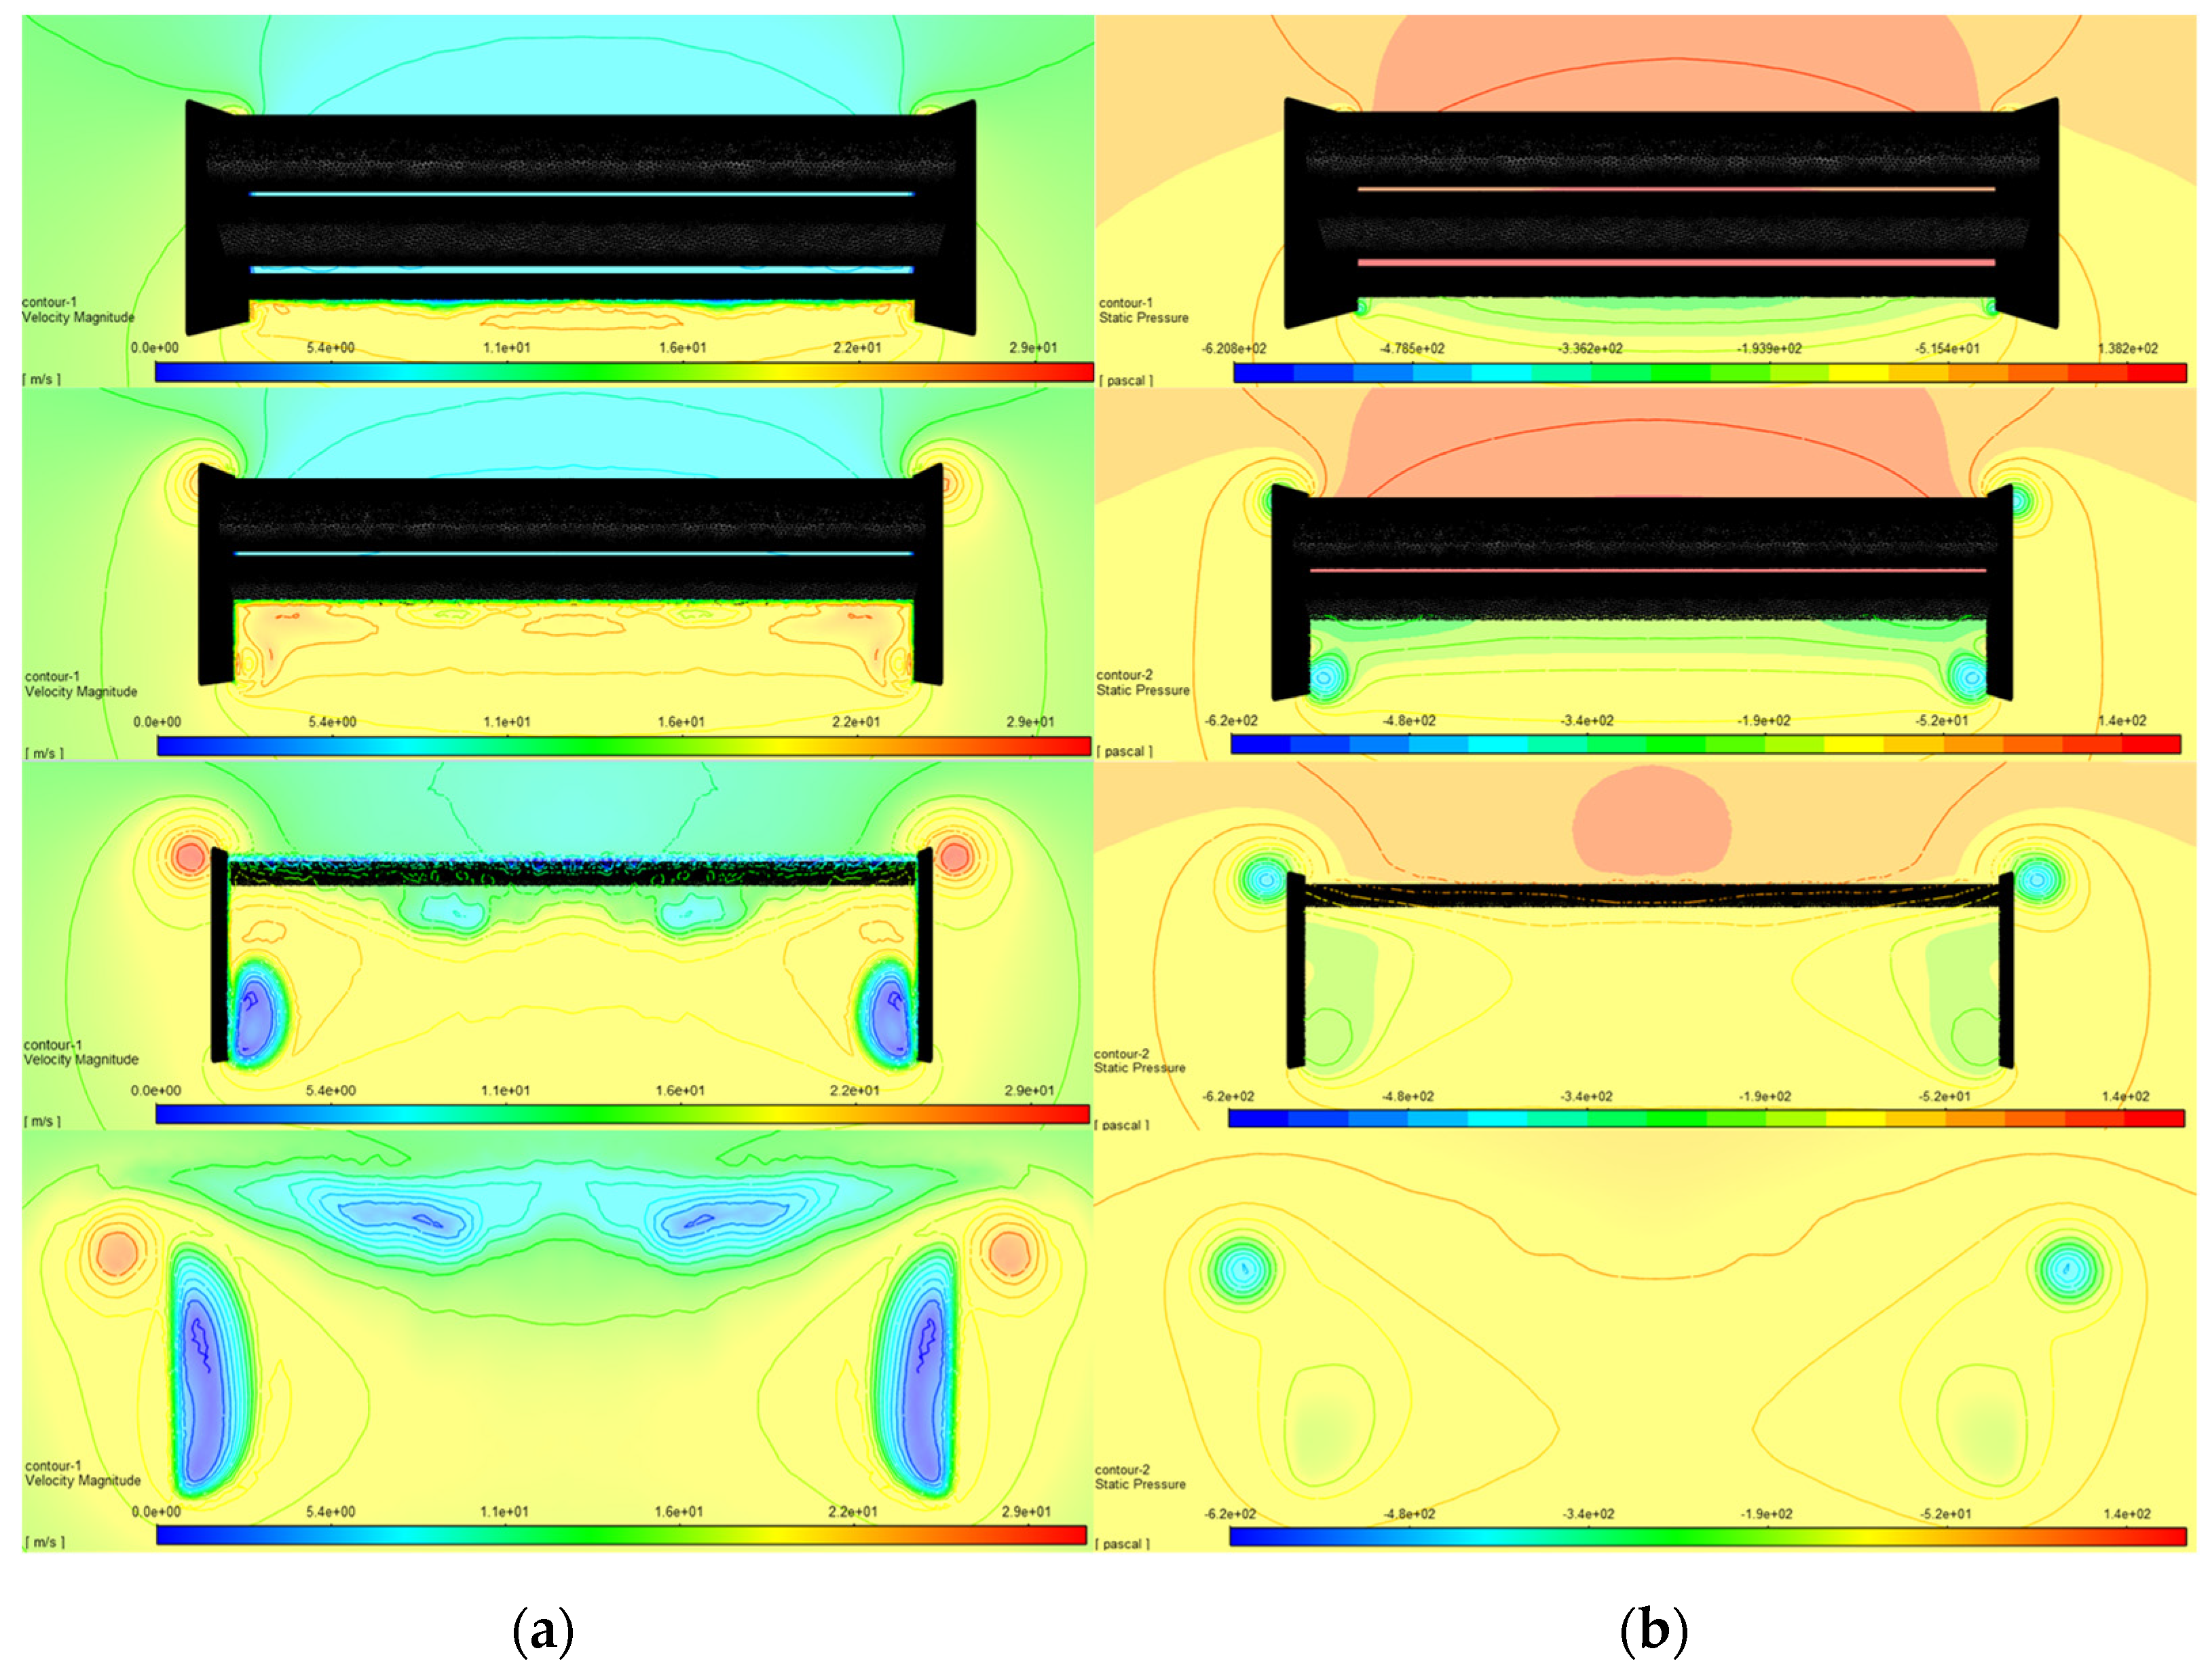
3.2. S1123 Multi-Element Profile
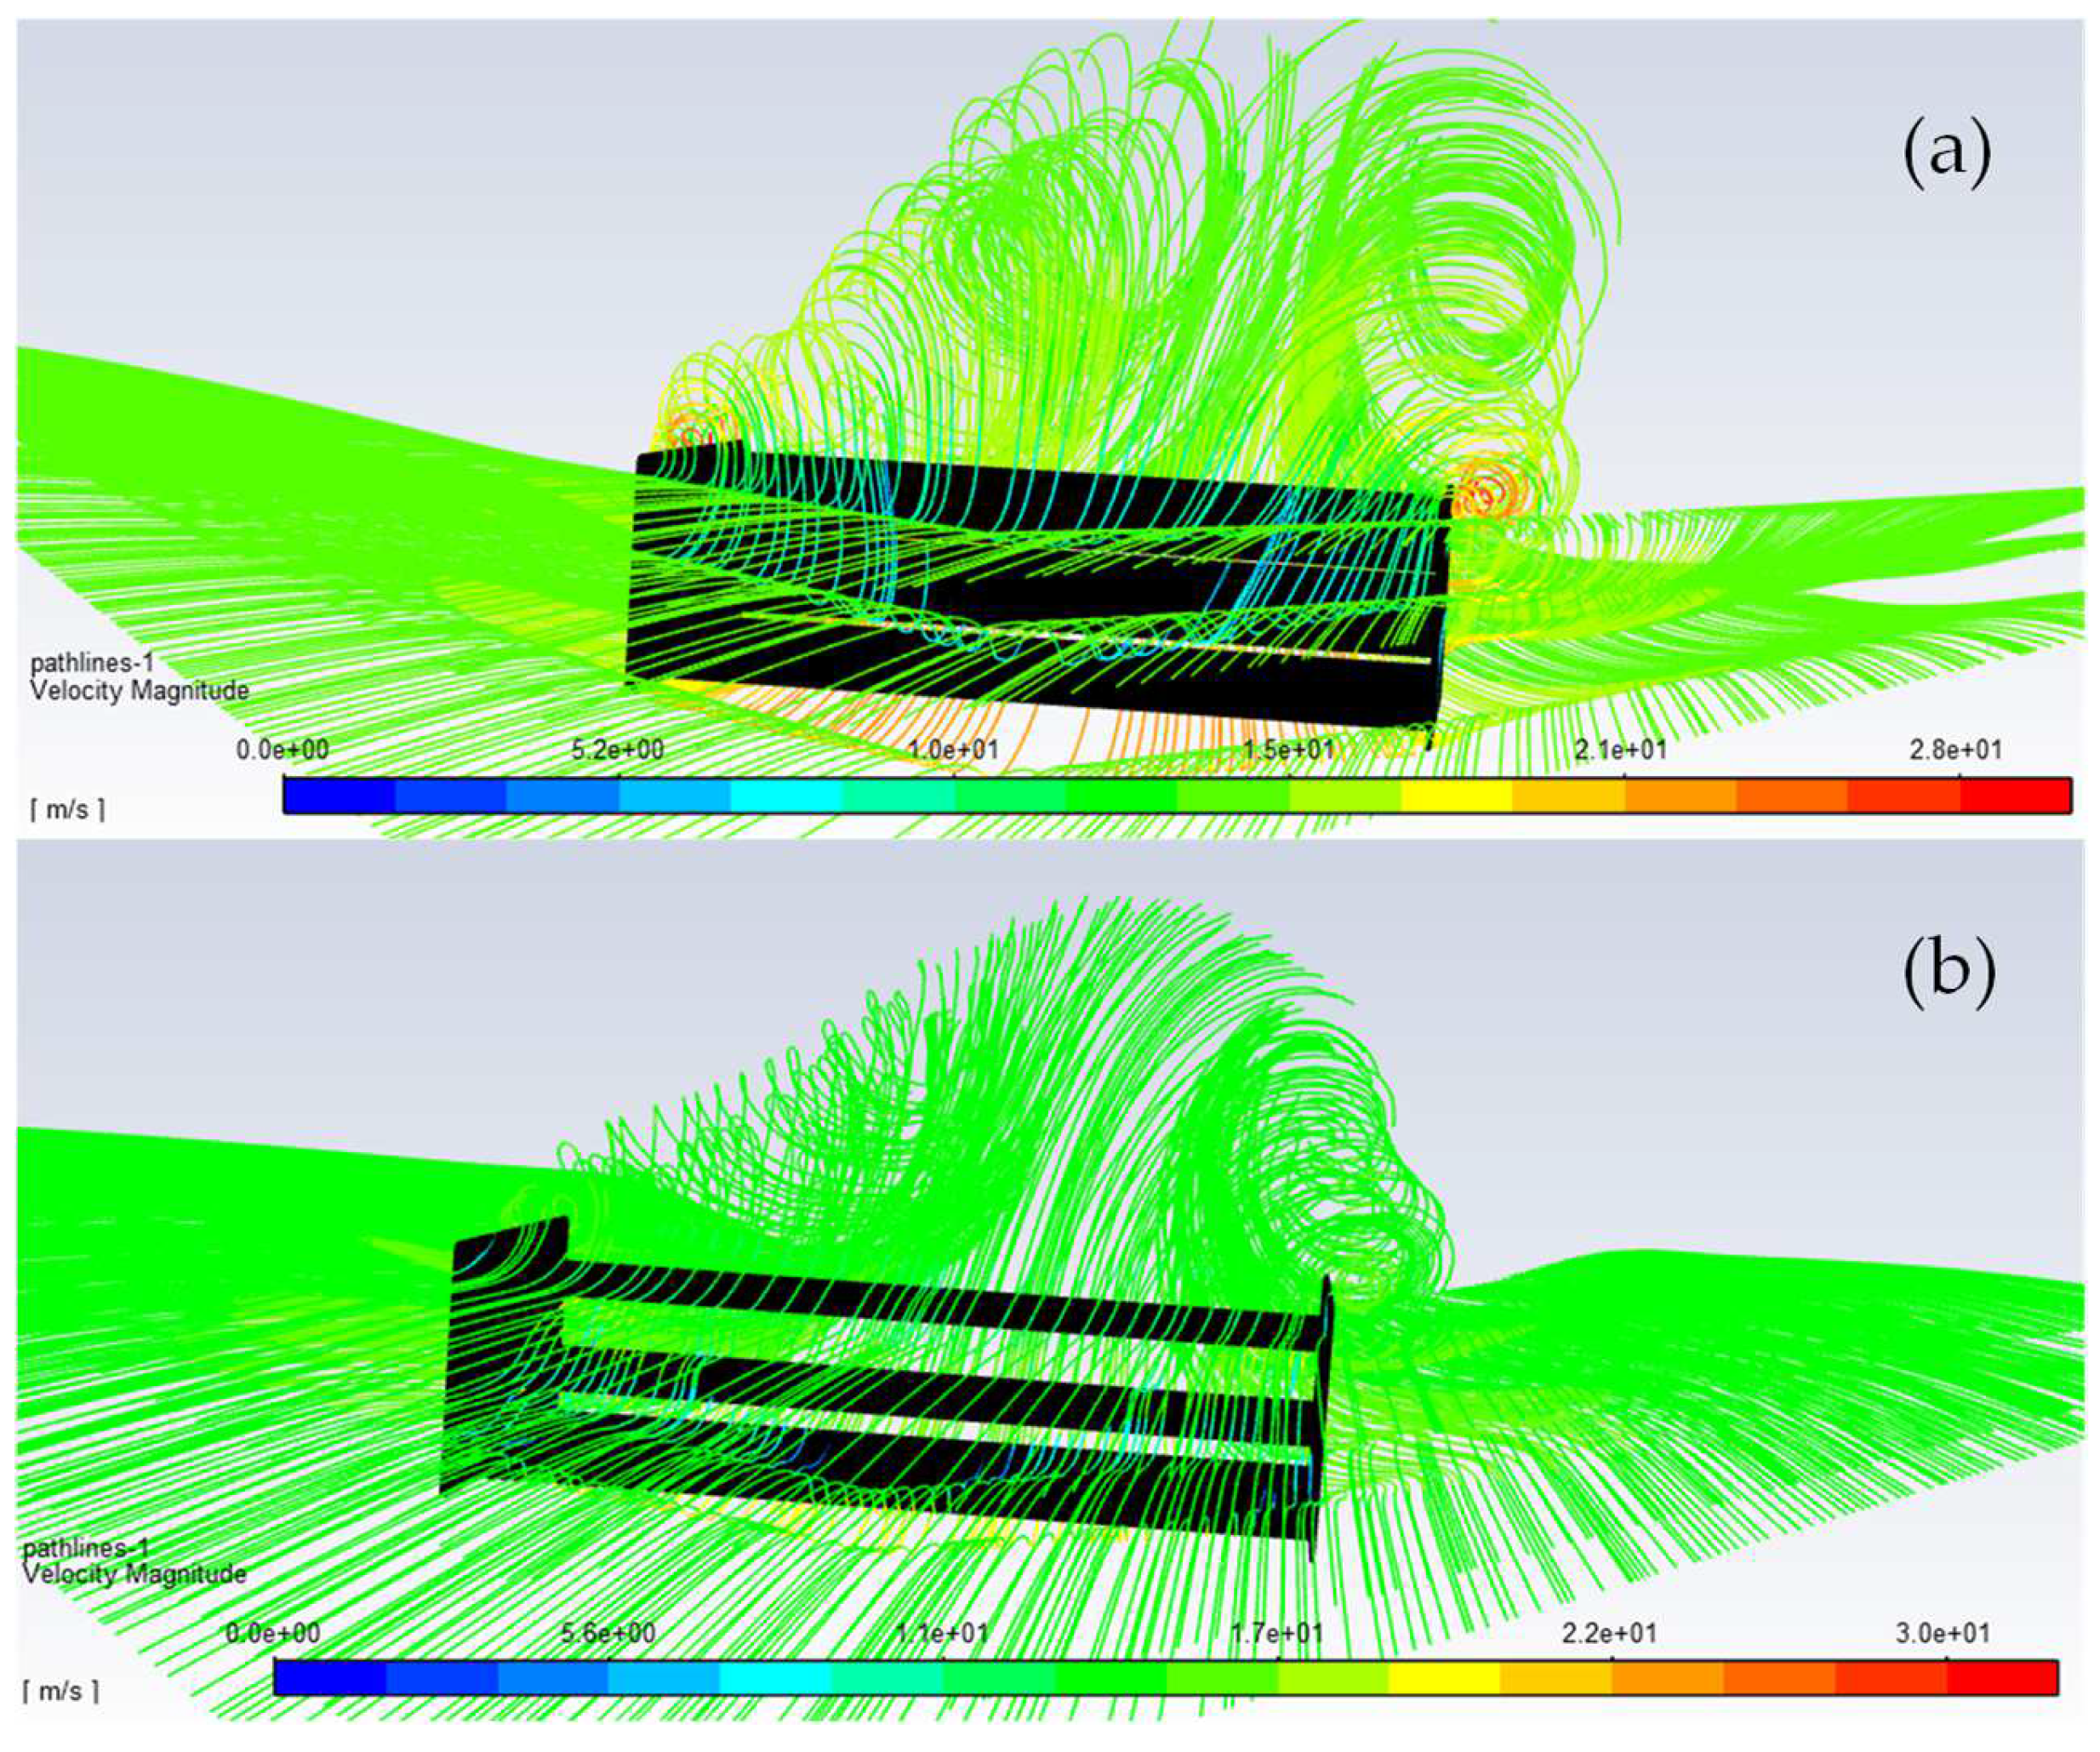
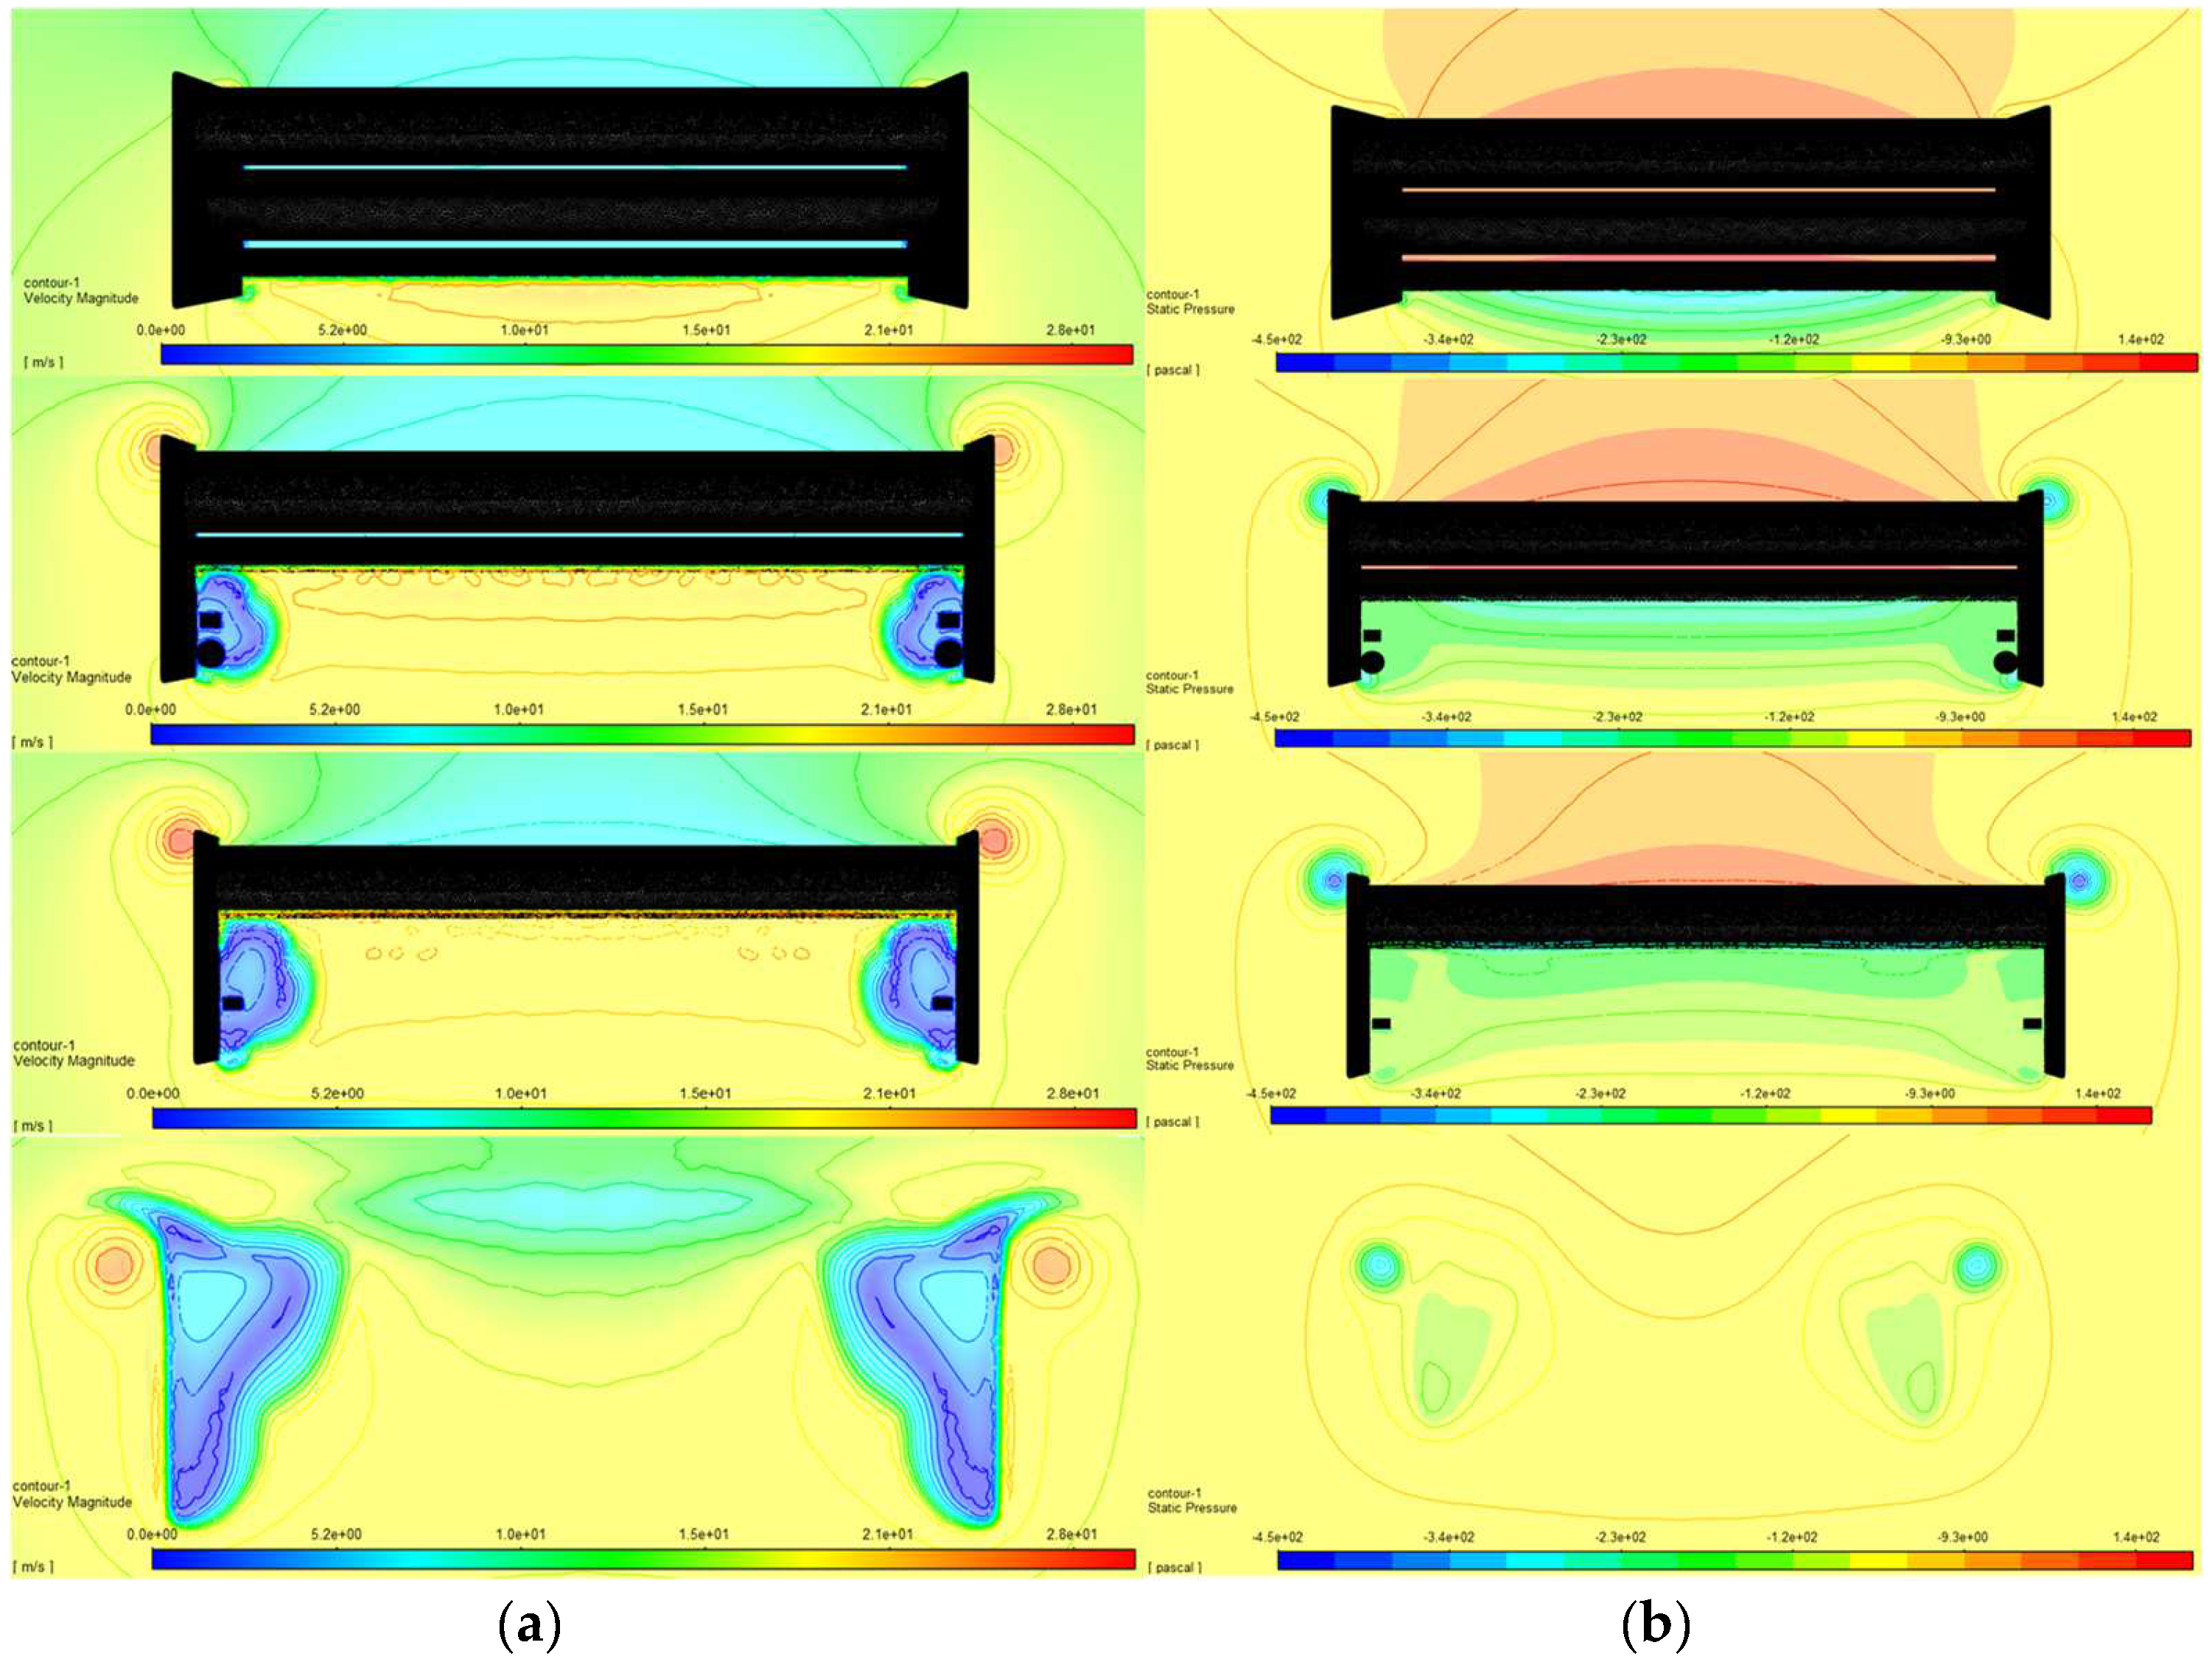
3.3. S1123 Multi-Element 3D Wing without Actuator
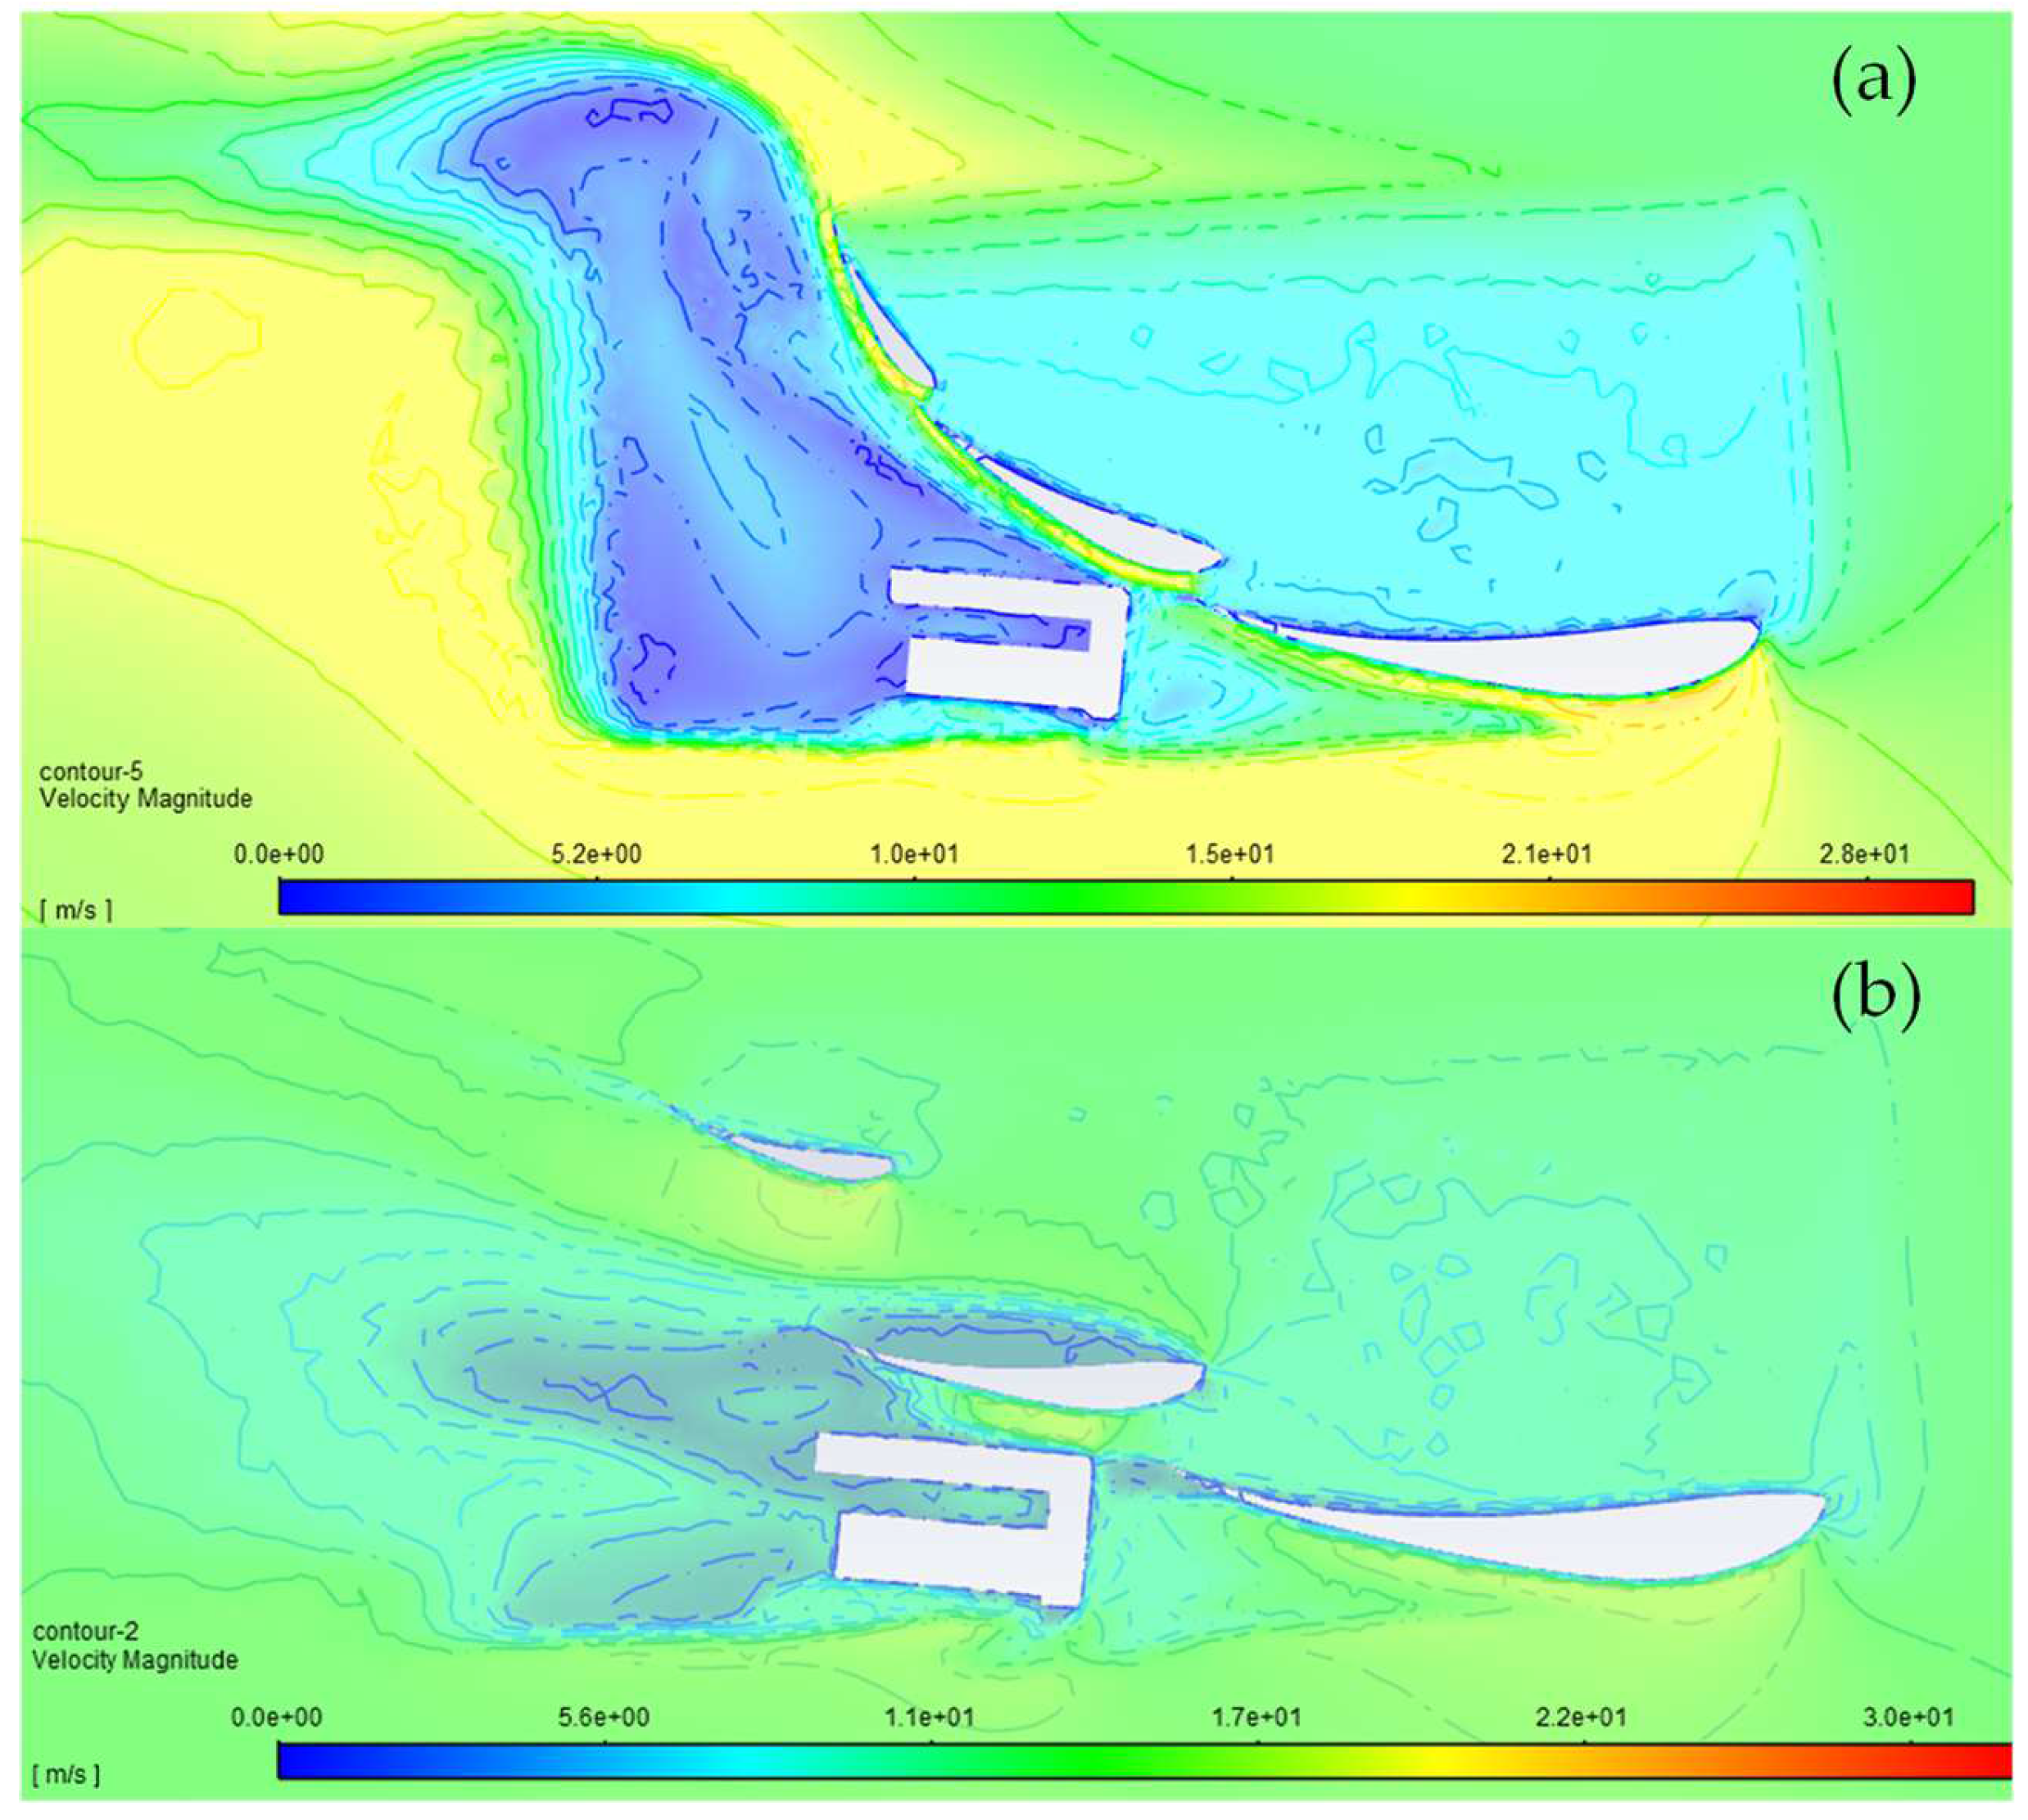
3.4. S1123 Multi-Element 3D Wing with Actuator
4. Discussion
Author Contributions
Funding
Institutional Review Board Statement
Informed Consent Statement
Data Availability Statement
Conflicts of Interest
References
- Bhatnagar, U.R. Formula 1 Race Car Performance Improvement By Optimization of the Aerodynamic Relationship Between the Front and Rear Wings. Master’s Thesis, The Pennsylvania State University, University Park, PA, USA, 2014. [Google Scholar]
- Wordley, S.; McArthur, D.; Phersson, L.; Tudball Smith, D.; Burton, D. Development of a Drag Reduction System (DRS) for Multi-Element Race Car Wings. In Proceedings of the 19th Australasian Fluid Mechanics Conference, AFMC 2014, Melbourne, Australia, 8–11 December 2014. [Google Scholar]
- Kajiwara, S. Passive Variable Rear-Wing Aerodynamics of an Open-Wheel Racing Car. Automot. Engine Technol. 2017, 2, 107–117. [Google Scholar] [CrossRef]
- Pakkam, S.S. High Downforce Aerodynamics for Motorsports. Master’s Thesis, North Carolina State University, Raleigh, NC, USA, 2011. [Google Scholar]
- Smith, A. High-Lift Aerodynamics /37th Wright Brothers Lecture/. In Proceedings of the 6th Aircraft Design, Flight Test and Operations Meeting, Los Angeles, CA, USA, 12–14 August 1974; Volume 12. [Google Scholar] [CrossRef]
- Tabatabaei, N.; Hajipour, M.; Mallor, F.; Örlü, R.; Vinuesa, R.; Schlatter, P. RANS Modelling of a NACA4412 Wake Using Wind Tunnel Measurements. Fluids 2022, 7, 153. [Google Scholar] [CrossRef]
- Mamouri, A.R.; Lakzian, E.; Khoshnevis, A.B. Entropy Analysis of Pitching Airfoil for Offshore Wind Turbines in the Dynamic Stall Condition. Ocean. Eng. 2019, 187, 106229. [Google Scholar] [CrossRef]
- Kratochvíl, M.; Astraverkhau, N.; Slanina, V. Wings Improving Driving Parameters. J. Middle Eur. Constr. Des. Cars 2015, 12, 1–8. [Google Scholar] [CrossRef]
- Muralidharan, V.; Balakrishnan, A.; Suresh Kumar, Y. Design Optimization of Front and Rear Aerodynamic Wings of a High Performance Race Car with Modified Airfoil Structure. In Proceedings of the 2015 International Conference on Nascent Technologies in the Engineering Field, ICNTE 2015, Navi Mumbai, India, 9–10 January 2015. [Google Scholar] [CrossRef]
- Aramayo, S.A.O.; Nallim, L.; Oller, S. Usability of the Selig S1223 Profile Airfoil as a High Lift Hydrofoil for Hydrokinetic Application. J. Appl. Fluid Mech. 2015, 9, 537–542. [Google Scholar]
- McBeath, S. Competition Car Aerodynamics: A Practical Handbook; Haynes Publishing: Sparkford, Somerset, 2006; ISBN 1844252302. [Google Scholar]
- SAE International. Formula SAE Rules 2019. Available online: https://www.google.com/url?sa=t&rct=j&q=&esrc=s&source=web&cd=&ved=2ahUKEwiJzcSpxZf6AhUGWBoKHYkhA3QQFnoECAcQAQ&url=https%3A%2F%2Fwww.fsaeonline.com%2Fcdsweb%2Fgen%2FDownloadDocument.aspx%3FDocumentID%3D64b861c2-980a-40fc-aa88-6a80c43a8540&usg=AOvVaw0x1l38EJ-pmZSwzNOTdTmS (accessed on 22 July 2022).
- Tecnopower Actuadores Lineales—Husillos de Bolas o Rosca Trapecial Motores C.C. Available online: https://www.tecnopower.es/catalogos?gclid=CjwKCAjwt7SWBhAnEiwAx8ZLap8N0ysBIuf_AFxk8lKOfZwHiSIPFp_K41MMt1VYtzaKm2dvmrH0IhoCXh8QAvD_BwE (accessed on 22 July 2022).
- Lanfrit, M. Best Practice Guidelines for Handling Automotive External Aerodynamics with Fluent. Fluent 2005, 2, 1–14. [Google Scholar]
- Wilcox, D.C. Turbulence Modeling for CFD; DCW Industries: La Canada, CA, USA, 1998; Volume 2. [Google Scholar]
- Langtry, R.B.; Menter, F.R. Correlation-Based Transition Modeling for Unstructured Parallelized Computational Fluid Dynamics Codes. AIAA J. 2009, 47, 12. [Google Scholar] [CrossRef]
- Aftab, S.M.A.; Rafie, A.S.M.; Razak, N.A.; Ahmad, K.A. Turbulence Model Selection for Low Reynolds Number Flows. PLoS ONE 2016, 11, e0153755. [Google Scholar] [CrossRef] [PubMed]
- Menter, F.R.; Langtry, R.B.; Likki, S.R.; Suzen, Y.B.; Huang, P.G.; Völker, S. A Correlation-Based Transition Model Using Local Variables—Part I: Model Formulation. J. Turbomach. 2006, 128, 413–422. [Google Scholar] [CrossRef]
- Liseikin, V.D. Grid Generation Methods; Springer: Dordrecht, The Netherlands, 2009; Volume 53, ISBN 9788578110796. [Google Scholar]
- Menter, F.R.; Smirnov, P.E.; Liu, T.; Avancha, R. A One-Equation Local Correlation-Based Transition Model. Flow Turbul. Combust. 2015, 95, 583–619. [Google Scholar] [CrossRef]
- Loução, R.A.M. Sistema DRS Para Um Carro de Competição Fórmula Student. Master’s Thesis, Instituto Superior de Engenharia de Lisboa, Lisbon, Portugal, 2021. [Google Scholar]


| Type of Flow | 3D Steady State Flow |
|---|---|
| Turbulence model | Transition SST |
| Turbulence intensity | 0.003% |
| Turbulent Viscosity Ratio | 1% |
| Inlet velocity | 14.7 m/s |
| Wall Treatment | Automatic wall treatment |
| Wall | Stationary wall, Specified Shear |
| Rear Wing Wall | Stationary wall, No slip |
| Angles of Attack (°) | Results | |||
|---|---|---|---|---|
| Mainplane | Flap 1 | Flap 2 | ||
| 4 | 28 | 60 | 3.4254 | 0.1223 |
| 4 | 29 | 60 | 2.0829 | 0.2873 |
| 4 | 30 | 60 | 2.0545 | 0.2835 |
| 4 | 28 | 65 | 3.3851 | 0.1384 |
| 5 | 30 | 60 | 3.2454 | 0.1446 |
| 5 | 30 | 65 | 3.2489 | 0.1594 |
| 5 | 32 | 60 | 3.2637 | 0.1556 |
Publisher’s Note: MDPI stays neutral with regard to jurisdictional claims in published maps and institutional affiliations. |
© 2022 by the authors. Licensee MDPI, Basel, Switzerland. This article is an open access article distributed under the terms and conditions of the Creative Commons Attribution (CC BY) license (https://creativecommons.org/licenses/by/4.0/).
Share and Cite
Loução, R.; Duarte, G.O.; Mendes, M.J.G.C. Aerodynamic Study of a Drag Reduction System and Its Actuation System for a Formula Student Competition Car. Fluids 2022, 7, 309. https://doi.org/10.3390/fluids7090309
Loução R, Duarte GO, Mendes MJGC. Aerodynamic Study of a Drag Reduction System and Its Actuation System for a Formula Student Competition Car. Fluids. 2022; 7(9):309. https://doi.org/10.3390/fluids7090309
Chicago/Turabian StyleLoução, Ricardo, Gonçalo O. Duarte, and Mário J. G. C. Mendes. 2022. "Aerodynamic Study of a Drag Reduction System and Its Actuation System for a Formula Student Competition Car" Fluids 7, no. 9: 309. https://doi.org/10.3390/fluids7090309
APA StyleLoução, R., Duarte, G. O., & Mendes, M. J. G. C. (2022). Aerodynamic Study of a Drag Reduction System and Its Actuation System for a Formula Student Competition Car. Fluids, 7(9), 309. https://doi.org/10.3390/fluids7090309