Article

An Experimental Investigation of Coherent Structures and Induced Noise Characteristics of the Partial Cavitating Flow on a Two-Dimensional Hydrofoil

1
Department of Naval Architecture and Ocean Engineering, Chungnam National University, Daejeon 34134, Korea
2
Korea Research Institute of Ship and Ocean Engineering, Dae-jeon 305-343, Korea
*
Author to whom correspondence should be addressed.
Fluids 2020, 5(4), 198; https://doi.org/10.3390/fluids5040198
Submission received: 12 October 2020 / Revised: 30 October 2020 / Accepted: 30 October 2020 / Published: 3 November 2020
(This article belongs to the Special Issue Cavitating Flows)

Abstract

:
In many practical submerged objects, various types of cavitation such as bubble, sheet, and cloud cavitation occur according to flow conditions. In spite of numerous theoretical, numerical, and experimental studies, there are still many problems to be solved such as induced noise and damage potential due to cavitation. In this paper, an experimental investigation on coherent structures and induced noise characteristics of partial cavitation on a two-dimensional hydrofoil is presented. Experiments that focused on the dynamics of cavitation clouds were conducted in a cavitation tunnel. Using high-speed visualization, the series process consisting of inception, growth, and desinence of the partial cavity was investigated. The noise generated during the process was also measured, and the correlation with the cavity pattern was examined. The results show that the periodic behavior of cavitation clouds is directly reflected in the noise characteristics. In addition, the visualization of coherent structures within the sheet and cloud cavity provides a qualitative understanding of hairpin vortices and their packets, which play a dominant role in turbulent cavitating flows.

1. Introduction

Cavitation occurs irresistibly on the low-pressure surfaces of submerged bodies such as hydrofoils, marine propellers, and turbomachinery blades. Hydrodynamic cavitation takes different forms as it develops from inception, and the patterns can be divided into three types of cavities: bubble cavity, partial cavity (including sheet and cloud), and vortex cavity at the tip of three-dimensional foil. Bubble cavity appears in the low-pressure region as a result of the rapid growth of air nuclei dissolved in the liquid at a relatively low angle of attack. Partial cavity is an intermediate stage of development of cavitation. For large values of the cavitation number, thin and stable sheet cavity appears. As the cavitation number decreases further, sheet cavitation becomes longer and begins to shed cloud cavitation, which is periodically pulsating and causes a great deal of noise and vibration, damage to the surface, and a loss of efficiency of the object. For this reason, sheet and cloud cavitation have been major concerns, and many studies have been conducted to figure out related problems, namely the physical process of cavitation inception, the structural process of cavity formations, and the hydrodynamics and acoustics involved in the production and collapse of partial cavitation. However, a complete explanation for the correlation between coherent structures and induced noise does not yet exist. Many theoretical and experimental studies have been done in two areas: one is to find physical aspects of the phenomenon, the other to estimate its harmful effects on industrial systems. In many practical hydraulic machines, cavitation damage is observed to occur in local areas of the submerged foil. Often this is the result of the periodic and coherent collapse of cloud of cavitation bubbles. Arndt [1] reviewed numerical and experimental investigations carried out at different facilities and explained that the reentrant jet dominates the oscillation period and a constant Strouhal number based on a cavity length of about 0.3 for cavity lengths less than about 0.75. He also pointed out different cavitation behaviors attributed to system instabilities, difference in gas content, and surface roughness of the foil. The physical mechanism of the cavity inception is quite complex and somewhat different on scale models and full scale of submerged objects [2,3,4], and also in microsystems [5,6,7,8]. Research has identified the critical velocity for which a sudden change in the desinent cavitation number occurs as an effect of a passing from long to short laminar separation bubbles [9]. After the initial stage of cavitation development, the most common form of partial cavitation is sheet cavitation. Many experimental studies examined the physical process of the sheet cavity and revealed that the development of sheet cavitation results from the laminar separation and depends on the type of the separation bubble [10,11]. One of the important issues of study is on the closure region of the sheet cavity. Many experiments focused on the cavity detachment and cloud cavitation along sheet cavitation [12,13,14,15]. As the minimum pressure occurs inside the cavity, the curvature of the streamlines tends to be directed towards the cavity, and the reentrant jet travels upstream, carrying water flow to the inside the cavity. The jet striking the front of the cavity interface leads to the separation of part the cavity, which is shedding periodically in to the wake [16]. This process was confirmed by measurements using electrical impedance probes and double optical probes [17,18,19]. These experiments have shown that the periodic motion of the cavity is strongly related with the progress of the reentrant jet flow, but the development of the jet flow has not been clarified and is still controversial [20,21]. As a result, this periodic motion of the sheet and cloud cavitation, that is, the periodic pressure fluctuation, is reflected in the induced noise. Blake et al. [22] have shown the acoustic characteristics appearing simultaneously with the hydrodynamic behavior of hydrofoil cavitation. However, measurements of noise induced by unsteady cavitation on hydrofoils are still difficult because of acoustic absorption and reverberation of the test facility.
In this study, partial cavities occurring on a two-dimensional hydrofoil are investigated according to different flow conditions. Using a high-speed camera, inception of cavitation and specific behaviors during the growth process are carefully recorded and analyzed. First, the length of the cavity appearing according to the change of the angle of attack is measured. In the next section, typical features of partial cavities are examined. In particular, observations on the occurrence and collapse of bubble cavitation are included. Next, unsteady behaviors of the sheet and cloud cavity, which are important achievements of this study, are investigated in detail based on a high-speed image analysis. The process of cavity evolution during one period of oscillation is clearly demonstrated and the shedding frequency of the cloud cavity is measured. In addition, the formation of hairpin vortices, coherent structure of cloud cavitating flow is investigated. Finally, we show that cloud cavitation consists of characteristic structures and that its macroscopic behaviors cause pressure fluctuations at a specific frequency reflected in the induced noise.

2. Experimental Apparatus and Test Setup

Experiments were conducted at a cavitation tunnel of the Chungnam National University. Figure 1 shows the dimension of the tunnel and experimental setup. The test section has a 100 mm × 100 mm square shape and a 1400 mm length. The contraction ratio is 15, and the maximum flow speed is 20 m/s. The flow speed was obtained from the pressure difference measured at the contraction using absolute pressure sensors (ETM-200-375M, Kulite Semiconductor, Inc., Leonia, NJ, USA) and calibrated with an LDV (Laser Doppler Velocimetry, FlowExplorer, Dantec Dynamics, Skovlunde, Denmark) measurement at the test section center, which is 0.1% less error. The absolute pressure inside the tunnel can be increased up to 3 bar and also decreased to 0.1 bar to achieve a desired test condition. A two-dimensional NACA0012 hydrofoil made of aluminum was used for this study. Its chord and span length was 100 mm, and the foil surface was anodized with a roughness level of about 1.0   μ m . An angle of attack of the foil ( α ) was changed from 0° to 11° with 2° intervals. The entire process of cavitation inception and development of partial cavities was recorded using a high-speed camera (FASTCAM UX100, Photron Inc., Tokyo, Japan). The cavity length and the periodic oscillation were examined using high-speed images recorded at over 10,000 frames per second. Pressure fluctuations generated during the development of cavitation were measured using a flush-mounted pressure transducer (XTM-190M, Kulite Semiconductor, Inc., Leonia, NJ, USA) on the top of the observation window. Time-domain data of pressure fluctuations were converted into the frequency domain, and the oscillation frequency of quasi-steady and unsteady cavitation was evaluated.
Two signals from the high-speed visualization and pressure fluctuation measurement were synchronized to examine the correlations, i.e., the cavity development process and the periodic characteristics. The sound pressure level induced during the generation and collapse process of the partial cavities was evaluated. Test conditions were represented by the cavitation number and also the Reynolds number defined as follows, respectively:
σ = P P v 1 2 ρ U 2
R e = U C ν
where P and U are the freestream pressure and velocity; Pv, ρ, and ν are the vapor pressure, density and kinematic viscosity of the liquid, respectively, while C is the chord length of the foil.

3. Results and Discussion
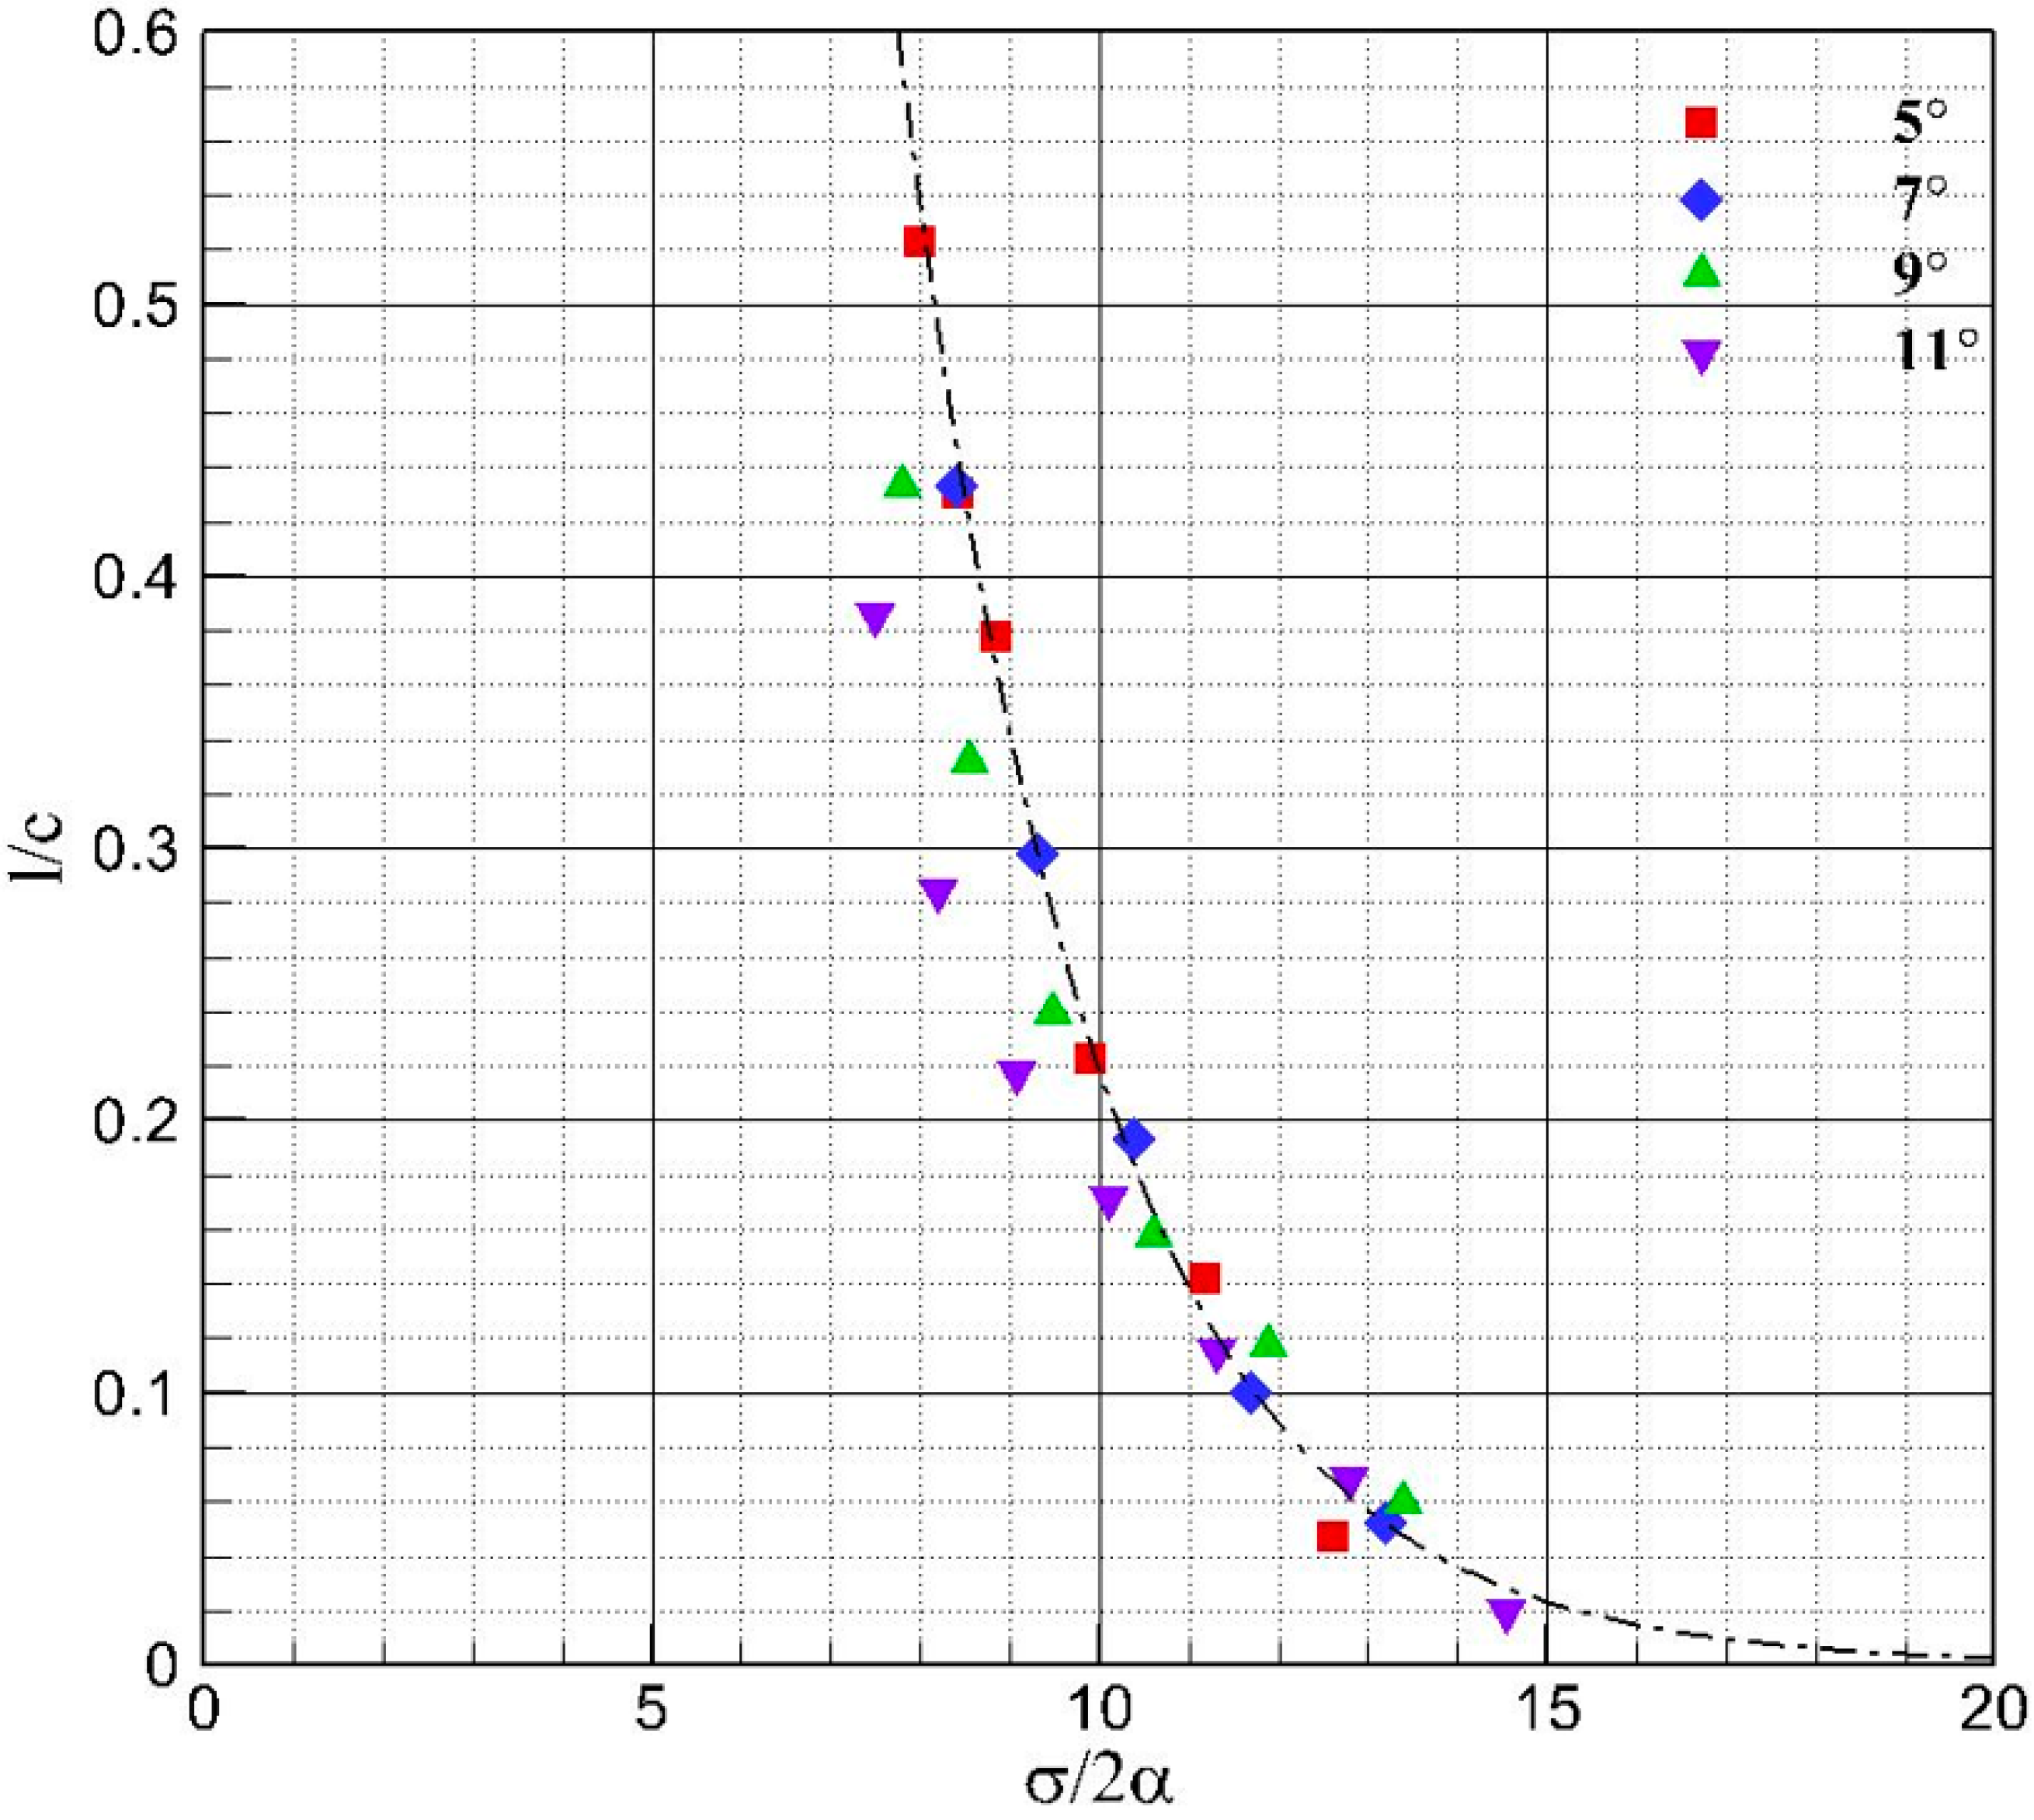
3.1. Cavity Length

Figure 2 shows the cavity length versus the cavitation number for different angles of attacks. Here, the length (l) was obtained by measuring the high-speed image and then nondimensionalized by the chord length of the foil (c). At the same cavitation number, cavity lengths are proportional to the angle of attack; the length increases at a constant rate as the angle of attack increase. Figure 3 shows the universal curve replotted using the parameter, σ/2α, and it gives a good correlation between the cavitation number and the angle of attack.

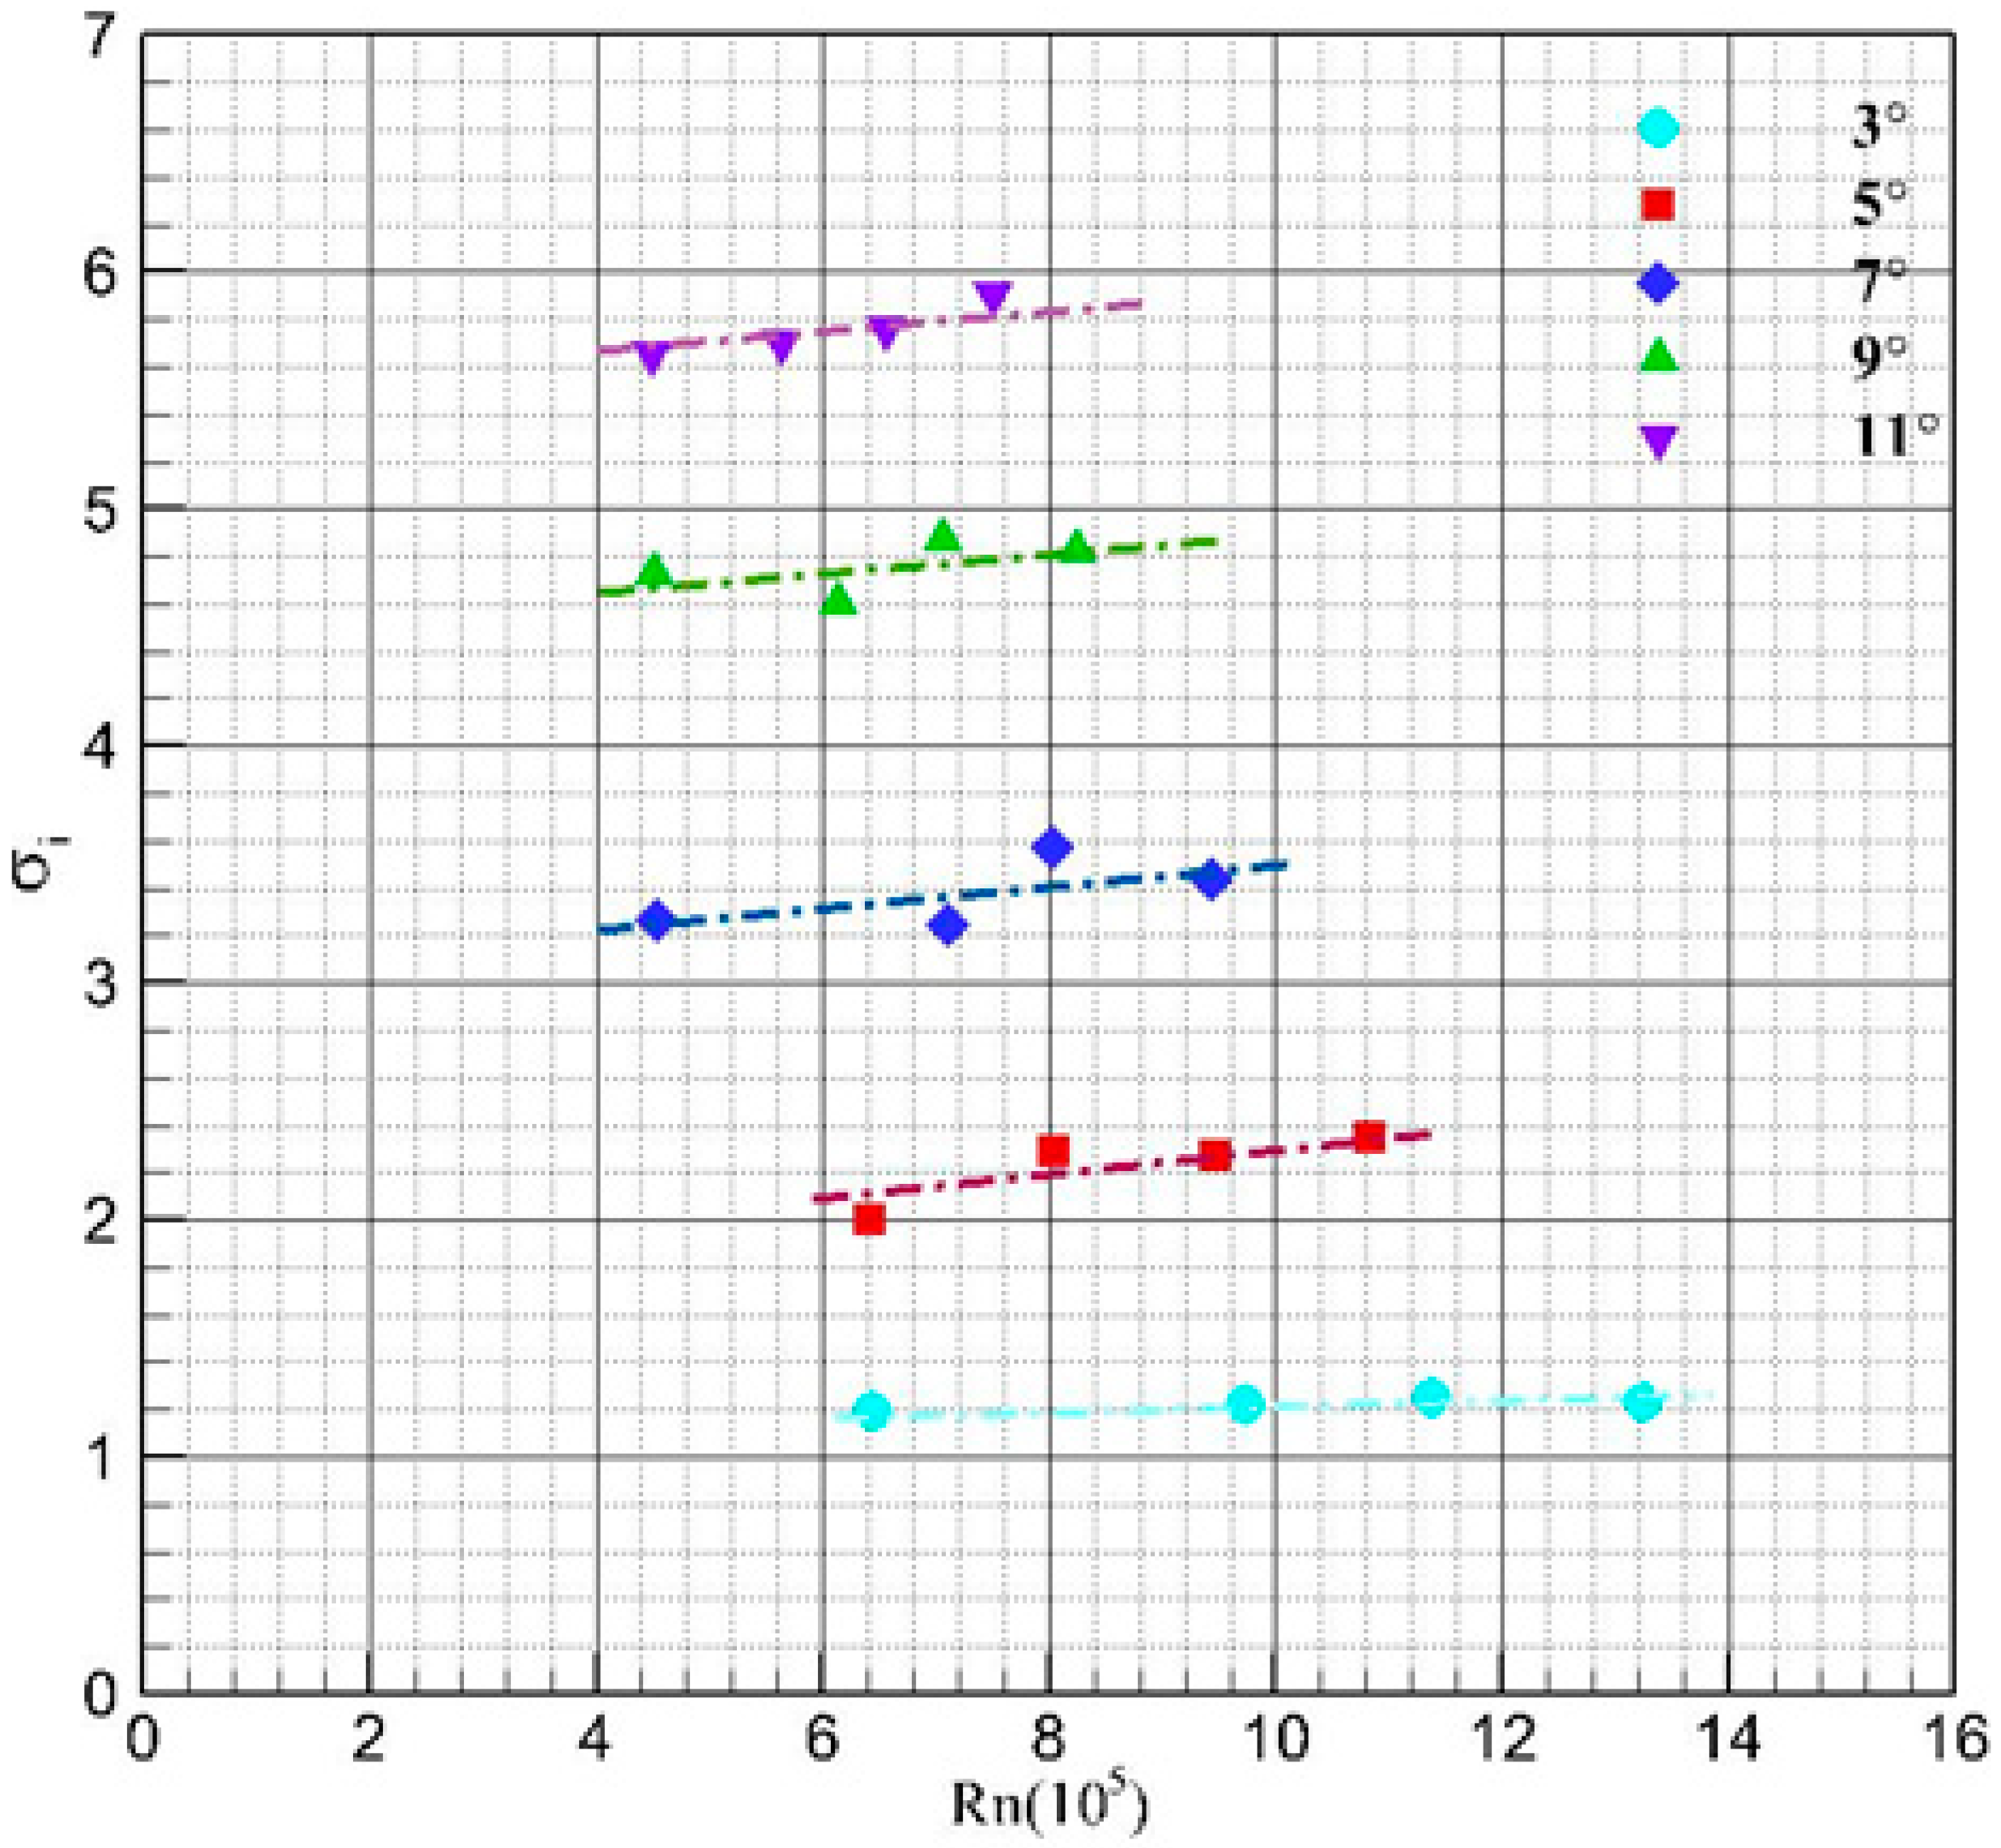
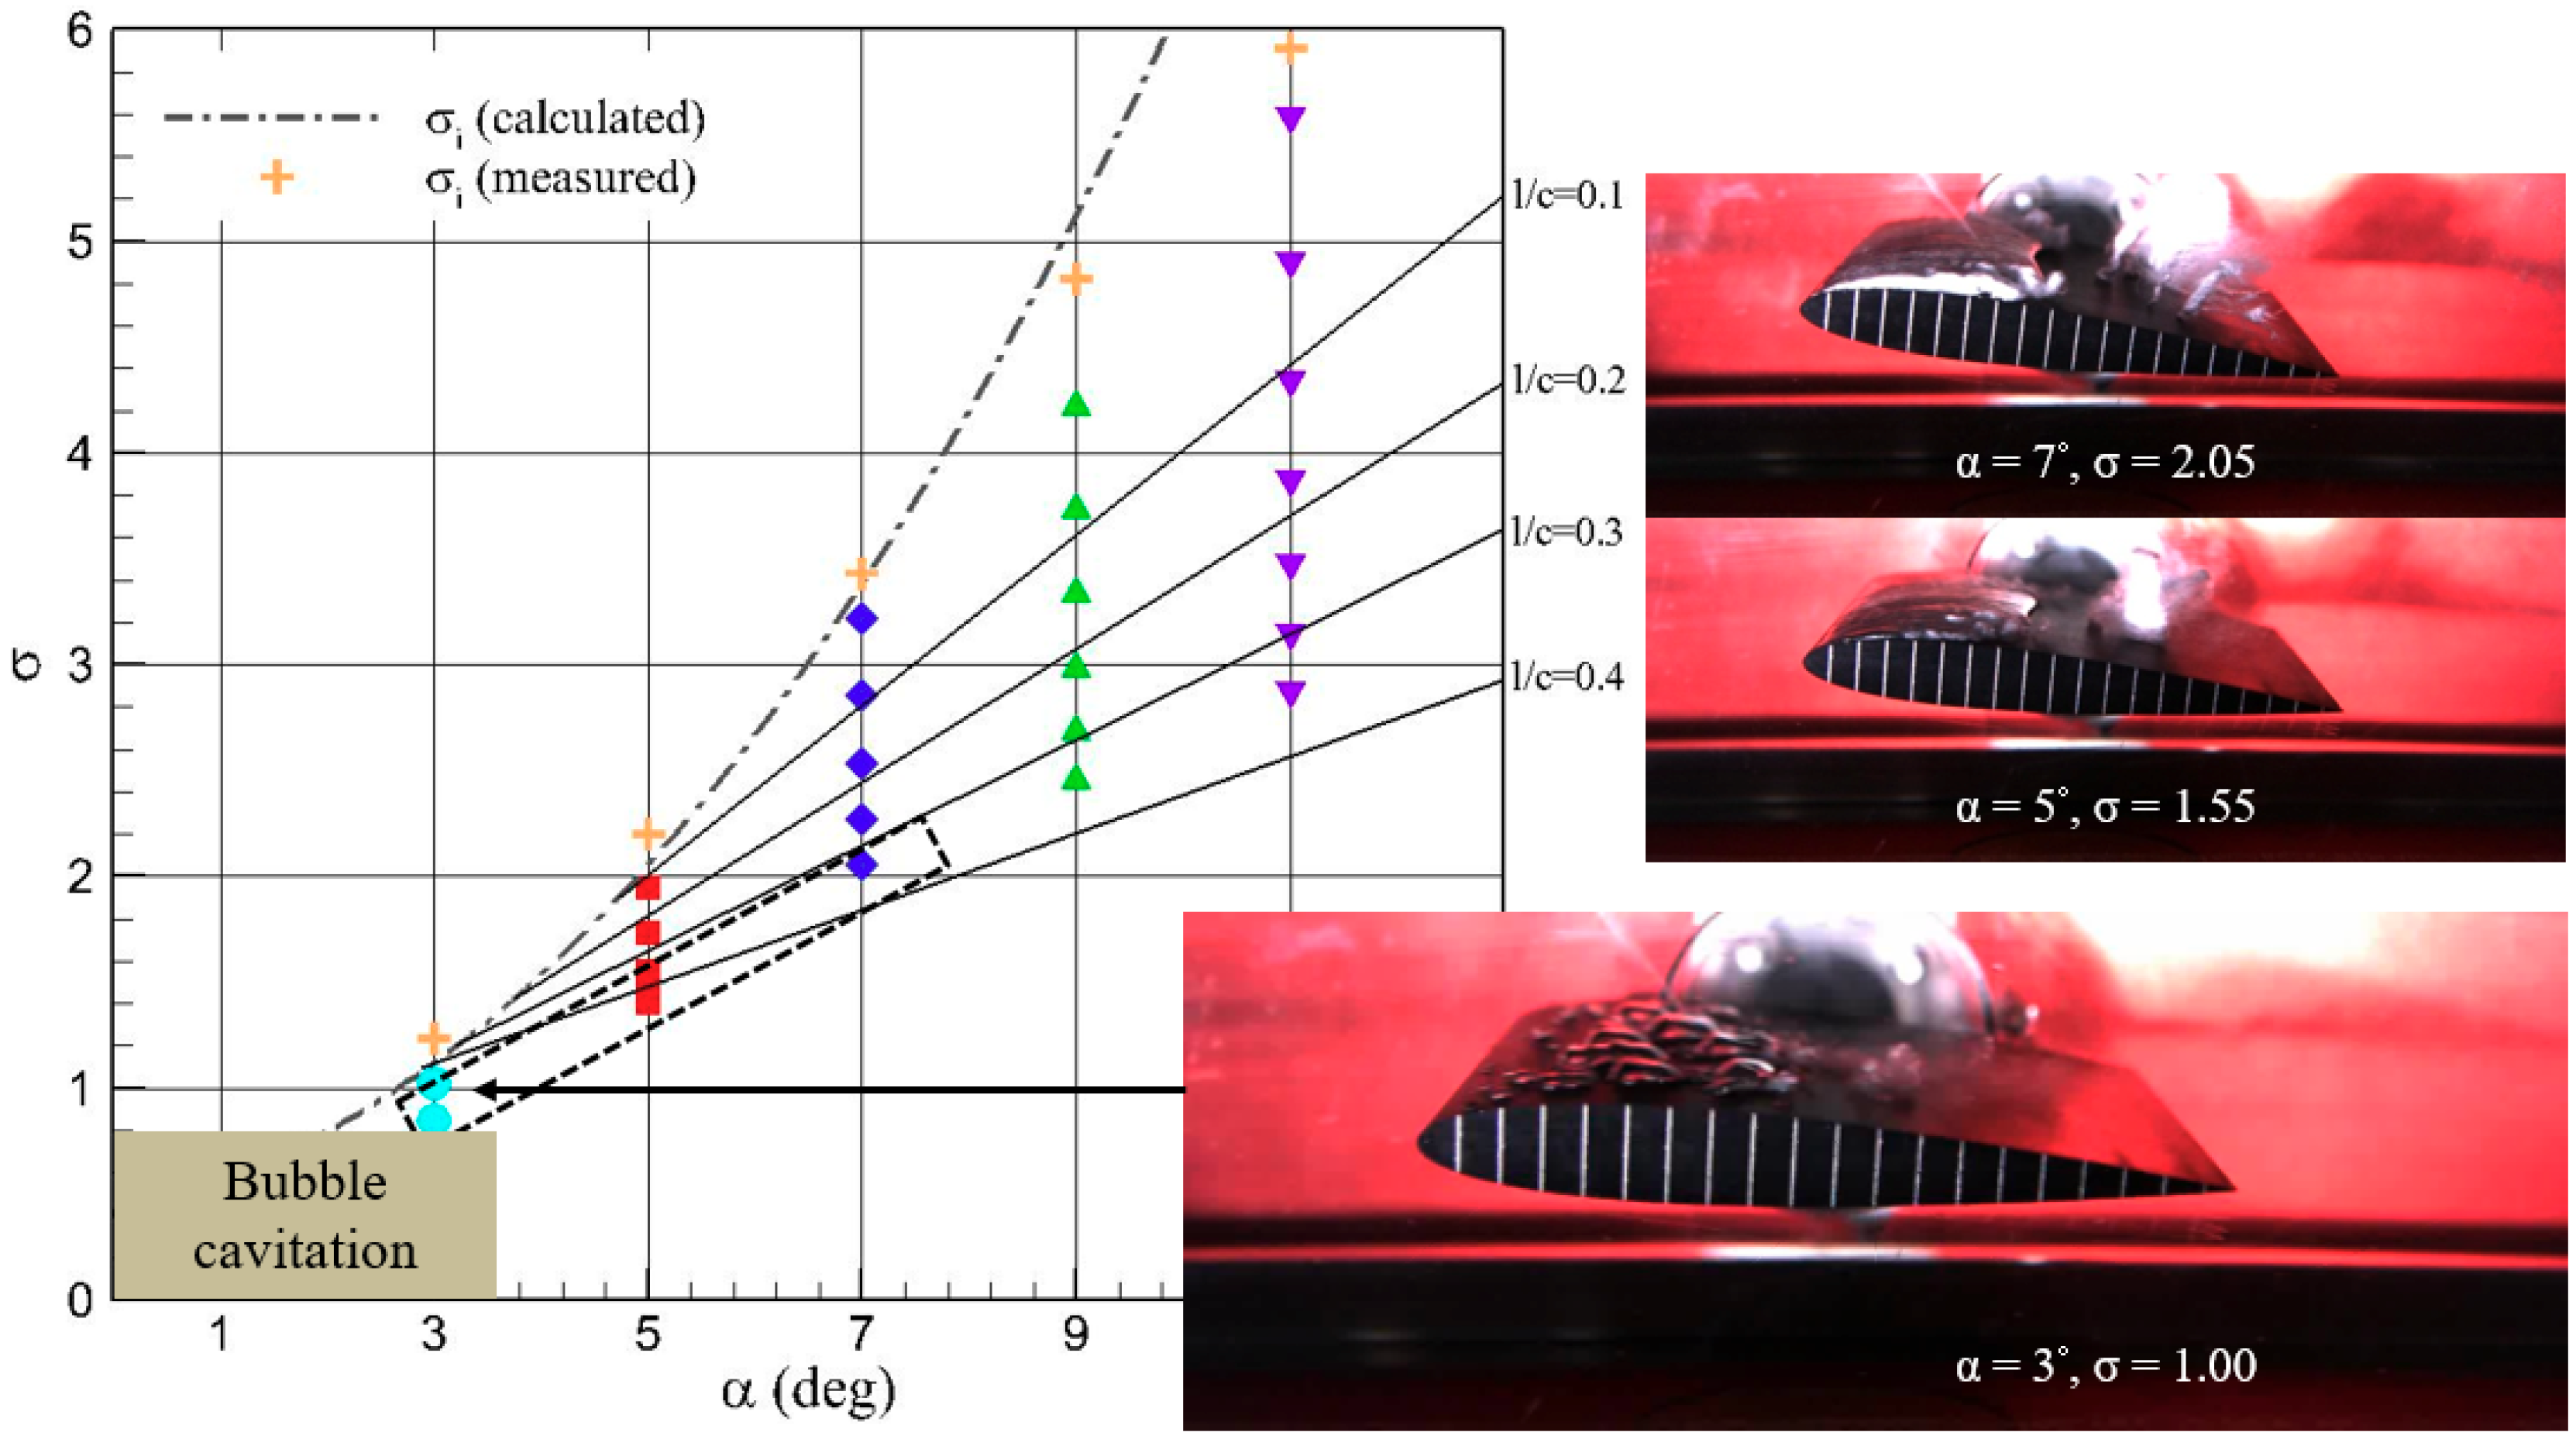
3.2. Cavity Inception and Patterns

In general, cavitation is assumed to occur as the minimum pressure (Pm) in a flow is equal to the vapor pressure of the liquid (Pv). The nondimensional minimum pressure coefficient (Cpm) can be taken for the value of the cavitation inception number (σi):
C p m = P m P v 1 2 ρ U 2
σ i = C p m
The pressure at the laminar separation point is equal to the vapor pressure, and the cavitation inception number is equal in magnitude to the pressure coefficient at this point. However, there is a delay in cavitation inception at the minimum pressure point because the additional pressure decrease is needed for the pressure at the laminar separation point to reach the vapor pressure. In other words, the value of σi is slightly smaller than the value of −Cpm. Figure 4 shows the results of the cavitation inception number versus the Reynolds number according to different incidence angles. The boundary layer develops on the suction side of the foil. As the angle of attack increases, an adverse pressure gradient becomes stronger, and the cavity develops earlier. However, at low angles of attack, the position of laminar separation does not depend on the Reynolds number. Figure 5 shows cavity patterns according to the angle of attack and the cavitation number. Here, a potential-based panel method was used to calculate the minimum pressure coefficient and predict the cavitation inception number. Good agreement is found between calculation and measurement in cases of relatively low angle of attacks. As the cavitation number decreases, the cavity length increases in proportion to the angle of attack; for example, in the case of the angle of attack of 7 degrees, a leading edge cavity appears first. As the cavitation number is further decreased, the sheet cavity evolves and grows into cloud cavitation. This behavior is analyzed in more detail in the next section. Figure 6 shows the region of periodically pulsating cloud cavitation, which appears when the cavity length is larger than about 10% of the length of the chord. Cavitation patterns strongly depend on water quality, and bubble cavitation occurs at a relatively low angle of attack due to the growth of nuclei in low pressure regions as shown in Figure 7. Bubbles generated near the leading edge collapse at the mid-chord regions where the pressure recovers. Bubble development is directly connected to the pressure distribution and the minimum pressure, and the pressure inside the bubble is equal to the vapor pressure.
Figure 8 shows the chronological sequence in which bubble cavities form, grow to the maximum size, and finally collapse. These images were recorded for 0.0028 s at 10,000 frames per second. An initially spherical bubble follows a streamline at the local speed and grows along the wall until the pressure reaches the lowest point; here, it is about 25% of the chord length from the leading edge. After that, the bubble becomes smaller again according to the adverse pressure gradient. Plesset and Cahpman [23] computed the behavioral characteristics of the spherical bubble for various distances from the wall. During the collapse process, an interface of the cavity near the wall tends to flatten while a hollow develops on the opposite face with a change in curvature under very high pressure. Then, the reentrant jet develops with a rapidly increasing velocity and pierces the bubble and strikes the wall with a strong impact resulting in surface erosion.

3.3. Periodic Behavior of the Sheet and Cloud Cavity

When there is a large value of the incident angle and a small value of the cavitation number conditions, the cavity is thick and long and becomes unstable. The cavity length varies depending on the occurrence of the reentrant jet and periodic shedding of the cavity. The state of periodic oscillation is commonly referred to as cloud cavitation. Figure 9 shows a schematic view of the sheet and cloud cavity evolution during one period, and high speed observation results at α = 7°, σ = 2.05. Initially, the sheet cavity grows until the pressure inside the cavity is minimal. At the end of the cavity, the streamline tends to be directed towards the leading edge, and a strong adverse pressure gradient is favorable to the development of the reentrant jet. The reentrant jet travels upstream and reaches the front of the sheet cavity. Consequently, the jet strikes the front part of the sheet cavity and separate the cavity, which is entrained by incoming water flow. At the instant of shedding, separated flow develops into a spanwise vortex and grows into a circular shape moving downstream, and finally breaks into various sizes of vortex filaments. Meanwhile, a new sheet cavity grows from the leading edge, and a new reentrant jet develops again. In this cloud cavity regime, the cavity thickness is larger than that of the reentrant jet so that the jet travels to the front of the sheet cavity without breaking. The relation between the frequency (f) of the shedding flow and the reentrant jet covering the cavity length (l) be identified by the Strouhal number (St):
S t = f l U
It is well known that the Strouhal number of a submerged body is about 0.20–0.35. According to observations, it takes about one third of the periodic time for the reentrant jet to reach the front part of the sheet cavity, that is, the rise time of the reentrant jet is about 35% of the shedding period. The reentrant jet generates the shedding vortex traveling with incoming flow speed. Using a simple relation, the production rate of the spanwise vortex (Γ) can be estimated:
Γ T = 2 l U T = 2 S t U 2
Figure 10 shows the Strouhal number for all test cases, which is distributed around the value of 0.35. Here, the cavity length was measured using high-speed images recorded at 10,000 frames per second. Therefore, the value of 2 St of Equation (6) is about 0.7.

3.4. Coherent Structures in Wall-Bounded Cloud Cavitating Flow

As described in previous section, periodically pulsating cloud cavity occurs in the regime where the cavity thickness must be larger than the reentrant jet thickness. It is clear that the stronger the adverse pressure gradient of the wall, the stronger the reentrant jet occurs. In the case of a large value of the angle of attack, the pressure gradient changes rapidly, and short cloud cavity oscillating quickly occurs. Figure 11a shows a schematic view of the evolution of the hairpin vortex in turbulent cavitating flow. Notable progress has been made over the last decades in understanding the physical processes involved in structures of the turbulent boundary layers. Essential understanding of wall-bounded turbulent flow is still needed, but average quantities such as mean velocity profile, wall shear stress and large scale behavior can be used to find out flow structures. Probably the most widespread model for turbulent structure is the hairpin vortex model, which was originally proposed by Theodorsen [24]. This model was of horseshoe vortices growing outwards from the wall with heads inclined downstream at a 45 degree and spanwise dimensions proportional to the distance from the wall. Due to the wall-normal velocity gradient which is different in the spanwise direction, hairpins arise from the boundary in a regular sequence and each hairpin produces favorable conditions to generate further hairpins [25]. Vortex becomes more elongated in the streamwise direction and then tends towards becoming a hairpin vortex. The tip of the loop moves away from the wall due to self-induction, entering regions of increasing velocity. Vorticity increases due to increased stretching and causes outward flow between the legs of the vortex, causing local deceleration of fluid between the vortex and wall. The attached-eddy model was extended to incorporate a packet of Π-shaped eddies. This procedure improved the results of the attached-eddy model by more accurately producing the streamwise elongation of the two-point spatial correlation found in experiments. Figure 11b shows the case (α = 11°, σ = 2.88) where a large scale hairpin vortex occurs and grows in the wake direction and then disappears. This sequential process was taken from high-speed images recorded at 10,000 frames per second. Hairpin vortices are coherently aligned in the streamwise direction inside the cloud cavity, with their heads in a distinct line inclining away from the wall at some angle, creating a larger-scale coherent motion called the hairpin vortex packet. The primary vortex is formed and stretched by the velocity gradient and grows continuously. The secondary hairpin grows by the same mechanism and the process repeats. Apparently the primary hairpin is also capable of creating a hairpin downstream. Observed results clearly show that the hairpin vortices are dominant and are a robust feature of wall-bounded turbulent flow. Cloud cavitating flow fields, although they may seem very complex and random, have very orderly and systematic characteristics.

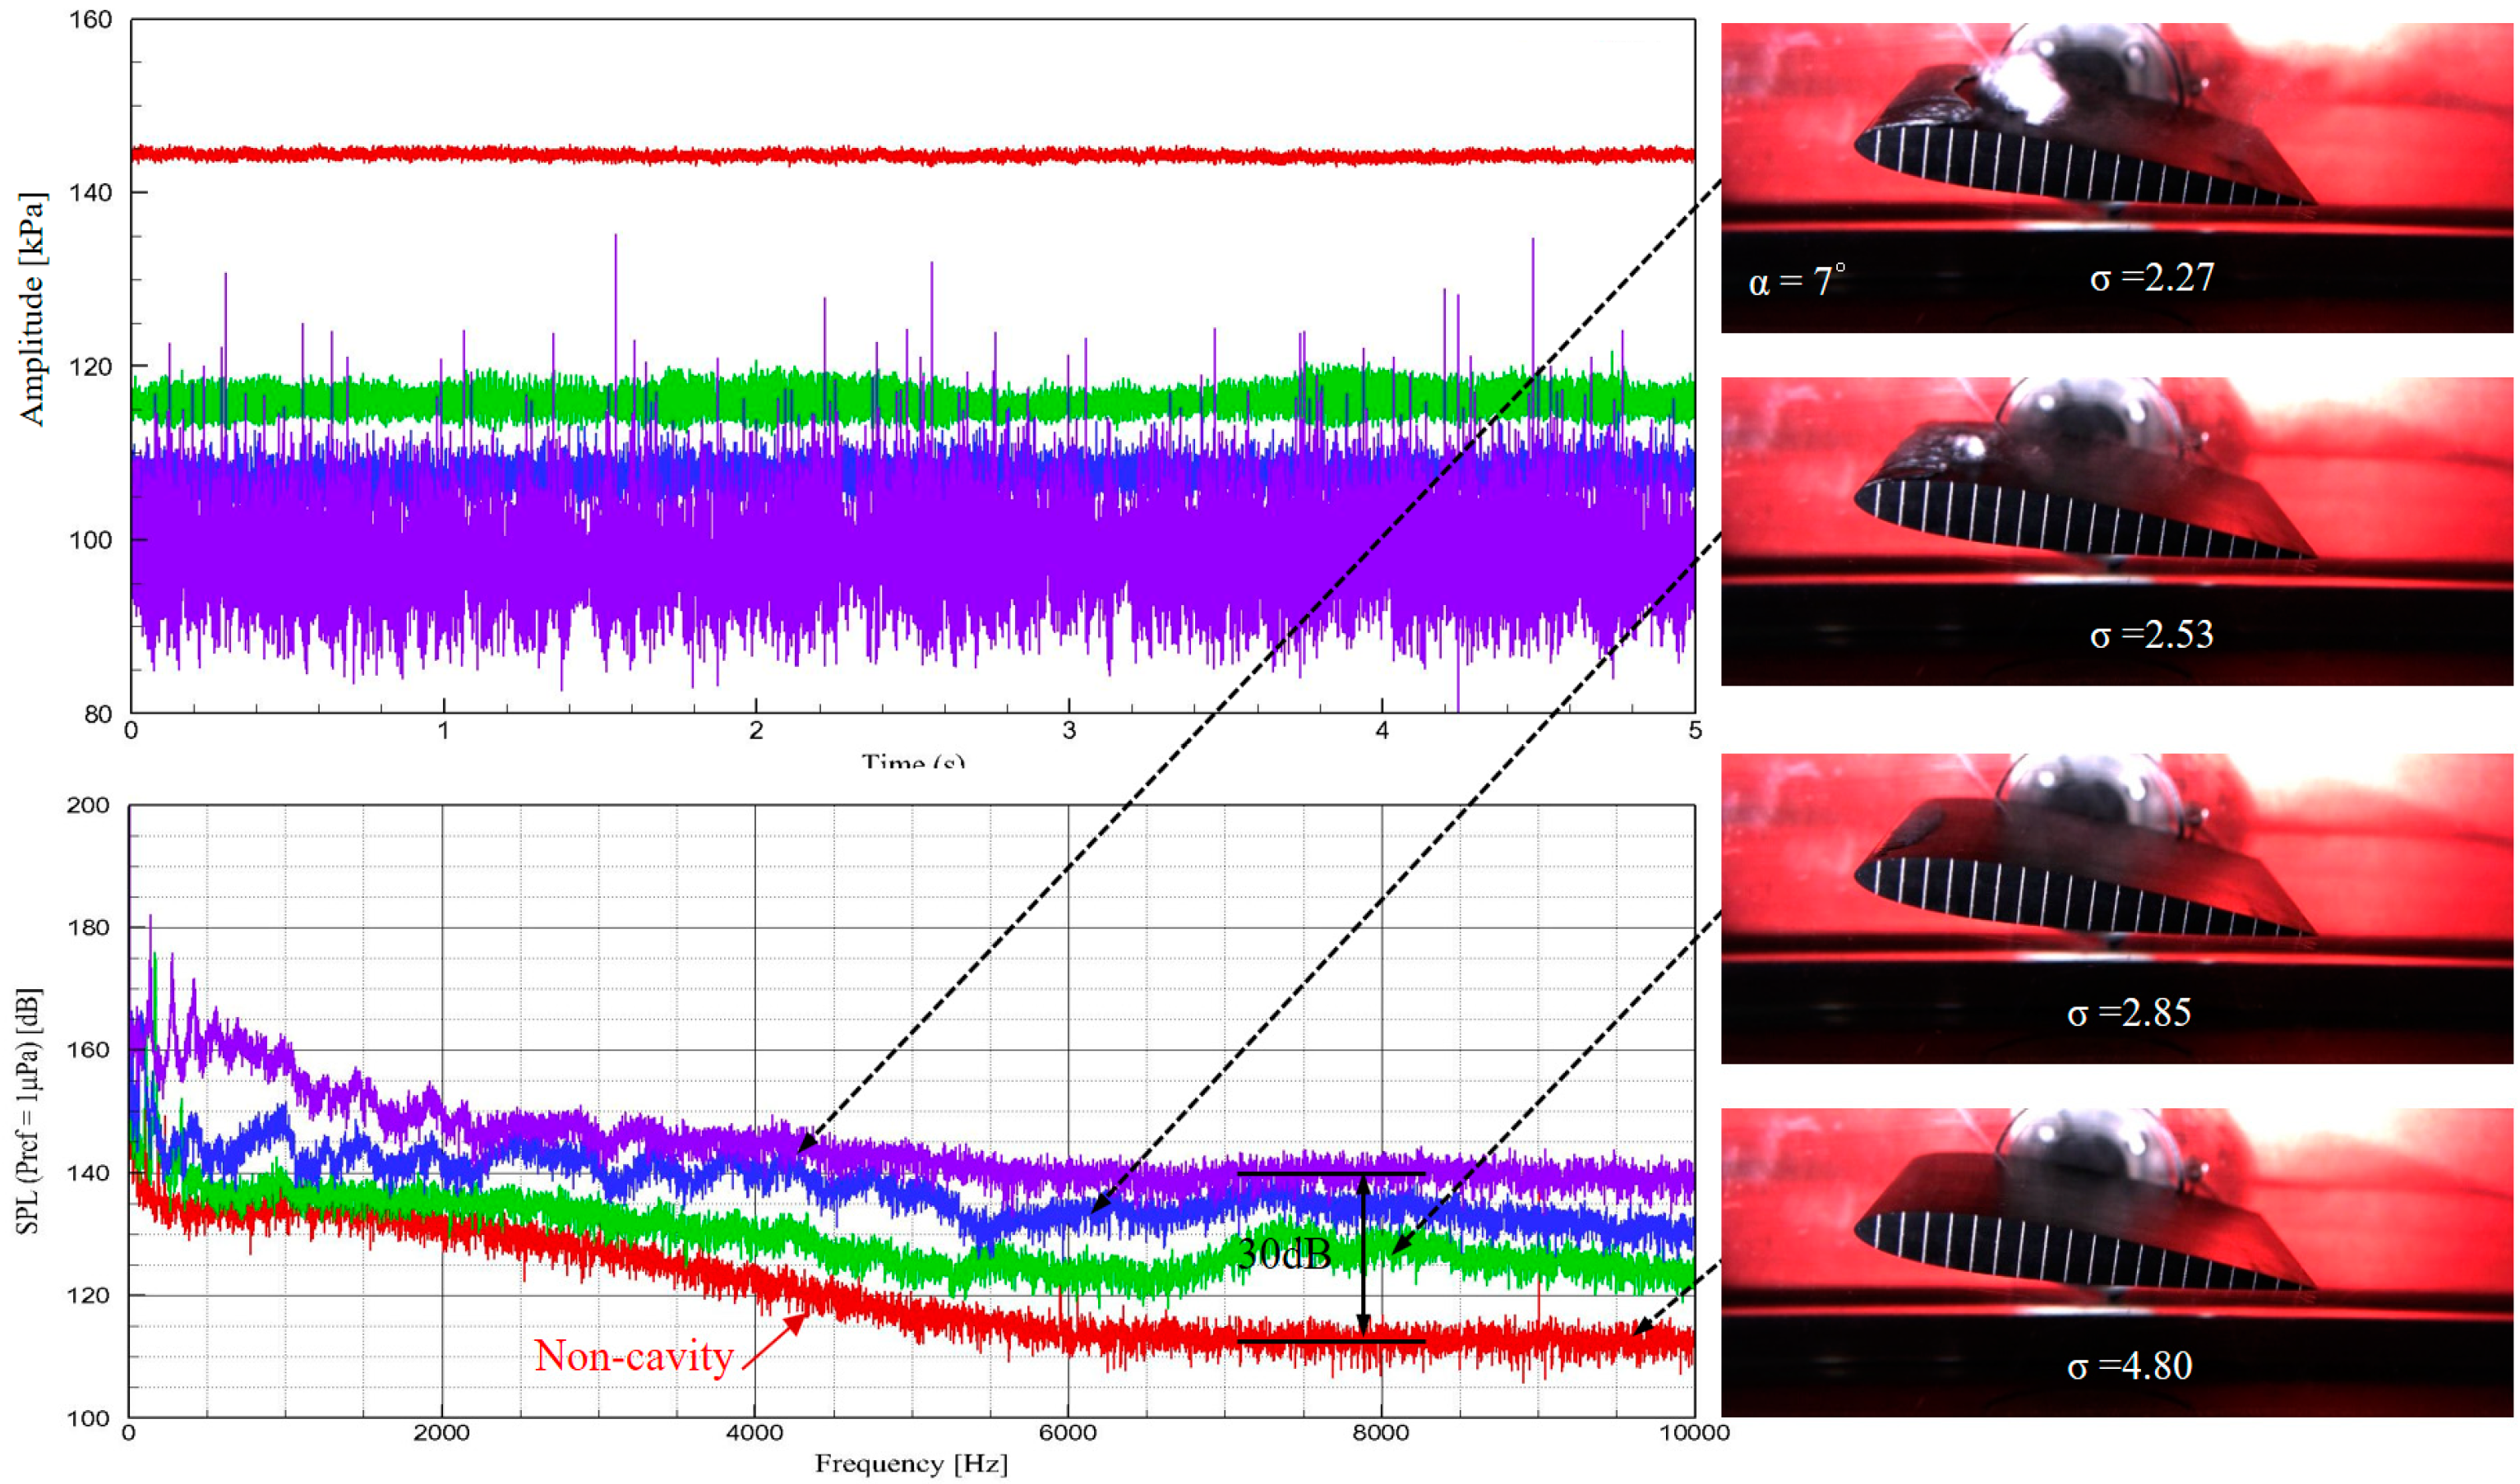
3.5. Pressure Fluctuations and Induced Noise

In many practical cases, various types of the partial cavity are accompanied by harmful effects such as erosion of the surface, vibration, and noise. Recently many efforts have been made to measure the production rate of shedding structures of the partial cavity; however, useful results in both experimental and computational studies are still insufficient. Reisman et al. [26] have identified two different pressure pulses resulting from either global or local events. Global events are typically connected to the collapse of large scale clouds. As a cloud is convected to a region of high pressure, it collapses and causes a change in pressure which reflects the periodic global behavior. However, local events are randomly distributed and generally correspond to the passage of a front of strongly varying void fraction on the sensitive surface of the pressure transducer, which is interpreted as shock waves in the bubbly mixture.
In this study, global events of the cloud cavity were focused on, and pressure fluctuations produced in the process of cavitation were measured using a flush-mounted pressure transducer at the top of the test section (see Figure 1). Figure 12 shows measured data in both of the time and frequency domain according to different cavitation numbers at α = 7°. As the cavitation number decreases, the sound pressure level in all frequencies increases: Compared to the case of noncavitation (σ = 4.80), the noise increases by about 30 dB when the pulsating cloud cavity occurs at σ = 2.27. Figure 13 shows the case of pulsating cloud cavitation for three different cavitation numbers, σ = 1.55, 1.47, and 1.40 at α = 5°. It also shows high-speed images with the longest cavities at given conditions. Here, the frequency of the pressure signal accurately exhibits the frequency of the cloud cavity. The frequency analyzed for the sound pressure signal agrees well with the frequency calculated for the high-speed image, that is, the Strouhal number is almost the same as 0.33. The pulsating frequency decreases as the cavity length is increased, the cavitation number decreases, and the product of the shedding vortex tends to remain constant.

4. Concluding Remarks

Experimental investigation on coherent structures and induced noise characteristics of partial cavitation on a two-dimensional hydrofoil was performed for a series of cavitation numbers. Using a high-speed camera, cavity inception, maximum length, and occurrence patterns were examined. As the angle of attack increases, an adverse pressure gradient becomes stronger, and the cavity develops earlier. However, at low angles of attack, the position of laminar separation does not depend on the Reynolds number. Periodically pulsating cloud cavitation appears when the cavity length is larger than about 10% of the length of the chord. Cavitation patterns strongly depend on water quality, and bubble cavitation occurs at a relatively low angle of attack due to the growth of nuclei in low pressure regions. The cavity length varies depending on the occurrence of reentrant jet and periodic shedding of the cavity. The shedding frequency of the cloud cavity was analyzed using two methods, i.e., high-speed images and sound pressure signals, and both results give good agreement. It was revealed that the rise time of the reentrant jet is about 35% of the shedding period. The reentrant jet generates the shedding vortex traveling with incoming flow speed. Using a simple relation, the production rate of the spanwise vortex (Γ) can be estimated. The observed results clearly show that the hairpin vortices are dominant and are a robust feature of cloud cavitating flow. Although it may seem very complex and random, cloud cavitation has very orderly and systematic structures.

Author Contributions

Writing—review and editing, B.-K.A.; Data curation, S.-W.J.; Validation, G.-D.K. and C.-S.P. All authors have read and agreed to the published version of the manuscript.

Funding

This work was supported by research fund of Chungnam National University.

Conflicts of Interest

The authors declare no conflict of interest.

References

  1. Arndt, R.E.A. Some remarks on hydrofoil cavitation. J. Hydrodyn. 2012, 24, 305–314. [Google Scholar] [CrossRef]
  2. Huang, T.T.; Peterson, F.B. Influence of viscous effects on model/full-scale cavitation scaling. J. Ship Res. 1976, 20, 215–223. [Google Scholar]
  3. Huang, T.T. Cavitation inception observations on six axisymmetric head-forms. J. Fluid Eng. 1981, 103, 273–279. [Google Scholar] [CrossRef]
  4. Huang, T.T. The effect of turbulent stimulations on cavitation inception of axisymmetric head-forms. J. Fluid Eng. 1986, 108, 261–268. [Google Scholar] [CrossRef]
  5. Mishra, C.; Peles, Y. Cavitation in flow through a micro-orifice inside a silicon microchannel. Phys. Fluids 2005, 17, 013601. [Google Scholar] [CrossRef]
  6. Medrano, M.; Zermatten, P.J.; Pellone, C.; Franc, J.P.; Ayela, F. Hydrodynamic cavitation in microsystems. I. Experiments with deionized water and nanofluids. Phys. Fluids 2011, 23, 127103. [Google Scholar] [CrossRef]
  7. Ghorbani, M.; Chen, H.; Villanueva, L.G.; Grishenkov, D.; Kosar, A. Intensifying cavitating flows in microfluidic devices with poly(vinyl alcohol) (PVA) microbubbles. Phys. Fluids 2018, 30, 102001. [Google Scholar] [CrossRef]
  8. Ghorbani, M.; Sadaghiani, A.K.; Villanueva, L.G.; Kosar, A. Hydrodynamic cavitation in microfluidic devices with roughened surfaces. J. Micromech. Microeng. 2018, 28, 075016. [Google Scholar] [CrossRef]
  9. Arakeri, V.H.; Carrol, J.A.; Holl, J.W. A note on the effect of short and long laminar separation bubbles on desinent cavitation. J. Fluid Eng. 1981, 103, 28–32. [Google Scholar] [CrossRef]
  10. Franc, J.P.; Michel, J.M. Attached cavitation and the boundary layer: Experimental investigation and numerical treatment. J. Fluid Mech. 1985, 154, 63–90. [Google Scholar] [CrossRef]
  11. Kawanami, Y.; Kato, H.; Yamaguchi, H.; Tanimura, M.; Tagaya, Y. Mechanism and control of cloud cavitation. J. Fluid Eng. 1997, 119, 788–794. [Google Scholar] [CrossRef]
  12. Callenaere, M.; Franc, J.P.; Michel, J.M. Influence of cavity thickness and pressure gradient on the unsteady behavior of partial cavities. In Proceedings of the 3rd International Symposium on Cavitation, Grenoble, France, 7–10 April 1998. [Google Scholar]
  13. Laberteaux, K.R.; Ceccio, S.L. Flow in the closure region of closed partial attached cavitation. In Proceedings of the 3rd International Symposium on Cavitation, Grenoble, France, 7–10 April 1998. [Google Scholar]
  14. Kawanami, Y.; Kato, H.; Yamaguchi, H. Three dimensional characteristics of the cavities formed on a two-dimensional hydrofoil. In Proceedings of the 3rd International Symposium on Cavitation, Grenoble, France, 7–10 April 1998. [Google Scholar]
  15. Kato, H. Complex structure of sheet-cloud cavitation. In Proceedings of the Third International Conference on Pumps and Fans, Beijing, China, 13–16 October 1998. [Google Scholar]
  16. Furness, A.; Hutton, S.P. Experimental and theoretical studies of two-dimensional fixed-type cavities. J. Fluids Eng. 1975, 97, 515–521. [Google Scholar] [CrossRef]
  17. Stutz, B.; Reboud, J.L. Experiments on unsteady cavitation. Exp. Fluids 1997, 23, 191–198. [Google Scholar] [CrossRef]
  18. Stutz, B.; Reboud, J.L. Two-phase flow structure of sheet cavitation. Phys. Fluids 1997, 9, 3678–3686. [Google Scholar] [CrossRef]
  19. Stutz, B.; Reboud, J.L. Measurements within unsteady cavitation. Exp. Fluids 2000, 29, 545–552. [Google Scholar] [CrossRef]
  20. Franc, J.P.; Michel, J.M. Partial cavities: Global behavior and mean pressure distribution. J. Fluids Eng. 1993, 115, 243–248. [Google Scholar]
  21. Kjeldsen, M.; Arndt, R.E.A.; Effertz, M. Spectral characteristics of sheet/cloud cavitation. J. Fluids Eng. 2000, 122, 481–487. [Google Scholar] [CrossRef]
  22. Blake, W.K.; Wolpert, M.J.; Geib, F.E. Cavitation noise and inception as influence by boundary-layer development on a hydrofoil. J. Fluid Mech. 1977, 80, 617–640. [Google Scholar] [CrossRef]
  23. Plesset, M.S.; Chapman, R.B. Collapse of an initially spherical cavity in the neighbourhood of a solid boundary. J. Fluid Mech. 1971, 47, 283–290. [Google Scholar] [CrossRef] [Green Version]
  24. Theodorsen, T. Mechanism of turbulence. In Proceedings of the 2nd Midwestern Conference on Fluid Mech, Columbus, OH, USA, 17–19 March 1952; pp. 1–18. [Google Scholar]
  25. Head, M.R.; Bandyopadhyay, P. New aspects of turbulent boundary-layer structure. J. Fluid Mech. 1981, 107, 297–338. [Google Scholar] [CrossRef]
  26. Reisman, G.E.; Wang, Y.C.; Brennel, C.E. Observations of shock waves in cloud cavitation. J. Fluid Mech. 1998, 355, 255–283. [Google Scholar] [CrossRef] [Green Version]
Figure 1. CNU cavitation tunnel and experimental set-up.
Fluids 05 00198 g001
Figure 2. Nondimensional cavity length versus the cavitation number for different angles of attacks.
Fluids 05 00198 g002
Figure 3. Universal cavity length as a function of σ/2α.
Fluids 05 00198 g003
Figure 4. Inception cavitation number versus the Reynolds number.
Fluids 05 00198 g004
Figure 5. Partial cavity patterns according to the angle of attack and the cavitation number.
Fluids 05 00198 g005
Figure 6. Partial cavity patterns: region of sheet and pulsating cloud cavitation.
Fluids 05 00198 g006
Figure 7. Partial cavity patterns: bubble cavitation.
Fluids 05 00198 g007
Figure 8. Evolution of bubble cavitation and collapse (α = 3°, σ = 1.00).
Fluids 05 00198 g008
Figure 9. Global behavior of the sheet and cloud cavity and periodic instability. (a) Schematic view of reentrant jet and cloud cavity shedding. (b) Observed results (α = 7°, σ = 2.05).
Fluids 05 00198 g009
Figure 10. Strouhal number versus the Reynolds number.
Fluids 05 00198 g010
Figure 11. Coherent structures of fully developed cavitating flow: visualized hairpin vortex cavity. (a) Schematic view of the hairpin vortex formation, evolution and collapse. (b) Observed results (α = 11°, σ = 2.88).
Fluids 05 00198 g011
Figure 12. Pressure fluctuations and sound pressure level for different partial cavities.
Fluids 05 00198 g012
Figure 13. Sound pressure level and shedding frequency of the cloud cavity (α = 5°).
Fluids 05 00198 g013
Publisher’s Note: MDPI stays neutral with regard to jurisdictional claims in published maps and institutional affiliations.

