Abstract
Heliostats constitute essential elements within concentrating solar power (CSP), where their structure, load profiles, and operational environment render wind loads a critical factor in their design considerations, as these loads directly impact the cost of energy generation. The aerodynamics significantly influence wind-induced effects, resulting in considerable variability in wind loads among different heliostat geometries. This study utilizes the Computational Fluid Dynamics (CFD) methodology to systematically examine the aerodynamic behavior of an isolated pentagonal heliostat. Employing the Unsteady Reynolds-Averaged Navier–Stokes (URANS) equations with an atmospheric boundary layer inlet condition, the investigation focuses on the flow field and wind load characteristics at four representative pitch angles: 0° (stow position), 30°, 60°, and 90°. Findings indicate that the pitch angle exerts a decisive impact on flow separation patterns. Specifically, as the elevation angle decreases, the flow regime shifts from being predominantly influenced by the mirror surface to being governed by the support structure, mediated through an interactive coupling between these components. At the 60° operational pitch angle, the pentagonal heliostat’s distinctive corner geometry induces an asymmetric vortex configuration—characterized by a smaller vortex at the top and a larger one at the bottom—thereby disrupting the conventional vortex distribution observed in symmetric heliostat designs. A further analysis of wind load characteristics indicates that, compared to a quadrilateral heliostat, the pentagonal mirror exhibits a significantly lower Elevation Moment Coefficient, despite a slight increase in the normal force coefficient. This reduction is attributed to a balancing mechanism: the “vortex structure asymmetry” creates an upper-large–lower-small distribution of absolute negative pressure on the support surface, while the “stagnation point position” shift with elevation angle produces an upper-small–lower-large distribution of absolute positive pressure on the reflector. The interaction between these opposing trends minimizes the net pressure differential across the mirror height, thereby contributing to superior overall aerodynamic performance. The reduction in the elevation moment coefficient contributes to enhanced structural wind resistance, thereby improving the overall energy efficiency and economic viability of concentrating solar power.
1. Introduction
To address the global energy crisis, the accelerated deployment of clean energy—particularly wind and solar—has become central to restructuring the global energy system. Solar power tower (SPT) technology is increasingly attractive because it is well-suited to large-scale energy storage and can deliver more stable power output. In SPT plants, heliostats continuously track the sun and reflect solar radiation onto the receiver at the top of the tower [1,2,3]. However, heliostats are typically large-span, lightweight structures with low damping and low natural frequencies. Under complex and unsteady wind conditions, wind-induced deformation and vibration of the mirror surface can cause focal spot displacement and defocusing, which in turn reduces concentration efficiency and overall power-generation performance [4,5]. Therefore, understanding the wind-induced dynamic behavior of heliostats and developing effective control/mitigation strategies are critical for operational safety and performance optimization [6,7,8,9].
Wind load is a governing design consideration for heliostat structures; evaluating wind-resistance performance provides a basis for selecting design wind-load parameters and controlling deformation and vibration [10,11]. In recent years, CFD and coupled CFD–FEM approaches have been widely used to predict shape coefficients, wind-induced moments, and field interference effects. Ahmad et al. used CFD with a k–ε model to examine heliostat aerodynamics under local climate across 0–90° elevation angles and reported peak drag at 90° and peak lift at 30°, with FEM checks supporting structural integrity under the computed loads [10]. Mahfoud et al. emphasized that heliostats contribute roughly 45% of solar tower costs and applied CFD–FEM simulations under Algerian conditions, validating wind-load predictions against experimental data across multiple configurations [11]. Focusing on turbulence-model performance, Lu et al. validated CFD predictions of wind pressure and flow fields against wind-tunnel measurements and showed improved accuracy for an MMK-modified k–ε model [12]. Lu et al. further compared LES and DES to identify adverse operating conditions and shape coefficients, concluding that LES agreed more closely with experiments [13]. Using high-fidelity simulation for array effects, Zhu et al. developed LES-based models for heliostat arrays under five representative scenarios and obtained fluctuating pressure coefficient distributions at different field positions [14]. Li et al. demonstrated that LES can quantify both mean and peak wind loads and reported that loads on support components contribute more than 50% of the mean lift and overturning moment in survival orientations, implying that survival-load evaluation must include these components for reliable design [15]. For open-terrain wind-load prediction, Poulain et al. used the Scale-Adaptive Simulation (SAS) and compared spectral versus vortex inlet perturbations; while mean drag matched wind-tunnel results closely (0.04% error), peak loads deviated by about 18%, which they linked to limitations in the turbulent length scale represented at the inlet [16].
Despite these advances, much of the existing literature remains centered on load outcomes (e.g., surface pressure distributions and aerodynamic/shape coefficients), while the mechanisms driving these responses—wake separation and reattachment, vortex shedding, and other unsteady aerodynamic processes—are less systematically investigated. This gap hinders the development of wind-resistant design and control strategies grounded in flow physics. Recent studies have therefore begun to examine heliostat wake dynamics explicitly. Yin et al. used CFD to quantify how support structures modify wake-flow characteristics and explained the associated causes [17]. Wolmarans et al. computed both structural modal frequencies and vortex-shedding frequencies and concluded that the mismatch between them suppresses self-excited vibrations [18]. Li et al. used LES to analyze the flow around a quadrilateral heliostat at different pitch angles and assessed the resulting load changes, noting that although quadrilateral heliostats show relatively uniform pressure under steady inflow due to geometric symmetry, high tilt angles can promote large leeward vortices and pronounced fluctuations of the moment coefficient that threaten stability [15].
Pitch angle is also a key parameter governing wind effects, and pentagonal heliostats are another common design. Blume conducted full-scale field tests on a pentagonal heliostat and derived pressure coefficients at specific pitch angles [19]. Emes and Jafari et al. established relationships between the hinge-moment coefficient and relevant parameters [20]. Merarda et al. used numerical simulations to show that optimizing mirror-frame geometry (e.g., square or pentagonal forms) can significantly reduce critical wind loads on large solar trackers, providing guidance for cost-effective and reliable optimization of metal structural components (e.g., cast parts) [21].
To date, investigations into pentagonal heliostats have predominantly concentrated on experimental approaches, with the characteristics of their wake flow remaining insufficiently elucidated. Hayden et al. used URANS and time-resolved PIV to characterize and validate wake structures and vortex-shedding frequencies generated by thick-trailing-edge StreamVane turning vanes, quantifying the agreement between CFD predictions and measurements [22]. Castellani et al. combined wind-tunnel flow visualization (optical-flow video processing) and URANS simulations, validated with pressure-tap measurements, to characterize the wake and vortex-shedding-induced dynamic response of a tilted (65°) PV panel under complex wind loading [23]. To address the above gap for pentagonal heliostats, the present study applies the Unsteady Reynolds-Averaged Navier–Stokes (URANS) methodology within Computational Fluid Dynamics (CFD) simulations. This approach extends the analysis beyond conventional assessments of mean loads and pressure distribution to a detailed investigation of the underlying flow-field structures and their evolution mechanisms. The study systematically examines the developmental patterns of the two-dimensional wake flow field under conditions of strong wind and evaluates the distribution of wind pressure and aerodynamic loads on the heliostat across varying elevation angles. The objective is to enhance the fundamental understanding of wind-induced phenomena affecting heliostats from an aerodynamic perspective, thereby offering valuable insights for future aerodynamic shape optimization and wind-resistance design strategies.
2. Model Establishment and Parameter Definition
2.1. Working Attitudes and Simulated Conditions
The principal function of a heliostat within a solar power tower facility is to continuously and precisely direct sunlight onto the receiver located atop the central tower throughout varying times of the day and across different seasons. Given the dynamic nature of solar altitude and azimuth angles, as well as the diverse geographical positioning of heliostats within the field, each heliostat must adjust its spatial orientation in real-time through programmed control systems to maintain optimal concentration efficiency. Consequently, heliostats operate under a wide range of orientations during actual use, resulting in varied relative alignments with respect to the incident wind flow. This variability in orientation renders the wind load characteristics acting upon the heliostat highly complex. The present study offers explicit definitions for the key angular parameters that govern the heliostat’s attitude and mirror orientation.
The pitch angle (α) characterizes the rotation of the heliostat mirror surface about a horizontal axis, typically parallel to the ground plane. As illustrated in Figure 1, the pitch angle is defined such that α = 0° corresponds to the mirror panel being parallel to the ground surface. This working attitude generally represents the “stow position” employed during non-operational intervals (e.g., nighttime or adverse weather conditions), designed to minimize the wind-exposed area and thereby reduce wind-induced loads. During operational periods, the pitch angle varies continuously over a broad range—from approximately 0° (near-horizontal) to 90° (near-vertical)—in response to the sun’s position. Variations in the pitch angle directly influence the mirror’s inclination within the vertical plane, rendering it the most critical parameter affecting both the wind-facing surface area and the distribution pattern of wind pressure.
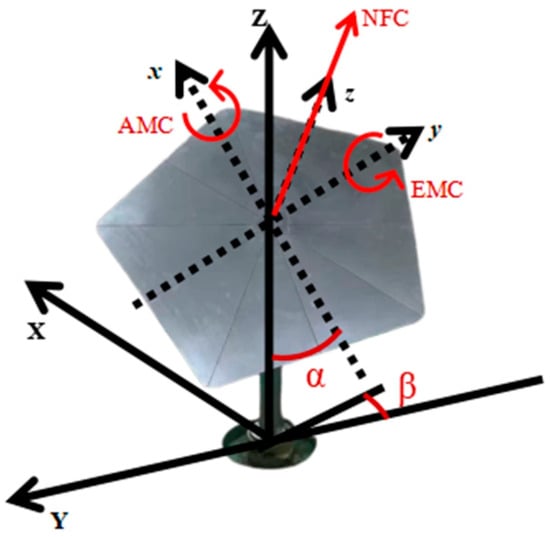
Figure 1.
Schematic of the heliostat parameters.
To facilitate a precise description of the surfaces subjected to wind loads, this paper delineates two principal orientations of the mirror surface: (1) The Reflective Surface, which constitutes the front side of the mirror assembly and is characterized by a polished or coated finish specifically designed for sunlight reflection. In wind load analyses, when this surface faces the incoming wind flow, the condition is classified as positive wind pressure. (2) The Supporting Surface, which refers to the rear side of the mirror assembly and is connected to the supporting truss or drive mechanism.
To support the evaluation of the mean pressure coefficient and mean shape coefficients, 302 pressure taps were distributed on the pentagonal heliostat, with 151 points arranged in the same pattern on both the reflective and supporting surfaces. This mirrored layout enables full-surface integration of the shape coefficients. The tap locations and coordinates are shown in Figure 2 (red markers indicate pressure taps).
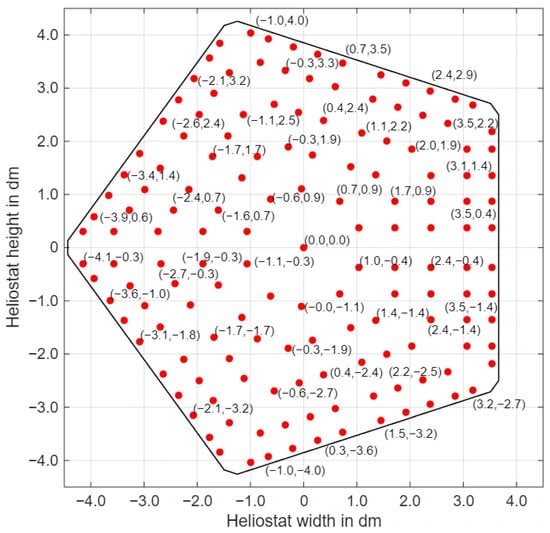
Figure 2.
Mirror pressure monitoring points.
In practice, heliostat pitch and wind azimuth vary continuously. To isolate the fundamental load characteristics, four representative pitch angles (90°, 60°, 30°, and 0°) were considered under a wind azimuth of 0°, i.e., head-on inflow. This azimuth typically produces the largest wind load on the reflective surface and therefore provides a conservative basis for assessing wind resistance. The selected pitch angles represent the following orientations:
Vertical orientation (90°): the most critical case for a given azimuth, with the largest projected area and the strongest separation and vortex shedding, leading to high mean loads and pronounced unsteady effects that can generate the maximum overturning moment.
Stow/horizontal orientation (0°): the survival position used in extreme winds, which minimizes projected area and wind load and is therefore relevant to aerodynamic mitigation and structural safety [24].
Typical operating orientations (60° and 30°): representative sun-tracking attitudes where load characteristics are important for fatigue assessment and for maintaining long-term structural integrity and optical accuracy.
2.2. Computational Domain and Mesh
Before conducting the CFD simulations, the heliostat geometry and computational domain were defined to ensure both accuracy and efficiency. The solid model was simplified to retain only the flow-dominant components—namely the pylon, purlins, truss, and mirror panels—which govern separation and surface pressure distribution. Small details (e.g., push rods and bolted connections) were omitted because their influence on the global flow field is negligible. The domain size was selected to satisfy two requirements: (i) it must be large enough to avoid artificial boundary effects on the flow development around the heliostat, and (ii) it must not be unnecessarily large to prevent excessive cell counts. The domain cross-section (width and height) was determined using the blockage ratio, defined as the ratio of the model’s maximum projected area normal to the inflow to the inlet cross-sectional area. Baetke et al. [25] reported that keeping the blockage ratio below 3% effectively minimizes wall-interference effects, ensuring reliable numerical predictions.
is defined as the windward projected area of the structure, and is defined as the cross-sectional area of the flow domain.
In establishing the dimensions of the computational domain, it is essential not only to maintain the blockage ratio below 3% but also to provide adequate space within the flow domain to allow the fluid flow to fully develop. This consideration is critical for accurately capturing the complex flow phenomena around the heliostat, particularly the formation and evolution of the wake flow. Consequently, the computational domain must be sufficiently extensive in both the streamwise (length) and spanwise (width) directions.
The heliostat, capable of rotating about an axis, exhibits significant variations in its geometric exposure to wind flow as a function of the pitch angle (α). When the mirror surface is parallel to the ground (α = 0°), the windward face approximates a horizontal flat plate with a compact planform. Conversely, when the mirror surface is perpendicular to the ground (α = 90°), it presents the maximum frontal projected area to the wind, with its vertical dimension becoming dominant. This substantial change in effective wind-intercepting geometry complicates the definition of a universally applicable computational domain size.
To ensure the wake flow is fully developed under all operating conditions and to prevent backflow interference from the outlet boundary affecting the upstream flow field, this study adopts a unified computational domain size based on the most demanding scenario. Specifically, the working attitude with a pitch angle of 90° (vertical mirror) is selected as the reference model. Preliminary simulations of this case, coupled with an incremental increase in the distance from the leeward side to the domain outlet, facilitate the determination of a sufficiently large computational domain suitable for all pitch angle conditions. The detailed parameters are provided in Table 1.

Table 1.
Geometric Parameters of the Computational Domain.
To improve computational efficiency without compromising accuracy, a robust meshing strategy is essential. Following Wang et al. [26], a hybrid mesh is adopted to provide high resolution near complex geometry while keeping the outer domain economical. A near-wall refinement zone is defined as a region enclosing the heliostat. This region uses adaptive unstructured tetrahedral cells with local refinement to capture separation, reattachment, and strong pressure gradients. Outside this region, the external flow-field zone is meshed with structured hexahedral cells, which reduces cell count and accelerates the solution while maintaining numerical stability. The two zones are connected by an internal interface with quadrilateral surface elements to ensure a smooth transition from fine to coarse mesh sizes and to avoid errors associated with abrupt grid changes. For thin components (e.g., the mirror panel), triangular surface elements are used to simplify discretization while adequately resolving the surface pressure distribution (Figure 3 and Figure 4).
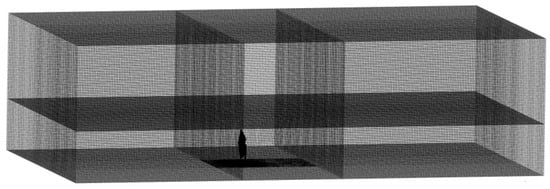
Figure 3.
Overall mesh for the 90° (vertical mirror) working attitude.
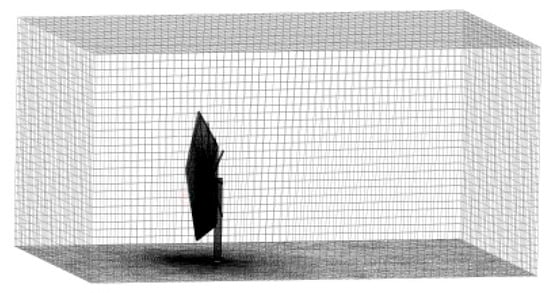
Figure 4.
Local mesh details for the 90° working attitude.
To achieve an optimal balance between computational accuracy and efficiency, a grid independence study was initially performed, as summarized in Table 2. This investigation focused on two pivotal working attitudes characterized by pitch angles of 30° and 0°. For each working attitude, three grid resolutions—coarse, medium, and fine—were developed, each with an incrementally higher number of cells. Importantly, although the normal force coefficient shows differences approaching (or locally below) 6% for some cases, the corresponding EMC and AMC differences between the medium and fine meshes are both below 3%. This indicates that the solution has entered a regime of diminishing sensitivity to further mesh refinement and that the overall variation due to grid refinement is already small. Based on these supplementary metrics, we consider the results to be sufficiently mesh-converged for engineering accuracy.
Table 2.
Comparison of Shape Coefficients for Grid Independence Study. (The value in parentheses indicates the magnitude of the difference.)
2.3. Turbulence Model and Boundary Conditions
The numerical model and boundary conditions utilized in this investigation align with those implemented by Wang (refer to Figure 5 and Table 3), both of which are grounded in the Unsteady Reynolds-Averaged Navier–Stokes (URANS) framework. Specifically, the standard k-ε model (Standard k-ε Model), proposed by Launder et al. [24], was employed.
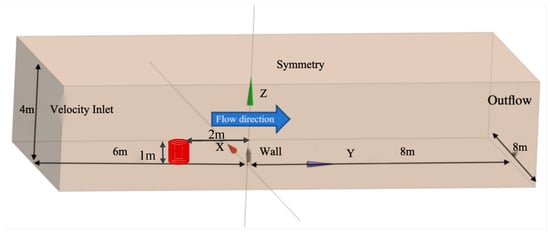
Figure 5.
Schematic diagram of the CFD boundary conditions.
Table 3.
Boundary Conditions Applied in the Numerical Simulation.
It is acknowledged that the URANS approach, including the standard k-ε model, has inherent limitations in accurately resolving transient flow features, such as large-scale vortex shedding and unsteady separation, which are critical for predicting peak wind loads. Consequently, the focus of this section’s URANS-based analysis is on the reliable prediction of time-averaged (mean) wind loads and flow fields, which provide a foundational understanding of the aerodynamic behavior. This model is formulated based on the transport equation for turbulent kinetic energy (k) and incorporates an additional equation for the turbulent dissipation rate (ε). It operates under the assumption of fully turbulent flow, where molecular viscosity can be neglected. Equations (2) and (3) present the transport equations for turbulent kinetic energy and dissipation rate within the standard k-ε model. For coupling the solution of velocity and pressure fields, the SIMPLEC (Semi-Implicit Method for Pressure-Linked Equations Consistent) algorithm was selected. Spatial discretization was handled using a second-order upwind scheme [24]. The density and dynamic viscosity of air were specified as ρ = 1.225 kg/m3 and μ = 1.789 × 10⁻⁵ kg/(m·s), respectively. The convergence criterion for steady-state computations was set to an absolute residual threshold of 1 × 10⁻⁶. Two primary computational configurations were employed: one utilizing a total of 192 cores with 188 cores dedicated to parallel solving and 4 cores reserved for graphical visualization, and another utilizing 128 cores with 124 cores for parallel solving and 4 cores for visualization. The corresponding total computational wall times for achieving convergence were approximately 49 h and 52 h, respectively (refer to Table 4).
where and represent the production of turbulent kinetic energy due to mean velocity gradients and buoyancy effects, respectively; denotes the contribution of fluctuating dilatation in compressible turbulence to the overall dissipation rate; is the turbulent viscosity coefficient; , is an empirical constant; is the buoyancy-related term, which vanishes for incompressible flows; , are the turbulent Prandtl numbers for and , respectively; and , indicates any user-defined source term.
Table 4.
Summary of Convergence Criteria and Computational Details.
The URANS methodology involves decomposing the governing flow equations into mean and fluctuating components through time-averaging of the turbulent fluctuation terms. This approach substantially diminishes computational complexity and resource demands while preserving an acceptable level of accuracy. Due to its relatively low computational cost and robust numerical stability, the URANS method has emerged as the most extensively adopted and technically advanced numerical technique for practical industrial fluid flow simulations.
To accurately represent the actual wind characteristics of the atmospheric boundary layer at the inlet of the numerical simulation—thereby improving the reliability and precision of the results—this study employed a rigorously defined and systematically validated inlet wind velocity profile. Specifically, wind speed time-history data at a reference height were established based on the target wind environment, capturing critical temporal fluctuations in wind speed. The time-history data were derived from wind tunnel tests conducted in the atmospheric boundary layer wind tunnel at Tongji University. The wind speed at each point was measured using three Cobra probes (Turbulent Flow Instrumentation, Australia), with an acquisition frequency of 5 kHz and an output frequency of 1 kHz, collecting 180 s of stable flow data as shown in Figure 5. A Category B wind profile model, appropriate for neutral atmospheric conditions, was utilized to characterize the vertical distribution of wind speed according to its standardized velocity coefficients. The inlet wind velocity was simulated using an exponential wind speed profile (Equation (4)), while the turbulent kinetic energy and dissipation rate were modeled accordingly (Equations (5) and (6)). To establish a comprehensive inlet condition, the turbulent length scale was determined directly from the measured wind tunnel velocity time series (Figure 6). Applying Taylor’s frozen turbulence hypothesis, the time integral scale was calculated by integrating the autocorrelation function of the velocity fluctuations. The spatial integral scale was then obtained by multiplying the time scale by the mean velocity, resulting in a value of 1.24 m at the model scale. This derived length scale was prescribed in the CFD model. Based on this parameterized model, the inlet velocity and turbulence field definitions were implemented through a user-defined function (UDF) and imported into the inlet boundary condition interface of the CFD solver.
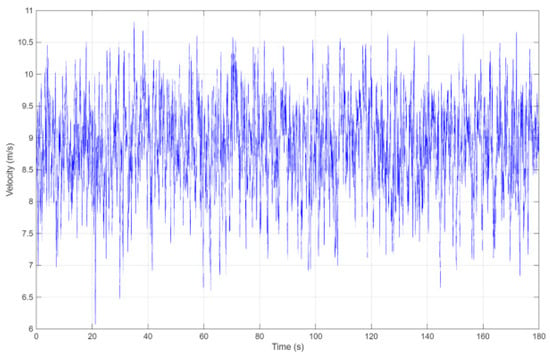
Figure 6.
Wind tunnel measured wind speed time history.
A comparison between the turbulence energy spectrum from the wind tunnel tests and that from the CFD simulation shows good agreement in the energy-containing range, which is governed by this integral scale (Figure 7). Some discrepancies are observed at higher frequencies, consistent with the expected limitations of the turbulence model in resolving finer-scale eddies. These elements were integrated to develop a three-dimensional inlet wind field that simultaneously accounts for spatial and temporal variations. This comprehensive inlet condition incorporates time-dependent wind speed, an atmospheric boundary layer-consistent wind speed profile, and the associated turbulence intensity distribution.
where z and denote the computational height and the reference height, respectively, and are the corresponding mean wind speeds at these heights, and = 0.18 is the ground roughness exponent for terrain category B.
where is the longitudinal turbulence intensity at the same height, is an empirical constant (typically 0.09 in standard k-ε models), and is the turbulent length scale.
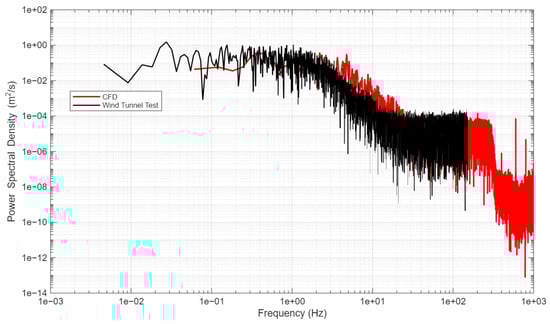
Figure 7.
Comparison of turbulence spectra (Red represents , while black represents wind tunnel test).
To account for potential flow development effects between the inlet and the heliostat (e.g., velocity-profile distortion or turbulence decay), ten upstream monitoring points were placed 2 m in front of the model at heights from 0.1 to 1.0 m with 0.1 m spacing (Figure 5). The sampled mean wind speed and turbulence intensity were used to construct the inflow profiles (Figure 8) and were compared with the theoretical Category B wind-field model [27]. The measured wind-speed and turbulence-intensity profiles agree well with the theoretical predictions, and the deviations remain within acceptable engineering limits.
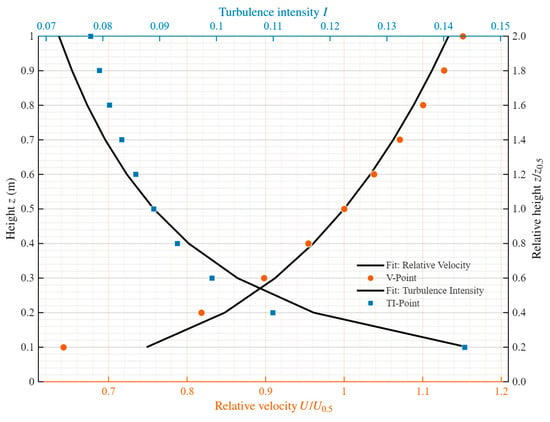
Figure 8.
Profiles of wind speed and turbulence intensity.
2.4. Non-Dimensional Coefficients
Raw wind-speed and pressure data from field measurements, wind-tunnel tests, or CFD simulations depend on dimensional parameters such as the incident wind speed and air density. To reduce this dependence and enable consistent comparisons across studies, operating conditions, and model scales, the wind pressure, forces, and moments acting on the heliostat are expressed in non-dimensional form (Figure 1). The definitions are given below:
(1) Surface Pressure Coefficient:
The surface pressure coefficient at different time instances and the mean surface pressure coefficient () obtained by averaging these instantaneous values over time are defined as follows:
where N represents the total number of data points at different time instances, and i denotes the data at a specific time instance.
(2) Normal Force Coefficient (NFC):
A force oriented perpendicular to and directed away from the reflective surface of the mirror is designated as positive, whereas a force in the opposite direction is considered negative. Employing the methodology previously described, both the instantaneous normal force coefficient and the mean normal force coefficient are subsequently determined.
(3) Elevation Moment Coefficient (EMC):
The torque generated by the airflow, which induces rotation of the mirror about its horizontal (y) axis, directly influences the stability of the mirror’s pitching dynamics.
(4) Azimuth Moment Coefficient (AMC):
The torque generated by the airflow, which induces rotation of the mirror about its vertical (x) axis, directly affects the mirror’s pointing precision and azimuth stability.
where , , and represent the normal force, elevation moment, and azimuth moment, respectively; A denotes the mirror surface area; and L is the characteristic length, typically taken as (note that the characteristic length L used for non-dimensionalization in Equations (10) and (11) is the same).
3. Flow-Field Analysis
To systematically examine the flow characteristics around the pentagonal heliostat, this study establishes a two-dimensional flow-field analysis framework by defining a set of targeted measurement sections. Two groups of cross-sectional planes are introduced to capture the dominant flow phenomena.
First, four vertical planes (Sections A–D) are placed at key positions on the mirror surface—three corner locations and the central region (Figure 9). Oriented perpendicular to the mirror base edge, these planes resolve vertical flow structures associated with the heliostat–flow interaction, including separation, upward deflection, and downstream wake development. Comparing the corner and central sections further clarifies the three-dimensional effects induced by the pentagonal geometry.
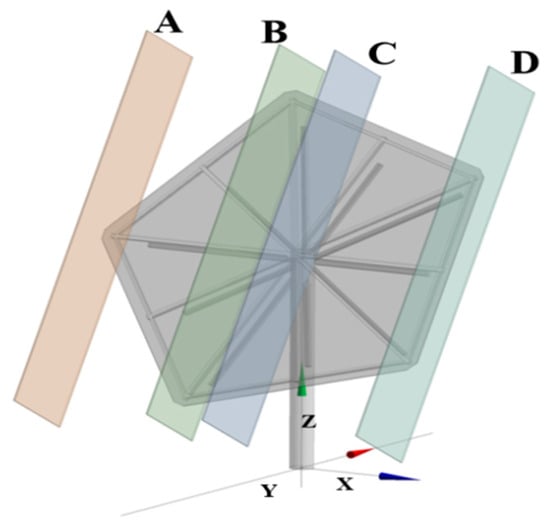
Figure 9.
Schematic of the vertical sections.
Second, three horizontal planes (Sections E–G) are arranged at different elevations along the mirror height and aligned with the corner regions (Figure 10). Parallel to the ground, these sections characterize the spanwise evolution of the flow, capturing the development of the horseshoe-vortex system near the lateral edges, corner-vortex formation, and lateral spreading of near-wall flow. Together, the multi-level planes enable a systematic assessment of how the heliostat modifies atmospheric boundary-layer flow from near-ground to the mirror top.
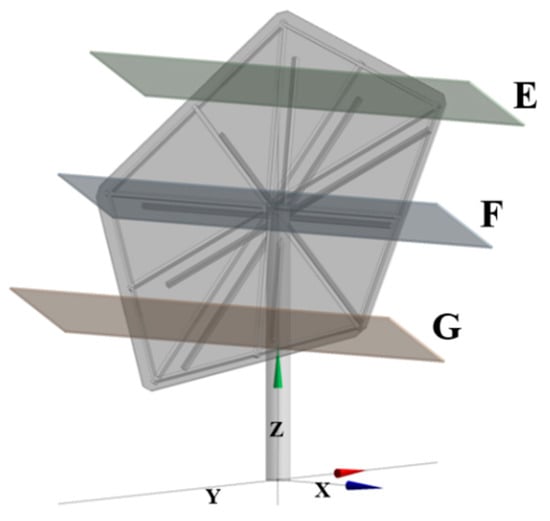
Figure 10.
Schematic of the horizontal sections.
3.1. Flow Fields at the Four Pitch Angles
Figure 11, Figure 12, Figure 13 and Figure 14 illustrate the section-wise streamline of the pentagonal heliostat at representative pitch angles (0°, 30°, 60°, and 90°). These two-dimensional vortex structures provide a consistent physical explanation for the evolution of the mean pressure coefficient distributions on the reflective and supporting surfaces .
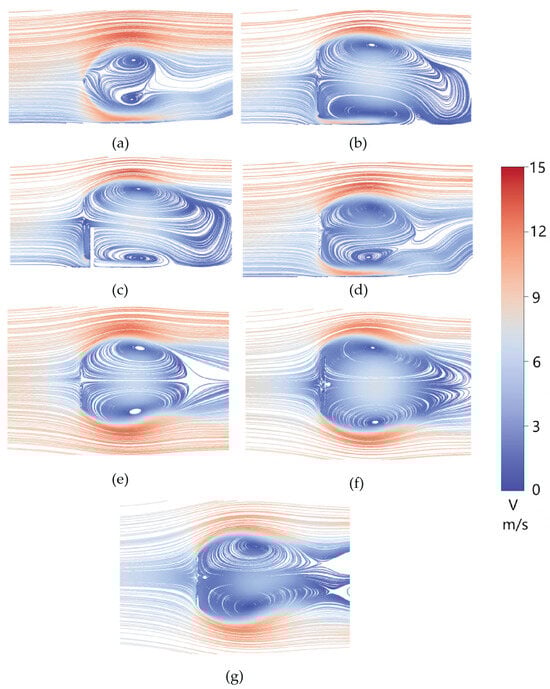
Figure 11.
Velocity field and streamlines at α = 90°. (a) Section A. (b) Section B. (c) Section C. (d) Section D. (e) Section E. (f) Section F. (g) Section G.
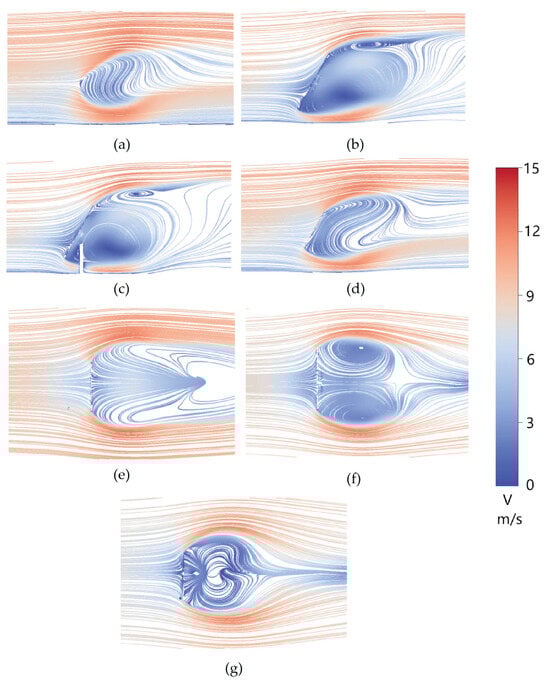
Figure 12.
Velocity field and streamlines at α = 60°. (a) Section A. (b) Section B. (c) Section C. (d) Section D. (e) Section E. (f) Section F. (g) Section G.
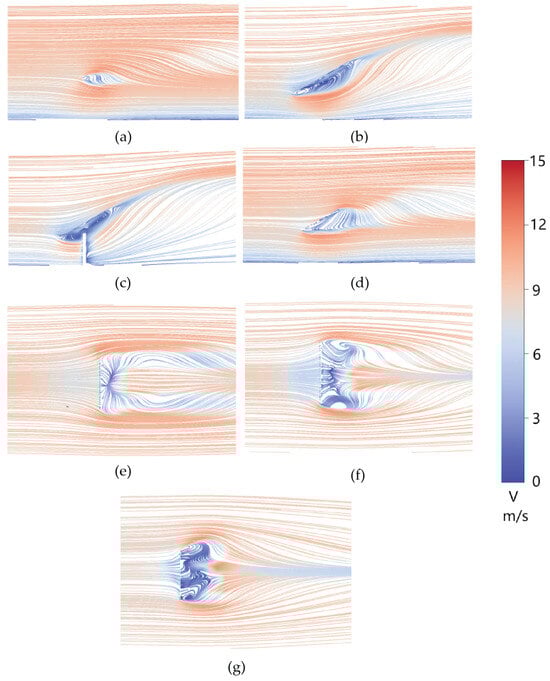
Figure 13.
Velocity field and streamlines at α = 30°. (a) Section A. (b) Section B. (c) Section C. (d) Section D. (e) Section E. (f) Section F. (g) Section G.
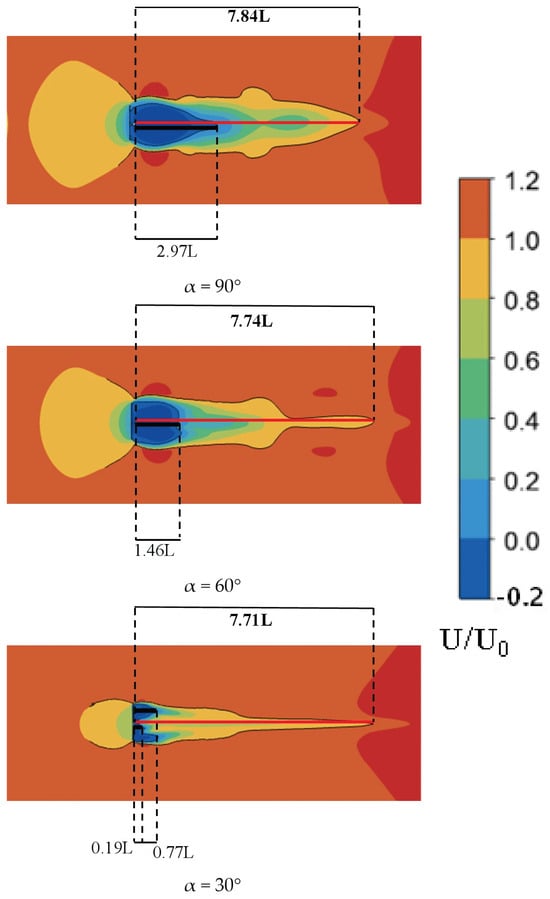
Figure 14.
Relative velocity distribution in the inflow direction.
At 90° (Figure 11), the mirror is normal to the incoming flow and produces a canonical bluff-body wake. In the central vertical section (Section C), the flow exhibits a relatively ordered recirculation with vortices of comparable scale, while the corner-related sections (A, B, and D) increasingly reflect end effects and geometric constraints: the outer sections simplify toward a single dominant vortex, indicating localized separation dominated by the pentagonal corners. Despite the vertical-plane asymmetry introduced by the planform, the horizontal sections (E–G) show a classical, laterally symmetric horseshoe-vortex system composed of two counter-rotating vortices of similar size.
This directly explains the pressure field at 90°: a broad windward positive-pressure region forms on the reflective surface because of strong stagnation and the globally bluff-body-like blockage. Meanwhile, the supporting surface experiences predominantly suction associated with a widely separated wake; however, because the wake becomes more globally symmetric at normal incidence, the supporting-surface pressure distribution is comparatively regular and exhibits reduced in-plane non-uniformity. Consequently, although the overall load level is high, the resultant force is less eccentric relative to the rotation axis, so the elevation moment coefficient (EMC) does not necessarily peak at 90°.
At 60° (Figure 12), the flow becomes more strongly three-dimensional than in the 90° case. Two unequal vortices form behind the mirror: a stable, large near-ground recirculation and a smaller upper vortex. This split structure is primarily induced by the reduced projected frontal area and the enhanced near-ground confinement, which intensifies blockage and recirculation in the gap between the mirror rear face and the ground. Importantly, the pentagonal corner near Section B acts as a robust separation trigger: it promotes earlier upper shear-layer separation, limits subsequent vortex growth, and stabilizes a relatively small upper recirculation.
These mechanisms explain the mean pressure patterns at 60°. On the reflective surface, the stagnation region shifts upward, and the windward positive-pressure band becomes more concentrated, indicating intensified stagnation and a stronger vertical pressure gradient. On the supporting surface, persistent separation and near-ground recirculation strengthen suction and increase spatial non-uniformity. Because the pressure field combines “high windward positive pressure” with “strong leeward suction” in a vertically imbalanced manner, the resultant force becomes highly eccentric, which promotes a large EMC even if the net load is not maximal.
At 30° (Figure 13), the aerodynamic regime transitions from mirror-dominated to a coupled system governed by both the mirror and the support (pylon and rear structure). As the mirror elevation decreases, its effective wind-facing area reduces, and the support increasingly controls separation and wake organization. In vertical Section C, interference effects around the pylon generate localized, small-scale vortices that rapidly dissipate downstream through turbulent mixing. In horizontal planes, multiple vortices of different scales coexist and interact, producing a strongly three-dimensional and unsteady wake rather than the orderly vortex pair observed at higher pitch angles.
This is consistent with the sharp changes in mean pressure distribution at 30°: a continuous windward positive-pressure band develops, and the vertical asymmetry becomes pronounced, yielding a steep in-plane pressure gradient. On the supporting surface, the more fragmented separated flow and interference with the support structure create a scattered suction pattern that is highly sensitive to pitch angle. The combined effect is a strongly asymmetric pressure field and an eccentric resultant force, which explains why the 30–60° conditions are more prone to generating large EMC than the more symmetric 90° case.
In addition, the following analyses were conducted for pitch angles ranging from 30° to 90°. In this study, the recirculation length is defined as the downstream distance from the trailing edge to the intersection of the centerline with the isopleth, representing the extent of the separated wake bubble, whereas the wake recovery length is defined based on the centerline velocity deficit as the distance required for the mean streamwise velocity to recover toward the freestream level (e.g., until exceeds a prescribed threshold, e.g., 0.03), thereby quantifying the gradual downstream restoration of momentum after separation and recirculation. Here, denotes the characteristic length of the heliostat, and represents the inlet mean wind speed [28,29].
The recirculation length and wake recovery length were evaluated on the center plane (E) for pitch angles from 30° to 90° and are plotted in Figure 14. As shown, both quantities increase as the pitch angle rises from 30° to 90°, whereas the wake recovery length exhibits a relatively smaller variation. This indicates that increasing the pitch angle mainly enlarges the separated recirculation bubble (near-wake), while the downstream recovery of the mean velocity is less sensitive. In other words, the near-wake grows noticeably, but the far-wake recovery distance changes only slightly.
At 0° (Figure 15), the mirror is nearly parallel to the incoming flow, so frontal blockage is minimal and the dominant aerodynamic features are driven by mirror thickness and the support system. Boundary layers develop on both sides of the mirror and separate primarily at the edges, producing relatively small separation vortices, while the pylon generates a comparatively regular wake that decays downstream. The resulting flow field is simpler than at 30–90°.
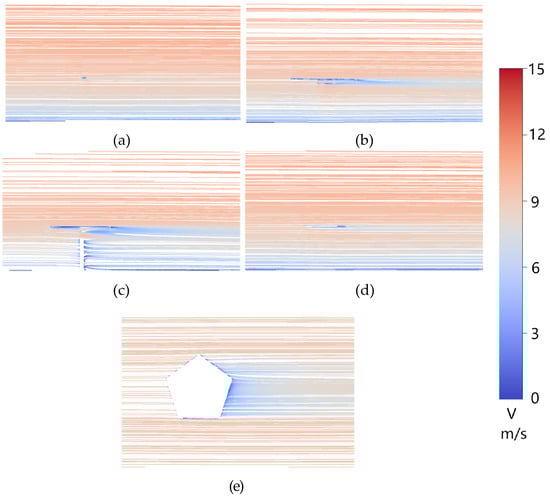
Figure 15.
Velocity field and streamlines at α = 00°.(a) Section A. (b) Section B. (c) Section C. (d) Section D. (e) Section E.
Accordingly, the reflective-surface pressure field at 0° is smooth and exhibits weak gradients, with no pronounced positive-pressure or suction zones. The supporting-surface pressure is still influenced by separation around the support, but the overall wake-induced suction remains less structured and less intense than at higher pitch angles. This indicates that, in the stow attitude, wind-load mitigation can be effectively pursued through edge/thickness refinement and support-geometry optimization, since these elements control the dominant separation sources.
Across 30–90°, the streamline sections clarify a consistent symmetry property: vertical sections (A–D) frequently show vertical asymmetry in recirculation, whereas horizontal sections (E–G) preserve an approximately lateral symmetry in the dominant vortex system. This explains why the mean pressure fields on both reflective and supporting surfaces remain largely laterally symmetric but vary strongly in the vertical direction. Therefore, EMC is governed primarily by vertical pressure asymmetry and the eccentricity of the resultant force about the elevation axis, not simply by the magnitude of the normal load. By contrast, AMC remains relatively small because the laterally symmetric mean pressure field yields limited lateral offset of the resultant force; geometric planform asymmetry does not automatically translate into a laterally asymmetric mean pressure distribution. This interpretation is consistent with observations reported by Emes et al. [30]. A more detailed discussion of these mechanisms and their implications will be provided in Section 4.1.
Meanwhile, the key vortex metrics for all cases, including the vortex core location and characteristic size (in C section), were extracted and are summarized in Table 5; the definition of the global flow-field coordinate system is provided in Figure 5.
Table 5.
Summary of key vortex metrics for all cases.
Table 5 indicates that as the angle of attack increases from 30° to 60° and 90°, the dominant vortex core moves markedly downstream, shifting from (−0.15, 0.38) at 30° to (0.62, 0.82) at 60° and (0.71, 0.61) at 90°. The core is also located at a generally higher position, suggesting stronger separation and an earlier, more stable formation of the near-wake vortex. Consistently, the characteristic size increases from 0.09 at 30° to 0.23 at 60° and further to 0.26 at 90°, implying an expanded vortical region and a more energetic wake. For 0°, no stable vortex core/size is extracted, indicating a nearly symmetric or weakly separated wake, which agrees with the absence of a dominant shedding frequency in the spectrum.
3.2. Comparative Analysis and Discussion
First, the power spectral density (PSD) of the normal force coefficient was computed for each case to identify the dominant vortex-shedding frequency (Figure 16). The peak frequency in the spectrum was taken as the shedding frequency . Based on the extracted , the corresponding Strouhal number was then evaluated for each configuration, enabling a direct comparison with the results reported by Wolmarans et al. [18].
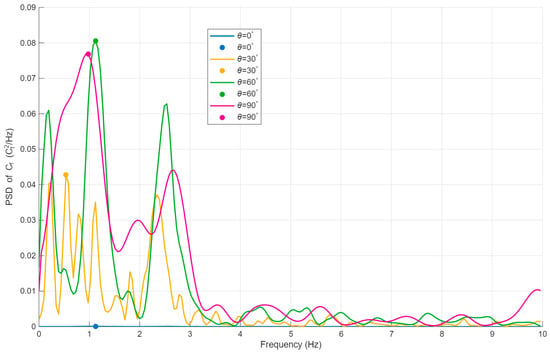
Figure 16.
Power spectral density (PSD) of the normal force coefficient at different pitch angles.
The Strouhal number was calculated as
where is the vortex-shedding frequency determined from the spectral peak, L is the reference length, typically taken as , and is the incoming free-stream velocity.
The computed shedding frequencies and the corresponding Strouhal numbers for all cases are summarized in Table 6.
Table 6.
Shedding frequencies and Strouhal numbers.
As summarized in Table 4, no distinct dominant shedding frequency is observed at 0°, and the Strouhal number increases from 30° to an intermediate incidence before decreasing toward 90°. At 0°, the wake remains nearly symmetric and separation is weak; moreover, disturbances from the upper and lower shear layers can partially cancel, so the spectrum does not exhibit a clear dominant shedding peak. As the angle of attack rises to moderate values (30–60°), separation intensifies, the shear layers roll up more rapidly, and the vortex-formation length shortens, which increases the shedding frequency and therefore the Strouhal number. When the incidence approaches 90°, the wake broadens and coherent vortex structures weaken; the characteristic vortex-formation scale increases, reducing the shedding frequency and thus lowering the Strouhal number.
Compared with Wolmarans et al. [18], the two geometries show close agreement at 60°: the quadrilateral heliostat sheds at 1.10 Hz, while the pentagonal heliostat sheds at 1.12 Hz. In contrast, at 90° the quadrilateral case yields a Strouhal number of 0.152, whereas the pentagonal case drops to 0.078. This indicates that at 60°, both heliostats share a similar dominant vortex-formation time scale, producing nearly identical shedding frequencies. However, under normal incidence (90°), geometric differences substantially alter wake coherence and the characteristic vortex-formation scale, leading to the pronounced divergence in Strouhal number.
Based on the analysis in Section 3.1, the variation in the flow field around the pentagonal heliostat with changing pitch angle is summarized. A comparative analysis is then conducted with the flow-field research on a quadrilateral heliostat (Table 7) by Li et al. [15].
Table 7.
Vortex Structure as a Function of Pitch Angle for a Pentagonal Heliostat, Vertical/Horizontal sections (V/H).
To better understand the vortex structure of the pentagonal heliostat and enable a direct comparison with its quadrilateral counterpart, the vortex structures were visualized using iso-surfaces of the Q-criterion, colored by the velocity magnitude (Figure 17). In addition, to facilitate a clear and intuitive comparison, a schematic of the main vortex structures, as shown in, was drawn based on the flow-field studies of quadrilateral heliostats by Li et al. [15] and Wolmarans et al. [18], together with the results shown in Figure 18.
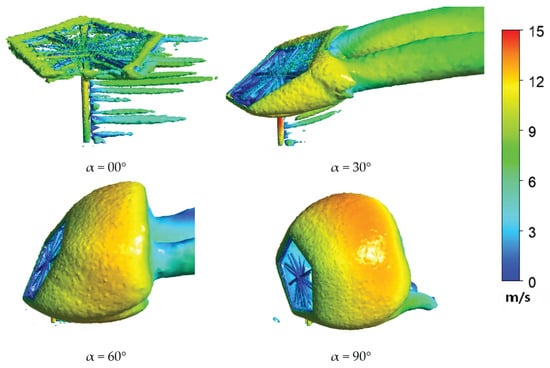
Figure 17.
Q-criterion iso-surfaces (Q = 100 s−2) colored by velocity.
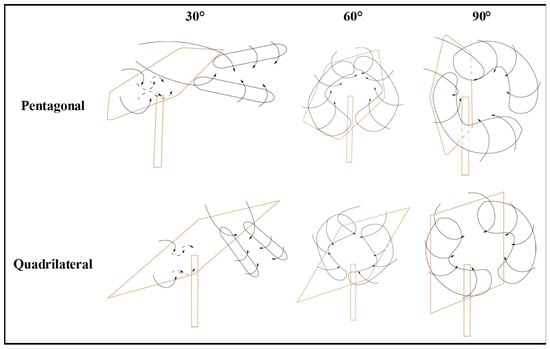
Figure 18.
Primary vortex structures in the flow fields around the pentagonal and quadrilateral [15,18].
At a pitch angle of 90°, the conventional quadrilateral heliostat generates a symmetric pair of vortices downstream, attributable to its geometric symmetry. Conversely, the intrinsic geometric asymmetry of the pentagonal heliostat disrupts this symmetry, leading to notable differences in the position, scale, and intensity of the downstream vortices.
At 60°, the quadrilateral mirror, characterized by a continuous top edge, produces a classical vortex pattern featuring a larger upper vortex and a smaller lower vortex. The presence of a distinctive corner at Section B in the pentagonal design interferes with the development of the upper airflow, resulting in a unique vortex system where the upper vortex is smaller and the lower vortex is larger.
Under the 30° pitch condition, the flow field in the immediate vicinity of the support structure closely resembles that of the traditional quadrilateral design. However, at sections further from the supports, the pentagonal geometry alters the flow separation points, inducing significant variations in the orientation and size of the vortices compared to the conventional configuration.
At the 0° stow position, the wake characteristics of both pentagonal and quadrilateral heliostats converge, exhibiting minimal differences. This convergence is primarily due to the dominant influence of similar support structures and mirror thickness, suggesting that the specific planform shape exerts a reduced effect on the flow under near-horizontal conditions.
In summary, the distinctive asymmetric geometry of the pentagonal mirror—particularly its two prominent corners located at the highest and lowest points—fundamentally modifies vortex symmetry, the locations of flow separation, and the development of the upper airflow, thereby significantly impacting the surrounding flow structure. These corners serve as fixed points for flow separation, triggering earlier boundary layer detachment and resulting in pronounced differences in the formation and scale of separation vortices relative to the quadrilateral design, especially at elevation angles of 90° and 60°. Further research into the associated wind load characteristics is recommended to establish a theoretical foundation for optimizing future non-traditional heliostats.
4. Wind Loads
Firstly, a comparative analysis was performed between the simulated case at a 60° pitch angle with 0° wind azimuth angle and published experimental data from the literature [19]. The literature study was based on field measurements. The comparison of the overall mean wind pressure distribution shows similar patterns with minor quantitative discrepancies. Key force and moment coefficients were further compared. The normal force coefficient (NFC), elevation moment coefficient (EMC), and azimuth moment coefficient (AMC) from the present study and the reference are 1.5 vs. 1.75, 0.02 vs. 0.07, and 0 vs. 0.02, respectively. While the NFC and AMC align closely, a noticeable difference exists in the EMC. This discrepancy is primarily attributed to the simplification of the support structure in the current numerical model, which affects the predicted pressure distribution on the supporting surfaces [31,32].
In calculating the NFC, EMC, and AMC, in addition to applying Equations (9)–(11), the integrated forces and moments were computed through surface integration of pressure and shear stress distributions. This integration approach is similar to that employed by Emes et al. [30], and therefore the use of consistent calculation formulas facilitates more meaningful comparative analysis in subsequent studies. This method was used to calculate the mean normal force coefficient, mean elevation moment coefficient, and mean azimuth pressure coefficient, which are compiled in Table 8. As shown in Table 5, the mean normal force coefficient reaches its maximum value of 1.8017 at a pitch angle of 90° (mirror vertical), mainly because the windward projected area is maximized and the flow is dominated by windward positive pressure. By contrast, at a pitch angle of 0° (mirror horizontal, i.e., the survival/stow orientation), the coefficient becomes negative (−0.0372) due to an upper–lower surface pressure difference that induces upward aerodynamic lift. Consequently, the load mechanism shifts from horizontal thrust dominance to vertical lift dominance, and this lift reduces the effective self-weight and overturning resistance, which is unfavorable for wind safety. Therefore, mitigating or counteracting the lift in the stow configuration is beneficial. Meanwhile, the sign reversal or extrema of the Elevation Moment Coefficient (EMC) in the intermediate pitch-angle range (30–60°) are mainly associated with a marked shift of the aerodynamic center of pressure along the mirror surface as the pressure distribution reorganizes under enhanced separation and leeward suction. In addition, the Mean Azimuth Moment Coefficient (AMC) remains close to zero because of the loading symmetry of the mirror, which leads to near-cancellation of lateral contributions.
Table 8.
Mean Shape Coefficient and Standard Deviation of the Shape Coefficient.
4.1. Variation in the Mean Pressure Coefficient with Pitch Angle
Following the methodological verification described above, to obtain a more comprehensive understanding of the heliostat’s aerodynamic behavior under typical operating conditions, this study conducts a systematic analysis of the heliostat’s mean pressure coefficient distribution across a range of pitch angles.
The mean pressure coefficient distributions on the reflective surface indicate that (Figure 19), as the pitch angle increases, both the pressure gradients and the locations of high-pressure regions evolve systematically. At a pitch angle of 0°, the pressure field is relatively smooth, with weak in-plane gradients and no pronounced regions of either positive pressure or suction. When the pitch angle increases to 30°, a continuous and distinct windward positive-pressure band develops, and the vertical asymmetry of the distribution becomes markedly stronger, resulting in a sharp increase in the in-plane pressure gradient. At 60°, the windward stagnation point shifts upward relative to the 30° case, and the positive-pressure band expands and becomes more concentrated. This behavior indicates intensified windward stagnation and a further increase in the vertical non-uniformity of the overall pressure field. Notably, from 0° to 60°, the pressure distribution remains essentially symmetric in the lateral direction. At 90°, the reflective surface is dominated by a broad region of positive pressure and a more globally symmetric distribution. As the eccentricity of the pressure field decreases, a higher load magnitude does not necessarily correspond to the maximum moment coefficient.
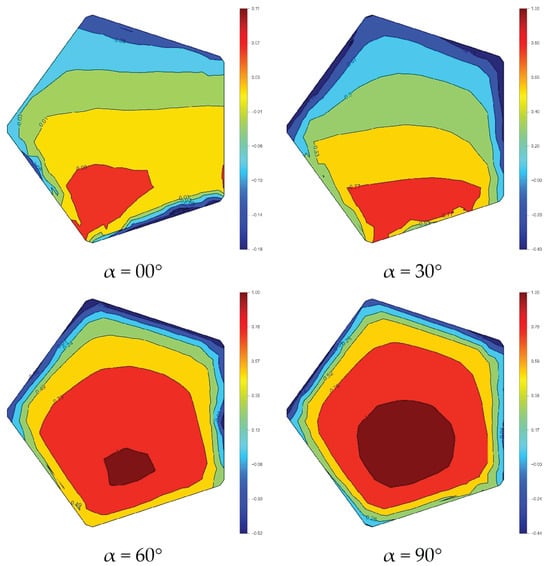
Figure 19.
Mean pressure coefficient distribution on the reflective surface.
Compared with the reflective surface (Figure 20), the supporting surface is more strongly governed by wake separation and recirculation. Its mean pressure is therefore predominantly negative (suction), exhibiting a more scattered spatial pattern and greater sensitivity to pitch angle. In general, as the pitch angle increases, both the intensity and the spatial extent of suction regions on the supporting surface tend to increase. However, at a pitch angle of 90°, the wake becomes more globally symmetric, and the pressure distribution on the supporting surface correspondingly becomes more regular, thereby reducing in-plane non-uniformity. The streamline plots further clarify the underlying mechanism: for pitch angles from 30° to 90°, sections A–D show that the vortices on the supporting surface are vertically asymmetric, whereas sections E–F indicate that the vortex structures remain laterally symmetric. Consequently, for the 30–90° cases, the mean pressure coefficient distributions on the supporting surface are asymmetric in the vertical direction while remaining essentially symmetric in the lateral direction.
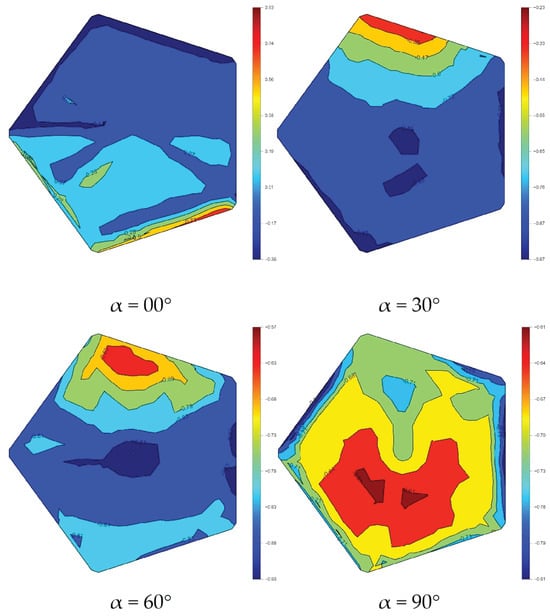
Figure 20.
Mean pressure coefficient distribution on the supporting surface.
It should be emphasized that the elevation moment coefficient (EMC) is not determined solely by the magnitude of wind pressure (or normal load); instead, it is governed primarily by the asymmetry of the pressure distribution and the eccentricity of the resultant force relative to the rotation axis. Consequently, the 30–60° conditions are more prone to producing a strongly asymmetric combination of “high windward positive pressure and strong leeward suction,” yielding a more eccentric resultant force and thus larger moments. By comparison, although the 90° case exhibits a higher overall pressure level, the more symmetric distribution can cause the EMC to decrease.
Furthermore, the relatively small azimuth moment coefficient (AMC) can be explained as follows: although the pentagonal heliostat is inherently more laterally asymmetric in geometry, the mean pressure distributions on both the reflective surface and the supporting surface at each pitch angle remain closer to lateral symmetry, with variations dominated mainly by vertical gradients. As a result, the lateral offset of the resultant force is insufficient to generate a large AMC. In other words, geometric asymmetry does not necessarily translate into a laterally asymmetric mean pressure field, and AMC is controlled more directly by the latter. These findings are consistent with the results reported by Emes et al. [30].
To further analyze this effect, low AMC is most likely when the inflow is aligned with the reference direction (β = 0°). This trend may be sensitive to inflow conditions. In particular, yaw (azimuth angle), turbulence intensity, and wind-direction variability/non-uniform inflow can alter separation and shear-layer development, shift vortex cores and suction regions laterally, and thereby increase AMC.
4.2. Comparison of the Mean Shape Coefficient
As established in Section 3.2, notable disparities exist in the flow-field structures between pentagonal and quadrilateral heliostats. This study utilizes wind tunnel experimental data from two distinct quadrilateral heliostats with differing projected areas, sourced from references [27,33], to perform a systematic comparative analysis alongside numerical simulation results for the pentagonal heliostat under analogous conditions [27], as presented in Figure 16.
Figure 21 illustrates the variation in the mean shape coefficient with pitch angle for the three heliostat working attitudes. The error bands are defined as ±3σ (three times the standard deviation of the time-series coefficient data at each pitch angle), representing the characteristic range of statistical fluctuation to satisfy engineering reliability considerations [34,35,36].
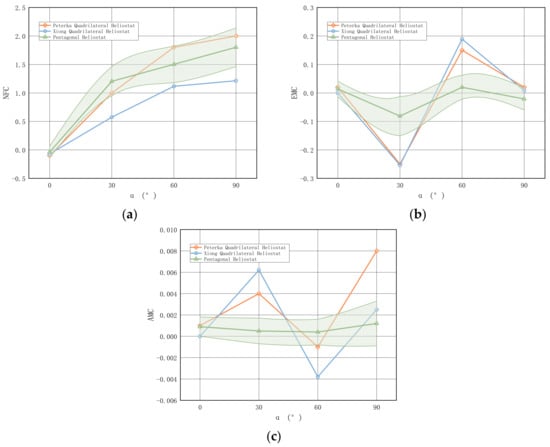
Figure 21.
Comparison of aerodynamic loads between pentagonal and quadrilateral heliostats (The shaded area represents the error band). (a) Mean Normal Force Coefficient [33,37]. (b) Mean Elevation Moment Coefficient [33,37]. (c) Mean Azimuth Moment Coefficient [33,37].
As the pitch angle increases from 0° to 90°, the NFC for all models shows a consistent upward trend. This behavior aligns with physical expectations, as the wind-projected area of the heliostat increases with pitch angle, resulting in enhanced wind load effects. While the pentagonal design exhibits a similar trend in NFC variation to the traditional quadrilateral heliostat across most attitudes—indicating comparable aerodynamic behavior—its NFC values are notably higher, particularly at pitch angles of 60° and 90°.
The elevation moment coefficient (EMC) exhibits broadly similar pitch-angle dependence across the models, while its magnitude and sign vary markedly. These variations are primarily controlled by how the wind loads are apportioned between the upper and lower regions of the heliostat, i.e., by the vertical eccentricity of the resultant aerodynamic force.
At pitch angles of 0° and 90°, EMC approaches zero for different physical reasons. At 0°, the projected windward area is minimal, leading to weak pressure levels and hence a negligible moment. At 90°, the flow-field results indicate that the pressure contributions from the reflective and supporting surfaces nearly balance about the elevation axis. In particular, the stagnation region on the reflector is located relatively low, while the upper part of the supporting surface experiences a stronger suction (more negative pressure), and the combined effect yields an approximately zero net elevation moment.
At 30° and 60°, the pentagonal heliostat produces substantially lower EMC than the quadrilateral configuration. At 60° (Figure 13), the pentagonal mirror develops a wake/vortex arrangement that is opposite to that of the quadrilateral case. Although the upper portion of the reflector is exposed to higher loads under the atmospheric boundary-layer profile, the larger recirculation on the lower supporting surface enlarges the suction region and counterbalances the upper loading, driving EMC toward zero. At 30°, the quadrilateral heliostat’s inherent geometric symmetry can promote a more strongly imbalanced upper–lower loading under a vertically sheared inflow, resulting in a considerably larger EMC than that of the pentagonal heliostat.
The azimuth moment coefficient (AMC) remains small for all models. The pentagonal heliostat shows slightly lower AMC at 30° and 60°, which is consistent with its lateral pressure symmetry. The primary reason is that, although the heliostat geometry is laterally asymmetric, the inlet boundary condition prescribes a laterally uniform inflow. Consequently, the mean pressure coefficient remains approximately symmetric in the lateral direction. By contrast, the AMC of the quadrilateral heliostat remains small but is slightly higher than that of the pentagonal heliostat, in agreement with the experimental observations reported by Peterka et al. and Xiong et al. [33,37].
Overall, the pentagonal heliostat follows a similar normal force coefficient (NFC) trend to the quadrilateral design but generally attains a higher magnitude, especially at large pitch angles. From a structural standpoint, its center–radial support concept—replacing the conventional torque-tube/cantilever serial load path—facilitates more direct load transfer to the pylon, shortens the transmission path, reduces edge deformation, and improves global stiffness [33,37]. Aerodynamically, the pronounced reduction in EMC at the critical operating attitudes (30° and 60°) indicates an effective mitigation of wind-induced elevation moment fluctuations. It also suggests potential for further aerodynamic refinement.
5. Conclusions
This research presents a systematic investigation into the flow field characteristics and aerodynamic loading of a pentagonal heliostat subjected to complex wind conditions employing Computational Fluid Dynamics (CFD) methodologies. The study examines four representative pitch angles—0°, 30°, 60°, and 90°—and benchmarks the findings against those obtained for a conventional quadrilateral heliostat.
Pitch angle governs the wake and pressure-field evolution. From 0° to 90°, the flow transitions from a weak-blockage regime dominated by mirror thickness and the support system to a canonical bluff-body wake at 90°, which produces broad windward stagnation pressure on the reflective surface and wake-induced suction on the supporting surface.
The 30–60° conditions represent the most pronounced three-dimensional and interference-driven regimes. At 60°, two unequal vortices form behind the mirror (a stable large near-ground recirculation and a smaller upper vortex) due to the reduced projected area and enhanced ground confinement; the pentagonal corner near Section B acts as a separation trigger that modifies upper shear-layer development. At 30°, the flow shifts from mirror-dominated behavior to a coupled mirror–support interference regime, yielding multi-scale, strongly unsteady wake structures and highly pitch-sensitive suction patterns on the supporting surface.
Mean pressure fields remain laterally quasi-symmetric despite the pentagonal planform, and vertical non-uniformity controls EMC. Across 30–90°, vertical sections (A–D) show notable vertical asymmetry in recirculation, while horizontal sections (E–G) preserve approximate lateral symmetry of the dominant vortex system. Consequently, the mean pressure coefficient distributions on both surfaces are largely laterally symmetric but strongly non-uniform in the vertical direction, so EMC is governed mainly by vertical pressure asymmetry and the eccentricity of the resultant force about the elevation axis rather than by load magnitude alone.
Aerodynamic coefficients show increasing NFC with pitch, reduced EMC for the pentagonal design at critical operating angles, and small AMC overall. NFC increases from 0° to 90° for all models as the projected area and windward positive pressure grow, with the pentagonal heliostat generally exhibiting larger NFC at higher pitch angles. By contrast, the pentagonal heliostat yields substantially lower EMC than the quadrilateral configuration at 30° and 60° because the lower supporting-surface recirculation/suction counterbalances the higher upper loading under the boundary-layer profile. AMC remains small for all cases; moreover, under a laterally uniform inflow, the laterally quasi-symmetric mean pressure field limits the lateral offset of the resultant force, thereby constraining AMC.
Author Contributions
E.H.: Conceptualization, Methodology, Investigation, Data curation, Formal analysis, Visualization, Writing—original draft. Y.C.: Conceptualization, Methodology, Validation, Funding acquisition, Writing—review and editing. Y.L.: Funding acquisition, Writing—review and editing. K.D.: Supervision, Validation, Funding acquisition, Writing—review and editing. P.C.: Writing—review and editing. All authors have read and agreed to the published version of the manuscript.
Funding
This research was funded by the National Natural Science Foundation of China (No. 52308514); Natural Science Foundation of Sichuan (No. 2024NSFSC0931).
Data Availability Statement
The data presented in this study are available from the corresponding author on reasonable request.
Conflicts of Interest
The authors declare no conflicts of interest.
References
- Ji, B.; Xing, P.; Xu, F.; Xiong, Q.; Qiu, P.; Liu, Q.; Tan, D. Transient Evaluation of Wind-Induced Vibration Response of Heliostat Under Downburst. Energy Technol. 2023, 11, 2300156. [Google Scholar] [CrossRef]
- Zuo, H.; Tan, J.; Wei, K.; Huang, Z.; Zhong, D.; Xie, F. Effects of different poses and wind speeds on wind-induced vibration characteristics of a dish solar concentrator system. Renew. Energy 2021, 168, 1308–1326. [Google Scholar] [CrossRef]
- Ummadisingu, A.; Soni, M.S. Concentrating solar power—Technology, potential and policy in India. Renew. Sustain. Energy Rev. 2011, 15, 5169–5175. [Google Scholar] [CrossRef]
- Ahmadi, M.H.; Ghazvini, M.; Sadeghzadeh, M.; Nazari, M.A.; Kumar, R.; Naeimi, A.; Ming, T. Solar power technology for electricity generation: A critical review. Energy Sci. Eng. 2018, 6, 340–361. [Google Scholar] [CrossRef]
- Thalange, V.C.; Dalvi, V.H.; Mahajani, S.M.; Panse, S.V.; Joshi, J.B.; Patil, R.N. Design, optimization and optical performance study of tripod heliostat for solar power tower plant. Energy 2017, 135, 610–624. [Google Scholar] [CrossRef]
- Yemenici, O.; Aksoy, M.O. An experimental and numerical study of wind effects on a ground-mounted solar panel at different panel tilt angles and wind directions. J. Wind. Eng. Ind. Aerodyn. 2021, 213, 104630. [Google Scholar] [CrossRef]
- He, X.-H.; Ding, H.; Jing, H.-Q.; Zhang, F.; Wu, X.-P.; Weng, X.-J. Wind-induced vibration and its suppression of photovoltaic modules supported by suspension cables. J. Wind. Eng. Ind. Aerodyn. 2020, 206, 104275. [Google Scholar] [CrossRef]
- Benammar, S.; Tee, K.F. Structural reliability analysis of a heliostat under wind load for concentrating solar power. Sol. Energy 2019, 181, 43–52. [Google Scholar] [CrossRef]
- Ji, B.; Xiong, Q.; Xing, P.; Qiu, P. Dynamic response characteristics of heliostat under hail impacting in Tibetan Plateau of China. Renew. Energy 2022, 190, 261–273. [Google Scholar] [CrossRef]
- Ahmad, N.; Badar, H.M.W.; Mughal, K.H.; Ali, H.U.; Waqas, M. Modelling and analysis of wind loading effects for heliostat mirrors using computational fluid dynamics. Int. J. Renew. Energy Dev. 2025, 14, 1110–1124. [Google Scholar] [CrossRef]
- Mahfoud, O.; Danane, F.; Debbache, M.; Karoua, H.; Takilalte, A.; Bouaichaoui, S. Wind Action Effects on Heliostat—CFD and FEM Study. In IOP Conference Series: Earth and Environmental Science; IOP Publishing: Bristol, UK, 2022; Volume 1048, p. 012007. [Google Scholar] [CrossRef]
- Lu, C.L.; Li, Z.N.; Li, Q.S. Computational fluid dynamics numerical simulation of wind effects on heliostats. J. Nat. Disasters 2010, 19, 185–191. Available online: https://www.doc88.com/p-5943937800873.html?utm_source=chatgpt.com (accessed on 12 November 2025).
- Lu, C.L.; Chen, J.T.; Chen, J.K.; Wang, Q. Wind induced response analysis of heliostat structure based on LES and DES. J. Vib. Shock. 2022, 41, 298–306. Available online: https://jvs.sjtu.edu.cn/CN/Y2022/V41/I11/298 (accessed on 12 November 2025).
- Zhu, C.Y.; Li, Z.N.; Wang, Y.C. Study on pulsating wind pressure characteristics of large scale heliostats. Acta Energiae Solaris Sin. 2021, 42, 199–206. Available online: https://www.tynxb.org.cn/CN/Y2021/V42/I7/199?utm_source=chatgpt.com (accessed on 12 November 2025).
- Li, W.; Yang, F.; Niu, H.; Patruno, L.; Hua, X. Wind loads on heliostat tracker: A LES study on the role of geometrical details and the characteristics of near-ground turbulence. Sol. Energy 2024, 284, 113041. [Google Scholar] [CrossRef]
- Poulain, P.; Craig, K.J.; Meyer, J.P. Transient simulation of an atmospheric boundary layer flow past a heliostat using the Scale-Adaptive Simulation turbulence model. J. Wind. Eng. Ind. Aerodyn. 2021, 218, 104740. [Google Scholar] [CrossRef]
- Yin, X.; Ji, B.; Liu, G.; Qu, W.; Zhang, X. Effect of support structures on the flow field characteristics around a heliostat. Renew. Energy Resour. 2019, 37, 40–45. [Google Scholar] [CrossRef]
- Wolmarans, J.R.; Craig, K.J. One-way fluid-structure interaction of a medium-sized heliostat using scale-resolving CFD simulation. Sol. Energy 2019, 191, 84–99. [Google Scholar] [CrossRef]
- Blume, K.; Roeger, M.; Pitz-Paal, R. Full-scale investigation of heliostat aerodynamics through wind and pressure measurements at a pentagonal heliostat. Sol. Energy 2023, 251, 337–349. [Google Scholar] [CrossRef]
- Jafari, A.; Ghanadi, F.; Arjomandi, M.; Emes, M.J.; Cazzolato, B.S. Correlating turbulence intensity and length scale with the unsteady lift force on flat plates in an atmospheric boundary layer flow. J. Wind. Eng. Ind. Aerodyn. 2019, 189, 218–230. [Google Scholar] [CrossRef]
- Merarda, H.; Aksas, M.; Andrianne, T. Shape effects on aerodynamic loading of heliostats. Mech. Ind. 2020, 21, 614. [Google Scholar] [CrossRef]
- Hayden, A.; Hefner, C.; Gillespie, J.; Section, A.; Lowe, T.; AIAA. A Computational and Experimental Analysis of Vortex Shedding from Complex Turning Vanes. In AIAA SCITECH 2023 Forum; AIAA Science and Technology (SciTech) Forum: National Harbor, MD, USA, 2023; p. 2023-0049. [Google Scholar]
- Castellani, F.; Eltayesh, A.; Natili, F.; Tocci, T.; Becchetti, M.; Capponi, L.; Astolfi, D.; Rossi, G. Wind Flow Characterisation over a PV Module through URANS Simulations and Wind Tunnel Optical Flow Methods. Energies 2021, 14, 6546. [Google Scholar] [CrossRef]
- Launder, B.E.; Spalding, D.B. Lectures in Mathematical Models of Turbulence; Academic Press Inc.: San Diego, CA, USA, 1972. [Google Scholar]
- Baetke, F.; Werner, H.; Wengle, H. Numerical-simulation of turbulent-flow over surface-mounted obstacles with sharp edges and corners. J. Wind. Eng. Ind. Aerodyn. 1990, 35, 129–147. [Google Scholar] [CrossRef]
- Wang, Y.G. Study on wind load characteristics and wind-induced response of solar power tower heliostat structure. J. Vib. Shock 2022, 41. [Google Scholar]
- Marais, M.D.; Craig, K.J.; Meyer, J.P. Computational flow optimization of heliostat aspect ratio for wind direction and elevation angle. Energy Procedia 2015, 69, 148–157. [Google Scholar] [CrossRef]
- Huang, M.; Ferreira, C.; Sciacchitano, A.; Scarano, F. Wake scaling of actuator discs in different aspect ratios. Renew. Energy 2022, 183, 866–876. [Google Scholar] [CrossRef]
- Parnaudeau, P.; Carlier, J.; Heitz, D.; Lamballais, E. Experimental and numerical studies of the flow over a circular cylinder at Reynolds number 3900. Phys. Fluids 2008, 20, 085101. [Google Scholar] [CrossRef]
- Emes, M.J.; Jafari, A.; Ghanadi, F.; Arjomandi, M. Hinge and overturning moments due to unsteady heliostat pressure distributions in a turbulent atmospheric boundary layer. Sol. Energy 2019, 193, 604–617. [Google Scholar] [CrossRef]
- Pfahl, A.; Coventry, J.; Roger, M.; Wolfertstetter, F.; Vasquez-Arango, J.F.; Gross, F.; Arjomandi, M.; Schwarzboezl, P.; Geiger, M.; Liedke, P. Progress in heliostat development. Sol. Energy 2017, 152, 3–37. [Google Scholar] [CrossRef]
- Belaid, A.; Filali, A.; Gama, A.; Bezza, B.; Arrif, T.; Bouakba, M. Design optimization of a solar tower power plant heliostat field by considering different heliostat shapes. Int. J. Energy Res. 2020, 44, 11524–11541. [Google Scholar] [CrossRef]
- Peterka, J.A.; Derickson, R.G. Wind Load Design Methods for Ground-Based Heliostats and Parabolic Dish Collectors; (SAND92-7009); Sandia National Laboratories: Albuquerque, NM, USA, 1992. [CrossRef]
- Emes, M.; Arjomandi, M.; Ghanadi, F.; Kelso, R. Effect of turbulence characteristics in the atmospheric surface layer on the peak wind loads on heliostats in stow position. Sol. Energy 2017, 157, 284–297. [Google Scholar] [CrossRef]
- Emes, M.; Ghanadi, F.; Arjomandi, M.; Kelso, R. Investigation of peak wind loads on tandem heliostats in stow position. Renew. Energy 2018, 121, 548–558. [Google Scholar] [CrossRef]
- Emes, M.; Jafari, A.; Arjomandi, M. Wind Load Design Considerations for the Elevation and Azimuth Drives of a Heliostat. In Proceedings of the AIP Conference Proceedings, International Conference on Concentrating Solar Power and Chemical Energy Systems (SolarPACES), Daegu, Republic of Korea, 1 October 2020; AIP Publishing LLC: Melville, NY, USA, 2020; p. 042020. [Google Scholar]
- Xiong, Q.; Li, Z.; Luo, H.; Zhao, Z. Wind tunnel test study on wind load coefficients variation law of heliostat based on uniform design method. Sol. Energy 2019, 184, 209–229. [Google Scholar] [CrossRef]


Disclaimer/Publisher’s Note: The statements, opinions and data contained in all publications are solely those of the individual author(s) and contributor(s) and not of MDPI and/or the editor(s). MDPI and/or the editor(s) disclaim responsibility for any injury to people or property resulting from any ideas, methods, instructions or products referred to in the content. |
© 2026 by the authors. Licensee MDPI, Basel, Switzerland. This article is an open access article distributed under the terms and conditions of the Creative Commons Attribution (CC BY) license.