Abstract
This study applies Computational Fluid Dynamics (CFD) and mathematical modeling to examine uterine and umbilical arterial blood flow during pregnancy, providing a more detailed understanding of hemodynamic changes across gestation. Statistical analysis of Doppler ultrasound data from a large cohort of more than 200 pregnant women (in the second and third trimesters) reveals significant increases in the umbilical arterial peak systolic velocity () between the 22nd and 30th weeks, while uterine artery velocities remain relatively stable, suggesting adaptations in vascular resistance during pregnancy. By combining the Navier–Stokes equations with Doppler ultrasound-derived inlet velocity profiles, we quantify several key fluid dynamics parameters, including time-averaged wall shear stress (), oscillatory shear index (), relative residence time (), Reynolds number (), and Dean number (), evaluating laminar flow stability in the uterine artery and secondary flow patterns in the umbilical artery. Since blood exhibits shear-dependent viscosity and complex rheological behavior, modeling it as a non-Newtonian fluid is essential to accurately capture pulsatile flow dynamics and wall shear stresses in these vessels. Unlike conventional imaging techniques, CFD offers enhanced visualization of blood flow characteristics such as streamlines, velocity distributions, and instantaneous particle motion, providing insights that are not easily captured by Doppler ultrasound alone. Specifically, CFD reveals secondary flow patterns in the umbilical artery, which interact with the primary flow, a phenomenon that is challenging to observe with ultrasound. These findings refine existing hemodynamic models, provide population-specific reference values for clinical assessments, and improve our understanding of the relationship between umbilical arterial flow dynamics and fetal growth restriction, with important implications for maternal and fetal health monitoring.
1. Introduction
Uterine arterial blood flow plays a critical role in ensuring the health of both mother and fetus during pregnancy. Impairments in uteroplacental circulation have been linked to serious complications such as preeclampsia and intrauterine growth restriction (IUGR), which affect approximately 5–8% of pregnancies worldwide and contribute significantly to perinatal morbidity and mortality. Understanding the hemodynamics of uterine and umbilical arteries is, therefore, vital for the early diagnosis and management of these conditions [1].
The uterine arteries supply oxygen-rich blood to the placenta, while the umbilical cord—composed of one vein and two arteries surrounded by Wharton’s jelly—facilitates nutrient and waste exchange between mother and fetus. Specifically, the umbilical vein delivers oxygen and nutrients to the fetus, while the umbilical arteries transport deoxygenated blood back to the placenta. The unique anatomical and physiological features of these vessels, including the helical geometry of the umbilical arteries, influence blood flow patterns and fetal development [2].
Computational fluid dynamics (CFD) has emerged as a powerful tool to investigate the complex blood flow characteristics within these arteries. Rooted in the mathematical framework of the Navier–Stokes equations, CFD models can capture the influence of vessel geometry, blood rheology, and flow conditions on hemodynamic parameters [3]. In this study, we specifically use Doppler ultrasound data acquired from Greek pregnant women to construct image-based geometries for CFD analysis, thereby linking physiological measurements with engineering simulations. Doppler ultrasound, the imaging modality employed here, is widely used clinically to monitor blood flow velocities non-invasively, providing critical input data for modeling.
Previous research using CFD has demonstrated important insights into maternal-fetal circulation. For example, uterine artery dilation and increased blood velocity correlate with better fetal nourishment [4]. Investigations into umbilical cord morphology have shown that hypercoiling reduces blood flow velocity, potentially impairing oxygen supply [5]. Additionally, the spiral configuration of the umbilical arteries contributes to fetal-maternal heat exchange and thermal regulation [2]. Despite these advances, gaps remain in integrating real-time clinical data within CFD frameworks and in studying distinct populations such as Greek pregnant women.
Our study contributes to this knowledge by combining Doppler ultrasound imaging with three-dimensional CFD simulations to assess critical hemodynamic indices, including Wall Shear Stress (), Oscillatory Shear Index (), and Relative Residence Time () [6,7,8,9]. Briefly, quantifies tangential forces exerted by blood flow on the vessel wall; measures directional changes in shear stress, related to disturbed flow and estimates the residence time of blood near the wall, linked to vascular risks. These parameters serve as markers for vascular health and potential predictors of pregnancy complications.
Importantly, this work analyzes a previously understudied population by using real-time Doppler ultrasound data from Greek pregnant women, offering novel insights with potential clinical implications. We frame our objectives as follows: (1) to develop CFD models using Doppler data from Greek pregnant women; (2) to characterize uterine and umbilical arterial hemodynamics with detailed flow and shear stress metrics; (3) to identify flow abnormalities associated with adverse pregnancy outcomes in this cohort. To clarify the overall workflow of the present study, a schematic diagram illustrating the main steps of the methodology is presented in Figure 1.
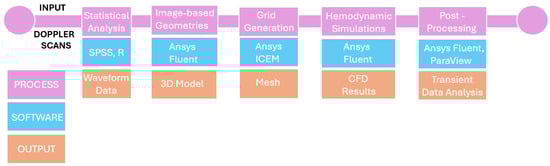
Figure 1.
Schematic overview of the study methodology.
2. Materials and Methods
2.1. Doppler Ultrasonography
Doppler ultrasonography provides important information on the dynamics of blood flow in the uterine and umbilical arteries in pregnant women. Its use enables measuring the changes in frequency of ultrasound waves reflected from moving blood cells, allowing for the determination of the velocity and direction of blood flow.
In the uterine artery, medical experts utilize the Doppler effect to evaluate maternal blood supply to the placenta, which is essential for fetal development and general health during pregnancy. In the umbilical artery, Doppler measurements assess fetal blood circulation and can indicate potential issues such as placental insufficiency or fetal distress. This noninvasive technique allows for real-time monitoring of blood flow, contributing to the early detection of potential complications and guiding clinical management. When combined with CFD, Doppler ultrasound data can be used to create detailed simulations of blood flow, offering a deeper understanding of the hemodynamic environment and enhancing diagnostic accuracy [10].
Pulsatility is an inherent characteristic of the cardiovascular system, determined by resistance differences across the arteriolar bed. This differential enables the potential energy stored in the elastic proximal arteries to be transmitted through the microcirculation at a mean pressure that ensures adequate perfusion. , also known as the Gosling index, is a calculated flow parameter in ultrasound, derived from the maximum, minimum, and mean Doppler frequency changes during a specific cardiac cycle. It is commonly used, along with , to evaluate resistance in a pulsatile vascular system [11]. When assessed as a derived flow parameter using pulsed wave Doppler, is calculated as,
, also known as the Pourcelot index, is one of the most commonly used vascular ultrasound indices due to its simplicity. It is influenced by both vascular resistance and vascular compliance. As the vessel narrows and the resistance to flow increases, also increases. It is a flow parameter calculated by ultrasound, derived from the maximum and minimum Doppler frequency shifts during a cardiac cycle. The formula to express is,
2.2. Statistical Analysis of Ultrasound Data
A large cohort of more than 200 pregnant women, during the second and third trimesters of pregnancy, was examined using Doppler ultrasound. Key parameters of umbilical and uterine arterial flows were statistically analyzed.
More specifically, four independent groups were studied, corresponding to the 21st, 22nd, 30th and 31st weeks of gestation, respectively. The goal was to assess any statistically significant differences among these weeks, primarily with respect to four markers: Doppler input velocities (, ), and . A significance level 5% was used and outliers, whose number did not exceed 10% of the category size, were removed. In each group, the four markers were adequately represented by a normal distribution. Furthermore, t-tests were performed to evaluate statistically significant differences between the groups. Figure 2 and Figure 3 present histograms and Q-Q plots related to the statistical analysis.
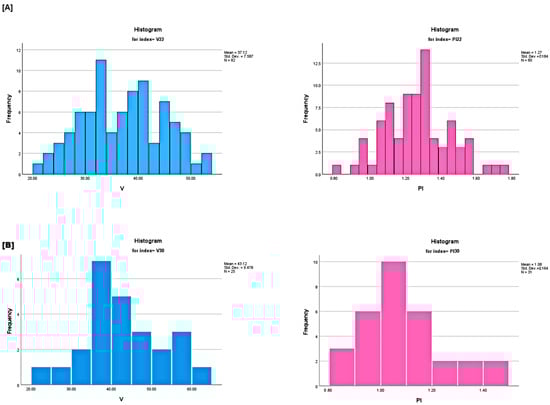
Figure 2.
(A) (left) and (right) histograms of the 22nd week group. (B) (left) and (right) histograms of the 30th week group. The presented graphs reflect on statistically significant variations.
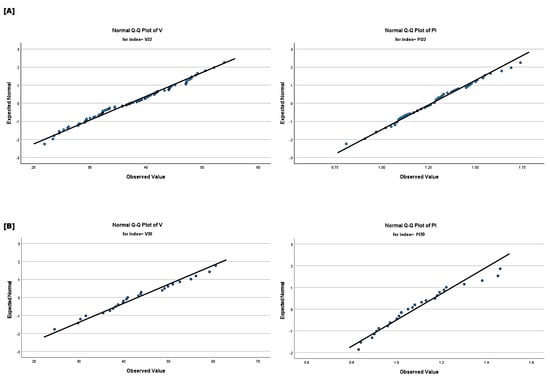
Figure 3.
(A) (left) and (right) normal Q−Q plots of the 22nd week group. (B) (left) and (right) normal Q−Q plots of the 30th week group.
To the best of our knowledge, this study presents the first analysis conducted using data from Greek pregnant women. It significantly contributes to region-specific knowledge, particularly in understanding how health outcomes vary between populations due to genetic, environmental, and health factors. Valuable insights are provided on how these variables influence maternal and fetal health in Greece. The results may serve as a baseline for Greek healthcare providers by setting local reference values for umbilical and uterine arterial flow parameters. Any slight difference between these standards and the international norms could make the findings particularly useful for practitioners in Greece. In addition, it could pave the way for more research on how lifestyle, diet and regional healthcare practice influence pregnancy outcomes, potentially inspiring larger studies in various regions of the country. The conducted analysis led to the following results:
- No statistically significant differences were observed in velocities between the 21st and 22nd week groups for both uterine and umbilical arteries. The same held for the velocities between the 30th and 31st week groups. Statistically significant differences were observed in umbilical artery velocities between the 22nd and 30th week groups. No such differences were observed in the velocities of the uterine arteries.
- Statistically significant reductions in biomarkers and were observed between the second-trimester groups for the uterine and umbilical arteries. No statistically significant differences were found in the two biomarkers of the uterine and umbilical arteries between the third trimester groups, indicating that the reductions observed during the second trimester tend to stabilize in the third trimester.
The formulae for and , which relate the four markers, can be used to derive correlations among these categories. Table 1 presents the percentiles in the two arteries, umbilical and uterine, at two different gestational weeks, the 22nd (Umb22, Ut22) and the 30th (Umb30, Ut30) weeks of pregnancy.

Table 1.
percentiles in the umbilical artery and uterine arteries.
The inlet velocities are presented as percentiles. The 0th percentile represents the minimum value of , while the 100th percentile represents the maximum value in the population. The 50th percentile (median) represents the middle value, where half the population has a below this value and the other half has values above. The 25th and 75th percentiles (lower and upper quartiles) provide an indication of the variability within the middle 50% of the population. For instance, 50% of women will have a between the 25th and 75th percentile. Analyzing the percentiles table provides the following crucial insights:
- The at 30 weeks is consistently higher than at 22 weeks across all percentiles. This indicates an increase in blood flow velocity in the umbilical artery as pregnancy progresses, which is biologically plausible given the growing demand for nutrients and oxygen as the fetus develops. The observed, statistically significant difference suggests that the increase in in the umbilical artery with advancing gestation represents a meaningful physiological change.
- Similarly, there is an increase in in the uterine artery from 22 weeks to 30 weeks across all percentiles, though the change is less pronounced compared to the umbilical artery. However, the lack of statistical significance suggests that while an increase in is observed in the uterine artery, this difference is not large or consistent enough across the population to be considered physiologically meaningful at a statistical level.
These percentile values help to assess whether the patient’s is within the normal range of their gestational age. Significant deviations, such as below the 25th percentile, could signal potential problems, such as fetal growth restriction or placental insufficiency, particularly if the umbilical artery is too low. Figure 4 presents the percentiles of the uterine and umbilical arteries.
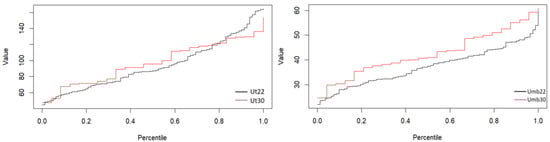
Figure 4.
Uterine (left) and umbilical (right) percentiles of the 22nd and 30th week groups.
2.3. Mathematical Modeling and Computational Approach
2.4. Simulations Properties
The present section discusses the flow setups of the uterine and umbilical blood flows. The geometries used are based on medical imaging of those vessels, obtained by ultrasound. As already mentioned, transient three-dimensional flows are considered, combining ultrasound data with an advanced CFD approach.
Focus is placed on the second trimester (21st and 22nd weeks) and the third trimester (30th and 31st weeks) of pregnancy. The results obtained from the statistical analysis suggest considering two simulations for the umbilical artery (one for the second trimester and one for the third trimester) and one simulation for the uterine artery (for the second trimester).
For the simulation of umbilical arterial flow corresponding to the second trimester, the maximum systolic velocity () was set to the average of the mean values recorded in the 21st and 22nd weeks of gestation. The same approach was applied to the end diastolic velocity (). Similarly, this method was used to determine the values in the third trimester. The modeling geometries are shown in Figure 5. No in-vivo experimental data are available for direct comparison in this study. However, we have validated our results by simulating a fully developed laminar flow in a circular tube and comparing the velocity profiles and pressure drops with theoretical solutions. The results show very good agreement, which supports the accuracy of our computational approach and numerical implementation.
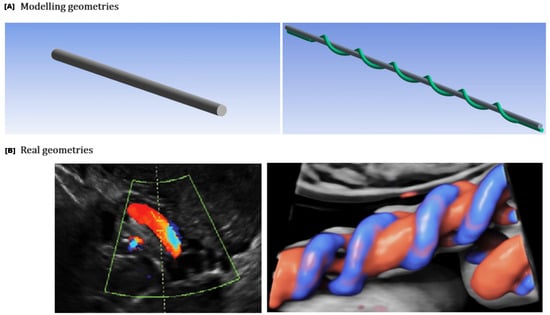
Figure 5.
The geometries representing the uterine and umbilical arteries (A) were modeled based on real anatomical structures observed in Doppler ultrasound images (B) (https://www.volusonclub.net/empowered-womens-health/umbilical-artery-doppler-assessment-a-how-to-guide/, accessed on 10 August 2024). A cylindrical pipe geometry was selected for the uterine artery, while a helical pipe geometry was chosen for the umbilical artery.
2.4.1. Uterine Artery
The uterine artery is mathematically modeled as a straight cylindrical pipe, of length mm and radius mm. Flow is considered laminar, incompressible, with kg/, and non-Newtonian, described by the Carreau model [14,15], where
with accounting for viscosity at shear rate , and representing zero-shear viscosity and infinite-shear viscosity, standing for the relaxation time constant and n denoting the power-law index. At low shear rates (), blood behaves like a Newtonian fluid with viscosity . At high shear rates (), viscosity approaches , following a power-law trend. The term
captures the transition between these states, accounting for shear-thinning. The values chosen were kg/(ms), kg/(ms), s and . A velocity periodic waveform,
extracted by interpolating on the ultrasound data and applying Fourier analysis (10 terms), is used as the inlet boundary condition. The period of the pulse is set to s, corresponding to . The no-slip boundary condition is considered on the arterial wall and a pressure outlet of 70 mmHg is set on its exit. It is worth noting that the exact value can vary based on individual physiology, yet pressures in this range support normal blood flow to the placenta and fetus. The arterial wall is modeled as rigid and stationary, focusing primarily on hemodynamics without accounting for wall motion.
To achieve numerical convergence and reduce computational resources and computing time, different mesh designs are utilized. The objective variables used to assess convergence were the mass average velocity and mass average absolute pressure within the vessels. These parameters were selected because they represent key hemodynamic quantities related to flow rate and pressure distribution, directly impacting the study’s physiological interpretations. Mesh refinement was performed iteratively until these variables changed by less than 1% between successive refinements. The chosen computational mesh consists of approximately hexahedral elements and nodes. The residual RMS error values for the mass and momentum components over four cardiac cycles ranged between and . ANSYS Fluent (2025 R1 Academic, 16.1 Academic) was used to study the uterine and umbilical arterial flows. Figure 6 illustrates the process followed to obtain the inlet waveforms from the ultrasound data. In Figure 7, a schematic outline of the uterine arterial flow setup is depicted, with the flow parameters determined through literature [11,16,17].
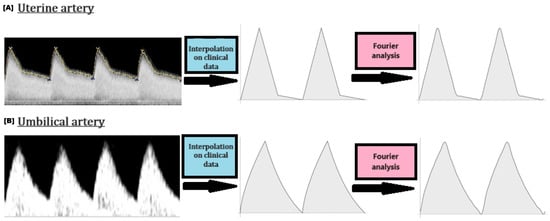
Figure 6.
Inlet velocity waveforms: From the obtained medical ultrasound data to periodic Fourier waveforms.
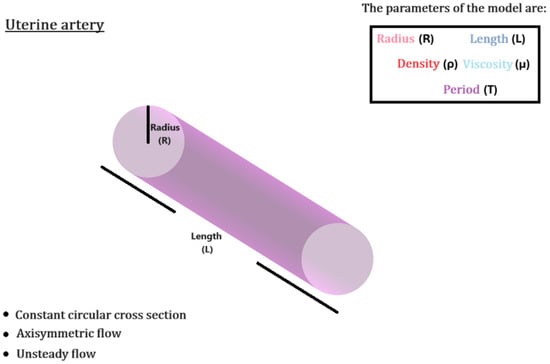
Figure 7.
Schematic outline of the uterine arterial flow setup, with the flow parameters determined through literature [11,16,17].
2.4.2. Umbilical Artery
Accounting for its helical structure, the umbilical artery is mathematically modeled as a helically coiled pipe of six turns of length L = 330 mm and radius R = 1.5 mm. The respected coil radius, , is set to 5 mm, accounting for the radius of the umbilical vein. The derived umbilical coiling index, , indicates a physiological coiling pattern. The helical structure is thought to offer flexibility and resilience, enabling the umbilical cord to endure movements and avoid kinking or blockage, which is essential for maintaining consistent blood flow between the fetus and the placenta. The arterial wall is assumed to be rigid, the same as in the uterine artery.
The velocity inlet is again expressed in the form of (10), with the pulse period being s, providing with . The latter is indicative of harmonized hemodynamics between the mother and fetus. The pressure outlet is now set at 20 mmHg, with the reference pressure set at 5 mmHg, simulating the intrauterine environment [5]. This is significantly lower than adult systemic pressures, but is appropriate for fetal circulation. The no-slip condition is again imposed. As in the uterine artery, the flow is considered laminar, incompressible and non-Newtonian, under the same density and viscosity assumptions. The mesh independence test was conducted with a hexahedral grid, in the same manner as in the uterine artery, consisting of approximately elements and nodes. The RMS errors remained between and . Figure 8 shows a schematic outline of the umbilical arterial flow setup, with flow parameters determined through the literature [2,18,19].
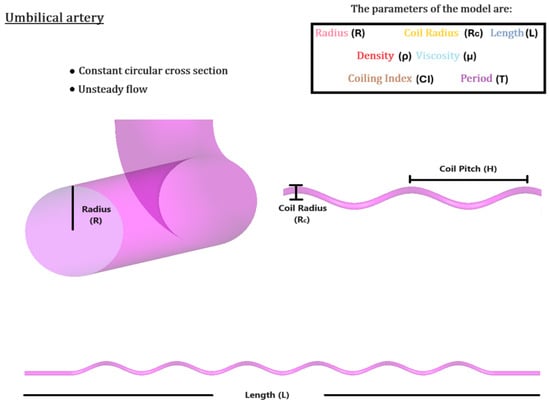
Figure 8.
Schematic outline of the umbilical arterial flow setup, with the flow parameters determined through literature [2,18,19].
3. Results
3.1. Uterine Arterial Flow
The blood flow in the uterine artery exhibits laminar characteristics, as indicated by the Reynolds number (). This type of flow, devoid of turbulence, is ideal under physiological conditions, particularly during pregnancy, as it ensures an efficient and steady blood supply. In laminar flow, the maximum velocity occurs in the center of the artery, while the velocity near the vessel wall is lower. This distribution follows a typical cylindrical vessel parabolic velocity profile. Furthermore, the pressure drop across the uterine artery can be explained by the Hagen–Poiseuille law. This relationship is crucial in understanding the efficiency of blood supply through the artery. Table 2 provides the CFD-obtained measurements for the uterine artery, corresponding to the second trimester of pregnancy (21–22 weeks).
Table 2.
CFD-obtained measurements for the uterine artery (21–22 weeks).
and indicate that the uterine artery supplies an increased volume of blood, which is crucial during the second trimester to support the growing placenta and fetus. further confirms that the uterine artery provides a stable blood supply with minimal pressure fluctuations and low velocity variation.
reflects the average pulsatility of blood flow, where a lower PI suggests continuous and stable perfusion—optimal for fetal growth. This stability ensures a smooth blood supply, without significant pressure variations between heartbeats. measures vascular resistance in the uterus, which remains within an optimal range, preventing excessive pressure on blood vessels while maintaining continuous flow. Pregnancy naturally reduces arterial resistance to accommodate the increasing blood supply needed for fetal development.
As pregnancy progresses, blood vessels adjust to maintain steady flow, preventing complications such as restriction of fetal growth. The balance between vascular resistance and continuous perfusion is essential for a healthy intrauterine environment, ensuring efficient nutrient and oxygen exchange while minimizing shear stress on vessel walls. These physiological changes highlight the dynamic nature of maternal circulation and the importance of stable uteroplacental perfusion for fetal development. Figure 9 presents the uterine arterial flow during the second trimester.
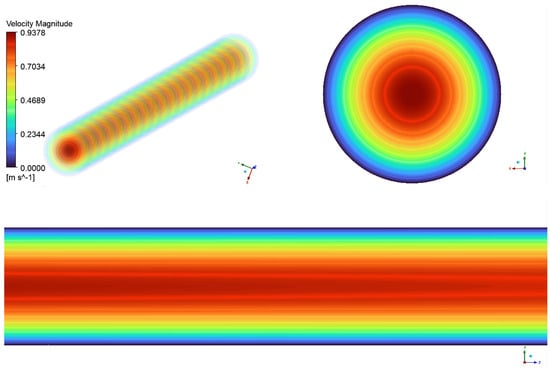
Figure 9.
Blood flow in the uterine artery, during the 21–22 week groups.
The axial view of the uterine artery, shown in the top left of Figure 9, displays regular concentric ring patterns, indicating laminar rather than turbulent flow, as seen in larger arteries. The transition between colors in the flow field represents velocity variations, with the highest velocity at the center (red region) and decreasing toward the walls (green to blue regions). This characteristic velocity gradient follows a parabolic flow profile, where flow is fastest in the center and slowest near the vessel walls due to viscous effects. The upper right section of the figure presents a cross-sectional velocity vector field of the uterine artery. The central red region represents peak velocity, which gradually decreases outward into green and blue rings, reaching its lowest values near the outer walls. This profile indicates fully developed laminar flow, ensuring stable and efficient blood perfusion to the uterus.
The lower portion of the figure illustrates the longitudinal flow progression along the uterine artery. The nearly straight flow lines and smooth color gradient from red to blue indicate stable, turbulence-free flow. The gradual reduction in velocity toward the arterial wall further confirms laminar flow, ensuring efficient circulation within the artery.
3.2. Umbilical Arterial Flow
The blood flow in the umbilical artery is also laminar, with a Reynolds number () indicating a smooth laminar flow. However, due to the curvature of the artery, the Dean number ( > 40∼60) suggests the presence of secondary flow patterns, which result in vortex-like movements. These secondary flows disrupt the typical parabolic velocity profile observed in straight vessels, with the highest velocity occurring along the outer curve of the artery rather than in the center. This is a normal consequence of the geometry of the vessel. The measurements obtained from CFD for the umbilical artery, corresponding to the second and third trimesters of pregnancy, are shown in Table 3.
Table 3.
CFD-obtained measurements for the umbilical artery, corresponding to the second trimester of pregnancy (21–22 weeks) and the third trimester of pregnancy (30–31 weeks).
The CFD-obtained measurements provide valuable insights into the hemodynamic changes occurring in the umbilical artery between the second and third trimesters. In comparing the two trimesters, several trends emerge that reflect the physiological adaptations necessary to support fetal growth.
Peak systolic velocity () increases as pregnancy progresses, indicating a rise in blood flow velocity during systole. Similarly, end diastolic velocity () increases, suggesting a reduction in downstream resistance and improved continuous blood flow to the fetus. The time-averaged velocity (TAV) also increases, reinforcing the observation of an increase in overall blood flow.
The resistance index () decreases, which is in line with the expected reduction in placental vascular resistance as pregnancy progresses. A similar trend is seen in the pulsatility index (), which also decreases, suggesting improved perfusion and better regulation of blood flow.
Wall shear stress parameters also exhibit notable changes. is a key factor in maintaining vascular health, as adequate shear stress promotes proper endothelial function and vessel remodeling [6,7,8,9]. The increase in during the third trimester indicates that the artery is adapting to higher blood flow demands. , on the other hand, provides insight into the bidirectional nature of shear stress [6,7,9]. While high values can be associated with disturbed flow and potential vascular dysfunction, the measured values suggest that oscillations in shear stress remain within a normal range. , which is an indicator of how long blood pools, is important in assessing the risk of thrombosis or impaired perfusion [6,9]. The slight increase in in the third trimester does not appear to be of concern, as it remains within expected physiological limits. These findings align with the normal hemodynamic changes expected in normal pregnancy, reinforcing the importance of maintaining proper vascular function for optimal fetal growth.
The secondary flow promotes the mixing of blood constituents, which is essential for two key reasons: the efficient transport of oxygen and nutrients to tissues and the removal of metabolic by-products. Continuous mixing facilitated by secondary flow promotes the efficient delivery of essential nutrients to the fetus and the removal of metabolic waste [20]. Additionally, secondary flow helps prevent stagnation zones—areas of near-zero velocity—thereby reducing the risk of thrombosis within the umbilical arteries. Moreover, disruptions in secondary flow patterns can serve as early indicators of complications such as reduced blood flow or placental insufficiency, aiding in timely diagnosis and intervention. Figure 10 depicts the development of secondary flow patterns within the umbilical artery.
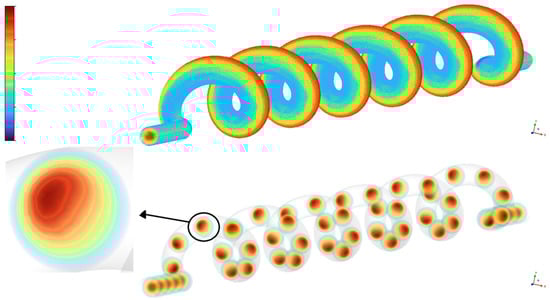
Figure 10.
Visualization of secondary flow in the helical umbilical artery model.
The top part shows the three-dimensional geometry of the umbilical artery with color-mapped streamlines indicating the axial velocity distribution along the vessel. The bottom part presents cross-sectional velocity contours at multiple locations along the helical path, revealing the development and persistence of secondary flow vortices. The detailed inset highlights the off-center velocity maximum and characteristic vortex structure in a representative cross-section, clearly demonstrating the formation of Dean-type secondary flows due to vessel curvature.
Next, two graphical illustrations of the velocity are shown (Figure 11) with regard to the second and third trimesters of pregnancy. The geometry of the umbilical artery contributes to complex blood flow patterns, which are crucial for efficient oxygen and nutrient delivery to the fetus during the late stages of pregnancy. The CFD results provide information on the fluid dynamics of the fetal blood circulation.
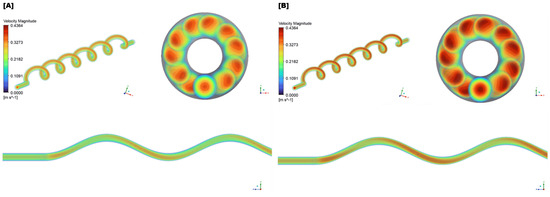
Figure 11.
(A) Simulation of blood flow in the umbilical artery, during the 21–22 week groups (second trimester). The helical flow pattern is evident, reflecting the artery’s coiled structure. (B) Simulation of blood flow in the umbilical artery, during the 30–31 week groups (third trimester).
The upper left of Figure 11 depicts a helical or spiral flow pattern, characteristic of blood flow through the coiled umbilical artery. The alternating high- and low-velocity regions along the helix suggest a swirling flow field, influenced by the artery’s ability to stretch and twist in response to fetal movements. The more pronounced helical structure observed in the third trimester reflects a physiological adaptation to meet the increasing circulatory demands of the growing fetus. The upper right section presents cross-sectional views of the umbilical artery. High-velocity regions appear near the outer walls, while lower-velocity areas are concentrated toward the center. The third trimester exhibits a more intense velocity magnitude, indicating higher energy and momentum transfer driven by increased fetal demands.
The lower portion of the figure shows longitudinal slices of blood flow through the artery. The wavy pattern, represented by alternating colors, reflects variations in velocity caused by the helical flow. This undulating waveform becomes more defined in the third trimester, suggesting increased pulsatility and enhanced adaptability to fetal circulation. The Time-Averaged Wall Shear Stress () distributions for the second and third trimesters are shown in Figure 12.
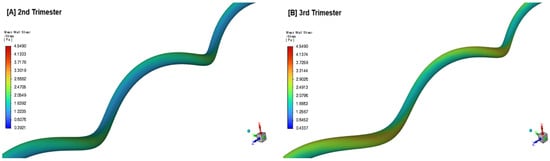
Figure 12.
Time-averaged wall shear stress () distribution in the umbilical artery during the 2nd (A) and 3rd trimester (B) of pregnancy.
4. Discussion
This study provides a detailed analysis of blood flow dynamics in the uterine and umbilical arteries during pregnancy, contributing to a clearer understanding of maternal-fetal circulation, using CFD models [3,12,21,22]. The integration of Doppler ultrasound data with mathematical models based on the Navier–Stokes equations allows the quantification of hemodynamic parameters such as Peak Systolic Velocity (), Pulsatility Index (), and Resistance Index () under physiological conditions. A key advancement in this work lies in the transient three-dimensional solution of the Navier–Stokes equations with parabolic velocity inlets, derived from spectral Fourier analysis of Doppler ultrasound data. This extends previous studies [2,4,19] by incorporating real-time statistical analysis to refine the flow setup.
A major finding of this study is that CFD offers explicit and quantitative visualization of blood flow patterns in the umbilical artery—an advantage not provided by traditional observation methods such as Doppler ultrasound. While Doppler ultrasound primarily estimates blood flow direction and velocity based on the angle of the ultrasonic beam, CFD enables the visualization of streamlines, velocity distributions, and instantaneous particle motion, providing a more detailed hemodynamic assessment. Furthermore, CFD reveals the presence of secondary flow patterns within the umbilical artery, which interact with the primary flow along the vessel’s trajectory—phenomena that are difficult to capture using ultrasound alone. This enhanced visualization allows for a more comprehensive understanding of the relationship between umbilical arterial hemodynamics and fetal growth, improving clinical assessments.
The focus on the second and third trimesters stems from their critical role in maternal-fetal health, as evidenced by our statistical analysis. During this period, the rapid growth of the fetus and the continued development of the placenta significantly alter blood flow dynamics, increasing the risk of complications such as preeclampsia and intrauterine growth restriction (IUGR). These findings align with prior research [5,11,16], emphasizing the importance of noninvasive Doppler ultrasonography for monitoring uterine and umbilical blood flow. While Doppler ultrasound remains a valuable clinical tool, the ability of CFD to visualize pressure and wall shear stress (WSS) distribution provides additional insight into vascular resistance and flow adaptations during pregnancy.
The results confirm that blood flow in the uterine artery remains predominantly laminar, with stable and across gestation. The observed decrease in and between the second-trimester groups suggests a reduction in vascular resistance, which stabilizes in the third trimester. These findings support the notion of progressive maternal hemodynamic adaptation, ensuring continuous placental perfusion without excessive pressure fluctuations.
The computed values in the uterine artery indicate a relatively uniform shear stress distribution, which is essential for maintaining endothelial function and supporting efficient oxygen and nutrient exchange. The consistently low values confirm that flow remains unidirectional, reinforcing the stability of the uterine blood supply. Additionally, the low suggests that blood does not pool, which is crucial in preventing thrombotic complications that could compromise placental function.
In contrast, the umbilical artery exhibits more complex flow characteristics due to its helical structure. The computed Dean number () confirms the presence of secondary vortical flows, which enhance mixing and facilitate oxygen transport. The observed increase in and between the second and third trimesters is consistent with the physiological expectation of increasing fetal metabolic demand and decreasing placental vascular resistance.
The increase in in the umbilical artery during the third trimester reflects vessel adaptation to higher volumetric flow rates, ensuring adequate perfusion of the fetus. The moderate values of indicate the expected oscillatory nature of shear stress due to the coiled morphology of the artery, but do not suggest excessive flow disturbances. A slight increase in is observed in the third trimester, which may improve the efficiency of nutrient exchange but could also indicate a slightly prolonged residence time of the blood, which requires careful clinical evaluation in pathological cases.
These findings emphasize the importance of monitoring uteroplacental hemodynamics to detect pregnancy complications such as fetal growth restriction (FGR) or placental insufficiency. An abnormal decrease in or a pathological increase in and could serve as early markers of vascular dysfunction, warranting closer clinical surveillance. This study also reinforces the value of CFD as a complementary tool to Doppler ultrasound by providing a more detailed visualization of secondary flow structures, which are otherwise difficult to observe.
Despite its contributions, this study has some limitations. The idealized arterial geometries, as in previous work [2,4], may not fully capture patient-specific vascular variations. The assumption of laminar flow does not account for potential turbulence in pathological cases, limiting the applicability of the model to abnormal pregnancies. Additionally, while the dataset of 200 pregnant women strengthens the statistical analysis, broader studies across different populations and gestational stages could improve generalizability.
The Carreau model more accurately represents blood’s viscoelasticity than simpler models (e.g., Newtonian or power-law), as it accounts for both low- and high-shear-rate behavior. This formulation provides a balance between physiological fidelity and computational tractability, making it a cornerstone in hemodynamic modeling. Variants like the Carreau–Yasuda or Carreau–Gambaruto models could also be studied, potentially offering refinements for specific hematocrit or protein concentrations [23]. Future research could enhance these models by incorporating patient-specific vascular geometries reconstructed from ultrasound imaging and expanding CFD simulations to include cases of turbulent flow.
By bridging the gap between physiology and computational modeling, this study advances the understanding of pregnancy hemodynamics, particularly in the second and third trimesters when circulatory demands are at their highest. The application of CFD modeling alongside Doppler ultrasound offers a powerful tool for improving maternal-fetal medicine by providing deeper insight into vascular adaptations and potential complications. Integrating CFD simulations into clinical assessments can enhance early diagnosis and management of pregnancy-related disorders, offering better maternal and fetal health outcomes.
5. Conclusions
This study utilized computational fluid dynamics (CFD) and mathematical modeling to analyze maternal-fetal blood flow, integrating Doppler ultrasound data with Navier–Stokes models. A key finding is that CFD provides a more detailed and quantitative visualization of blood flow than traditional imaging methods, capturing complex flow patterns such as secondary flows in the umbilical artery, phenomena difficult to observe with ultrasound alone. This enhanced visualization improves our understanding of umbilical arterial hemodynamics and its link to fetal growth restriction.
Simulations confirmed that uterine artery flow remains laminar, with stable and across trimesters, while the umbilical artery exhibits secondary flow patterns due to its helical structure. The observed increase in umbilical artery and between the second and third trimester reflects increased fetal metabolic demand and a reduction in placental vascular resistance. CFD analysis also revealed critical hemodynamic parameters such as time-averaged wall shear stress (), oscillatory shear index (), and relative residence time (). The increase in in the umbilical artery indicates vascular adaptation to higher blood flow demands, while the moderate values confirm expected oscillatory behavior due to the vessel’s coiled structure. Additionally, the slight increase in suggests prolonged blood residence time, which may enhance nutrient exchange but could also indicate potential thrombotic risk in certain cases. Importantly, all simulations assumed blood’s non-Newtonian behavior, reflecting its shear-dependent viscosity, which is critical for accurately modeling pulsatile flow dynamics and wall shear stresses in uterine and umbilical arteries. This assumption enhances the physiological relevance of the CFD results and supports more precise hemodynamic assessments.
While this study provides valuable insights using CFD and Doppler ultrasound integration, several limitations should be acknowledged. The modeling relied on idealized arterial geometries rather than fully patient-specific vessel reconstructions, which may limit the generalizability of flow patterns. Additionally, the limitations of Doppler ultrasound image resolution posed challenges for detailed three-dimensional segmentation. In future work, we plan to employ advanced reconstruction tools to generate patient-specific models, which could provide even more realistic representations of the vascular domains. Furthermore, assumptions inherent in the employed non-Newtonian rheological models and simplifications related to steady versus transient flow states may affect the accuracy of simulated hemodynamics. Technical factors such as mesh resolution and convergence criteria were carefully monitored.
Moreover, although parameters like Wall Shear Stress (), Oscillatory Shear Index (), and Relative Residence Time () show promise as markers of vascular adaptation and dysfunction, there are currently no established clinical thresholds for these indices in uteroplacental circulation. Defining such diagnostic benchmarks requires larger-scale, longitudinal clinical studies.
By establishing population-specific blood flow parameters, this study enhances clinical assessments and the detection of complications such as placental insufficiency and fetal growth restriction. The findings emphasize the importance of monitoring uteroplacental hemodynamics to detect potential complications early. An abnormal decrease in or a pathological increase in and could serve as early markers of vascular dysfunction, warranting closer clinical surveillance. While CFD is not yet standard in clinical practice, its ability to reveal flow patterns beyond the reach of ultrasound highlights its potential as a complementary diagnostic tool.
Future work should focus on incorporating patient-specific vascular geometries reconstructed from ultrasound imaging and expanding real-time CFD applications to include pathological cases. Machine learning algorithms trained on Doppler ultrasound data could further refine diagnostic capabilities, enabling predictive modeling for pregnancy complications. The continued integration of CFD simulations into clinical assessments may facilitate earlier diagnosis and more effective management of pregnancy-related disorders, ultimately improving maternal and fetal health outcomes.
Author Contributions
Conceptualization by C.S., M.P., P.T. and M.X.; investigation by A.F.; methodology by A.F., C.S., M.P., P.T. and M.X.; software by A.F. and M.X.; supervision by C.S., M.P., P.T., M.X., A.V. and F.G.; validation by A.F., C.S. and M.X.; writing-original draft preparation by A.F., C.S. and M.X. All authors have read and agreed to the published version of the manuscript.
Funding
This research was partially carried out within the framework of the Action “Flagship actions in interdisciplinary scientific fields with a special focus on the productive fabric”, which is implemented through the National Recovery and Resilience Plan Greece 2.0, funded by the European Union—NextGenerationEU (Project ID: TAEDR-0535983).
Informed Consent Statement
Informed consent was obtained from all subjects involved in the study. The study was also approved by the Scientific Research Committee of the University of Ioannina and the Commanding Board of the University Hospital of Ioannina (approval number: 4558/24-2-25).
Data Availability Statement
The sample consisted of 200 greek pregnant women, examined during the second and third trimesters of pregnancy using Doppler ultrasound, as already mentioned in the Materials and Methods section. Data are unavailable due to privacy and ethical restrictions.
Conflicts of Interest
The authors declare no conflicts of interest.
Abbreviations
The following abbreviations are used in this manuscript:
| CFD | Computational Fluid Dynamics |
| FVM | Finite Volume Method |
| GCC | Generalized Curvilinear Coordinates |
| PDE | Partial Differential Equation |
| NS | Navier–Stokes |
| MRI | Magnetic Resonance Imaging |
| WSS | Wall Shear Stress |
| TAWSS | Time-Averaged Wall Shear Stress |
| OSI | Oscillatory Shear Index |
| RRT | Relative residence time |
| PI | Pulsatility Index |
| RI | Resistance Index |
| PSV | Peak Systolic Velocity |
| EDV | End Diastolic Velocity |
| TAV | Time-Averaged Velocity |
| UCI | Umbilical Coiling Index |
| IUGR | Intrauterine Growth Restriction |
| Re | Reynolds number |
| De | Dean number |
| Wo | Womersley number |
References
- Hu, X.; Zhang, L. Uteroplacental circulation in normal pregnancy and preeclampsia: Functional adaptation and maladaptation. Int. J. Mol. Sci. 2021, 22, 8622. [Google Scholar] [CrossRef] [PubMed]
- Kasiteropoulou, D.; Topalidou, A.; Downe, S. A computational fluid dynamics modelling of maternal-fetal heat exchange and blood flow in the umbilical cord. PLoS ONE 2020, 15, e0231997. [Google Scholar] [CrossRef] [PubMed]
- Xenos, M. An Euler–Lagrange approach for studying blood flow in an aneurysmal geometry. Proc. R. Soc. A Math. Phys. Eng. Sci. 2017, 473, 20160774. [Google Scholar] [CrossRef]
- Serrano, A.; Cunha, V.; Teixeira, J.P.; Pires, M.B.; O’Neill, J.G.; Vassilenko, V. Hemodynamics in human uterine arteries: Modeling and computational fluid dynamics calculations. In Proceedings of the 2019 IEEE 6th Portuguese Meeting on Bioengineering (ENBENG), Lisbon, Portugal, 22–23 February 2019; IEEE: Piscataway, NJ, USA, 2019; pp. 1–4. [Google Scholar]
- Shah, R.G.; Girardi, T.; Merz, G.; Necaise, P.; Salafia, C.M. Hemodynamic analysis of blood flow in umbilical artery using computational modeling. Placenta 2017, 57, 9–12. [Google Scholar] [CrossRef] [PubMed]
- Ferdows, M.; Hoque, K.; Bangalee, M.; Xenos, M. Wall shear stress indicators influence the regular hemodynamic conditions in coronary main arterial diseases: Cardiovascular abnormalities. Comput. Methods Biomech. Biomed. Eng. 2023, 26, 235–248. [Google Scholar] [CrossRef] [PubMed]
- Tasso, P.; Raptis, A.; Matsagkas, M.; Rizzini, M.L.; Gallo, D.; Xenos, M.; Morbiducci, U. Abdominal aortic aneurysm endovascular repair: Profiling postimplantation morphometry and hemodynamics with image-based computational fluid dynamics. J. Biomech. Eng. 2018, 140, 111003. [Google Scholar] [CrossRef] [PubMed]
- De Nisco, G.; Kok, A.M.; Chiastra, C.; Gallo, D.; Hoogendoorn, A.; Migliavacca, F.; Wentzel, J.J.; Morbiducci, U. The atheroprotective nature of helical flow in coronary arteries. Ann. Biomed. Eng. 2019, 47, 425–438. [Google Scholar] [CrossRef] [PubMed]
- Malatos, S.; Fazzini, L.; Raptis, A.; Nana, P.; Kouvelos, G.; Tasso, P.; Gallo, D.; Morbiducci, U.; Xenos, M.A.; Giannoukas, A.; et al. Evaluation of Hemodynamic Properties After Chimney and Fenestrated Endovascular Aneurysm Repair. Ann. Vasc. Surg. 2024, 104, 237–247. [Google Scholar] [CrossRef] [PubMed]
- Pennati, G.; Socci, L.; Rigano, S.; Boito, S.; Ferrazzi, E. Computational patient-specific models based on 3-D ultrasound data to quantify uterine arterial flow during pregnancy. IEEE Trans. Med. Imaging 2008, 27, 1715–1722. [Google Scholar] [CrossRef] [PubMed]
- Gallo, D.M.; Poon, L.C.; Akolekar, R.; Syngelaki, A.; Nicolaides, K.H. Prediction of preeclampsia by uterine artery Doppler at 20–24 weeks’ gestation. Fetal Diagn. Ther. 2013, 34, 241–247. [Google Scholar] [CrossRef] [PubMed]
- Kyriakoudi, K.C.; Xenos, M.A. Magnetohydrodynamic effects on a pathological vessel: An Euler–Lagrange approach. Phys. Fluids 2023, 35, 121912. [Google Scholar] [CrossRef]
- Sharma, A. Introduction to Computational Fluid Dynamics: Development, Application and Analysis; Springer Nature: Berlin/Heidelberg, Germany, 2021. [Google Scholar]
- Akbar, N.S.; Nadeem, S. Carreau fluid model for blood flow through a tapered artery with a stenosis. Ain Shams Eng. J. 2014, 5, 1307–1316. [Google Scholar] [CrossRef]
- Tabakova, S.; Nikolova, E.; Radev, S. Carreau model for oscillatory blood flow in a tube. In Proceedings of the AIP Conference Proceedings, Shymkent, Kazakhstan, 11–13 September 2014; American Institute of Physics: College Park, MD, USA, 2014; Volume 1629, pp. 336–343. [Google Scholar]
- Clark, A.R.; James, J.L.; Stevenson, G.N.; Collins, S.L. Understanding abnormal uterine artery Doppler waveforms: A novel computational model to explore potential causes within the utero-placental vasculature. Placenta 2018, 66, 74–81. [Google Scholar] [CrossRef] [PubMed]
- Mandala, M.; Osol, G. Physiological remodelling of the maternal uterine circulation during pregnancy. Basic Clin. Pharmacol. Toxicol. 2012, 110, 12–18. [Google Scholar] [CrossRef] [PubMed]
- Ferguson, V.L.; Dodson, R.B. Bioengineering aspects of the umbilical cord. Eur. J. Obstet. Gynecol. Reprod. Biol. 2009, 144, S108–S113. [Google Scholar] [CrossRef] [PubMed]
- Spurway, J.; Logan, P.; Pak, S. The development, structure and blood flow within the umbilical cord with particular reference to the venous system. Australas. J. Ultrasound Med. 2012, 15, 97–102. [Google Scholar] [CrossRef] [PubMed]
- Kaplan, A.D.; Jaffa, A.J.; Timor, I.E.; Elad, D. Hemodynamic analysis of arterial blood flow in the coiled umbilical cord. Reprod. Sci. 2010, 17, 258–268. [Google Scholar] [CrossRef] [PubMed]
- Ferziger, J.H.; Perić, M.; Street, R.L. Computational Methods for Fluid Dynamics; Springer: Berlin/Heidelberg, Germany, 2019. [Google Scholar]
- Patankar, S. Numerical Heat Transfer and Fluid Flow; Taylor & Francis: London, UK, 2018. [Google Scholar]
- Mimouni, Z. The rheological behavior of human blood—comparison of two models. Open J. Biophys. 2016, 6, 29–33. [Google Scholar] [CrossRef]
Disclaimer/Publisher’s Note: The statements, opinions and data contained in all publications are solely those of the individual author(s) and contributor(s) and not of MDPI and/or the editor(s). MDPI and/or the editor(s) disclaim responsibility for any injury to people or property resulting from any ideas, methods, instructions or products referred to in the content. |
© 2025 by the authors. Licensee MDPI, Basel, Switzerland. This article is an open access article distributed under the terms and conditions of the Creative Commons Attribution (CC BY) license (https://creativecommons.org/licenses/by/4.0/).