Abstract
Background. Measures of adverse cardiac remodeling, left ventricular global longitudinal strain (LVGLS) and left atrial (LA) phasic function, are predictive of cardiac events in patients with severe aortic stenosis (AS). How these parameters of cardiac function change following TAVR requires further investigation. Methods. A number of 109 consecutive patients with symptomatic severe AS who were seen in the heart valve clinic between 2014 and 2019 for TAVR were included. All patients underwent echocardiographic assessment prior to and 30 days following TAVR, with LVGLS and LA phasic function evaluation using 2D speckle-tracking echocardiography. Heart failure hospitalization, and death were assessed at 12 months. Results. The mean age of the study cohort was 81 ± 7.3 years. Following TAVR, there was a significant reduction in NYHA class III/IV symptoms [89 (82%) vs. 12 (11%), p < 0.01], and median mean aortic valve gradient [44 mmHg (16) vs. 9 mmHg (7), p < 0.01]. There was no significant change in the median LVEF [62% (13) vs. 62% (6.0), p = 0.2]; however, the LVGLS significantly increased following TAVR [15 ± 3.5% vs. 18 ± 3.3%, p < 0.01]. The median LA reservoir, conduit and contractile function significantly improved following TAVR [22.0% (14.0) vs. 18.0% (14.0) p < 0.01, 8.9% (5.4) vs. 7.8% (4.8) p < 0.01, 12% (11.0) vs. 9.6% (11.0) p < 0.01, respectively]. The incidence of death or heart failure hospitalization at 12 months was low, and occurred in eight patients (7.3%). Conclusions. TAVR results in significant short-term reverse LV and LA remodeling, as shown by improvement in LV GLS and all three components of LA phasic function, despite no change in the LVEF. The findings indicate the possible utility of strain imaging for the assessment of global LV and LA function following TAVR.
1. Introduction
Transcatheter aortic valve replacement (TAVR) for aortic stenosis (AS) is rapidly advancing, with several devices now approved for routine clinical care [1]. Any patient population with severe AS presenting for TAVR is heterogeneous, with varying degrees of left ventricular (LV) and left atrial pathology [2]. Aortic stenosis, through an increase in afterload, results in compensatory left ventricular hypertrophy that, in turn, leads to reduced LV compliance, diastolic dysfunction, elevated end-diastolic pressures, and in some instances, systolic dysfunction [2]. Amongst AS patients, a measure of global LV systolic function and LV global longitudinal strain is predictive of mortality, independent of LVEF [3]. In addition, severe AS results in impaired LA function [4]. Each of the three phases of LA function in AS have been variably investigated, these include: firstly, reservoir function during ventricular systole and isovolumic relaxation; secondly, conduit function in early and mid-diastole when blood flows passively through the left atrium and into the left ventricle; thirdly, contractile function in late diastole to end LV filling [4].
Whilst prior studies have separately shown improvement in LV and LA mechanics following TAVR [5], both LV global longitudinal strain (GLS) and LA strain in each of the three phases have not been concurrently evaluated in a large cohort of patients undergoing TAVR with contemporary devices. There is emerging evidence showing an association between improvements in LV GLS following TAVR and lower longer-term mortality [6]; however, the relationship between changes in LA strain after TAVR and clinical outcome is less well known. In addition, there is limited description of changes in both LV GLS and LA strain according to baseline aortic stenosis flow-gradient patterns. We sought to investigate a consecutive contemporary cohort of AS patients in regard to global LV and phasic LA function, using 2D speckle-tracking echocardiography, prior to and following afterload reduction with TAVR.
2. Methods
2.1. Study Design and Patient Population
Patients referred for potential TAVR for severe aortic stenosis to the Heart Valve Program at Mount Sinai Hospital (New York, NY, USA) were prospectively recruited between 2014 and 2019. Inclusion criteria were severe aortic stenosis and availability of echocardiographic imaging, which is part of the routine evaluation pathway. Baseline clinical demographic data was collected for all patients. Follow-up comprised of clinical evaluation and transthoracic echocardiography. The Kansas City Cardiomyopathy (KCCQ) symptom score was obtained for patients at baseline and at 30 days following TAVR. Patients were followed-up for 12 months following TAVR for monitoring of clinical outcomes of heart failure hospitalization, or death.
2.2. Echocardiography
All echocardiographic studies were performed as part of routine clinical care (predominantly Phillips, EPIQ) at baseline and then at 30 days following TAVR. Cardiac chamber volumes and LVEF were assessed according to the American Society of Echocardiography (ASE) guidelines [7]. AS severity grading and post-TAVR evaluation were performed using an integrated approach according to the ASE guidelines [8].
The left ventricular and left atrial strain analysis using 2D speckle-tracking echocardiography was performed blinded to all clinical data, at baseline and 30 days post-TAVR using Qlab 13.0 (Phillips, Best, the Netherlands). For LV analysis, standard 2D images of the apical 4-chamber, 2-chamber and long-axis were obtained at between 60–80 frames/s. A semi-automated algorithm was used to track the LV myocardial wall, which was divided into 18 segments to obtain the global peak longitudinal strain. For LA analysis, non-foreshortened apical 4-chamber and 2-chamber views were used. Images were also acquired at 60–80 frames/s. LA strain was determined during 3 phases of the LA cycle, reservoir, conduit and contractile phases. The LA endocardial border was manually traced, generating a region of interest (ROI). Following segmental tracking and manual adjustment of the ROI, the software package generated longitudinal strain curves. LA strain was measured with the zero-reference standard at end-diastole and at the onset of atrial contraction. Reservoir function (εR) (strain value at mitral valve opening—ventricular end-diastole), LA conduit function (strain at onset of atrial contraction—strain at mitral valve opening) and contractile function (εCT) (strain at ventricular end-diastole—strain at onset of atrial contraction) were then derived (Figure).
All patients included in the study had severe AS (AVA ≤ 1.0 cm2); LVGLS and LA phasic function at baseline and at 30 days post-TAVR were compared across the 4 groups of severe AS, classified according to the baseline flow-gradient pattern described in the American College of Cardiology/American Heart Association guidelines [9]:
- High-gradient AS, mean gradient (MG) ≥ 40 mmHg;
- High-gradient, low EF AS: MG > 40 mmHg, LVEF < 50%;
- Classical low flow, low-gradient AS: MG < 40 mmHg and LVEF < 50%;
- Paradoxical low flow, low-gradient AS: MG < 40 mmHg, LVEF ≥ 50% and Svi < 35 mL/m2.
2.3. Statistics
Continuous variables are expressed as mean ± SD and categorical variables as numbers of events with percentages. Student’s t-test, or an ANOVA with Tukey–Kramer or the Bonferroni method were used for continuous variables. For non-normally distributed data, the Mann–Whitney test was used for unpaired data analysis, and the Wilcoxon test for paired data analysis. Chi-square tests were used for categorical variables. Linear regression analysis was performed to determine univariate predictors of change in KCCQ symptom score > 27.6 following TAVR. A 2-sided p-value < 0.05 was considered significant for all tests. All statistical analyses were performed using IBM SPSS (Version 22, Armonk, NY, USA: IBM Corp).
3. Results
3.1. Patient Characteristics
Between 2014 and 2019, 109 patients with severe aortic stenosis underwent assessment of LA function prior to and following TAVR. The clinical characteristics of the study subjects are shown in Table 1. The mean age of the cohort was 81 ± 7.3, and 49% were male. A history of diabetes mellitus, hypertension and myocardial infarction were present in 34%, 96% and 20%, respectively. Atrial fibrillation or flutter history was present in 33%. A sizeable population of the cohort (82%) had NYHA class III/IV symptoms (Table 1). The median LVEF at baseline was 62.0% (13.0), with a reduced mean LVGLS of 15.0% (3.5). The majority had normal high-gradient aortic stenosis (71%), with classical and paradoxical LF LG AS seen in 8.3% and 11%, respectively. The median aortic valve area was 0.7 cm2 (0.2). The self-expanding Medtronic valve was the more commonly implanted valve (58%), with the majority being either 26 mm or 29 mm in size (Table 2).

Table 1.
Baseline Patient Demographics.
Table 2.
Aortic stenosis subtypes, echocardiographic findings and procedural details.
3.2. Clinical and Echocardiographic Findings Pre- and Post-TAVR
Following TAVR, there was a significant reduction in NYHA class III/IV symptoms [89 (82%) vs. 12 (11%), p < 0.0001], median mean aortic valve gradient [44 mmHg (16) vs. 9 mmHg (7), p < 0.0001] and improvement in the KCCQ12 score [34 (25) vs. 79 (33), p < 0.0001]. There was no significant change in the median LVEF [62% (13) vs. 62% (6.0), p = 0.2]; however, the LVGLS significantly increased following TAVR [15 (3.5) vs. 18 (3.3), p < 0.0001] (Table 3).
Table 3.
Symptoms and echocardiographic parameters pre- and 30 days post-TAVR.
There was no significant change in left atrial volume index following TAVR (46 (25) vs. 47 mL/m2 (19), p = 0.48). However, when using the ventricular cycle, and ventricular end-diastole as the zero reference, the LA εR, conduit and εCT function significantly improved following TAVR [22.0% (14.0) vs. 18.0% (14.0) p < 0.0001, 8.9% (5.4) vs. 7.8% (4.8) p = 0.002, 12% (11.0) vs. 9.6% (11.0) p = 0.003, respectively]. Likewise, when the atrial cycle was used, with atrial contraction as the zero reference, the LA strain increased across all three phases [19.0% (11.0) vs. 17.0% (11.0) p < 0.0001, 8.2% (4.8) vs. 7.0% (4.0) p = 0.01, 11.0% (9.1) vs. 8.8% (9.2) p = 0.004, respectively) (Table 3) (Figure 1).
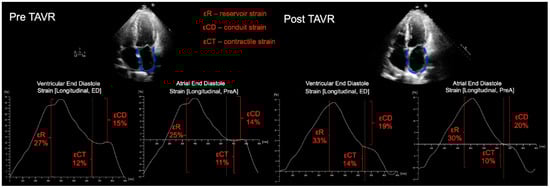
Figure 1.
Representative example of LA strain measured for a patient prior to, and following TAVR, showing improvement in LA phasic function. For LA strain analysis, apical 4-chamber and 2-chamber views were used (4-chamber views only shown); the LA endocardial border was manually traced, generating a region of interest (ROI). Following segmental tracking and manual adjustment of the ROI, the software package generated longitudinal strain curves. LA strain was measured with the zero-reference standard at end-diastole and at the onset of atrial contraction. Reservoir function (εR), (strain value at mitral valve opening—ventricular end-diastole), LA conduit function (strain at onset of atrial contraction—strain at mitral valve opening) and contractile function (εCT) (strain at ventricular end-diastole—strain at onset of atrial contraction) were then derived.
Whilst there was a more significant reduction in mean aortic valve gradient following implantation of the self-expanding valve (Medtronic Evolut Pro/Pro+), compared with the balloon-expandable valve ((Edwards Sapien 3 Ultra) (−83% (12%), −72% (18%), p < 0.0001), there was no difference in LA function when comparing the two prosthetic valve types (Supplementary Table S1).
3.3. Echocardiographic Results According to LVEF-Flow-Gradient Pattern
When patients were divided according to baseline LVEF-flow-gradient patterns, those with classical LF LG and low-EF high-gradient AS demonstrated a significant rise in LVEF compared with patients with normal high-gradient AS (+17% (30) vs. 0% (16), p = 0.01 and +31% (78) vs. 0% (16), p = 0.02 respectively). There was no significant change in LA strain during the reservoir, conduit and contractile phases when comparing patients across all LVEF-flow-gradient patterns (Table 4).
Table 4.
Symptoms and echocardiographic parameters 30 days post TAVR, according to AS subtype.
3.4. Clinical Events, Symptoms and Echocardiographic Parameters Following TAVR
At 12 months, 8 patients had either been hospitalized for heart failure or suffered death. The majority of the clinical events were due to heart failure hospitalization, with only 1 death at 12 months. Baseline LA strain, LAVI, LV GLS or LVEF, nor the median percentage change in these parameters at 30 days post TAVR were associated with heart failure hospitalization or death at 12 months (p > 0.05 for all) (Table 5 and Table 6).
Table 5.
Baseline echocardiographic and clinical parameters according to heart failure hospitalization or death at 12 months.
Table 6.
Change in echocardiographic parameters at 30 days post-TAVR, and clinical events at 12 months.
4. Discussion
We evaluated left ventricular and left atrial mechanics prior to and following TAVR, using 2D speckle-tracking echocardiographic strain measurements. Following TAVI, our patients showed a significant reduction in aortic transvalvular gradients. Concurrently, there was a significant improvement in LV global longitudinal strain, LA εR, conduit and εCT function, 3 months following TAVR, whereas the LVEF did not significantly improve. These findings emphasize the importance of strain imaging, as compared with LVEF evaluation for the assessment of global LV systolic and phasic LA function, in patients undergoing TAVR.
Despite the mean LVEF of the AS cohort being in the normal range, the LVGLS was reduced. 2D speckle-tracking LV GLS provides a more sensitive measure of myocardial systolic function that LVEF [3]. In addition, LVGLS is independently predictive of mortality, irrespective of LVEF [3]. Following TAVR, there was a significant improvement in LVGLS, despite no significant change in LVEF for the total cohort.
Paralleling the improvement in LVGLS, there was also significant enhancement in phasic LA function following TAVR. Whilst prior studies have shown a reduction in the different phases of LA function in AS, and improvement in LA function following TAVR [5], the present study, firstly, evaluated changes in LA function across a larger patient population that underwent TAVR with more contemporary devices and, secondly, investigated patterns of reverse remodeling and its relationship to symptoms. Furthermore, we have shown improvement in LA εR, conduit and εCT function, whereas a prior study evaluated εR and εCT function only [5]. Left atrial function is important for maintaining optimal cardiac output, in the setting of the impaired LV relaxation and reduced LV compliance observed in AS [4]. Poor LA function in AS may thus predispose patients to clinical deterioration and increase the risk of developing of atrial fibrillation [4]. It is also predictive of major adverse cardiac events [4]. Given that LA strain is load dependent and influenced by LV function, it has been suggested that LA contractile (pump) function is an ideal measure for LA function assessment, as opposed to reservoir function [10]. Reservoir and conduit function are related to LV filling pressures and LV relaxation, and improvements in these following TAVR may be explained by the improvement in LV function, rather than reverse remodeling [11]. However, in the present study, LA contractile function improved following TAVR, suggestive of reverse LA cavity remodeling.
Additionally, we have shown that LA volumetric assessment identified no change in LA volumes following TAVR. In fact, a prior study demonstrated that LA passive function and conduit function reduction in AS was not related to LA passive volume or LA conduit volume. Whilst a prior study showed improvement in LA volume following surgical AVR, this was in a younger, lower-risk cohort [12]. The different finding in the present study may be explained by more advanced remodeling at baseline, in our relatively higher-risk cohort.
Evaluation of LA function following TAVR according to baseline LVEF flow-gradient patterns has not been previously described. We found no change in LV GLS and LA function when stratified according to LVEF-flow-gradient patterns. A prior study showed improvement in LV GLS in LFLG AS with reduced and preserved LVEF at a later time point of 6 months post-TAVR [13], an interval period where a greater extent of LV cavity reverse remodeling occurred. Moreover, in the present study, there was no improvement in LA function when the patient cohort was stratified according to AS flow-gradient patterns. A change in LA function may not have been seen, as factors known to independently influence LA phasic function, such as mitral valve disease, atrial fibrillation, and LV restrictive physiology, were not controlled for the analysis. In addition, the sample size of patients without a normal high-gradient AS was small.
The lack of association between baseline LA strain, LV GLS and the median percentage change in these parameters at 30 days post-TAVR, with heart failure hospitalization or death at 12 months, is likely reflective of the low clinical event rate. Notably, a lower reduction in left atrial strain following TAVR has been shown to be independently predictive of cardiovascular death and hospitalization for heart failure [14].
Study Limitations
There are several limitations of the present study that should be addressed. This was a single center study of a small patient population. Patients with atrial fibrillation were not excluded from the study, given this arrhythmia is common amongst AS patients. The absence of atrial contraction in these patients does effect our results. We sought to evaluate LA phasic function across different AS LVEF flow-gradient subtypes; however, our findings were limited by a small number of patients without classical high-gradient AS. The low incidence of clinical events in the follow-up period likely contributed to the lack of association between LA strain and LV GLS with heart failure hospitalization or death.
5. Conclusions
We have shown, in a contemporary AS population, that TAVR results in significant short-term reverse LV and LA remodeling, as shown by the improvement in LV GLS and all three components of LA phasic function, despite no changes in the LVEF. The findings indicate the possible utility of strain imaging for the assessment of global LV and LA function following TAVR. Future studies, with a larger study population and a longer-term follow-up, are required.
Supplementary Materials
The following supporting information can be downloaded at: https://www.mdpi.com/article/10.3390/jcdd9020035/s1, Table S1: Symptoms and change in echocardiographic findings, post TAVR according to valve type.
Author Contributions
Conceptualization, M.A., R.R., S.L.; methodology, M.A., R.R., S.L.; software, M.A., R.R.; validation, M.A., R.R., S.L.; formal analysis, M.A., R.R., N.P.; investigation, M.A., R.R., N.P., M.G., F.R.P., P.K.; resources, S.L.; data curation, M.A., R.R., N.P., M.G., F.R.P., P.K.; writing—original draft preparation, M.A., R.R., S.L.; writing—review and editing, M.A., R.R., G.H.L.T., S.K.S., A.K., S.L.; visualization, M.A., S.L.; supervision, S.L.; project administration, S.L. All authors have read and agreed to the published version of the manuscript.
Funding
This research received no external funding.
Institutional Review Board Statement
Not applicable.
Informed Consent Statement
Not applicable.
Conflicts of Interest
G.H.L.T. is a physician proctor for Medtronic and a consultant for Medtronic, Abbott Structural Heart, and W. L. Gore & Associates. S.K.S. is a consultant for Abbott, Medtronic, and Boston Scientific, and has received speakers’ honoraria from Medtronic.
References
- Claessen, B.E.; Tang, G.H.L.; Kini, A.S.; Sharma, S.K. Consideration for Optimal Device Selection in Transcatheter Aortic Valve Replacement, A Review. JAMA Cardiol. 2021, 6, 102–112. [Google Scholar] [CrossRef] [PubMed]
- Carabello, B.A. Introduction to Aortic Stenosis. Circ. Res. 2013, 113, 179–185. [Google Scholar] [CrossRef] [PubMed]
- Ng, A.C.T.; Prihadi, E.A.; Antoni, M.L.; Bertini, M.; Ewe, S.H.; Marsan, N.A.; Leung, D.Y.; Delgado, V.; Bax, J.J. Left ventricular global longitudinal strain is predictive of all-cause mortality independent of aortic stenosis severity and ejection fraction. Eur. Heart J. Cardiovasc. Imaging 2018, 19, 859–867. [Google Scholar] [CrossRef] [PubMed] [Green Version]
- O’Connor, K.; Magne, J.; Rosca, M.; Pierard, L.A.; Lancellotti, P. Left atrial function and remodelling in aortic stenosis. Eur. J. Echocardiogr. 2011, 12, 299–305. [Google Scholar] [CrossRef] [PubMed] [Green Version]
- D’Ascenzi, F.; Cameli, M.; Henein, M.; Iadanza, A.; Reccia, R.; Lisi, M.; Curci, V.; Sinicropi, G.; Torrisi, A.; Pierli, C.; et al. Left atrial remodelling in patients undergoing transcatheter aortic valve implantation: A speckle-tracking prospective, longitudinal study. Int. J. Cardiovasc. Imaging 2013, 29, 1717–1724. [Google Scholar] [CrossRef] [PubMed]
- Logstrup, B.B.; Anderson, H.R.; Thusen, L.; Christiansen, E.H.; Terp, K.; Klaaborg, K.E.; Poulsen, S.H. Left Ventricular Global Systolic Longitudinal Deformation and Prognosis 1 year after Femoral and Apical Transcatheter Aortic Valve Implantation. J. Am. Soc. Echocardiogr. 2013, 26, 246–254. [Google Scholar] [CrossRef] [PubMed]
- Lang, R.M.; Badano, L.P.; Mor-Avi, V.; Afilalo, J.; Armstrong, A.; Ernande, L.; Flachskampf, F.A.; Foster, E.; Goldstein, S.A.; Kuznetsova, T.; et al. Recommendations for Cardiac Chamber Quantification by Echocardiography in Adults: An Update from the American Society of Echocardiography and the European Association of Cardiovascular Imaging. J. Am. Soc. Echocardiogr. 2015, 28, 1–39.e14. [Google Scholar] [CrossRef] [PubMed] [Green Version]
- Baumgartner, H.B.; Hung, J.; Bermejo, J.; Chambers, J.B.; Edvardsen, T.; Goldstein, S.; Lancellotti, P.; LeFevre, M.; Miller, F., Jr.; Otto, C.M. Recommendations on the Echocardiographic Asessment of Aortic Valve Stenosis: A Focused Update from the European Association of Cardiovascular Imaging and the American Society of Echocardiography. J. Am. Soc. Echocardiogr. 2017, 30, 372–392. [Google Scholar] [CrossRef] [PubMed]
- Nishimura, R.A.; Otto, C.M.; Bonow, R.O.; Carabello, B.A.; Erwin, J.P.; Guyton, R.A.; O’Gara, P.T.; Ruiz, C.E.; Skubas, N.J.; Sorajja, P.; et al. 2014 AHA/ACC guideline for the management of patients with valvular heart disease: Executive summary. A report of the American College of Cardiology/American heart association task force on practice guidelines. J. Am. Coll. Cardiol. 2014, 63, 2438–2488. [Google Scholar] [CrossRef] [PubMed] [Green Version]
- Donal, E.; Galli, E.; Schnell, F. Left Atrial Strain, A Must or a Plus for Routine Clinical Practice? Circ. Cardiovasc. Imaging 2017, 10, e007023. [Google Scholar] [CrossRef] [PubMed] [Green Version]
- Spethmann, S.; Dregar, H.; Baldenhofer, G.; Stuer, K.; Saghabalyan, D.; Muller, E.; Hattasch, R.; Stangl, V.; Laule, M.; Baumann, G.; et al. Short-Term Effects of Transcatheter Aortic Valve Implantation on Left Atrial Mechanics and Left Ventricular Diastolic Function. J. Am. Soc. Echocardiogr. 2013, 26, 64–71. [Google Scholar] [CrossRef] [PubMed]
- Lisi, M.; Henein, M.Y.; Cameli, M.; Ballo, P.; Reccia, R.; Bennati, E.; Chiavarelli, M.; Maccherini, M.; Mondillo, S. Severity of aortic stenosis predicts early post-operative normalization of left atrial size and funciton detected by myocardial strain. Int. J. Cardiol. 2013, 167, 1450–1455. [Google Scholar] [CrossRef] [PubMed]
- Kamperidis, V.; Joyce, E.; Debonnaire, P.; Katsanos, S.; van Rosendael, P.J.; van der Kley, F.; Sianos, G.; Bax, J.J.; Ajmone Marsan, N.; Delgado, V. Left ventricular functional recovery and remodelling in low-flow low-gradient severe aortic stenosis after transcatheter aortic valve implantation. J. Am. Soc. Echocardiogr. 2014, 27, 817–825. [Google Scholar] [CrossRef] [PubMed]
- Sabatino, J.; De Rosa, S.; Leo, I.; Strangio, A.; La Bella, S.; Sorrentino, S.; Mongiardo, A.; Spaccarotella, C.; Polimeni, A.; Indolfi, C. Early reduction in left atrial function predicts adverse clinical outcomes in patients with severe aortic stenosis undergoing transcatheter aortic valve replacement. Open Heart 2021, 8, e001685. [Google Scholar] [CrossRef] [PubMed]
Publisher’s Note: MDPI stays neutral with regard to jurisdictional claims in published maps and institutional affiliations. |
© 2022 by the authors. Licensee MDPI, Basel, Switzerland. This article is an open access article distributed under the terms and conditions of the Creative Commons Attribution (CC BY) license (https://creativecommons.org/licenses/by/4.0/).