Abstract
Background: The impact of diabetes on the management and outcomes of patients with borderline CT-derived fractional flow reserve (FFRCT) remains unclear. Methods: This multicenter study enrolled symptomatic patients with suspected coronary artery disease who underwent Coronary computed tomography angiography (CCTA) between June 2021 and May 2023, yielding FFRCT values between 0.70 and 0.80. Revascularization occurring within 90 days after CCTA was documented. The endpoint was major adverse cardiovascular events (MACE), as a composite of all-cause death, nonfatal myocardial infarction, and unplanned revascularization. Outcomes were analyzed using Cox proportional hazards models, while the relationship between FFRCT and MACE was examined using restricted cubic spline analysis (RCS). Results: This analysis included 1515 patients with borderline FFRCT values, comprising 503 (33.2%) with diabetes. Over a median follow-up of 985 days, 117 MACE occurred. Multivariate analysis showed that revascularization was independently associated with a reduced risk of the endpoint, a protective effect consistent in both non-diabetic (adjusted HR [aHR] 0.53, 95% CI 0.29–0.96; p = 0.036) and diabetic patients (aHR 0.25, 95% CI 0.09–0.71; p = 0.009). RCS revealed a significant non-linear relationship between FFRCT and MACE in non-diabetic patients (p = 0.002). Conclusions: In patients with borderline FFRCT, revascularization was linked to a lower incidence of MACE, and this association was consistent regardless of diabetes status.
1. Introduction
Diabetes mellitus (DM) is a well-established risk factor for major adverse cardiovascular events (MACE) [1], as highlighted in both AHA/ASA and ESC guidelines [2,3]. Appropriate coronary artery disease (CAD) risk stratification and multifactorial risk management are essential for cardiovascular prevention in DM [4]. Coronary CT angiography (CCTA) has become the first-line diagnostic tool for CAD, providing a comprehensive evaluation of both anatomic and functional severity [5]. Computed tomography-derived fractional flow reserve (FFRCT) is a noninvasive method for assessing hemodynamically significant coronary stenosis based on CCTA [6]. This innovative technique assists in guiding optimal treatment strategies and reducing unnecessary invasive procedures [7,8]. Current guidelines and expert consensus suggest that FFRCT values >0.80 generally exclude flow-limiting disease and justify conservative management, whereas values <0.70 indicate hemodynamically significant stenosis that warrants revascularization [9,10]. Borderline FFRCT values (0.70–0.80) pose diagnostic and management challenges, with interpretation and treatment strategies remaining ambiguous [11,12]. In diabetic patients, this diagnostic uncertainty is further complicated by the interplay between coronary pathophysiology and metabolic dysregulation, potentially influencing outcomes.
In a prespecified post hoc analysis of the prospective PREVENT trial, preventive percutaneous coronary intervention (PCI) for non-flow-limiting vulnerable plaques (fractional flow reserve >0.80) reduced the primary endpoint at 2 years compared with optimal medical therapy (OMT) alone, with no significant difference between diabetic and non-diabetic patients [13]. Expanding on the role of FFRCT in diabetes, it is important to recognize that CAD in this population often involves more diffuse atherosclerosis, microvascular dysfunction, and endothelial abnormalities. These factors can alter the relationship between anatomical stenosis and its functional significance, making functional assessments such as FFRCT particularly valuable. Evidence indicates that FFRCT serves as an independent predictor of MACE in diabetic patients, offering additive prognostic value beyond conventional clinical and imaging parameters. However, its predictive accuracy diminishes when FFRCT values fall within the intermediate range of 0.70–0.80 [10,14]. Current evidence is insufficient to determine how diabetes mellitus affects management and outcomes in patients with borderline FFRCT values. Therefore, this study aimed to evaluate how diabetes influences clinical decision pathways in patients with borderline FFRCT values, particularly the utilization of invasive angiography and revascularization, and to assess its impact on long-term outcomes, focusing on the risk stratification potential of borderline FFRCT values for predicting cardiovascular events.
2. Methods
2.1. Patients Population
The study flowchart is shown in Figure 1. Briefly, symptomatic patients with suspected CAD were enrolled from three tertiary hospitals in China between June 2021 and May 2023. All patients first underwent CCTA, which demonstrated at least one coronary lesion in a major vessel (left main coronary artery, left anterior descending artery, left circumflex artery, or right coronary artery). Among these, patients were included for further analysis if clinically indicated FFRCT revealed values between 0.70 and 0.80 in the affected vessel. Referral for FFRCT was determined by factors such as the clinical likelihood of ischemia, resource availability, local expertise, patient characteristics, and patient preference [15]. Patients were excluded for the following reasons: poor image quality or failure of FFRCT analysis, a history of coronary revascularization (PCI or coronary artery bypass grafting [CABG]) prior to CCTA, anomalous coronary artery origin or coronary artery fistula, previous cardiac transplantation or valvular surgery, or loss to follow-up. Baseline demographic characteristics, cardiovascular risk factors, and relevant laboratory data (including fasting blood glucose and HbA1c) were collected. DM was diagnosed based on any of the following criteria: a documented history of diabetes in the medical records, an HbA1c level of ≥6.5% at admission, or current use of antidiabetic medication [16]. However, relevant biochemical test results were not available for all participants. The proportion of missing data was reported. A sensitivity analysis was conducted in the cohort with complete data to assess robustness. This retrospective study was approved by the institutional review boards of all participating centers. The requirement for written informed consent was waived in accordance with the Declaration of Helsinki.
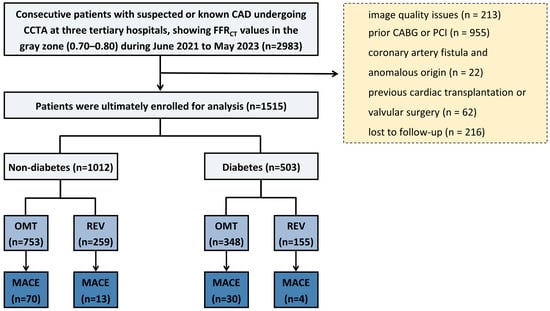
Figure 1.
Flowchart. CAD = coronary artery disease; CCTA = coronary computed tomography angiography; FFRCT = coronary CT angiography-derived fractional flow reserve; PCI = percutaneous coronary intervention; CABG = coronary artery bypass grafting; OMT = optimal medical therapy; REV = revascularization; MACE = major adverse cardiovascular events.
2.2. CCTA Acquisition
Details of the CCTA protocols are provided in the Supplemental Methods. Image quality was assessed on a per-patient basis using a 5-point scale, as previously described [17]. Patients with image quality scores of 1 or 2 were excluded. CT images were initially interpreted by local investigators at each participating center according to the Coronary Artery Disease Reporting and Data System (CAD-RADS) version 2.0 [18] and subsequently reviewed by senior readers. The coronary artery calcium score (CACS) was calculated from baseline noncontrast CT scans using the Agatston method [19] and categorized as 0 (none), 1–100 (mild), 101–300 (moderate), or >300 (severe), in line with current guidelines and expert consensus [20].
2.3. FFRCT Analysis
FFRCT values were computationally derived from standard CCTA images using an on-site, machine learning-based approach. All major epicardial coronary arteries with a lumen diameter ≥2.5 mm were included in the analysis. The assessments were performed on the DEEPVESSEL FFR workstation (Keya Medical Technology Co., Ltd., Beijing, China), an artificial intelligence (AI) platform that applies validated algorithms to simulate FFR values directly from CCTA data, as previously described [21]. DEEPVESSEL FFR has received 510 (k) clearance from the U.S. Food and Drug Administration, and prior studies have confirmed its diagnostic accuracy [22]. FFRCT values were recorded for each coronary vessel. In cases involving multiple stenoses, the FFRCT value distal to the most severe lesion was used. Lesion-specific FFRCT was defined as the simulated FFR value measured 20 mm distal to the lesion of interest. For per-patient analysis, the lowest FFRCT value among all vessels was selected for prognostic evaluation.
2.4. Management Strategy and Clinical Endpoints
The post-CCTA treatment strategy was determined at the discretion of the referring physician, who had access to the CCTA findings, FFRCT results, and other relevant clinical information. The index treatment strategies in real-world practice, including invasive coronary angiography (ICA), revascularization (PCI or CABG), and OMT within 90 days, were recorded. The primary endpoint was MACE, defined as a composite of all-cause mortality, nonfatal myocardial infarction (MI), and unplanned coronary revascularization [23]. The secondary endpoint was a composite of all-cause mortality and nonfatal MI. Nonfatal MI was diagnosed by a characteristic rise and/or fall in cardiac biomarkers (preferably troponin) above the 99th percentile upper reference limit, plus at least one of the following: ischemic symptoms, new ECG changes (pathological Q waves or ST elevation), or angiographic evidence of CAD [24]. Unplanned revascularization was defined as PCI or CABG that met both of the following criteria: (1) the procedure was unscheduled, meaning it was neither performed as part of routine care during the initial procedure nor preplanned within 90 days (or per institutional standards); and (2) it was ischemia-driven, prompted by objective clinical evidence of ischemia such as hospitalization for recurrent angina or documented ischemic changes on ECG or noninvasive imaging, ultimately leading to revascularization [23,25]. Patient follow-up was performed through telephone interviews and review of medical records. The primary endpoint was the composite outcome, with time to event defined as the period from baseline CCTA to the first qualifying event. All potential endpoint events identified during follow-up were independently adjudicated by a dedicated clinical events committee. The committee members, blinded to treatment allocation, reviewed all relevant source documentation against pre-specified, standardized criteria to confirm both the occurrence and classification of each event. Patients without an endpoint event were censored at the date of their last follow-up contact.
2.5. Statistical Analysis
Continuous variables were expressed as mean ± standard deviation or median with interquartile range (IQR), depending on the normality of distribution. Categorical variables were presented as counts with corresponding percentages. The Kolmogorov–Smirnov test was used to assess the normality of continuous variables. Differences between groups were analyzed using independent t-tests for normally distributed data and the Mann–Whitney U test for non-normally distributed data. Pearson’s chi-square test was applied for categorical variables. A one-way analysis of variance (ANOVA) was used to compare ICA stenosis severity across the four groups stratified by diabetes mellitus status and revascularization. Post hoc pairwise comparisons between groups were conducted, and mean differences with their 95% confidence intervals (CIs) were reported. For outcome analysis, cumulative event incidence was estimated using the log-rank test. Univariable and multivariable Cox proportional hazards models were used to estimate hazard ratios (HRs) with 95% CIs. Variables with p ≤ 0.10 in univariate analysis were included in the multivariate model. FFRCT values were multiplied by 100 for clearer clinical and statistical interpretation. The nonlinear relationship between FFRCT value and MACE was evaluated separately in diabetic and non-diabetic groups using restricted cubic splines (RCS). Subgroup analyses were conducted according to stenosis severity (CAD-RADS 2.0), CACS (<300 vs. ≥300), and CT-FFR values (≤0.75 vs. >0.75), based on thresholds established in previous studies [18,20]. To mitigate selection bias arising from the non-randomized, clinician-driven decision for revascularization, we performed a propensity score matching (PSM) analysis. Propensity scores were estimated using a multivariable logistic regression model that incorporated all available baseline characteristics. A 1:2 nearest-neighbor matching algorithm was employed with a caliper width set to 0.25 standard deviations of the logit of the propensity score. Covariate balance between the revascularized and non-revascularized groups before and after matching was rigorously assessed using standardized mean differences (SMDs), where an absolute SMD < 0.1 was considered indicative of satisfactory balance. Comparative analyses of clinical outcomes were subsequently conducted on the matched cohort. To test the robustness of our findings against the potential influence of very early events, we performed a sensitivity analysis by excluding all patients who experienced an unplanned revascularization within 30 days of the initial procedure. A two-sided p-value < 0.05 was considered statistically significant. All analyses were performed using R version 4.1.0.
3. Results
3.1. Study Population and Baseline Characteristics
Of the initial 2983 enrolled patients, 1468 were excluded due to poor image quality (n = 213), prior CABG or PCI (n = 955), coronary artery fistula or anomalous origin (n = 22), previous cardiac transplantation or valvular surgery (n = 62), and loss to follow-up (n = 216). The final analysis included 1515 patients with FFRCT values in the gray zone (0.70–0.80), comprising 503 (33.2%) diabetic and 1012 (66.8%) non-diabetic individuals (Figure 1). As shown in Table 1, diabetic patients were significantly older (63 ± 9 vs. 62 ± 10 years, p = 0.009), with lower male predominance (64.2% vs. 69.6%, p = 0.036) and a higher prevalence of hypertension (70.4% vs. 58.5%, p < 0.001), hyperlipidemia (69.0% vs. 61.6%, p = 0.005), and family history of cardiovascular disease (36.0% vs. 27.4%, p < 0.001). Metabolic assessment showed substantially higher fasting glucose and HbA1c levels in diabetic patients (both p < 0.001). Imaging parameters demonstrated higher CACS in diabetics (534 [IQR: 171–1099] vs. 298 [IQR: 82–790] Agatston units, p < 0.001) and marginally lower FFRct values (0.758 ± 0.026 vs. 0.762 ± 0.024, p = 0.016). No significant differences were observed in smoking status, follow-up duration, vessel distribution, or CAD-RADS classification (all p > 0.05).

Table 1.
Baseline characteristics according to diabetes status.
3.2. Interventional Management Stratified by Diabetes
The heatmap visualization (Figure S1) revealed distinct clinical management patterns between study groups. Among the total cohort, 235 diabetic patients (15.5%) underwent ICA, whereas 268 (17.6%) were managed conservatively. Revascularization procedures were performed in 155 diabetic individuals (10.2%), while 348 (23.0%) received OMT alone. Comparative analyses of participants stratified by diabetes and revascularization status are presented in Table S1. Both diabetic and non-diabetic revascularized groups exhibited markedly higher CAD-RADS 4 prevalence and significantly lower FFRCT values compared with medically managed groups (all p < 0.001). Diabetic patients had a significantly higher prevalence of ICA (46.7% vs. 40.7%, p = 0.026) and revascularization (30.8% vs. 25.6%, p = 0.032) compared with non-diabetic patients (Figure 2).
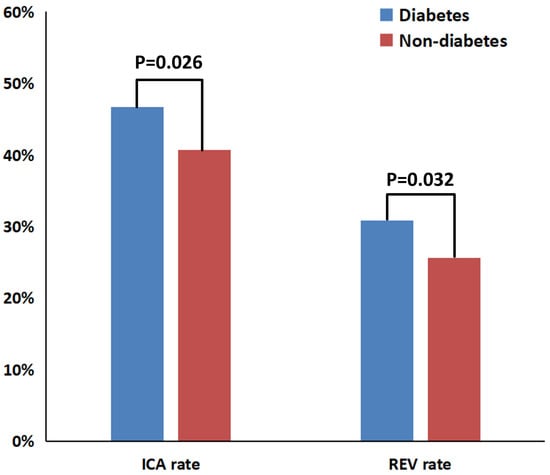
Figure 2.
Bar chart comparing ICA and revascularization rates between diabetic and non-diabetic groups. ICA = invasive coronary angiography; REV = revascularization.
Figure S2 details ICA stenosis rates among the four subgroups stratified by diabetes and revascularization status. One-way ANOVA showed significant overall differences (p < 0.001). Post hoc pairwise comparisons indicated that revascularization was associated with significantly higher stenosis rates in both non-diabetic (mean difference: −20.66, 95% CI: −23.91 to −17.41; p < 0.001) and diabetic patients (mean difference: −20.61, 95% CI: −24.98 to −16.24; p < 0.001). In contrast, diabetes status itself did not significantly affect stenosis rates, regardless of revascularization status (all p > 0.05).
3.3. Study Outcomes
During a median follow-up of 985 days (IQR: 504–1147), MACE occurred in 117 patients (5.9%), including unplanned revascularization in 89 (5.9%), all-cause death in 27 (1.8%), and non-fatal MI in 10 (0.7%). There were eight instances of unplanned revascularization following non-fatal MI, and one case of death following unplanned revascularization. Comparative analysis of outcomes by diabetes status is shown in Table 2. Revascularization was consistently associated with a significantly lower risk of MACE compared with OMT alone, both in non-diabetic (5.0% vs. 9.3%, p = 0.030) and diabetic patients (2.6% vs. 8.6%, p = 0.013). This benefit was primarily due to a marked reduction in unplanned revascularization procedures within the revascularization groups, evident in both non-diabetic (3.1% vs. 6.9%, p = 0.025) and diabetic patients (1.3% vs. 7.8%, p = 0.004). However, the risks of all-cause death, non-fatal MI, and the composite secondary outcome did not differ significantly between revascularization and OMT strategies.
Table 2.
Comparative analysis of clinical outcomes based on diabetes status.
Cox proportional hazards analysis for MACE by diabetes status is presented in Table 3. After multivariate adjustment for potential confounders, revascularization remained independently associated with a significantly reduced risk of the primary endpoint. This protective effect persisted in both non-diabetic (adjusted HR 0.53, 95% CI 0.29–0.96; p = 0.036) and diabetic patients (aHR 0.25, 95% CI 0.09–0.71; p = 0.009). In the diabetic cohort, lower FFRCT values were independently associated with an increased risk of MACE (aHR 0.87, 95% CI 0.77–0.99; p = 0.031). No other variables independently predicted outcomes. Kaplan–Meier curves for the primary endpoint, stratified by revascularization status, are presented separately for non-diabetic and diabetic cohorts in Figure 3. The log-rank test indicated significantly higher event-free survival among revascularized patients, both in the non-diabetic (p = 0.025) and diabetic cohorts (p = 0.017). Cause-specific survival analysis for hard events is now presented in Figure S3, which shows no significant difference between revascularized and non-revascularized patients in either cohort (all p > 0.05). In contrast, revascularized patients showed significantly lower rates of unplanned revascularization in both the diabetic (p = 0.006) and non-diabetic (p = 0.021) cohorts.
Table 3.
Revascularization vs. medical therapy for MACE in gray-zone FFRCT: a Cox regression analysis stratified by diabetes.
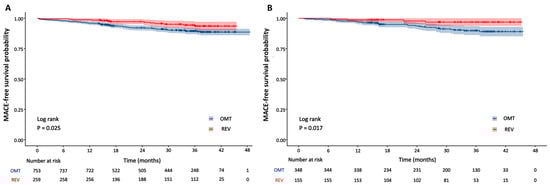
Figure 3.
Kaplan–Meier curves for MACE by revascularization status in non-diabetic and diabetic groups. (A) Non-diabetic group; (B) diabetic group. OMT = optimal medical therapy; REV = revascularization.
3.4. Exploration of Association Shape and Effect Consistency
Restricted cubic spline analysis revealed a significant non-linear relationship between FFRCT values and MACE hazard in non-diabetic patients (p for non-linearity = 0.002) (Figure S4). The fitted curve displayed a distinct inverted U-shape, with the HR equal to 1 at an FFRCT value of 0.77. In contrast, no significant non-linear association was detected in diabetic patients (p for non-linearity = 0.147).
Subgroup analyses stratified by CACS, CAD-RADS, and FFRCT thresholds (≤0.75) within diabetic and non-diabetic cohorts revealed no significant interaction effects (all p for interaction > 0.05) (Figure 4). Among non-diabetic patients, revascularization was associated with a significantly lower MACE risk in those with FFRCT ≤ 0.75 (HR 0.42, 95% CI 0.19–0.93; p = 0.033). In diabetic patients, a significant treatment benefit was observed only in the subgroup with CACS ≥ 300 (HR 0.09, 95% CI 0.01–0.64; p = 0.017), with no significant risk reduction in other subgroups (all p > 0.05). A 1:2 PSM analysis, incorporating all baseline characteristics, was conducted to address potential confounding. This yielded a well-balanced matched cohort of 388 revascularized and 587 conservatively managed patients. Covariate balance was excellent post-matching (Figure S5). In this matched cohort, revascularization remained associated with a significantly lower risk of the MACE compared to conservative management (p = 0.001) (Figure S6). After excluding four patients who underwent unplanned revascularization within 30 days, Kaplan–Meier analysis showed that the association between revascularization and reduced risk of the primary composite endpoint remained significant (p = 0.017) (Figure S7).

Figure 4.
Forest plot showing subgroup analyses of the association between revascularization and MACE. (A) Non-diabetic group; (B) diabetic group. OMT = optimal medical therapy; REV = revascularization; HR = hazard ratio; CACS = coronary artery calcium score; FFRCT = coronary CT angiography-derived fractional flow reserve; CAD-RADS = coronary artery disease reporting and data system.
Sensitivity analysis was conducted in a subgroup of 569 (37.6%) patients with complete fasting glucose and HbA1c data to confirm the robustness of the primary findings (Table S2). Consistent with the main analysis, revascularization remained a significant independent predictor of improved MACE outcomes, irrespective of diabetes status. Among non-diabetic patients, revascularization was associated with a 67% risk reduction (aHR 0.33, 95% CI 0.12–0.91; p = 0.032), while diabetic patients experienced an even greater 74% reduction (aHR 0.26, 95% CI 0.07–0.89; p = 0.032).
4. Discussion
This study investigated the impact of diabetes on treatment strategies and clinical outcomes in patients with borderline FFRCT values. The findings revealed that: first, within this gray-zone range, diabetic patients underwent significantly more interventional strategies (including ICA examination and revascularization) after CCTA than non-diabetic patients; second, after multivariable adjustment, revascularization was significantly associated with a reduced risk of MACE, a benefit primarily driven by a decrease in unplanned revascularizations, with no significant association observed for hard endpoints; and finally, Cox multivariable analysis demonstrated that FFRCT value served as an independent predictor of MACE in the diabetic population, whereas a nonlinear relationship was observed between FFRCT values and MACE in non-diabetic patients.
Diabetic patients underwent significantly more revascularization procedures in our study, consistent with current guideline recommendations and the long-term outcomes of the FREEDOM trial, which support more aggressive intervention in this high-risk population [26]. Regarding clinical outcomes, the elevated risk of adverse events in diabetic patients is closely linked to vulnerable plaque characteristics [27]. The COMBINE OCT-FFR trial demonstrated that even in the absence of flow limitation, the presence of OCT-detected thin-cap fibroatheroma significantly increased event risk in diabetic patients [28]. The PREVENT trial further indicated that for such non-flow-limiting vulnerable plaques, preventive PCI improved 2-year clinical outcomes regardless of diabetes status [13]. However, existing evidence primarily focuses on patients with either ischemic or nonischemic conditions, leaving the FFRCT gray-zone population relatively understudied. Our analysis of this specific cohort indicates that, irrespective of diabetes status, the benefits of revascularization appear to be primarily associated with reductions in ischemic symptoms and unplanned interventions, while showing limited association with hard endpoints. The findings from our study are intended to inform future efforts toward developing more precise risk stratification and personalized treatment approaches for patients within this gray zone.
Restricted cubic spline analysis suggested that diabetes status may influence the relationship pattern between FFRCT and MACE. A nonlinear relationship was observed in non-diabetic patients, whereas diabetic patients showed a trend of progressively increasing myocardial ischemia risk with declining FFRCT values, which may be related to their predisposition to diffuse coronary disease and potential microvascular dysfunction [29]. The RCS analysis revealed an inverted U-shaped relationship between FFRCT and MACE in non-diabetic patients. This pattern suggests that this intermediate-risk subgroup may face elevated risk due to clinical ambiguity leading to potential undertreatment, despite possibly having substantial plaque vulnerability or burden. Although revascularization benefits showed no significant interaction between subgroups, the optimal predictors appeared to differ: FFRCT ≤ 0.75 might provide better predictive value in non-diabetic patients, whereas a coronary artery calcium score ≥ 300 could better identify high-risk patients in the diabetic population. These findings suggest that risk assessment in diabetic patients may need to consider overall atherosclerotic burden more comprehensively.
Several limitations should be considered when interpreting our findings. First, the retrospective design may introduce residual confounding and therefore requires validation in prospective studies. Second, detailed information on diabetes characteristics, including disease duration, classification, and glucose-lowering regimens, was not systematically collected, which may have affected outcome assessment. Given that the study was primarily designed to evaluate the fundamental association between diabetes status and outcomes among patients with borderline FFRCT, not the effects of specific subtypes or treatments such as disease duration, classification, or glucose-lowering regimens, it is acknowledged that this may have affected the outcome assessment. Third, the low incidence of hard endpoints may be explained by the predominance of chronic coronary syndrome in our population, potentially resulting from adequate risk factor control and frequent revascularization. Finally, our analysis did not include comprehensive plaque assessment, such as quantitative or qualitative morphological evaluation or perivascular adipose tissue analysis. Future prospective studies should incorporate these advanced plaque characteristics, potentially using artificial intelligence-assisted plaque analysis tools to enhance reproducibility and analytical efficiency.
5. Conclusions
Diabetic patients with borderline FFRCT values demonstrated higher rates of invasive management, in whom FFRCT further served as an independent predictor of MACE. Furthermore, while revascularization was associated with reduced MACE risk primarily through decreased unplanned revascularizations, this benefit did not extend to hard endpoints in the overall patient population, regardless of diabetes status.
Supplementary Materials
The following supporting information can be downloaded at: https://www.mdpi.com/article/10.3390/jcdd13010011/s1, Figure S1: Interventional strategy distributions in diabetic and non-diabetic patients: a dual heatmap visualization; Figure S2: Comparison of ICA stenosis rates among patient groups stratified by diabetes and revascularization status; Figure S3: Kaplan-Meier curves for cause-specific survival analysis in diabetic and non-diabetic cohorts; Figure S4: Restricted cubic spline plots showing the association between FFRCT values and MACE hazard, stratified by diabetes status; Figure S5: Covariate Balance Pre- and Post-Propensity Score Matching (SMD < 0.25 Threshold); Figure S6: Kaplan-Meier curves for the MACE in the propensity score-matched cohort; Figure S7: Sensitivity analysis excluding patients with unplanned revascularization within 30 days; Table S1: Baseline characteristics of participants stratified by diabetes and revascularization status; Table S2: Multivariable Cox regression analysis for MACE in the sensitivity analysis subgroup with complete glycemic data; Supplemental Methods.
Author Contributions
Methodology, Z.Z.; Formal analysis, W.J.; Resources, Z.F. and H.H.; Data curation, Z.H. and H.L.; Writing—original draft, Y.C.; Writing—review and editing, L.X.; Visualization, X.M. All authors have read and agreed to the published version of the manuscript.
Funding
This study was supported by grants from the National Key R&D Program of China (2022YFE0209800), the National Natural Science Foundation of China (82271986, 82402256, U1908211), the Beijing Natural Science Foundation (L246062), the Beijing Research Ward Excellence Program (BRWEP2024W012060100), the Beijing Anzhen Hospital High Level Research Funding (2024AZC2002).
Institutional Review Board Statement
This study was approved by the Ethics Committee of Beijing Anzhen Hospital, Capital Medical University (Approval No. KS2025054) on 8 March 2025.
Informed Consent Statement
The authors confirm that patient consent is not applicable to this article. This is a retrospective case report using de-identified data; therefore, the IRB did not require consent from the patient.
Data Availability Statement
The datasets used and/or analyzed during the current study are available from the corresponding author on reasonable request.
Conflicts of Interest
The authors declare no conflicts of interest.
Abbreviations
| DM | diabetes mellitus |
| CAD | coronary artery disease |
| FFRCT | CT-derived fractional flow reserve |
| CCTA | coronary CT angiography |
| ICA | invasive coronary angiography |
| PCI | percutaneous coronary intervention |
| OMT | optimal medical therapy |
| REV | revascularization |
| CABG | coronary artery bypass grafting |
| CAD-RADS | Coronary Artery Disease Reporting and Data System |
| CACS | coronary artery calcium score |
| MACE | major adverse cardiovascular event |
References
- Rawshani, A.; Rawshani, A.; Gudbjörnsdottir, S. Mortality and Cardiovascular Disease in Type 1 and Type 2 Diabetes. N. Engl. J. Med. 2017, 377, 300–301. [Google Scholar] [CrossRef]
- Marx, N.; Federici, M.; Schütt, K.; Müller-Wieland, D.; Ajjan, R.A.; Antunes, M.J.; Christodorescu, R.M.; Crawford, C.; Di Angelantonio, E.; Eliasson, B.; et al. 2023 ESC guidelines for the management of cardiovascular disease in patients with diabetes: Developed by the task force on the management of cardiovascular disease in patients with diabetes of the European Society of Cardiology (ESC). Eur. Heart J. 2023, 44, 4043–4140. [Google Scholar] [CrossRef]
- Arnold, S.V.; Bhatt, D.L.; Barsness, G.W.; Beatty, A.L.; Deedwania, P.C.; Inzucchi, S.E.; Kosiborod, M.; Leiter, L.A.; Lipska, K.J.; Newman, J.D.; et al. Clinical management of stable coronary artery disease in patients with type 2 diabetes mellitus: A scientific statement from the American Heart Association. Circulation 2020, 141, e779–e806. [Google Scholar] [CrossRef]
- Wong, N.D.; Sattar, N. Cardiovascular risk in diabetes mellitus: Epidemiology, assessment and prevention. Nat. Rev. Cardiol. 2023, 20, 685–695. [Google Scholar] [CrossRef] [PubMed]
- Vrints, C.; Andreotti, F.; Koskinas, K.C.; Rossello, X.; Adamo, M.; Ainslie, J.; Banning, A.P.; Budaj, A.; Buechel, R.R.; Chiariello, G.A. Correction to: 2024 ESCGuidelines for the management of chronic coronary syndromes: Developed by the task force for the management of chronic coronary syndromes of the European Society of Cardiology (ESC) Endorsed by the European Association for Cardio-Thoracic Surgery (EACTS). Eur. Heart J. 2025, 46, 1565. [Google Scholar]
- Tu, S.; Westra, J.; Adjedj, J.; Ding, D.; Liang, F.; Xu, B.; Holm, N.R.; Reiber, J.H.C.; Wijns, W. Fractional flow reserve in clinical practice: From wire-based invasive measurement to image-based computation. Eur. Heart J. 2020, 41, 3271–3279. [Google Scholar] [CrossRef] [PubMed]
- Fairbairn, T.A.; Nieman, K.; Akasaka, T.; Norgaard, B.L.; Berman, D.S.; Raff, G.; Hurwitz-Koweek, L.M.; Pontone, G.; Kawasaki, T.; Sand, N.P.; et al. Real-world clinical utility and impact on clinical decision-making of coronary computed tomography angiography-derived fractional flow reserve:lessons from the ADVANCE Registry. Eur. Heart J. 2018, 39, 3701–3711. [Google Scholar] [CrossRef] [PubMed]
- Nørgaard, B.L.; Terkelsen, C.J.; Mathiassen, O.N.; Grove, E.L.; Bøtker, H.E.; Parner, E.; Leipsic, J.; Steffensen, F.H.; Riis, A.H.; Pedersen, K.; et al. Coronary CT Angiographic and Flow Reserve-Guided Management of Patients With Stable Ischemic Heart Disease. J. Am. Coll. Cardiol. 2018, 72, 2123–2134. [Google Scholar] [CrossRef]
- Gulati, M.; Levy, P.D.; Mukherjee, D.; Amsterdam, E.; Bhatt, D.L.; Birtcher, K.K.; Blankstein, R.; Boyd, J.; Bullock-Palmer, R.P.; Conejo, T.; et al. 2021 AHA/ACC/ASE/CHEST/SAEM/SCCT/SCMR Guideline for the Evaluation and Diagnosis of Chest Pain: A Report of the American College of Cardiology/American Heart Association Joint Committee on Clinical Practice Guidelines. Circulation 2021, 144, e368–e454. [Google Scholar]
- Zhang, L.J.; Tang, C.; Xu, P.; Guo, B.; Zhou, F.; Xue, Y.; Zhang, J.; Zheng, M.; Xu, L.; Hou, Y.; et al. Coronary Computed Tomography Angiography-derived Fractional Flow Reserve: An Expert Consensus Document of Chinese Society of Radiology. J. Thorac. Imaging 2022, 37, 385–400. [Google Scholar] [CrossRef]
- Cook, C.M.; Petraco, R.; Shun-Shin, M.J.; Ahmad, Y.; Nijjer, S.; Al-Lamee, R.; Kikuta, Y.; Shiono, Y.; Mayet, J.; Francis, D.P.; et al. Diagnostic Accuracy of Computed Tomography-Derived Fractional Flow Reserve: A Systematic Review. JAMA Cardiol. 2017, 2, 803–810. [Google Scholar] [CrossRef] [PubMed]
- Narula, J.; Chandrashekhar, Y.; Ahmadi, A.; Abbara, S.; Berman, D.S.; Blankstein, R.; Leipsic, J.; Newby, D.; Nicol, E.D.; Nieman, K.; et al. SCCT 2021 Expert Consensus Document on Coronary Computed Tomographic Angiography: A Report of the Society of Cardiovascular Computed Tomography. J. Cardiovasc. Comput. Tomogr. 2021, 15, 192–217. [Google Scholar] [CrossRef]
- Kim, M.C.; Park, S.J.; Park, D.W.; Ahn, J.-M.; Kang, D.-Y.; Kim, W.-J.; Nam, C.-W.; Jeong, J.-O.; Chae, I.-H.; Shiomi, H.; et al. Preventive percutaneous coronary intervention for non-flow-limiting vulnerable atherosclerotic coronary plaques in diabetes: The PREVENT trial. Eur. Heart J. 2025, 46, 3181–3197. [Google Scholar] [CrossRef]
- Lan, Z.; Ding, X.; Yu, Y.; Yu, L.; Yang, W.; Dai, X.; Ling, R.; Wang, Y.; Yang, W.; Zhang, J. CT-derived fractional flow reserve for prediction of major adverse cardiovascular events in diabetic patients. Cardiovasc. Diabetol. 2023, 22, 65. [Google Scholar] [CrossRef]
- Knuuti, J.; Wijns, W.; Saraste, A.; Capodanno, D.; Barbato, E.; Funck-Brentano, C.; Prescott, E.; Storey, R.F.; Deaton, C.; Cuisset, T.; et al. 2019 ESC Guidelines for the diagnosis and management of chronic coronary syndromes. Eur. Heart J. 2020, 41, 407–477. [Google Scholar] [CrossRef]
- American Diabetes Association Professional Practice Committee. 2. Classification and Diagnosis of Diabetes: Standards of Medical Care in Diabetes-2022. Diabetes Care 2022, 45, S17–S38. [Google Scholar] [CrossRef]
- Earls, J.P.; Berman, E.L.; Urban, B.A.; Curry, C.A.; Lane, J.L.; Jennings, R.S.; McCulloch, C.C.; Hsieh, J.; Londt, J.H. Prospectively gated transverse coronary CT angiography versus retrospectively gated helical technique: Improved image quality and reduced radiation dose. Radiology 2008, 246, 742–753. [Google Scholar] [CrossRef]
- Cury, R.C.; Leipsic, J.; Abbara, S.; Achenbach, S.; Berman, D.; Bittencourt, M.; Budoff, M.; Chinnaiyan, K.; Choi, A.D.; Ghoshhajra, B.; et al. CAD-RADS™ 2.0—2022 Coronary Artery Disease-Reporting and Data System: An Expert Consensus Document of the Society of Cardiovascular Computed Tomography (SCCT), the American College of Cardiology (ACC), the American College of Radiology (ACR), and the North America Society of Cardiovascular Imaging (NASCI). J. Cardiovasc. Comput. Tomogr. 2022, 16, 536–557. [Google Scholar]
- Hecht, H.S.; Cronin, P.; Blaha, M.J.; Budoff, M.J.; Kazerooni, E.A.; Narula, J.; Yankelevitz, D.; Abbara, S. 2016 SCCT/STR guidelines for coronary artery calcium scoring of noncontrast noncardiac chest CT scans: A report of the Society of Cardiovascular Computed Tomography and Society of Thoracic Radiology. J. Cardiovasc. Comput. Tomogr. 2017, 11, 74–84. [Google Scholar] [CrossRef] [PubMed]
- Hecht, H.S.; Blaha, M.J.; Kazerooni, E.A.; Cury, R.C.; Budoff, M.; Leipsic, J.; Shaw, L. CAC-DRS: Coronary Artery Calcium Data and Reporting System. An expert consensus document of the Society of Cardiovascular Computed Tomography (SCCT). J. Cardiovasc. Comput. Tomogr. 2018, 12, 185–191. [Google Scholar] [CrossRef] [PubMed]
- Liu, X.; Mo, X.; Zhang, H.; Yang, G.; Shi, C.; Hau, W.K. A 2-year investigation of the impact of the computed tomography-derived fractional flow reserve calculated using a deep learning algorithm on routine decision-making for coronary artery disease management. Eur. Radiol. 2021, 31, 7039–7046. [Google Scholar] [CrossRef]
- Yang, J.; Shan, D.; Wang, X.; Sun, X.; Shao, M.; Wang, K.; Pan, Y.; Wang, Z.; Schoepf, U.J.; Savage, R.H.; et al. On-Site Computed Tomography-Derived Fractional Flow Reserve to Guide Management of Patients With Stable Coronary Artery Disease: The TARGET Randomized Trial. Circulation 2023, 147, 1369–1381. [Google Scholar] [CrossRef] [PubMed]
- Davies, J.E.; Sen, S.; Dehbi, H.M.; Al-Lamee, R.; Petraco, R.; Nijjer, S.S.; Bhindi, R.; Lehman, S.J.; Walters, D.; Sapontis, J.; et al. Use of the Instantaneous Wave-free Ratio or Fractional Flow Reserve in PCI. N. Engl. J. Med. 2017, 376, 1824–1834. [Google Scholar] [CrossRef] [PubMed]
- Thygesen, K.; Alpert, J.S.; Jaffe, A.S.; Chaitman, B.R.; Bax, J.J.; Morrow, D.A.; White, H.D.; Executive Group on behalf of the Joint European Society of Cardiology (ESC)/American College of Cardiology (ACC)/American Heart Association (AHA)/World Heart Federation (WHF) Task Force for the Universal Definition of Myocardial Infarction. Fourth Universal Definition of Myocardial Infarction (2018). J. Am. Coll. Cardiol. 2018, 72, 2231–2264. [Google Scholar] [CrossRef]
- Stähli, B.E.; Varbella, F.; Linke, A.; Schwarz, B.; Felix, S.B.; Seiffert, M.; Kesterke, R.; Nordbeck, P.; Witzenbichler, B.; Lang, I.M.; et al. Timing of Complete Revascularization with Multivessel PCI for Myocardial Infarction. N. Engl. J. Med. 2023, 389, 1368–1379. [Google Scholar] [CrossRef] [PubMed]
- Mentias, A.; Aminian, A.; Youssef, D.; Pandey, A.; Menon, V.; Cho, L.; Nissen, S.E.; Desai, M.Y. Long-Term Cardiovascular Outcomes After Bariatric Surgery in the Medicare Population. J. Am. Coll. Cardiol. 2022, 79, 1429–1437. [Google Scholar] [CrossRef]
- Fabris, E.; Berta, B.; Hommels, T.; Roleder, T.; Hermanides, R.S.; Rivero, F.; von Birgelen, C.; Escaned, J.; Camaro, C.; Kennedy, M.W.; et al. Long-term outcomes of patients with normal fractional flow reserve and thin-cap fibroatheroma. EuroIntervention 2023, 18, e1099–e1107. [Google Scholar] [CrossRef]
- Kedhi, E.; Berta, B.; Roleder, T.; Hermanides, R.S.; Fabris, E.; Ijsselmuiden, A.J.J.; Kauer, F.; Alfonso, F.; von Birgelen, C.; Escaned, J.; et al. Thin-cap fibroatheroma predicts clinical events in diabetic patients with normal fractional flow reserve: The COMBINE OCT-FFR trial. Eur. Heart J. 2021, 42, 4671–4679. [Google Scholar] [CrossRef]
- Nous, F.M.A.; Coenen, A.; Boersma, E.; Kim, Y.-H.; Kruk, M.B.; Tesche, C.; de Geer, J.; Yang, D.H.; Kepka, C.; Schoepf, U.J.; et al. Comparison of the Diagnostic Performance of Coronary Computed Tomography Angiography-Derived Fractional Flow Reserve in Patients With Versus Without Diabetes Mellitus (from the MACHINE Consortium). Am. J. Cardiol. 2019, 123, 537–543. [Google Scholar] [CrossRef]
Disclaimer/Publisher’s Note: The statements, opinions and data contained in all publications are solely those of the individual author(s) and contributor(s) and not of MDPI and/or the editor(s). MDPI and/or the editor(s) disclaim responsibility for any injury to people or property resulting from any ideas, methods, instructions or products referred to in the content. |
© 2025 by the authors. Licensee MDPI, Basel, Switzerland. This article is an open access article distributed under the terms and conditions of the Creative Commons Attribution (CC BY) license.